high-sensitivity coherent optical time domain reflectometry employing frequency-division...
TRANSCRIPT
JOURNAL OF LIGHTWAVE TECHNOLOGY, VOL. 30, NO. 8, APRIL 15, 2012 1121
High-Sensitivity Coherent Optical TimeDomain Reflectometry EmployingFrequency-Division Multiplexing
Hiroyuki Iida, Yusuke Koshikiya, Fumihiko Ito, Member, IEEE, and Kuniaki Tanaka
(Invited Paper)
Abstract—This paper proposes a novel parallel detectionscheme for enhancing the sensitivity of coherent optical timedomain reflectometry (C-OTDR). The proposed scheme is basedon frequency-division multiplexing using a phase modulatorand software processing. The performance advantages of theproposed method are clarified experimentally by comparison witha conventional C-OTDR. The detection sensitivity performancewith the proposed method, operating at 40 frequency-divisionmultiplexing, was improved by about 8 dB compared with the con-ventional method. We also clarified that the 3 dB resolution andRayleigh dead zone of conventional C-OTDR and the proposedmethod were almost the same at a spatial resolution of 1 km.
Index Terms—Coherent detection, dynamic range (DR), fre-quency-division multiplexing, optical time domain reflectometry(OTDR).
I. INTRODUCTION
O PTICAL time domain reflectometry (OTDR)[1]–[5] is awell-known technique for diagnosing optical fiber links.
In OTDR, probe pulses are launched into a test fiber, and thepower of the Rayleigh backscattering light induced in the opticalfiber is observed. The time it takes for the reflected light to re-turn is proportional to the location of the reflection, since OTDRcanmeasure fiber attenuation, and splice and connector loss, andcan locate broken point. The peak power of the probe pulse isreduced by fiber loss, so the power of the Rayleigh backscat-tering light generated by the probe pulse weakens when thefiber is long. The measurement range is limited by the launchedpulse peak power and the detection sensitivity of the OTDRsystem. Coherent OTDR (C-OTDR), which employs a coherentdetection technique to enhance detection sensitivity [6], is usedfor fault location and characterization in long-haul submarineoptical amplifier transmission lines [7]. However, its dynamicrange (DR) is sometimes insufficient, because the probe pulse
Manuscript received June 30, 2011; revised September 09, 2011; acceptedSeptember 16, 2011. Date of publication October 10, 2011; date of current ver-sion March 12, 2012.The authors are with the NTT Access Network Service Systems Labo-
ratories, Nippon Telegraph and Telephone Corporation, Ibaraki, 305-0805Japan (e-mail: [email protected]; [email protected];[email protected]; [email protected]).Color versions of one or more of the figures in this paper are available online
at http://ieeexplore.ieee.org.Digital Object Identifier 10.1109/JLT.2011.2170960
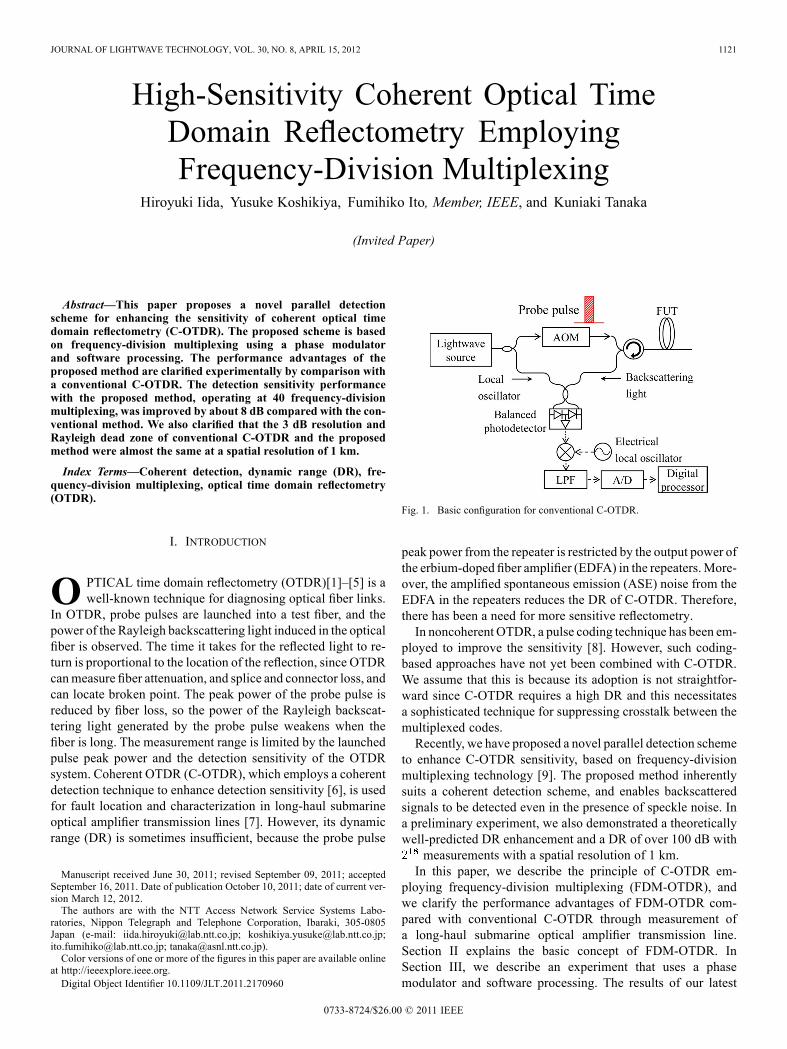
Fig. 1. Basic configuration for conventional C-OTDR.
peak power from the repeater is restricted by the output power ofthe erbium-doped fiber amplifier (EDFA) in the repeaters.More-over, the amplified spontaneous emission (ASE) noise from theEDFA in the repeaters reduces the DR of C-OTDR. Therefore,there has been a need for more sensitive reflectometry.In noncoherent OTDR, a pulse coding technique has been em-
ployed to improve the sensitivity [8]. However, such coding-based approaches have not yet been combined with C-OTDR.We assume that this is because its adoption is not straightfor-ward since C-OTDR requires a high DR and this necessitatesa sophisticated technique for suppressing crosstalk between themultiplexed codes.Recently, we have proposed a novel parallel detection scheme
to enhance C-OTDR sensitivity, based on frequency-divisionmultiplexing technology [9]. The proposed method inherentlysuits a coherent detection scheme, and enables backscatteredsignals to be detected even in the presence of speckle noise. Ina preliminary experiment, we also demonstrated a theoreticallywell-predicted DR enhancement and a DR of over 100 dB with
measurements with a spatial resolution of 1 km.In this paper, we describe the principle of C-OTDR em-
ploying frequency-division multiplexing (FDM-OTDR), andwe clarify the performance advantages of FDM-OTDR com-pared with conventional C-OTDR through measurement ofa long-haul submarine optical amplifier transmission line.Section II explains the basic concept of FDM-OTDR. InSection III, we describe an experiment that uses a phasemodulator and software processing. The results of our latest
0733-8724/$26.00 © 2011 IEEE
1122 JOURNAL OF LIGHTWAVE TECHNOLOGY, VOL. 30, NO. 8, APRIL 15, 2012
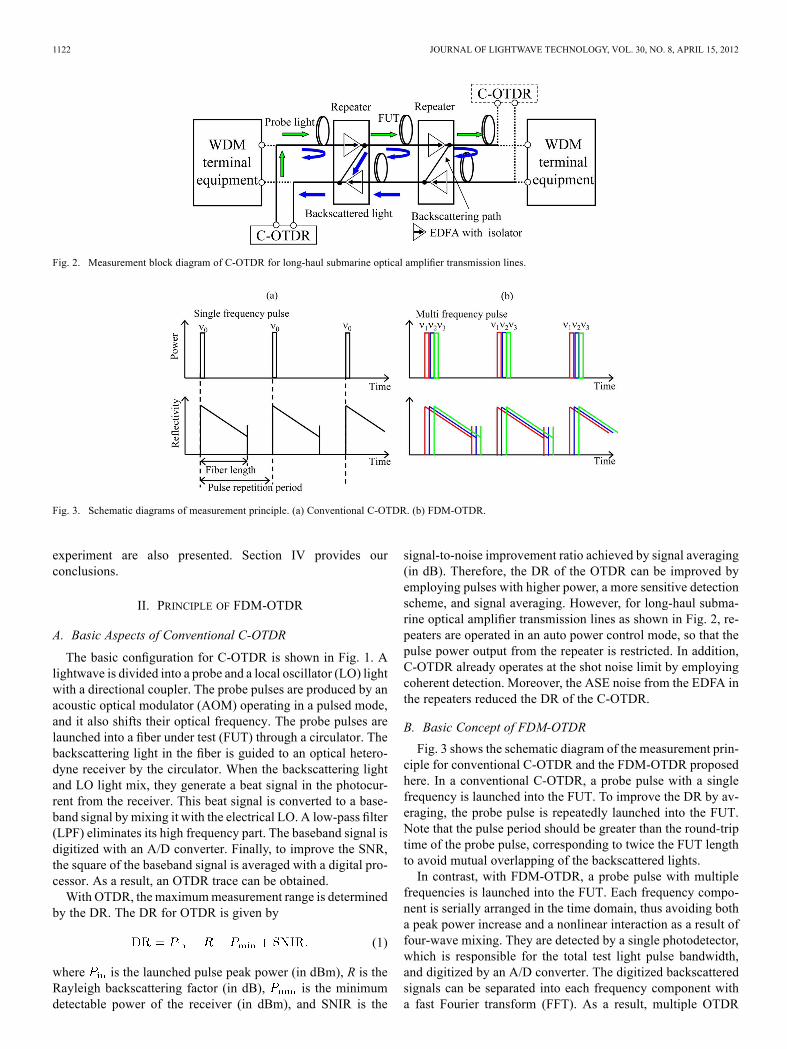
Fig. 2. Measurement block diagram of C-OTDR for long-haul submarine optical amplifier transmission lines.
Fig. 3. Schematic diagrams of measurement principle. (a) Conventional C-OTDR. (b) FDM-OTDR.
experiment are also presented. Section IV provides ourconclusions.
II. PRINCIPLE OF FDM-OTDR
A. Basic Aspects of Conventional C-OTDR
The basic configuration for C-OTDR is shown in Fig. 1. Alightwave is divided into a probe and a local oscillator (LO) lightwith a directional coupler. The probe pulses are produced by anacoustic optical modulator (AOM) operating in a pulsed mode,and it also shifts their optical frequency. The probe pulses arelaunched into a fiber under test (FUT) through a circulator. Thebackscattering light in the fiber is guided to an optical hetero-dyne receiver by the circulator. When the backscattering lightand LO light mix, they generate a beat signal in the photocur-rent from the receiver. This beat signal is converted to a base-band signal by mixing it with the electrical LO. A low-pass filter(LPF) eliminates its high frequency part. The baseband signal isdigitized with an A/D converter. Finally, to improve the SNR,the square of the baseband signal is averaged with a digital pro-cessor. As a result, an OTDR trace can be obtained.With OTDR, the maximummeasurement range is determined
by the DR. The DR for OTDR is given by
(1)
where is the launched pulse peak power (in dBm), R is theRayleigh backscattering factor (in dB), is the minimumdetectable power of the receiver (in dBm), and SNIR is the
signal-to-noise improvement ratio achieved by signal averaging(in dB). Therefore, the DR of the OTDR can be improved byemploying pulses with higher power, a more sensitive detectionscheme, and signal averaging. However, for long-haul subma-rine optical amplifier transmission lines as shown in Fig. 2, re-peaters are operated in an auto power control mode, so that thepulse power output from the repeater is restricted. In addition,C-OTDR already operates at the shot noise limit by employingcoherent detection. Moreover, the ASE noise from the EDFA inthe repeaters reduced the DR of the C-OTDR.
B. Basic Concept of FDM-OTDR
Fig. 3 shows the schematic diagram of the measurement prin-ciple for conventional C-OTDR and the FDM-OTDR proposedhere. In a conventional C-OTDR, a probe pulse with a singlefrequency is launched into the FUT. To improve the DR by av-eraging, the probe pulse is repeatedly launched into the FUT.Note that the pulse period should be greater than the round-triptime of the probe pulse, corresponding to twice the FUT lengthto avoid mutual overlapping of the backscattered lights.In contrast, with FDM-OTDR, a probe pulse with multiple
frequencies is launched into the FUT. Each frequency compo-nent is serially arranged in the time domain, thus avoiding botha peak power increase and a nonlinear interaction as a result offour-wave mixing. They are detected by a single photodetector,which is responsible for the total test light pulse bandwidth,and digitized by an A/D converter. The digitized backscatteredsignals can be separated into each frequency component witha fast Fourier transform (FFT). As a result, multiple OTDR
IIDA et al.: HIGH-SENSITIVITY COHERENT OPTICAL TIME DOMAIN REFLECTOMETRY 1123
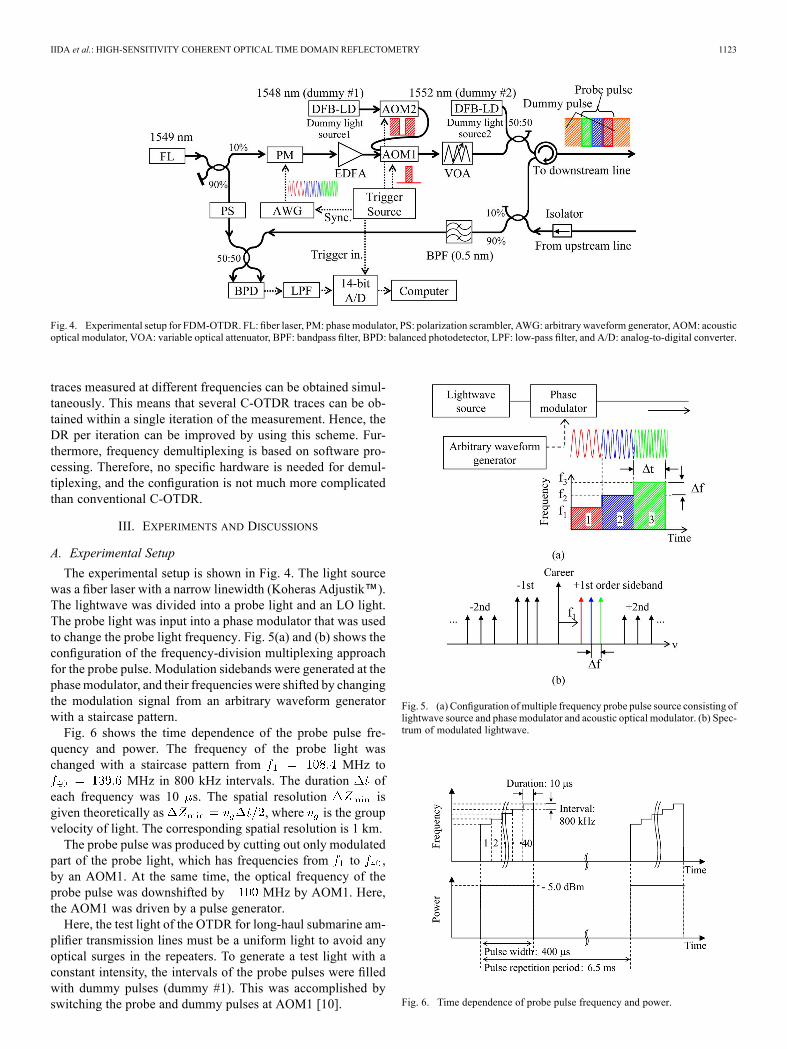
Fig. 4. Experimental setup for FDM-OTDR. FL: fiber laser, PM: phasemodulator, PS: polarization scrambler, AWG: arbitrary waveform generator, AOM: acousticoptical modulator, VOA: variable optical attenuator, BPF: bandpass filter, BPD: balanced photodetector, LPF: low-pass filter, and A/D: analog-to-digital converter.
traces measured at different frequencies can be obtained simul-taneously. This means that several C-OTDR traces can be ob-tained within a single iteration of the measurement. Hence, theDR per iteration can be improved by using this scheme. Fur-thermore, frequency demultiplexing is based on software pro-cessing. Therefore, no specific hardware is needed for demul-tiplexing, and the configuration is not much more complicatedthan conventional C-OTDR.
III. EXPERIMENTS AND DISCUSSIONS
A. Experimental Setup
The experimental setup is shown in Fig. 4. The light sourcewas a fiber laser with a narrow linewidth (Koheras Adjustik™).The lightwave was divided into a probe light and an LO light.The probe light was input into a phase modulator that was usedto change the probe light frequency. Fig. 5(a) and (b) shows theconfiguration of the frequency-division multiplexing approachfor the probe pulse. Modulation sidebands were generated at thephasemodulator, and their frequencies were shifted by changingthe modulation signal from an arbitrary waveform generatorwith a staircase pattern.Fig. 6 shows the time dependence of the probe pulse fre-
quency and power. The frequency of the probe light waschanged with a staircase pattern from MHz to
MHz in 800 kHz intervals. The duration ofeach frequency was 10 s. The spatial resolution isgiven theoretically as , where is the groupvelocity of light. The corresponding spatial resolution is 1 km.The probe pulse was produced by cutting out only modulated
part of the probe light, which has frequencies from to ,by an AOM1. At the same time, the optical frequency of theprobe pulse was downshifted by MHz by AOM1. Here,the AOM1 was driven by a pulse generator.Here, the test light of the OTDR for long-haul submarine am-
plifier transmission lines must be a uniform light to avoid anyoptical surges in the repeaters. To generate a test light with aconstant intensity, the intervals of the probe pulses were filledwith dummy pulses (dummy #1). This was accomplished byswitching the probe and dummy pulses at AOM1 [10].
Fig. 5. (a) Configuration ofmultiple frequency probe pulse source consisting oflightwave source and phase modulator and acoustic optical modulator. (b) Spec-trum of modulated lightwave.
Fig. 6. Time dependence of probe pulse frequency and power.
1124 JOURNAL OF LIGHTWAVE TECHNOLOGY, VOL. 30, NO. 8, APRIL 15, 2012
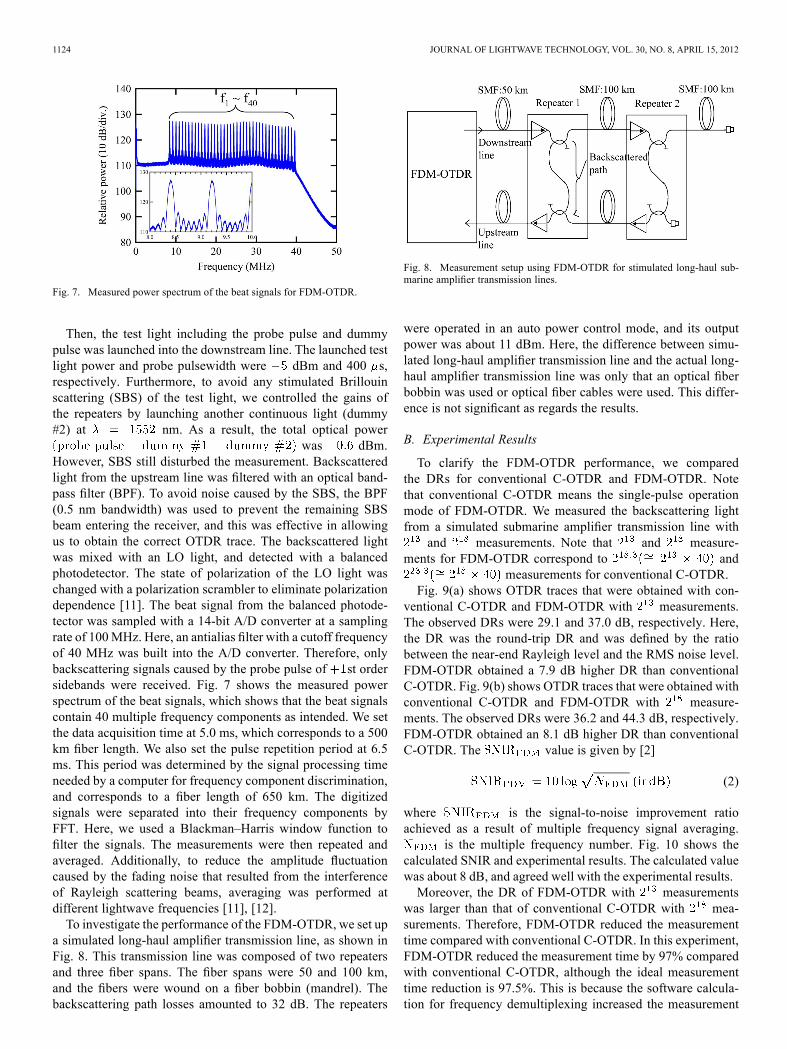
Fig. 7. Measured power spectrum of the beat signals for FDM-OTDR.
Then, the test light including the probe pulse and dummypulse was launched into the downstream line. The launched testlight power and probe pulsewidth were dBm and 400 s,respectively. Furthermore, to avoid any stimulated Brillouinscattering (SBS) of the test light, we controlled the gains ofthe repeaters by launching another continuous light (dummy#2) at nm. As a result, the total optical power
was dBm.However, SBS still disturbed the measurement. Backscatteredlight from the upstream line was filtered with an optical band-pass filter (BPF). To avoid noise caused by the SBS, the BPF(0.5 nm bandwidth) was used to prevent the remaining SBSbeam entering the receiver, and this was effective in allowingus to obtain the correct OTDR trace. The backscattered lightwas mixed with an LO light, and detected with a balancedphotodetector. The state of polarization of the LO light waschanged with a polarization scrambler to eliminate polarizationdependence [11]. The beat signal from the balanced photode-tector was sampled with a 14-bit A/D converter at a samplingrate of 100MHz. Here, an antialias filter with a cutoff frequencyof 40 MHz was built into the A/D converter. Therefore, onlybackscattering signals caused by the probe pulse of st ordersidebands were received. Fig. 7 shows the measured powerspectrum of the beat signals, which shows that the beat signalscontain 40 multiple frequency components as intended. We setthe data acquisition time at 5.0 ms, which corresponds to a 500km fiber length. We also set the pulse repetition period at 6.5ms. This period was determined by the signal processing timeneeded by a computer for frequency component discrimination,and corresponds to a fiber length of 650 km. The digitizedsignals were separated into their frequency components byFFT. Here, we used a Blackman–Harris window function tofilter the signals. The measurements were then repeated andaveraged. Additionally, to reduce the amplitude fluctuationcaused by the fading noise that resulted from the interferenceof Rayleigh scattering beams, averaging was performed atdifferent lightwave frequencies [11], [12].To investigate the performance of the FDM-OTDR, we set up
a simulated long-haul amplifier transmission line, as shown inFig. 8. This transmission line was composed of two repeatersand three fiber spans. The fiber spans were 50 and 100 km,and the fibers were wound on a fiber bobbin (mandrel). Thebackscattering path losses amounted to 32 dB. The repeaters
Fig. 8. Measurement setup using FDM-OTDR for stimulated long-haul sub-marine amplifier transmission lines.
were operated in an auto power control mode, and its outputpower was about 11 dBm. Here, the difference between simu-lated long-haul amplifier transmission line and the actual long-haul amplifier transmission line was only that an optical fiberbobbin was used or optical fiber cables were used. This differ-ence is not significant as regards the results.
B. Experimental Results
To clarify the FDM-OTDR performance, we comparedthe DRs for conventional C-OTDR and FDM-OTDR. Notethat conventional C-OTDR means the single-pulse operationmode of FDM-OTDR. We measured the backscattering lightfrom a simulated submarine amplifier transmission line with
and measurements. Note that and measure-ments for FDM-OTDR correspond to and
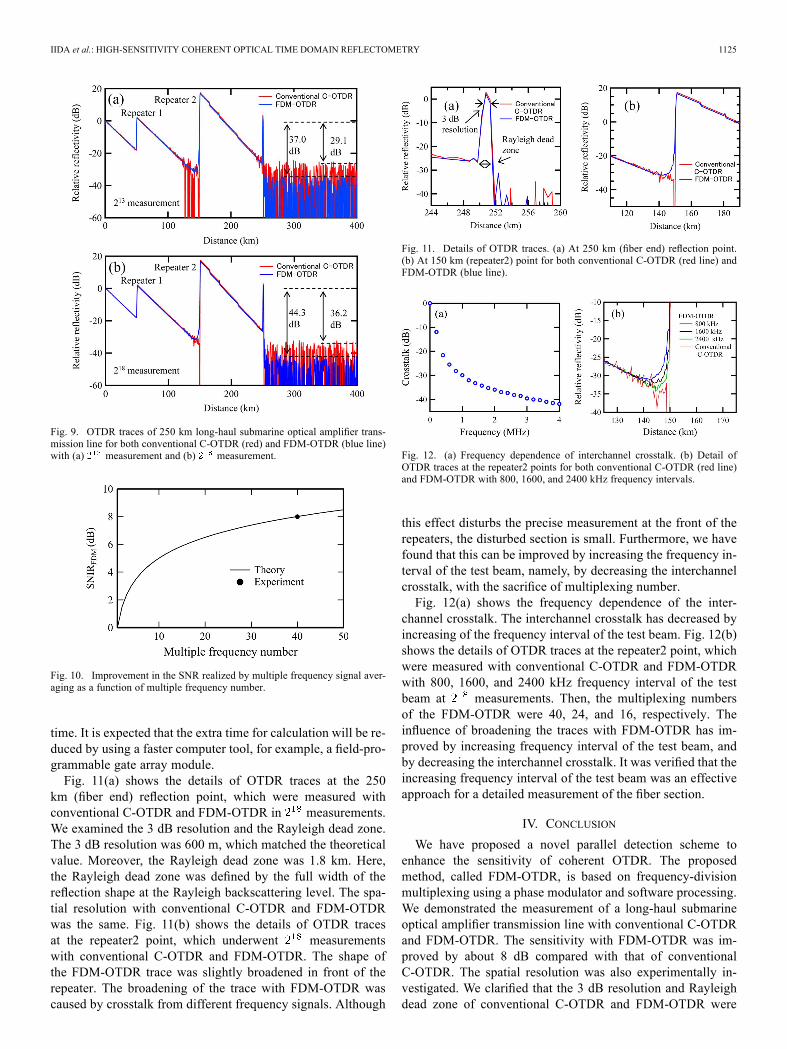
measurements for conventional C-OTDR.Fig. 9(a) shows OTDR traces that were obtained with con-
ventional C-OTDR and FDM-OTDR with measurements.The observed DRs were 29.1 and 37.0 dB, respectively. Here,the DR was the round-trip DR and was defined by the ratiobetween the near-end Rayleigh level and the RMS noise level.FDM-OTDR obtained a 7.9 dB higher DR than conventionalC-OTDR. Fig. 9(b) shows OTDR traces that were obtained withconventional C-OTDR and FDM-OTDR with measure-ments. The observed DRs were 36.2 and 44.3 dB, respectively.FDM-OTDR obtained an 8.1 dB higher DR than conventionalC-OTDR. The value is given by [2]
(2)
where is the signal-to-noise improvement ratioachieved as a result of multiple frequency signal averaging.
is the multiple frequency number. Fig. 10 shows thecalculated SNIR and experimental results. The calculated valuewas about 8 dB, and agreed well with the experimental results.Moreover, the DR of FDM-OTDR with measurements
was larger than that of conventional C-OTDR with mea-surements. Therefore, FDM-OTDR reduced the measurementtime compared with conventional C-OTDR. In this experiment,FDM-OTDR reduced the measurement time by 97% comparedwith conventional C-OTDR, although the ideal measurementtime reduction is 97.5%. This is because the software calcula-tion for frequency demultiplexing increased the measurement
IIDA et al.: HIGH-SENSITIVITY COHERENT OPTICAL TIME DOMAIN REFLECTOMETRY 1125
Fig. 9. OTDR traces of 250 km long-haul submarine optical amplifier trans-mission line for both conventional C-OTDR (red) and FDM-OTDR (blue line)with (a) measurement and (b) measurement.
Fig. 10. Improvement in the SNR realized by multiple frequency signal aver-aging as a function of multiple frequency number.
time. It is expected that the extra time for calculation will be re-duced by using a faster computer tool, for example, a field-pro-grammable gate array module.Fig. 11(a) shows the details of OTDR traces at the 250
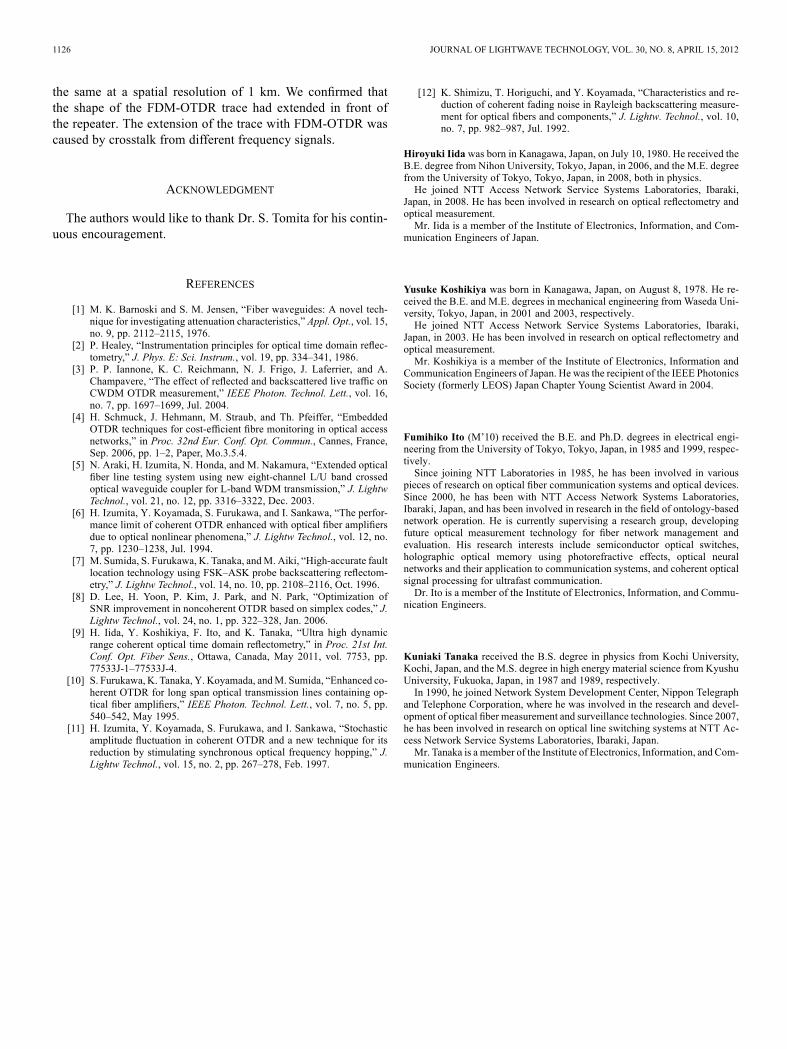
km (fiber end) reflection point, which were measured withconventional C-OTDR and FDM-OTDR in measurements.We examined the 3 dB resolution and the Rayleigh dead zone.The 3 dB resolution was 600 m, which matched the theoreticalvalue. Moreover, the Rayleigh dead zone was 1.8 km. Here,the Rayleigh dead zone was defined by the full width of thereflection shape at the Rayleigh backscattering level. The spa-tial resolution with conventional C-OTDR and FDM-OTDRwas the same. Fig. 11(b) shows the details of OTDR tracesat the repeater2 point, which underwent measurementswith conventional C-OTDR and FDM-OTDR. The shape ofthe FDM-OTDR trace was slightly broadened in front of therepeater. The broadening of the trace with FDM-OTDR wascaused by crosstalk from different frequency signals. Although
Fig. 11. Details of OTDR traces. (a) At 250 km (fiber end) reflection point.(b) At 150 km (repeater2) point for both conventional C-OTDR (red line) andFDM-OTDR (blue line).
Fig. 12. (a) Frequency dependence of interchannel crosstalk. (b) Detail ofOTDR traces at the repeater2 points for both conventional C-OTDR (red line)and FDM-OTDR with 800, 1600, and 2400 kHz frequency intervals.
this effect disturbs the precise measurement at the front of therepeaters, the disturbed section is small. Furthermore, we havefound that this can be improved by increasing the frequency in-terval of the test beam, namely, by decreasing the interchannelcrosstalk, with the sacrifice of multiplexing number.Fig. 12(a) shows the frequency dependence of the inter-
channel crosstalk. The interchannel crosstalk has decreased byincreasing of the frequency interval of the test beam. Fig. 12(b)shows the details of OTDR traces at the repeater2 point, whichwere measured with conventional C-OTDR and FDM-OTDRwith 800, 1600, and 2400 kHz frequency interval of the testbeam at measurements. Then, the multiplexing numbersof the FDM-OTDR were 40, 24, and 16, respectively. Theinfluence of broadening the traces with FDM-OTDR has im-proved by increasing frequency interval of the test beam, andby decreasing the interchannel crosstalk. It was verified that theincreasing frequency interval of the test beam was an effectiveapproach for a detailed measurement of the fiber section.
IV. CONCLUSION
We have proposed a novel parallel detection scheme toenhance the sensitivity of coherent OTDR. The proposedmethod, called FDM-OTDR, is based on frequency-divisionmultiplexing using a phase modulator and software processing.We demonstrated the measurement of a long-haul submarineoptical amplifier transmission line with conventional C-OTDRand FDM-OTDR. The sensitivity with FDM-OTDR was im-proved by about 8 dB compared with that of conventionalC-OTDR. The spatial resolution was also experimentally in-vestigated. We clarified that the 3 dB resolution and Rayleighdead zone of conventional C-OTDR and FDM-OTDR were
1126 JOURNAL OF LIGHTWAVE TECHNOLOGY, VOL. 30, NO. 8, APRIL 15, 2012
the same at a spatial resolution of 1 km. We confirmed thatthe shape of the FDM-OTDR trace had extended in front ofthe repeater. The extension of the trace with FDM-OTDR wascaused by crosstalk from different frequency signals.
ACKNOWLEDGMENT
The authors would like to thank Dr. S. Tomita for his contin-uous encouragement.
REFERENCES
[1] M. K. Barnoski and S. M. Jensen, “Fiber waveguides: A novel tech-nique for investigating attenuation characteristics,” Appl. Opt., vol. 15,no. 9, pp. 2112–2115, 1976.
[2] P. Healey, “Instrumentation principles for optical time domain reflec-tometry,” J. Phys. E: Sci. Instrum., vol. 19, pp. 334–341, 1986.
[3] P. P. Iannone, K. C. Reichmann, N. J. Frigo, J. Laferrier, and A.Champavere, “The effect of reflected and backscattered live traffic onCWDM OTDR measurement,” IEEE Photon. Technol. Lett., vol. 16,no. 7, pp. 1697–1699, Jul. 2004.
[4] H. Schmuck, J. Hehmann, M. Straub, and Th. Pfeiffer, “EmbeddedOTDR techniques for cost-efficient fibre monitoring in optical accessnetworks,” in Proc. 32nd Eur. Conf. Opt. Commun., Cannes, France,Sep. 2006, pp. 1–2, Paper, Mo.3.5.4.
[5] N. Araki, H. Izumita, N. Honda, and M. Nakamura, “Extended opticalfiber line testing system using new eight-channel L/U band crossedoptical waveguide coupler for L-band WDM transmission,” J. LightwTechnol., vol. 21, no. 12, pp. 3316–3322, Dec. 2003.
[6] H. Izumita, Y. Koyamada, S. Furukawa, and I. Sankawa, “The perfor-mance limit of coherent OTDR enhanced with optical fiber amplifiersdue to optical nonlinear phenomena,” J. Lightw Technol., vol. 12, no.7, pp. 1230–1238, Jul. 1994.
[7] M. Sumida, S. Furukawa, K. Tanaka, andM. Aiki, “High-accurate faultlocation technology using FSK–ASK probe backscattering reflectom-etry,” J. Lightw Technol., vol. 14, no. 10, pp. 2108–2116, Oct. 1996.
[8] D. Lee, H. Yoon, P. Kim, J. Park, and N. Park, “Optimization ofSNR improvement in noncoherent OTDR based on simplex codes,” J.Lightw Technol., vol. 24, no. 1, pp. 322–328, Jan. 2006.
[9] H. Iida, Y. Koshikiya, F. Ito, and K. Tanaka, “Ultra high dynamicrange coherent optical time domain reflectometry,” in Proc. 21st Int.Conf. Opt. Fiber Sens., Ottawa, Canada, May 2011, vol. 7753, pp.77533J-1–77533J-4.
[10] S. Furukawa, K. Tanaka, Y. Koyamada, andM. Sumida, “Enhanced co-herent OTDR for long span optical transmission lines containing op-tical fiber amplifiers,” IEEE Photon. Technol. Lett., vol. 7, no. 5, pp.540–542, May 1995.
[11] H. Izumita, Y. Koyamada, S. Furukawa, and I. Sankawa, “Stochasticamplitude fluctuation in coherent OTDR and a new technique for itsreduction by stimulating synchronous optical frequency hopping,” J.Lightw Technol., vol. 15, no. 2, pp. 267–278, Feb. 1997.
[12] K. Shimizu, T. Horiguchi, and Y. Koyamada, “Characteristics and re-duction of coherent fading noise in Rayleigh backscattering measure-ment for optical fibers and components,” J. Lightw. Technol., vol. 10,no. 7, pp. 982–987, Jul. 1992.
Hiroyuki Iida was born in Kanagawa, Japan, on July 10, 1980. He received theB.E. degree from Nihon University, Tokyo, Japan, in 2006, and the M.E. degreefrom the University of Tokyo, Tokyo, Japan, in 2008, both in physics.He joined NTT Access Network Service Systems Laboratories, Ibaraki,
Japan, in 2008. He has been involved in research on optical reflectometry andoptical measurement.Mr. Iida is a member of the Institute of Electronics, Information, and Com-
munication Engineers of Japan.
Yusuke Koshikiya was born in Kanagawa, Japan, on August 8, 1978. He re-ceived the B.E. and M.E. degrees in mechanical engineering fromWaseda Uni-versity, Tokyo, Japan, in 2001 and 2003, respectively.He joined NTT Access Network Service Systems Laboratories, Ibaraki,
Japan, in 2003. He has been involved in research on optical reflectometry andoptical measurement.Mr. Koshikiya is a member of the Institute of Electronics, Information and
Communication Engineers of Japan. He was the recipient of the IEEE PhotonicsSociety (formerly LEOS) Japan Chapter Young Scientist Award in 2004.
Fumihiko Ito (M’10) received the B.E. and Ph.D. degrees in electrical engi-neering from the University of Tokyo, Tokyo, Japan, in 1985 and 1999, respec-tively.Since joining NTT Laboratories in 1985, he has been involved in various
pieces of research on optical fiber communication systems and optical devices.Since 2000, he has been with NTT Access Network Systems Laboratories,Ibaraki, Japan, and has been involved in research in the field of ontology-basednetwork operation. He is currently supervising a research group, developingfuture optical measurement technology for fiber network management andevaluation. His research interests include semiconductor optical switches,holographic optical memory using photorefractive effects, optical neuralnetworks and their application to communication systems, and coherent opticalsignal processing for ultrafast communication.Dr. Ito is a member of the Institute of Electronics, Information, and Commu-
nication Engineers.
Kuniaki Tanaka received the B.S. degree in physics from Kochi University,Kochi, Japan, and the M.S. degree in high energy material science from KyushuUniversity, Fukuoka, Japan, in 1987 and 1989, respectively.In 1990, he joined Network System Development Center, Nippon Telegraph
and Telephone Corporation, where he was involved in the research and devel-opment of optical fiber measurement and surveillance technologies. Since 2007,he has been involved in research on optical line switching systems at NTT Ac-cess Network Service Systems Laboratories, Ibaraki, Japan.Mr. Tanaka is a member of the Institute of Electronics, Information, and Com-
munication Engineers.