high-resolution210pb dating of lake constance sediments: stable lead in lake constance
TRANSCRIPT
Environmental Geology (1994) 24:267-274 �9 Springer-Verlag 1994
A. Bollh6fer �9 A. Mangini �9 A. Lenhard �9 M. Wessels �9 F. Giovanoli �9 B. Schwarz
High-resolution 't~ dating of Lake Constance sediments: Stable lead in Lake Constance
Received 10 January 1994 / Accepted 13 July 1994
Abstract Two sediment cores (BO90/13b and BO90/17b) from Lake Constance were investigated by V-spectrometry for 21~ la4Cs, 137Cs, 241Am, 23*Th, and other members of the 2asu decay chain. The sediments were dated using the constant-flux model for 2 XOpb ' and accumulation rates were determined. These range from 0.04 to 0.65 9/cm2/yr (BO90/13b) and 0.04 to 0.8 9/cm2/yr (BO90/17b), respec- tively. The mean accumulation rate amounts to 0.16 g/cm2/yr for both cores. The cores had already been dated by lami- nation counting and reconstruction of high-water events at the Limnological Institute at Constance, so that a very precise time scale was available. Both ages derived are in agreement within statistical error up to 1900, which means dating with the constant-flux model f o r / l ~ was con- firmed up to that age. The position of the maxima of bomb cesium and americium confirm the stratigraphic and 2 ~ opb datings. With 241Am a further radioactive isotope is avail- able, which can, due to the half-life o f /4~pu (tl/2 = 14.4 yr), be detected now by 7-spectrometry and can serve as an additional time indicator, the maximum being dated at 1963. By applying the various time scales, the depth pro- files of stable lead and zinc of core BO90/13b were dated. Both heavy metals show a very significant maximum located beneath the layer of the maxima of bomb cesium and americium, showing that these maxima are older than those of the bomb isotopes. It is remarkable in this context that the maximum of zinc concentration occurs a little later than that of stable lead. Similar concentration profiles are observable in core BO90/17b and other, older sediment cores (CS6-CS10) on a transect across the lake. In contrast to a former assumption, the depth profile of stable lead in
A. Bollh6fer ([Y~) �9 A. Mangini �9 B. Schwarz Heidelberger Akademie der Wissenschaften; c/o INF 366; D-69120 Heidelberg, Germany
A. Lenhard - M. Wessels Limnological Institute, Postbox 5560, D-78464 Konstanz, Germany
F. Giovanoli Reichsgasse 29, CH-7002 Chur, Swiss
Lake Constance sediments does not reflect the anthro- pogenic gasoline lead emissions into the atmosphere for Germany, their maximum being dated at 1971.
Key words 2~~ dating �9 Lead �9 Sediments
Introduction
Since the annual 21~ deposition from the atmosphere can be considered as constant (Dominik and others 1981; Mangini and others 1984, D6rr and others 1989; von Gunten and Moser 1993), it is possible to date sediment cores and determine accumulation rate variations by using the con- stant-flux model for 21~ In earlier papers Dominik and others (1984) described the basic procedure; the plot of 21~ excess activity in sediment cores versus depth (21~ excess is the atmospheric 21~ component) reflects accu- mulation rate variations. Dating sediments with 21~ is relatively reliable; this method was used for the first time by Goldberg (Goldberg 1963). Since about 1971 it has been an established tool of dating marine and lake sedi- ments (Krishnaswami and others 1971; Koide and others 1973; Robbins and Edgington 1975; Benninger and others 1979). In the standard method 21~ is detected via c~- measurement of its shorter living radioactive daughter 21~ after chemical processing.
Two major events are responsible for the distribution of cesium in sediment cores: during the Chernobyl reactor accident of 1986, large amounts of 134Cs and 137Cs were injected into the atmosphere and deposited within four weeks (D6rr and Miinnich 1991) in April and May. The radionuclides were removed from the water column into the sediments of Lake Constance after a dwelling time of several weeks (Mangini and others 1987). The second event was the injection of these isotopes into the atmosphere due to the nuclear weapon tests in the early 1960s. Maximum bomb cesium deposition occurred in 1963 and 1964 (about 50 percent of total bomb Cs) (D6rr and Mfinnich 1991). 24Zpu is another radionuclide that was injected into the
268
atmosphere due to the nuclear weapon tests. It decays with a half-life of 14.4 yr to 24aAm (half-time 432.2 yr), which emits a 7-ray (E: 59.5 keV) that can be detected.
The aim of this work was: (1) to test the accuracy of detection of 21~ via 7-spectroscopy and the reliability of 21~ dating, (2) to investigate 241Am by 7-spectroscopy as a possible marker in sediments, and (3) to study the record of heavy metals in Lake Constance. Due to the high resolution of the two sediment cores (0.5 and 1.0-cm sam- ple intervals, respectively), precise radiometric dating could be done, and the result is confirmed by lamination count- ing (Wessels and others 1993). The two tracers, ~37Cs and 24 ~Am, help to reconstruct the history of heavy metal input into sediments. The stable lead profile versus the age of core 13b is presented and compared with the profiles of older measurements on other cores.
Material and methods
Both cores were recovered in the Friedrichshafen Bay in 1990, along the transect Friedrichshafen-Romanshorn at a water depth of 165 m (BO90/17b) and 185 m (BO90/13b), respectively. The sedimentation processes in Lake Con- stance are mainly influenced by the river Alpenrhein. The relatively high sedimentation rate of about 4-5 mm/yr generated a significant stratification in both cores. The lamination is very well preserved and undisturbed. Greyish flood layers are well distinguishable from the greyish brown to brown of other layers. Lamination counting and recon- struction of high-water events made possible a stratigra- phic dating of both cores (Wessels and others 1993). Sam- pling and processing was carried out at the Limnological Institute at Constance. The cores were investigated at 1-cm steps (BO90/13b) and 0.5 to 1-cm steps (BO90/17b), respec- tively. The silty clay samples were freeze dried and pul- verized in a wolfram-carbide mill.
For two cores, the 21~ activity was determined by the direct y-spectroscopic method. This has two advantages: first, no chemical processing of the samples is necessary, and second, the radionuclides of interest can be detected at the same time. For 7-spectrometry the samples were placed in polyethylene boxes (50 ml). They were measured for the nuclides of the natural uranium decay series, for 134Cs, ~37Cs, and 24~Am, using a Canberra low-energy germanium detector. The energy range of the detector included the 46.5-keV line of 21~ and the 1461-keV line of 4~ These two lines are also used for energy/chanel number calibration of the spectra. Samples weighing between 1 and 14 g were counted for about two days.
Using the peak area (cps: counts per second), the detec- tor efficiency (e) for each sample, the decay probability (w) of each nuclide into the corresponding decay channel, and the sample mass (m), one can calculate the specific activity (Bq/g) of the radionuclides in a sample as:
Act[Bq/g]- cps (1) g,'W'm
The detector efficiency was calibrated applying standards of known activity but of different geometries and densities and prepared from a radioactive multinuclide standard of the Physikalisch-Technische Bundesanstalt, The efficiency for the corresponding sample geometry and energy was ascertained through the relationship of measured to ex- pected gamma signal. Efficiencies for other samples (geo- metries or densities) were calculated by interpolation with a program on a PC (LEGepar; D6rr 1991). They range from 16 percent to 20 percent for the 46.5-keV line of 21~ The measurements of heavy metals and trace ele- ments were done by AAS. Core BO90/17b was measured at the Limnological Institute (see Wessels and others 1993). The measurements of stable lead and zinc in core BO90/13b were carried out in Heidelberg. Samples of 500 mg were dissolved in aqua regia, and the solution was heated for about 4 h and then diluted to 20 or 50 ml, respectively. The heavy-metal analyses were carried out in flame mode, using an acetylene flame of a Varian SpectrAA- 10 spectrograph.
Dating and Accumulation Rate Determination
To calculate the al~ excess activity of each sample the in situ produced (or supported) 21~ has to be subtracted from total 21~ as:
Act(21~ = Act(21~ - Act(21~ (2)
The in situ zl~ is produced by the decay of 226Ra in detritic materials. In earlier publications a constant activ- ity of about 2.0 dpm/9 (von Gunten and others 1987) up to 2.5 dpm/g (Dominik and others 1981) was assumed as supported az~ This corresponds to the mean value of 210pb activity of sediment cores at depths where the atmo- spheric/l~ is already decayed but 226Ra from detritic materials constantly supplies z l~
We determined the activity of the supported z~~ by direct measurement of e26Ra or a radioactive daughter of 2Z6Ra (ZZ6Ra, E~ = 186.1 keV; 214pb, E~ = 352.0 keV 214Bi, E 7 = 609.3 keV). Figure 1 shows a typical spectrum of a measured sediment sample (BO90/13b, 21 cm). The most important lines are marked. The supported amount of 2 lOpb activity of each sample was calculated as the mean value of the 214pb and 21*Bi activity. Both activities are the same within the statistical error. Thus, the statistical uncertainty due to lower activities of these two nuclides in a sediment core could be minimized.
The distribution of 2~~ excess in sediments is mainly influenced by three factors. (1) the radionuclide flux (F), (2) the accumulation rate (R), and (3) the decay constant (2). If all three are assumed to be constant, the logarithmic plot of the 21~ activity [dpm/9] versus the compaction- corrected depth [y/cm 2] forms a straight line. The mean accumulation rate is calculated by the slope of the best fit:
21Opbxs(6j)[dpm/9] = 2 1 ~ ) �9 e-aJ/g (3)
R = G-2 (4)

Fig. 1 7 spectrum of sample BO90/13b, 22; depth 21 cm. Time of measurement was about two days on a low-energy germanium detector (LEGe). The y axis unit is counts per second. The most important lines are marked
500
450
400
350
300
250
200
269
210 - Pb
-/
~30
rh
1 5 0 -
5O
0 0
214 I 214
137 [ t
500 1000 1500 2000 2500 3000 3500 4000 Channel #
where: Gj is compaction corrected depth of samplej [g/cmZ]; Gj = ~i=-{ pi" di, G is compaction corrected depth [g/cm 2] with 1/e activity, 21~ ) is 2~~ excess activity at the surface, 2 is decay constant of 2Z~ (0.031 1/yr), R is mean accumulation rate (g/cm2/yr), pg is dry bulk density of sample i, and d~ is thickness of sample i.
The deviations from this line indicates that the accumu- lation rate varied; high 2 ~ Opb excess activities indicate low dilutions of atmospheric lead (both stable and 2~~ with
O-
Pb-excess (dpm / g) Pb-excess (dpm / g)
0.1 1 10 0.1 1 10
F , I
5
10 c" O
-5 E --n
r (3
15 [ , r
13b - -4 ______q
20 I - ~ ~ I
Fig. 2 21~ excess plotted logarithmically versus the mass depth of cores BO90/13b and BO90/17b. The straight line is an exponentiall fit to the data
detritic materials ( ~ low accumulation rates), whereas at high accumulation rates, the 2 lOpb activity is reduced.
Figure 2 shows the logarithmic plot of 21~ activity versus the compaction-corrected depth for cores 13b and 17b. One sees a few significant deviations from the best fit-line. With the help of the partial accumulation rates, it is possible to calculate the age of each layer (see Dominik and others 1984). At a depth of about 40 cm, the 21~ activity in the samples is lower than the minimum detect- able activity of the 7-system for 2Z~ at a time of measure- ment of about two days.
Results and Discussion
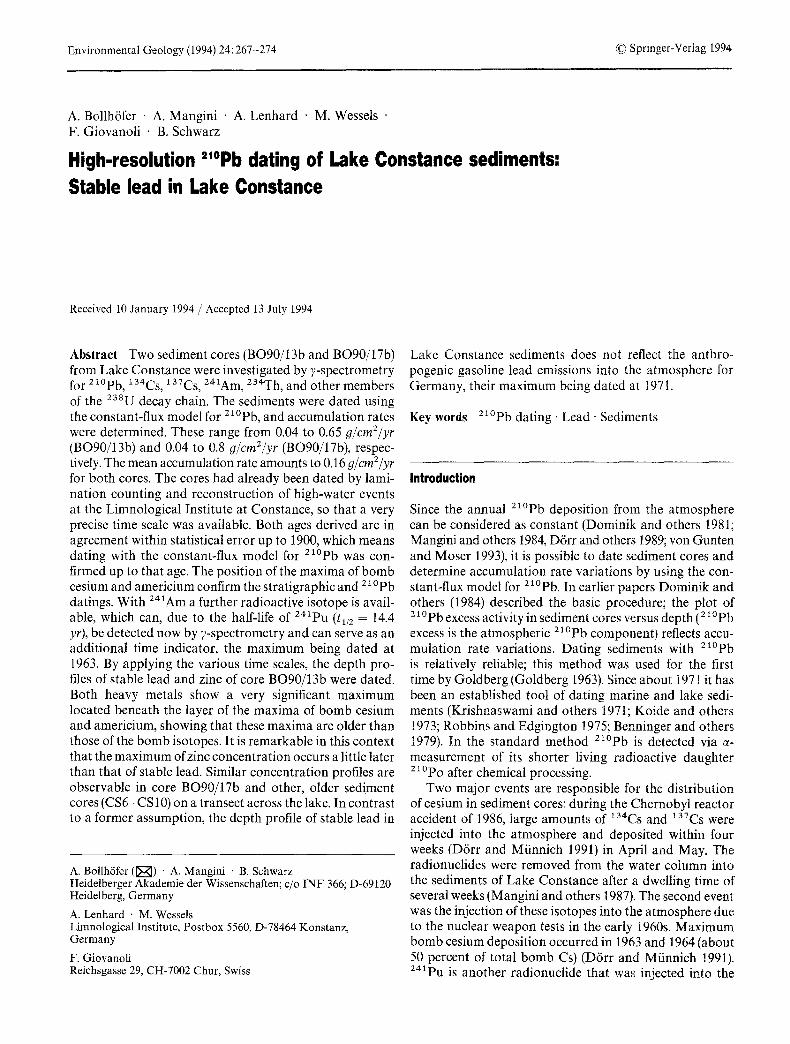
Figure 3 shows the result of dating cores t3b and 17b with the constant-flux-model (solid line) and the result of stra- tigraphic dating (dashed line) plotted versus the depth. Both dating results agree well back to about 100 years. A radioisotopic dating going further back in time does not appear to make much sense as, first, 21~ activities are far too low at these depths, and second, because of an artificial shift of the Rhine mouth in the year 1900. The overall sedimentation pattern may have changed, and thus the assumption of a constant flux would no longer be valid. The positions of the cesium and americium maxima in 13b (Fig. 4) confirm the constant-flux model. Both peaks are situated at a depth of 16.0 cm, corresponding to a radio- metric age of 29 __ 4 yr (compared with an expected value of 26-27 yr before 1990 when the nuclear weapon tests culminated). From the exponential fit of the z 10pb activity versus the compaction corrected depth follows:
21 o Pbxs [_dpm/g] = 6.0 (dpm/g)" e- o. 2. G (5)
The resulting mean accumulation rate R is 0.16 g/cm2/yr.
270
150 ~-~ I Accumulation rate ( g / c m 2 / y r )
T T T T ~//1/I ] 0 0.2 0.4 0.6 0.8 0.2 0.4 0.6 0.8 0 0.2 0.4 0.8 0.8 Bo90 /13b 1 9 9 0 1 " 4 ' . . . . . ~ 0 ' ' ' - ' ~ 4
t so 1
o . . . . . . . . . . . . . . 1
150 -1920
-1910[ > a }
-1900/ , , , , , , / , , , ,b
03 <
100
5 0
0
Bo90 / 17b
0 5 10 15 20 25 30 35 40 Depth (cm)
Fig. 3 Result of dating cores 13b and 17b. The solid line is the result of the application of the constant-flux model for z~~ the dashed line shows the result of lamination counting. The error is calculated from the counting statistics of the 2t~ measurements
10
x : 1 5
2O
25
30
Cs-137 (Bq / g) 0.2 0.6 1.0 1.4 0
5
Am-241 ( mBq / g) 4 6 8 10
-- f -T 'T-F]--
-----q
Pb-stable (ppm) 50 100 150 200
I I I
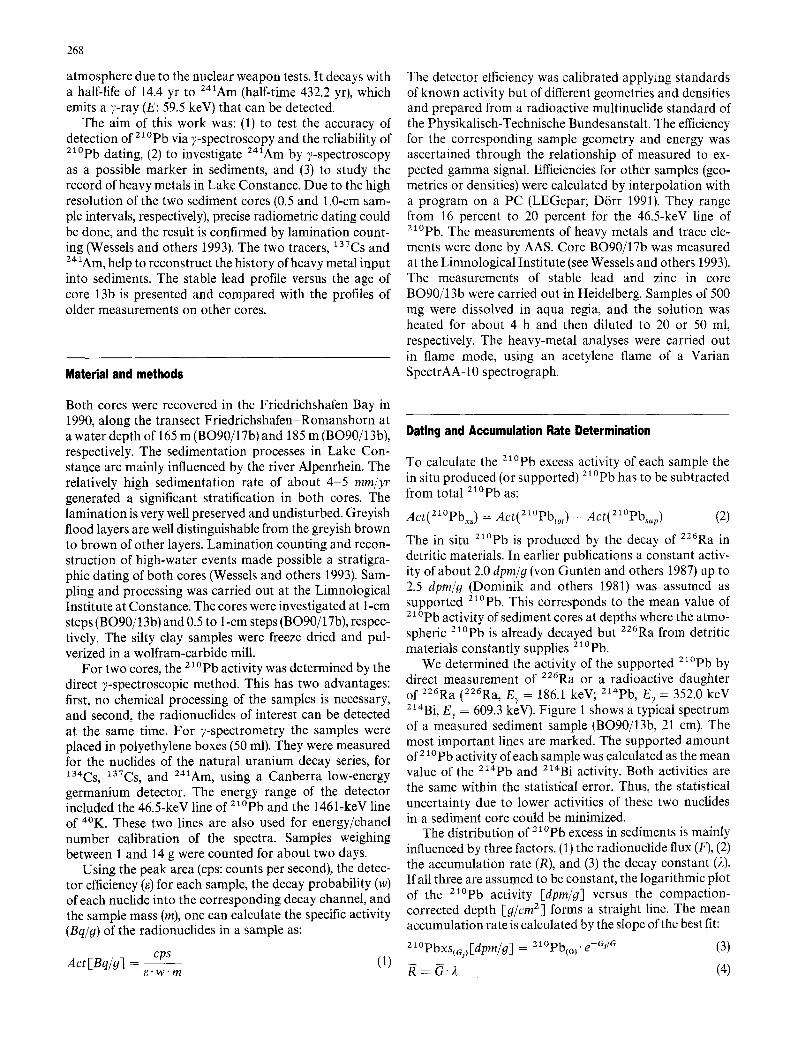
Fig. 4 Cs, Am, and stable lead distribution in core BO90/13b
The activities of 2t~ excess show significant deviations from the best fit line. This deviation indicates accumulation rate variations: high activities indicating low accumulation rates and vice versa. Figure 5 shows the calculated partial accumulation rates plotted versus year. One recognizes peaks that can be related to the main high-water events in the years 1987, 1954, 1927, and 1910.
21~ measurements of core 17b are not as precise as those of core 13b because very little material was available for the measurements (about 2 -5 g) and because the time of measurement of about one to two days was relatively short. Both facts influenced the statistics of the measure-
Fig. 5a-c Partial accumulation rates plotted versus the radiometric age. The horizontal lines mark the years of the main high water events (1987, 1954, 1927). a The partial accumulation rates as calculated by lamination counting; b (17b) and c (13b) show the partial accumula- tion rates as calculated by radiometric dating. The curves are cubic spline fits to the data
Cs-137 (Bq / 9) 0.2 0.6 1.0 1.4 0
5
2O
25
30 l&&a&a&aaa&~Ja_
Am-241 ( mBq / g) 2 4 6 8 10
"----'-"--3
A ~
Pb-stable (ppm) 50 100 150 200
Fig. 6 Cs, Am, and stable lead distribution in core BO90/17b
ments. The error of the 21~ activity was sometimes up to 100 percent, but despite the large uncertainty, the stra- tigraphic and the radioisotopic dating do correspond (see Fig. 3). Applying the 2~~ data, we determined the same mean accumulation rate as for core 13b of 0.16 9/cmZ/yr.
The peaks of cesium and americium of core 17b (Fig. 6) are situated at a depth of 12.75 cm, which corresponds to a radiometric age of 24 _+ 6 years. The good agreement between cesium and americium activity records in both cores implies that americium is a useful further time mark- er for dating recent lake sediments. Moreover, one can use 241Am to calculate a lower limit for the pollution of sedi- ments with 24~pu from nuclear weapon tests using the 241Am activity and the radioactive decay as:
ACtam(t) = "~Am �9 (e - zP~ - e - z A = ' ) (6) Z~Am - - /~Pu
where Actgm(t ) is 24tAm activity after t years (plutonium

271
1.6
~>" 1.2 LA5 � 9 . . . . . . . . . . . . . . . . . . . . . . . . . . . . .
o -~ 17B
/ �9
a_ �9 sed. trap �9 13 B ] x . . . . . . . . . . . , - ' - . . . . . . . . . . . . . . . . . . . . .
S ~ 2
n= R i f ' ~ # SM1, 0.4.
0 0.05 0.10 0.15 0.20 0.25 Accumulation rate ( g / c m 2 / y r )
Fig. 7 21~ excess fluxes of different cores plotted versus the mean accumulation rate. The range of the atmospheric zl~ flux esti- mated as that of soil profiles around Lake Constance is marked by horizontal dashed lines. The vertical area shows the range of the mean accumulation rates (0.09-0.125 g/cmZ/yr) reproducing this flux
activity at t = 0 should be l), 2Am is decay constant of 241Am, 2pu is decay constant of 24~pu, e -zPa describes the formation of americium from its radioactive mother pluto- nium, and e -x*mt describes the decay of americium.
According to equation 6, in 1990 the 24~Am activity was 2.4 percent of the 24~pu activity in 1963. The lower limit for the pollution of the sediment with z4~Pu can be assessed at: 800 _+ 200 Bq/m 2 (13b) and 1500 + 300 Bq/m z (17b), respectively.
Figure 7 shows the fluxes of excess zl~ as recorded in cores from different localities in Lake Constance versus the mean accumulation rate. The data are taken from Dominik and others (1981, 1984) and Barth (1984). Cores SM1, SM2, and ROM1 originate from central parts of the lake; AR1, LA3, and LA5 are data from localities closer to the northern shore, sampled at water depths of ap- proximately 100 m. The dashed lines indicate the flux of 2~~ expected from atmospheric deposition, 0.78 up to about 1 dpm/cm2/yr (Appel 1982). Cores 13b and 17b yield fluxes of 0.87 4-0.05 dpm/cm2/yr (13b) and 0.92 + 0.10 dpm/cmZ/yr (17b), respectively. They do not substantially differ from the a tmospher i c / l~ deposition. Compared with the fluxes, however, the accumulation rates of both cores are higher than in the other cores. These high sedi- ment accumulation rates are caused by Rhine interflows, which constantly supply allogenic material to the cores.
Stable lead in Lake Constance sediments
The main purpose of dating young sediments and soils is to have a time scale that allows studies of the anthro- pogenic and geogenic impact on the sediment and the lake. Figure 8 shows the profiles of stable lead and zinc in core BO90/13b plotted versus the age calculated with the con- stant-flux model for zl~ Heavy metals show significant maxima at depths of about 17.0-19.0 cm (13b) and 12.5-
0
1980
1960
1940
1920
1900
Pb (ppm)
50 100 150
[
_5
j I l _ . t _ _
200
Zn (ppm)
100 200 :300 -T--
I ! I f I I
400
Fig. 8 Stable lead and zinc versus the radioisotopic age of core 13b
14.5 cm (17b). In particular, the maxima of stable lead and zinc concentration significantly exceed the geogenic back- ground (about 20 ppm for lead, 50 ppm for zinc). The geogenic background was estimated from the preindustrial data, i.e., from the concentrations of the deepest samples measured. This value is in good agreement with the value given by Wessels and others (1993).
The maxima are dated radiometrically about 1957 (lead) and 1960 (zinc). Compared with the bomb cesium and americium profiles (Fig. 4), the heavy metal maxima turn out to be beneath the layer with the maxima of the bomb isotopes, proving they have to be dated prior to 1963. Two other cores (17b and 2lb) show similar profiles (Wessels and others 1993).
Even when dilution is taken into account the stable lead~ 21~ .... ratio of both cores show maxima dated prior to 1960 (Fig. 9). The plotted curve is a cubic spline fit of the data (note that the pb/21~ ratio is not influ- enced by changing sedimentation rates or by geochemis- try).
1940 0 30
1 9 5 0
1960
1 970
1 9 8 0
1 990
Pb-stable / Pbxs (10 -6 g / dpm)
1 0 20
I .... I
2 1 0 Fig. 9 Stable lead/ Pb excessco,r ratio plotted versus the age of core 13b. The curve is a cubic spline fit to the data
272
18
16
- t '~ 14
121 lo! 6
0~ .-1
1940 19~50 1960 1970
�9 J
t
19'80 1990
0.2
E
-o.1 13.
d
-0
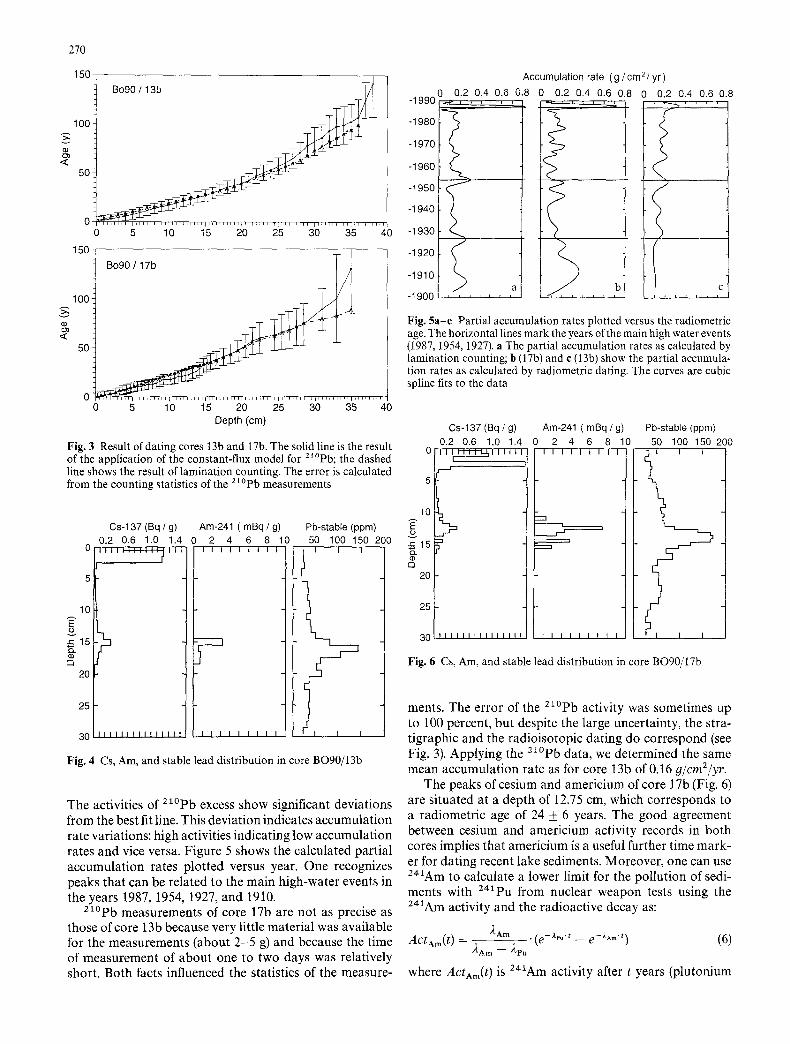
Fig. 10 Gasoline lead input function for the Federal Republic of Germany since 1950. Solid circles indicate annual mean atmospheric lead concentrations at the Schauinsland. The curve is a cubic spline fit to the lead exhaust data (vertical bars: D6rr 1989)
In earlier papers the stable lead maximum in Lake Constance sediments was interpreted as being correlated with the maximum of the emission of gasoline lead into the atmosphere dated at about 1971 (Fig. 10) (Dominik and others 1984; D6rr and others 1989). With the dates pre- sented in this paper, it turns out that the time scale of the stable lead record in cores 13b and 17b substantially differs from that of Fig. 10. The atmospheric input of gasoline lead is not shown in Fig. 9.
In search of possible causes determining the distribution and the maximum of stable lead in the sediment, we calcu- lated the flux of lead into the sediment as:
Flux,,et [ #c~2yr]=Accrat[g/crn2/yr]'Conc,,e,[#g/g] (7)
where Flux,~et is flux of heavy metal from the water column into the sediment, Accrat is accumulation rate, and Concme , is concentration of the heavy metal in the sediment. It turns out that the maximum of stable lead flux was at about 32-37 years before 1990. Using the sediment data, we evaluated a geogenic flux (Fluxgeo) from the water column into the sediment of about 3-5 #g/cm2/yr. The anthro-
pogenic flux and the inventory (Inv) of anthropogenic lead in the peaks from 1955 to 1965 can then be assessed from:
I 9 6 5
tot.Inv,,t = ~ lnv[#g/cm 2] 1 9 5 5
- FIuxoeo[#g/crn2/yr] . 10 yr (8)
Both cores show a total lead inventory of about 100- 120 #g/cm 2 (1955-1965). Although this inventory corre- sponds to an assessment of total gasoline lead deposition of about 1 g/cm 2 for Germany (D6rr and others 1989), the two time scales are different (10 years in this work, com- pared to 50 years in D6rr). The results on cores BO90/17b and BO90/13b show that the atmospheric gasoline lead pollution alone cannot be responsible for the maximum of the stable lead distribution in these sediments.
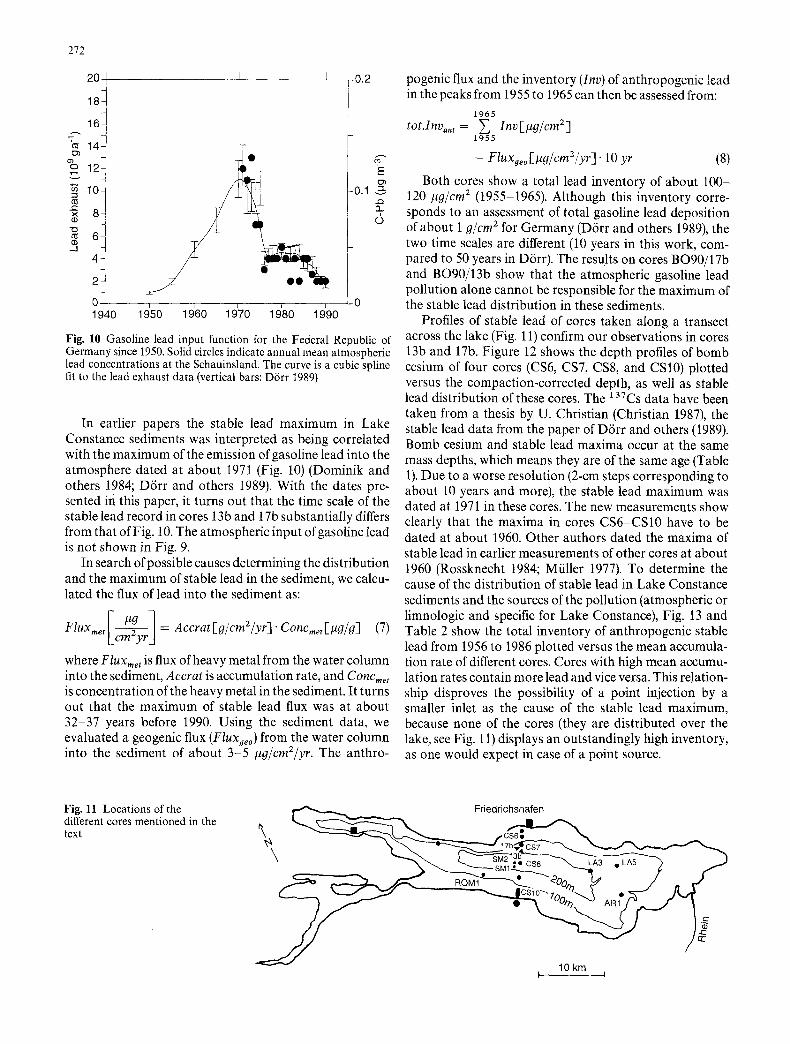
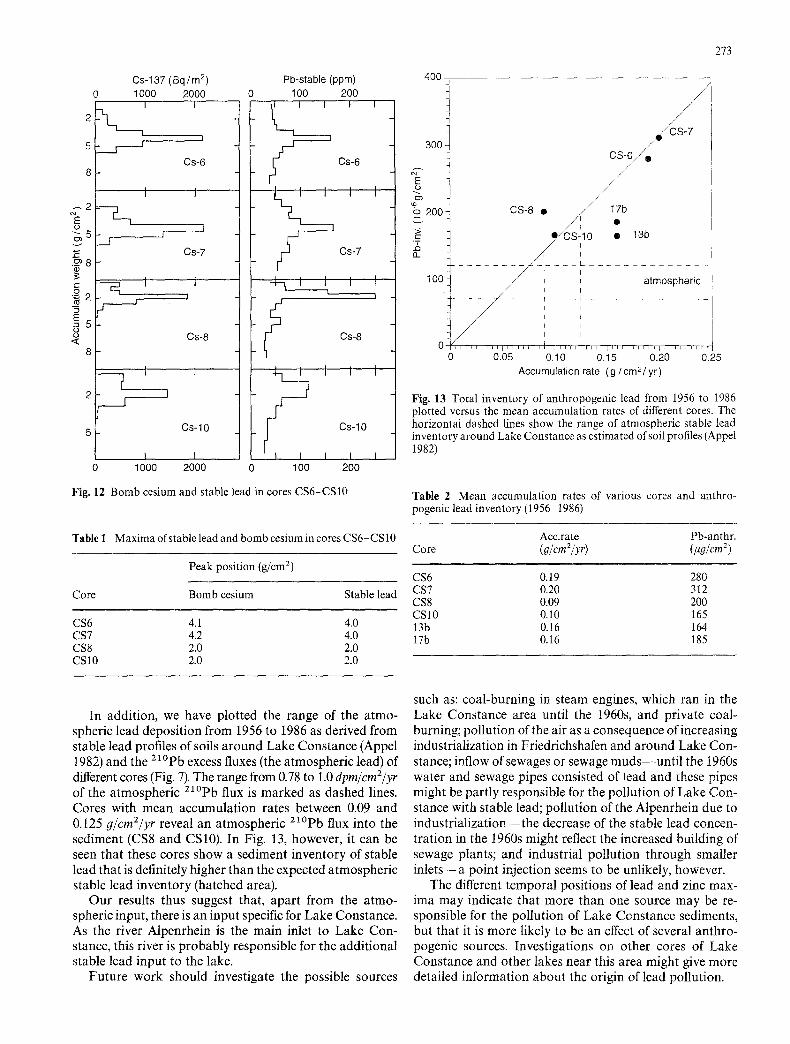
Profiles of stable lead of cores taken along a transect across the lake (Fig. 11) confirm our observations in cores 13b and 17b. Figure 12 shows the depth profiles of bomb cesium of four cores (CS6, CS7, CS8, and CS10) plotted versus the compaction-corrected depth, as well as stable lead distribution of these cores. The 137Cs data have been taken from a thesis by U. Christian (Christian 1987), the stable lead data from the paper of D6rr and others (1989). Bomb cesium and stable lead maxima occur at the same mass depths, which means they are of the same age (Table 1). Due to a worse resolution (2-cm steps corresponding to about 10 years and more), the stable lead maximum was dated at 1971 in these cores. The new measurements show clearly that the maxima in cores CS6-CS10 have to be dated at about 1960. Other authors dated the maxima of stable lead in earlier measurements of other cores at about 1960 (Rossknecht 1984; Miiller 1977). To determine the cause of the distribution of stable lead in Lake Constance sediments and the sources of the pollution (atmospheric or limnologic and specific for Lake Constance), Fig. t3 and Table 2 show the total inventory of anthropogenic stable lead from 1956 to 1986 plotted versus the mean accumula- tion rate of different cores. Cores with high mean accumu- lation rates contain more lead and vice versa. This relation- ship disproves the possibility of a point injection by a smaller inlet as the cause of the stable lead maximum, because none of the cores (they are distributed over the lake, see Fig. 11) displays an outstandingly high inventory, as one would expect in case of a point source.
Fig. 11 Locations of the different cores mentioned in the text
r.,,,~_._.....~ ~ _ Friedrichshafen
CS 10" - " q �9 . . . . . .
10 km I l
Cs-137(Bq/m 2) 0 1000 2000
I [
I 5 [ - - J
Cs-6 8
I I
I
Cs-7
--N 1 J
)__r Cs-8
-7 I J 2 I [
5 Cs-10
I I 0 1000 2000
~ 2 04
E o
E- .-~ 8
r
O
E = 5 o o <
8
Pb-stable (ppm) 100 200
I
Cs-6
_ _ 1 J
Cs-7
4 7 J
Cs-8
s 7 J
Cs-10
100 200
Fig. 12 Bomb cesium and stable lead in cores CS6-CS10
Table 1 Maxima of stable lead and bomb cesium in cores CS6-CS 10
Peak position (g/cm 2)
Core Bomb cesium Stable lead
CS6 4.1 4.0 CS7 4.2 4.0 CS8 2.0 2.0 CS10 2.0 2.0
273
4~176 I 7
300 2
%-.
200
c " T ..O O_
/ /
/
CS-8 �9 / ~ 17b
10 �9 13b
. . . . . . . . - - J i . . . . . . . . . . . . . . . . . . 1 O0 ~ ~ atmospheric
0 0.05 0,10 0.15 0.20 0.25 Accumulation rate (g/cm2/yr)
Fig. 13 Total inventory of anthropogenic lead from 1956 to 1986 plotted versus the mean accumulation rates of different cores. The horizontal dashed lines show the range of atmospheric stable lead inventory around Lake Constance as estimated of soil profiles (Appel 1982)
Table 2 Mean accumulation rates of various cores and anthro- pogenic lead inventory (1956-1986)
Acc.rate Pb-anthr. Core (g/cm2/yr) (#g/cm2)
CS6 0.19 280 CS7 0.20 312 CS8 0.09 200 CS10 0.10 165 13b 0.16 164 17b 0.16 185
In addition, we have plotted the range of the atmo- spheric lead deposition from 1956 to 1986 as derived from stable lead profiles of soils around Lake Constance (Appel 1982) and the 21~ excess fluxes (the atmospheric lead) of different cores (Fig. 7). The range from 0.78 to 1.0 dpm/cmZ/yr of the atmospheric 21~ flux is marked as dashed lines. Cores with mean accumulation rates between 0.09 and 0.125 9/cmZ/yr reveal an atmospheric z l~ flux into the sediment (CS8 and CS10). In Fig. 13, however, it can be seen that these cores show a sediment inventory of stable lead that is definitely higher than the expected atmospheric stable lead inventory (hatched area).
Our results thus suggest that, apart from the atmo- spheric input, there is an input specific for Lake Constance. As the river Alpenrhein is the main inlet to Lake Con- stance, this river is probably responsible for the additional stable lead input to the lake.
Future work should investigate the possible sources
such as: coal-burning in steam engines, which ran in the Lake Constance area until the 1960s, and private coal- burning; pollution of the air as a consequence of increasing industrialization in Friedrichshafen and around Lake Con- stance; inflow of sewages or sewage muds- -un t i l the 1960s water and sewage pipes consisted of lead and these pipes might be partly responsible for the pollution of Lake Con- stance with stable lead; pollution of the Alpenrhein due to industr ial izat ion-- the decrease of the stable lead concen- tration in the 1960s might reflect the increased building of sewage plants; and industrial pollution through smaller in le t s - -a point injection seems to be unlikely, however.
The different temporal positions of lead and zinc max- ima may indicate that more than one source may be re- sponsible for the pollution of Lake Constance sediments, but that it is more likely to be an effect of several anthro- pogenic sources. Investigations on other cores of Lake Constance and other lakes near this area might give more detailed information about the origin of lead pollution.
274
Conclusion
The results of radioisotopic dating and lamination counting are consistent within the confidence interval. The maxima of the bomb isotopes yield two independent time markers, which allow dating the maximum stable lead injections in cores BO90/13b and BO90/17b at about 1960. The stable lead distributions in other cores (CS6, CS7, CS8, and CS10) confirm this result.
Americium, the radioactive daughter of 241pu, can be detected by 7-spectrometry and can be used as a further time marker. The americium maximum is located in the same layer as the maximum of bomb cesium. The position of both maxima confirm the reliability of the constant-flux dating model for 21~
The depth profiles of stable lead in Lake Constance sediments do not reflect the gasoline lead input function for Germany for the last 40 years. In this work we have shown that there is a maximum input of stable lead dated radiometrically at about 1960, just beneath the layer with the maxima of bomb cesium and americium.
It is more likely that industrialization along the Alpen- rhein and around Lake Constance is responsible for the distribution of stable lead in the sediments than gasoline lead. Both the rivers and the atmosphere were polluted by increasing regional industrialization. The decrease of the lead concentration in the 1960s may be a consequence of the increase in sewage plants in those years.
References
Appel I (1982) Das Verhalten von 21~ und 21SPo im limnischen Milieu am Beispiel des Bodensee-Obersees. Diploma thesis. Heidelberg: Institut fiir Umweltphysik Heidelberg
Barth M (1984) Blei-210 im Bodensee. Diploma thesis. Heidelberg: Institut fiir Umweltphysik Heidelberg
Benninger LK, Aller RC, Cochran JK, and Turekian KK (1979) Effects of biological sediment mixing on the 21~ chronology and trace metal distribution in a Long Island sound sediment core. Earth Planet Sci Lett 43:241-259
Christian M (1987) C~isium und Ruthenium im Bodensee. Diploma thesis. Heidelberg: Institut fiir Umweltphysik Heidelberg
DSrr H (1991) Aufbau, Inbetriebnahme und Optimierung eines emp- findlichen, hochauflSsenden Messsystems zur "low-level" 7- Spektroskopie. Heidelberg: Institut fiir Umweltphysik Heidelberg
D6rr H and Miinnich KO (1991) Lead and cesium transport in european forest soils. Water, air and soil pollution 57-58:809 819
D6rr H, Mangini A, Schmitz W, Weber F, and Mfinnich KO (1989) Stable lead and 2~~ in German lake sediments and soils: A tracer for anthropogenic lead emission. In: Vernet JP (Ed), Heavy metals in the environment. Versoix, Switzerland: Institut F.-A. Forel, University Genf. pp 247-261
Dominik J, Mangini A, and Miiller G (1981) Determination of recent deposition rates in Lake Constance with radioisotopic methods. Sedimentology 28:653 677
Dominik J, Mangini A, and Prosi F (1984) Sedimentation rate varia- tions and anthropogenic metal fluxes into Lake Constance sedi- ments. Environ Geol 5(3): 151-157
Goldberg ED (1963) Radioactive dating. International Atomic En- ergy Agency. Vienna. STI/PUB/68:121 131
Koide M, Bruland KW, and Goldberg ED (1973) Th-228/Th-232 and Pb-210 geochronologies in marine and lake sediments. Geochim Cosmochim Acta 37:1171-1187
Krishnaswami S, Lal D, Martin JM, and Meybeck M (1971) Geo- chronology of lake sediments. Earth Planet Sci Lett 11:407-414
Mangini A, Christian U, Barth M, Schmitz W, and Stabel HH (1987) Pathway and residence times of radio-tracers in Lake Constance. In: Tilzer MM and Serruya C (ed): Large Lakes: ecological struc- ture and function. Springer Verlag: pp 245-264
Miiller G (1977) Schadstoffuntersuchungen an datierten Sediment- kernen aus dem Bodensee-II. Z Naturforsch 32c:913-919
Robbins JA and DN Edgington (1975) Determination of recent sedi- mentation rates in Lake Michigan using Pb-210 and Cs-137. Geochim Cosmochim Acta 39:285-304
Rossknecht H (1984) Internationale Gew~isserschutzkommision fiir den Bodensee, 31
yon Gunten HR and Moser RN (1993) How reliable is the 21~ dating method? Old and new results from Switzerland. J Paleolimnol 9:161-178
von Gunten HR, Sturm M, Erten HN, RSssler E, and Wegmiiller F (1987) Sedimentationrates in the central Lake Constance determined with 21~ and x37Cs. Schweiz Z Hydrol 49(3):275- 283
Wessels M, Lenhard A, Giovanoli F, and BollhSfer A (1993) High resolution time series of lead and zinc in sediments of Lake Constance. Aquat Sci (submitted)