high resolution fundus imaging by confocal scanning laser ophthalmoscopy in the mouse
TRANSCRIPT

Vision Research 46 (2006) 1336–1345www.elsevier.com/locate/visres
High resolution fundus imaging by confocal scanning laser ophthalmoscopy in the mouse
Michel Paques a,b,c,¤, Manuel Simonutti a, Michel J. Roux a, Serge Picaud a, Etienne Levavasseur d, Caren Bellman c, José-Alain Sahel a,b,c
a Laboratory of Cellular and Molecular Physiopathology of the Retina, National Institute for Health and Medical Research (INSERM Unité 592), Paris, France
b Fondation Ophtalmologique Rothschild, Paris, Francec Centre Hospitalier National d’Ophtalmologie des Quinze-Vingts, Paris, France
d Unité INSERM 712, Paris, France
Received 21 March 2005; received in revised form 15 September 2005
Abstract
We evaluated fundus imaging using a modiWed confocal scanning laser ophthalmoscope (cSLO) in mice. Examinations were per-formed in conscious, untrained mice. The largest Weld of view measured 1520 £ 1520 �, with a signiWcant interindividual variability, itselfcorrelated to biometric variability. The composite Weld of view extended up to the ora serrata. The reXectance imaging associated lightreXection from nerve Wber bundles and vessel walls, and absorption by hemoglobin and melanin. Light absorption by the pigment epithe-lium indeed increased the contrast of the nerve Wber layer, but impaired viewing of the choroid. Due to the confocal mode, Xuorescenceangiograms with clear separation of retinal and choroidal Xuorescence could be obtained even in albino mice. Micrometric-scale trans-verse resolution and several planes of optical sectioning within the retina were obtained. This permitted for instance tridimensional, sub-cellular viewing of gfp-expressing retinal microglial cells in CX3CR1 mice. We concluded that cSLO is a promising tool for noninvasive,multimodal intravital microscopy of the fundus in the mouse. 2005 Elsevier Ltd. All rights reserved.
Keywords: Scanning laser ophthalmoscopy; Mouse; Fluorescein angiography; Indocyanine green angiography; Green Xuorescent protein
1. Introduction
Imaging the fundus in vivo in experimental models ofretinal diseases is of great interest for screening purposes,for characterization of the natural history of retinal dis-eases or for monitoring therapeutic eVects. Fundus imagingis indeed less time-consuming than histology and is poten-tially more precise in deWning the extent of a lesion. Fur-thermore, for ethical reasons, and because expensive and/orfragile animals such as transgenic or aging mice are oftennecessary for medical research, limiting the number of
* Corresponding author. Tel.: +33 1 48 29 66 61; fax: +33 1 48 29 46 05.E-mail address: [email protected] (M. Paques).
0042-6989/$ - see front matter 2005 Elsevier Ltd. All rights reserved.doi:10.1016/j.visres.2005.09.037
experimental animals used and the invasiveness of explora-tions is desirable.
There are as yet, however, several limitations to conven-tional fundus photography techniques in the mouse (DiLo-reto, Grover, del Cerro, & del Cerro, 1994; Hawes, Smith, &Chang, 1999), and thus it remains of limited quality com-pared to human fundus imaging. For instance, Xuoresceinangiography, which is the most common technique for ves-sel imaging in humans, is aVected by the background Xuo-rescence from the choroid in albino animals. As aconsequence, several aspects of the mouse fundus remain tobe fully described. To the best of our knowledge, there areno report of choroidal vascular imaging in rodents, andthere are few reports of the imaging of green Xuorescentprotein (gfp)-expressing cells of the retina despite theirwidespread use in biomedical research.

M. Paques et al. / Vision Research 46 (2006) 1336–1345 1337
The scanning laser ophthalmoscope (SLO) is a fundusimaging technique based on the scanning of the funduswith a laser beam from a point source, while the reXectedlight is detected by a photomultiplier. Incident and reXectedlight follow a coaxial path. Therefore, more light can pene-trate small eyes than with conventional fundus cameras.Several reports of SLO imaging in rats have been published(Cordeiro, Guo, & Luong, 2004; Genevois, Paques, &Sercombe, 2004; Hossain, Liversidge, & Cree, 1998;Khoobehi & Peyman, 1999; Le Gargasson, Paques, &Guez, 1997; Nishiwaki, Ogura, Kimura, Kiryu, & Honda,1995), most of them being hemodynamic studies. Compara-tively, there is little available data on SLO imaging in mice(Jaissle, May, & Reinhard, 2001; Vicent, Ilany, & Kondo,2003; Xu, Manivannan, & Liversidge, 2003) despite theirmore common use as experimental models of ophthalmicdiseases. Overall, there has been no evaluation of SLO as afundus imaging method in rodents. Therefore, we under-took the present study, aimed at evaluating fundus imagingobtained with a confocal SLO (cSLO) in mice.
2. Materials and methods
The Heidelberg Retina Angiograph (Heidelberg Engi-neering, Dossenheim, Germany) is a digital cSLO equippedwith four laser wavelengths (488, 514, 788 and 820 nm),with Wlters for Xuorescein and indocyanine green (ICG)Xuorescence. To adapt the commercial system to the opticsof the mouse eye, the 40 mm focal lens of the front objectivewas replaced by a 25 mm focal lens (Linos Optics, Milford,MA). The Wnest deWnition is 512 £ 512 pixels, with threeangles of view (nominal values of 10°, 20° and 30°). Thefocus is adjustable over a +11/¡11 diopters range. A video
acquisition mode (up to 20.6 images per second) is avail-able. Within any area of interest, a stack of tomographicimages (z-scans) can be automatically acquired. The built-in software was used for post-processing the images, includ-ing alignment, adjustment of contrast, construction of amean image and/or of a composite image. Averaging wasindeed required to increase the signal-to-noise ratio of fun-dus autoXuorescence.
Adult C57/BL6 and balb/c mice were provided by Jan-vier (Saint-Ile le Genest, France) or Charles Rivers(L’Arbresle, France). All experiments were performed inaccordance with the Association for Research in Visionand Ophthalmology statements on the care and use of ani-mals in ophthalmic research. Throughout the examinationprocess, a calm, quiet ambiance with dim illumination wasmaintained. Vibrissae were not trimmed. Pupil dilation wasperformed with topical 1% tropicamide (CibaVision, Paris,France). Careful slit-lamp examination before SLO proce-dure ruled out the presence of any corneal or lens opacities.
Mice were manually held in front of the cSLO, in anupright position. As a rule, restraint and rest periods alter-nated approximately every 20 s. The examination wasinterrupted if the animal showed any manifest sign offatigue.
Plasma labeling by Xuorescent dyes such as Xuoresceinsodium or by indocyanine green (ICG) is the usual tech-nique for retinal and choroidal vessel imaging in humans.For Xuorescein angiography, 50�l of 10% sodium Xuores-cein (Ciba Vision) was injected intraperitoneally. For ICGangiography, 0.1 mg of Infracyanine (Société d’Etude et deRecherches Biologiques, Paris, France) dissolved in 50�lof glucose water was injected into the tail vein, andcSLO examination was performed immediately thereafter
Fig. 1. Illustration of cSLO imaging in C57 (A, C, E, G, I) and balb/c (B, D, F, H, J) mice (A and B) 514 nm laser; (C and D) infrared imaging; (E and F)average of 12 autoXuorescence images at 488 nm; (G and H) Xuorescein angiography; (I and J) ICG angiography. Note that the nerve Wber layer is moreclearly visible in the pigmented mouse (A), while the ICG angiogram is of better quality in the albino mouse (J).

1338 M. Paques et al. / Vision Research 46 (2006) 1336–1345
(i.e., within seconds). It was indeed crucial to examine themouse as soon as possible after ICG injection, because thecontrast of ICG-Wlled choroidal vessels rapidly fades due toextravascular leakage of the dye.
The screen magniWcation was estimated by comparingthe in vivo and most-mortem diameter of the optic disc of10 C57/BL6 mice. The axial and transverse resolutionsand the potential of cSLO for gfp detection were evalu-ated in CX3CR1 transgenic mice, in which cells of microg-lial lineage express gfp under the control of the fractalkinereceptor gene promoter (Jung, Aliberti, & Graemmel,2000). Tridimensional localization of gfp+ cells per-formed in vivo was compared to histology. Finally, toevaluate the tolerance of the photoreceptors to the cSLOprocedure, Wve albino mice, which are known to be moresensitive to light-induced photoreceptor degenerationthan pigmented mice (Hayes & Balkema, 1993; Williams,Howard, & Williams, 1985), were exposed to 488 nm laserillumination over a period of 2 min with the nominal 30°Weld. This duration is approximately three times the dura-
tion of illumination during a standard SLO session. Theillumination Weld was centered on the optic nerve toensure proper recognition of the illuminated retina on his-tological slides. One month later, the mice were sacriWcedand their eyes processed for rhodopsin immunolabelingusing standard procedures.
3. Results
Satisfactory fundus imaging could be obtained routinely.Manually restraining the mouse allowed to obtain a stableimage during 5–10 s, which could be repeated after a shortrest period. In our experience the image quality was betterthan that obtained in anesthetized animals, which fre-quently develops acute clouding of the ocular mediabecause of the absence of blinking and of body temperatureregulation. The wavelength did not appear to inXuence thebehavior of the animals. Mice younger than 1 month couldnot be satisfactorily imaged because of the very small sizeof their eye.
Fig. 2. (A–C) Relationship between the size of the optic nerve head and the width of the cSLO image. (A) cSLO infrared imaging of a mouse optic nervehead. (B) Retroilluminated Xat-mount of the optic nerve head shown in (A). (C) Correlation between the diameter of the optic nerve head in microns
(x-axis) and the 30° nominal image width (y-axis) in 10 eyes, indicating that the width of the cSLO image is correlated to the diameter of the optic nerve.
M. Paques et al. / Vision Research 46 (2006) 1336–1345 1339
Representative examples of fundus imaging in pigmentedand albino mice are shown in Fig. 1. The degree of pigmenta-tion inXuenced fundus imaging. Imaging of the nerve Wberlayer (NFL) was indeed of better quality in pigmented mice,probably because the absence of reXected light from the cho-roid and sclera increased the contrast between the Wber bun-dles and the dark background. Moreover, to avoidoverexposure in albino eyes by the 514 nm laser, it was neces-sary to attenuate the incident light by a yellow Wlter, whichgenerated a central artefact (not shown). Conversely, imagingof the choroid by ICG angiography was of better quality inalbino animals. Fluorescein angiography and autoXuores-cence imaging were of similar quality in both strains.
The width of a nominal 30° image, measured in 10 eyes,ranged from 1242 to 1701�m (mean, 1519�m). There was astrong correlation between the diameter of the optic nervehead measured ex vivo and the width of the cSLO image(Fig. 2), that is, the larger the optic nerve, the larger the cSLOWeld, suggesting that axial length inXuences signiWcantly themagniWcation. MagniWcation was not altered by defocusingas appreciated on serial z-scans (data not shown).
The correspondence between the dioptric step and thefocus shift was estimated by successively focusing on thediVerent microvessel layers during Xuorescein angiography.Thus, the focus span in the z axis (¡11 to +11 diopters) withthe 488 nm laser was in the magnitude of 240�, whichallowed to image the entire retinal thickness. Within this
focus span, several optical section planes could be observed.Optical sectioning in the z-axis with the 514 nm laser (Fig. 3)allowed to successively image the NFL, the inner retina, thedeep microvessel layer, and the retinal pigment epithelium. Itis known that retinal microvessels form three parallel layers,interconnected in such a way that the inner (superWcial) layeris of arteriolar nature, while the outer (deep) layer comprisescapillaries and post-capillary venules. These layers are inter-connected by short perpendicular capillary segments(Paques, Tadayoni, & Sercombe, 2003). By cSLO these con-necting capillaries appeared as dark spots, because of theabsorption of the 514nm wavelength by hemoglobin (arrowsin Figs. 3B, E, and F). Conversely, the capillaries that wereparallel to the retinal surface were hyperreXective (Fig. 3C),probably because of their cylindrical shape, as for the NFLbundles (Berendschot, DeLint, & van Norren, 2003).
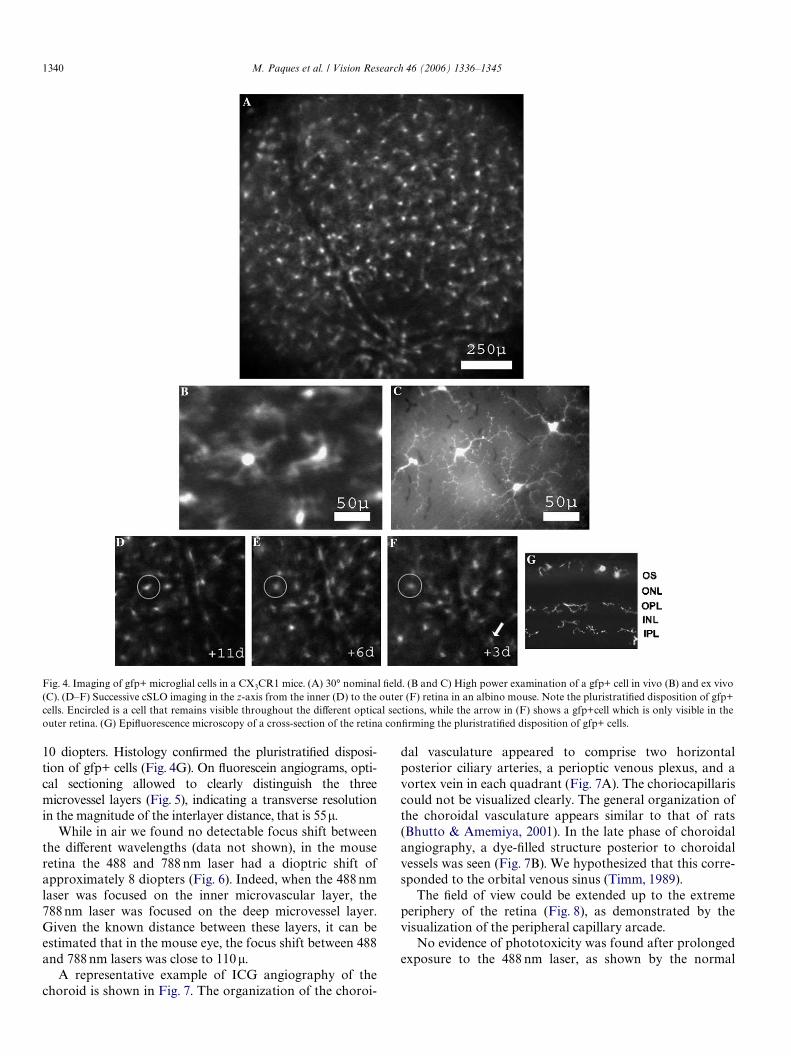
Axial and transverse resolutions were estimated on Xuores-cence imaging. High magniWcation viewing of gfp+ microglialcells (Fig. 4) enabled to image the general morphology of thegfp+ cells and to distinguish the perikarya from the Wrst-orderdendrites (Figs. 4B and C). The Wrst-order dendrites had amean width of 2� ex vivo, and an apparent width of 5–6�in vivo. Therefore, the transverse resolution of gfp+ cells, thatis the minimal distance allowing to separate two cells wasclose to 10�. Serial optical sectioning suggested a pluristrati-Wed disposition of microglial cells (Figs. 4D–F). In the z-axis, asingle gfp+ cell was seen over a focus span of approximately
Fig. 3. High magniWcation cSLO z-scanning. (A–D) Successive optical sections with the 514 nm laser from the nerve Wber layer (A) to the retinal pigmentepithelium (D) in a C57 mouse. Note in (C) the light reXection from the deep microvessel layer. (E and F) Correspondence between the black dots seen inthe inner retina with the 514 nm laser (arrows in B and E) and the transverse capillaries (arrows in F) seen on Xuorescein angiograms.
1340 M. Paques et al. / Vision Research 46 (2006) 1336–1345
10 diopters. Histology conWrmed the pluristratiWed disposi-tion of gfp+ cells (Fig. 4G). On Xuorescein angiograms, opti-cal sectioning allowed to clearly distinguish the threemicrovessel layers (Fig. 5), indicating a transverse resolutionin the magnitude of the interlayer distance, that is 55�.
While in air we found no detectable focus shift betweenthe diVerent wavelengths (data not shown), in the mouseretina the 488 and 788 nm laser had a dioptric shift ofapproximately 8 diopters (Fig. 6). Indeed, when the 488 nmlaser was focused on the inner microvascular layer, the788 nm laser was focused on the deep microvessel layer.Given the known distance between these layers, it can beestimated that in the mouse eye, the focus shift between 488and 788 nm lasers was close to 110�.
A representative example of ICG angiography of thechoroid is shown in Fig. 7. The organization of the choroi-
dal vasculature appeared to comprise two horizontalposterior ciliary arteries, a perioptic venous plexus, and avortex vein in each quadrant (Fig. 7A). The choriocapillariscould not be visualized clearly. The general organization ofthe choroidal vasculature appears similar to that of rats(Bhutto & Amemiya, 2001). In the late phase of choroidalangiography, a dye-Wlled structure posterior to choroidalvessels was seen (Fig. 7B). We hypothesized that this corre-sponded to the orbital venous sinus (Timm, 1989).
The Weld of view could be extended up to the extremeperiphery of the retina (Fig. 8), as demonstrated by thevisualization of the peripheral capillary arcade.
No evidence of phototoxicity was found after prolongedexposure to the 488 nm laser, as shown by the normal
Fig. 4. Imaging of gfp+ microglial cells in a CX3CR1 mice. (A) 30° nominal Weld. (B and C) High power examination of a gfp+ cell in vivo (B) and ex vivo(C). (D–F) Successive cSLO imaging in the z-axis from the inner (D) to the outer (F) retina in an albino mouse. Note the pluristratiWed disposition of gfp+cells. Encircled is a cell that remains visible throughout the diVerent optical sections, while the arrow in (F) shows a gfp+cell which is only visible in theouter retina. (G) EpiXuorescence microscopy of a cross-section of the retina conWrming the pluristratiWed disposition of gfp+ cells.

M. Paques et al. / Vision Research 46 (2006) 1336–1345 1341
appearance of the photoreceptor outer segments in the illu-minated area (Fig. 9).
Several models of experimental retinal degeneration werealso examined. The rd mouse is a model of outer retinaldegeneration leading to a complete loss of photoreceptors.By cSLO, while the inner retina appears normal (Fig. 10A),retinal pigment epithelium atrophy with loss of the fundusautoXuorescence was observed (Fig. 10). The rd7 mouse is amodel of retinal dystrophy in which a mutation in the PNRgene leads to the formation of rosettes in the outer nuclearlayer (Akhmedov, Piriev, Chang, Rapoport, & Hawes, 2000).Optical sectioning by cSLO clearly showed that rosettes arelocated in the outer retina (Figs. 10C and D).
4. Discussion
We report here that cSLO allows multimodal fundusimaging in mice, with high axial and transverse resolutions.Compared to cSLO imaging in humans with the HRA, thescreen magniWcation was approximately 5 times higher(1519 versus 7500 �) and, accordingly, the transverse andaxial resolution appeared higher. Indeed, the transverse res-
olution allowed to image micrometer-scale structures suchas the nerve Wber bundles and the dendrites of microglialcells. The disposition of the nerve Wber bundles in a singleplane (Radius & de Bruin, 1981) over a pigmentedbackground, together with their cylindrical shape, explainsthe high reXectance of the NFL in pigmented animals(Knighton & Huang, 1999). Comparatively, the axial reso-lution in the human eye is approximately equivalent to theretinal thickness (Heidelberg Engineering, data on line).Thus, Xuorescein angiography in albino mice with minimalbackground noise from the choroid could be performed.However, in albino eyes, with the 514 nm laser, the strongreXection from the sclera signiWcantly impaired NFL imag-ing.
Overall, cSLO appears as a powerful technique forin vivo cellular imaging in the retina, which complementshistology in several aspects. For instance, compared to his-tology, cSLO allows convenient en face (xy) imaging whichis well adapted to visualize retinal structures such as thenerve Wber layer and the microvessels layers, to documentfundus autoXuorescence and to perform gfp+ cell counts,as illustrated in Fig. 4A.
Fig. 5. High magniWcation Xuorescein angiography in a balb/c mouse. From the inner to the outer retina, the superWcial (A), intermediate (B), and deep (C)microvessel layers are successively observed.

1342 M. Paques et al. / Vision Research 46 (2006) 1336–1345
Some limitations to cSLO imaging have to be takeninto account when designing studies or interpretingresults of cSLO. cSLO images are by nature monochro-matic, and thus cannot replace color photography and/orbiomicroscopic examination. Due to the limited Weld of asingle image, imaging the entire retina was tedious and
not feasible on a routine basis in a conscious animal. Wefound an important variability of magniWcation betweenmice, which is probably related to the axial length (and/orthe refraction) which is itself related to the age of themouse (Schmucker & SchaeVel, 2004). Finally, as the sur-face of the mouse retina is grossly 1/16 of that in the
Fig. 6. Illustration of the focus shift between 488 and 788 nm wavelength. Fluorescein (488 nm; A and C) and ICG (788 nm; B and D) angiographies weresimultaneously performed. The deep microvessel layer was in focus at +11diopters setting with the 788 nm laser (arrows in B), and at +3 diopters settingwith the 488 nm laser (arrows in C).
Fig. 7. Composite wide Weld ICG angiography of the choroidal vasculature in a balb/c mouse. (A) Early phase. The overall organization of the choroidalvasculature is clearly visible (ca, ciliary artery; vv, vortex veins; on, optic nerve); (B) late phase. A large dye-Wlled structure (arrowheads) is visible, whichmay correspond to the orbital venous sinus.

M. Paques et al. / Vision Research 46 (2006) 1336–1345 1343
Fig. 9. Rhodopsin immunolabeling of balb/c mouse eye exposed to 488 nmlaser continuous illumination over a period of 2 min. There is no lesionsuggestive of light-induced retinal degeneration (right: control). OS, outersegments; IS, inner segments; ONL, outer nuclear layer; INL, innernuclear layer. Bar, 50 �.
human retina, an increase of the risk of light damage islikely since the power of the incident light is notadjustable (except for the 788 nm laser). However, wefound no retinal lesions indicative of laser-induced retinaldegeneration even after prolonged exposure to the 488 nmlaser. Nevertheless, it seems advisable to limit the dura-tion of examinations to the minimum required for dataacquisition, to repeat short exposures rather than performa long continuous one, and to use wide angle imaging,especially when viewing gfp+ cells with the 488 nm laserand/or in retinal dystrophy models.
Future developments of cSLO imaging may include dou-ble labeling imaging and molecular studies. The capabilityto perform simultaneously two Xuorescence imaging may,for instance, enable to simultaneously image ICG retro-gradelly labeled ganglion cells (Paques, Genevois, & Rég-nier, 2003) and gfp+ cell. Recently, Cordeiro et al. (2004)showed that apoptotic cell death of retinal ganglion cells inrats can be detected by SLO after intravitreal injection ofXuorescent antibodies to annexin. Other current applica-tions of cSLO that were not illustrated here concern retinaland choroidal hemodynamics. Overall, due to its capacityto obtain three dimensional, dynamic, high deWnition imag-ing in conscious mice, confocal scanning laser ophthalmos-copy can be considered as an equivalent of intravitalmicroscopy. cSLO therefore holds promising perspectives
Fig. 8. Composite Xuorescein angiography from the disc to the extreme periphery of the retina. Arrows and arrowhead in the insert shows the peripheralcapillary arcade.

1344 M. Paques et al. / Vision Research 46 (2006) 1336–1345
for experimental research on diseases of the retina, choroidand optic nerve.
Acknowledgments
Mathias Fradot for providing the rd7 mice; Laura Menudit Huart, Jean-Armand Chiappore, and Virginie Saulnierfor microscopy studies. The present work was supported byRetina France, la Fédération des Aveugles et HandicapésVisuels de France, the INSERM, the University Pierre andMarie Curie (Paris VI), Assistance Publique-Hopitaux deParis (AP-HP), Alcon corporation, and the EU (IntegratedProject EVI-GENORET LSHG-CT-2005-521036).
References
Akhmedov, N. B., Piriev, N. I., Chang, B., Rapoport, A. L., Hawes, N. L., etal. (2000). A deletion in a photoreceptor-speciWc nuclear receptormRNA causes retinal degeneration in the rd7 mouse. Proceedings ofthe National Academy of Sciences of the United States of America, 97,5551–5556.
Berendschot, T. T., DeLint, P. J., & van Norren, D. (2003). Fundus reXec-tance: Historical and present ideas. Progress in Retinal and EyeResearch, 22, 171–200.
Bhutto, I. A., & Amemiya, T. (2001). Microvascular architecture of the ratchoroid: Corrosion cast study. Anatomical Record, 264, 63–71.
Cordeiro, M. F., Guo, L., Luong, V., et al. (2004). Real-time imaging of sin-gle cell apoptosis in retinal neurodegeneration. Proceedings of the
National Academy of Sciences of the United States of America, 101,13352–13356.
DiLoreto, D. Jr., Jr., Grover, D. A., del Cerro, C., & del Cerro, M. (1994). Anew procedure for fundus photography and Xuorescein angiography insmall laboratory animal eyes. Current Eye Research, 13, 157–161.
Genevois, O., Paques, M., Sercombe, R., et al. (2004). Microvascularremodeling following experimental occlusion-recanalization of a reti-nal vein in rats. Investigative Ophthalmology & Visual Science, 45,594–600.
Hawes, N. L., Smith, R. S., Chang, B., et al. (1999). Mouse fundus photog-raphy and angiography, A catalogue of normal and mutant pheno-types. Molecular Vision, 5, 22.
Hayes, J. M., & Balkema, G. W. (1993). Visual thresholds in mice, compar-ison of retinal light damage and hypopigmentation. Visual Neurosci-ence, 10, 931–938.
Hossain, P., Liversidge, J., Cree, M. J., et al. (1998). In vivo cell tracking byscanning laser ophthalmoscopy, quantiWcation of leukocyte kinetics.Investigative Ophthalmology & Visual Science, 39, 1879–1887.
Jaissle, G. B., May, C. A., Reinhard, J., et al. (2001). Evaluation of the rho-dopsin knockout mouse as a model of pure cone function. InvestigativeOphthalmology & Visual Science, 42, 506–513.
Jung, S., Aliberti, J., Graemmel, P., et al. (2000). Analysis of fractalkinereceptor CX3CR1 function by targeted deletion and green Xuores-cent protein reporter gene insertion. Molecular Cell Biology, 20,4106–4114.
Khoobehi, B., & Peyman, G. A. (1999). Fluorescent labeling of blood cellsfor evaluation of retinal and choroidal circulation. Ophthalmic Surgeryand Lasers, 30, 140–145.
Knighton, R. W., & Huang, X. R. (1999). Directional and spectral reXec-tance of the rat retinal nerve Wber layer. Investigative Ophthalmology &Visual Science, 40, 639–647.
Fig. 10. 514 nm imaging of mouse models of retinal dystrophies. (A and B) Fundus images of a 12 months-old rd mouse focused at two diVerent levels (A,inner retina; B, outer retina), showing in (A) a normal-appearing nerve Wber layer, and in (B) peripapillary atrophy of the retinal pigment epithelium. Insetin (B) shows the loss of autoXuorescence in the area of pigment epithelium atrophy. (C and D) cSLO fundus imaging of a rd7 mouse, focused in (C) in theinner retina, which appears normal, and in (D) on the outer retina, demonstrating the deep location of the retinal lesions. Bar, 500 �.

M. Paques et al. / Vision Research 46 (2006) 1336–1345 1345
Le Gargasson, J. F., Paques, M., Guez, J. E., et al. (1997). Scanninglaser ophthalmoscope imaging of Xuorescein-labelled blood cells.Graefes Archive for Clinical and Experimental Ophthalmology, 235,56–58.
Nishiwaki, H., Ogura, Y., Kimura, H., Kiryu, J., & Honda, Y. (1995).Quantitative evaluation of leukocyte dynamics in retinal microcircula-tion. Investigative Ophthalmology & Visual Science, 36, 123–130.
Paques, M., Tadayoni, R., Sercombe, R., et al. (2003). Structural andhemodynamic analysis of the mouse retinal microcirculation. Investiga-tive Ophthalmology & Visual Science, 44, 4960–4967.
Paques, M., Genevois, O., Régnier, A., et al. (2003). Axon-tracing properties ofindocyanine green. Archives of Ophthalmology, 121, 367–370.
Radius, R. L., & de Bruin, J. (1981). Anatomy of the nerve Wber layer.Investigative Ophthalmology & Visual Science, 21, 745–749.
Schmucker, C., & SchaeVel, F. (2004). A paraxial schematic eye model forthe growing C57BL/6 mouse. Vision Research, 44, 1857–1867.
Timm, K. I. (1989). Orbital venous anatomy of the Mongolian gerbil withcomparison to the mouse, hamster and rat. Laboratory Animal Science,39, 262–264.
Vicent, D., Ilany, J., Kondo, T., et al. (2003). The role of endothelial insulinsignaling in the regulation of vascular tone and insulin resistance. Jour-nal of Clinical Investigation, 11, 1373–1380.
Williams, R. A., Howard, A. G., & Williams, T. P. (1985). Retinal damagein pigmented and albino rats exposed to low levels of cyclic light fol-lowing a single mydriatic treatment. Current Eye Research, 4, 97–102.
Xu, H., Manivannan, A., Liversidge, J., et al. (2003). Requirements for pas-sage of T lymphocytes across non-inXamed retinal microvessel. Journalof Neuroimmunology, 142, 47–57.