high passage rates and different seasonal migration
TRANSCRIPT

Vol. 9(6), pp. 183-199, June 2017
DOI: 10.5897/IJBC2016.1046
Article Number: 5C70DE564321
ISSN 2141-243X
Copyright © 2017
Author(s) retain the copyright of this article
http://www.academicjournals.org/IJBC
International Journal of Biodiversity and
Conservation
Full Length Research Paper
High passage rates and different seasonal migration strategies of birds along the lower Texas coast
Suzanne Contreras Walsh1, Bart M. Ballard1*, David B. Wester1, William P. Kuvlesky Jr.1, Leonard A. Brennan1, Michael L. Morrison2 and Kathy Boydston3
1Caesar Kleberg Wildlife Research Institute, Texas A&M University-Kingsville, Kingsville, TX, 78363, USA.
2Department of Wildlife and Fisheries Sciences, Texas A&M University, College Station, Texas, USA.
3Texas Parks and Wildlife Department, Austin, Texas, USA.
Received 18 October, 2016; Accepted 30 March, 2017
This research examined nocturnal and diurnal bird migration using an automated marine radar system during three autumn (August 15 to November 17) and three spring (March 15 to June 1) periods in 2007–2010 along the lower Texas coast. We quantified migration timing, magnitude, and flight altitudes for over 14 million targets during 16,360 h of radar operation. Autumn migration was prolonged in contrast to spring migration, which was concentrated within a four-week period in mid–April to mid–May. Mean migration traffic rate in autumn averaged 1,186 targets km
-1 h
-1 and was 46% greater than spring.
Migration traffic rates at our northern site were at least 62% higher than at our southern site. We found bird passage to be similar between diurnal and nocturnal periods in autumn, but predominately nocturnal (68% of targets) in spring. Mean flight altitudes were 10-33% higher in spring than autumn. Our results confirm that the lower Gulf coast of Texas is a significant migration corridor concentrating millions of birds during migration. This new information on temporal and spatial dynamics of migration provides guidance for the placement and operation of wind power developments to reduce the risk to migratory birds along the lower Texas coast. Key words: Bird migration, coast, flight altitude, marine radar, migration traffic rates, Texas, wind power.
INTRODUCTION Migration behavior has evolved in many species of birds to take advantage of seasonally available resources in temperate regions to increase reproductive success (Pulido, 2007; Ramenofsky and Wingfield, 2007). Each year millions of birds migrate vast distances between
their breeding and wintering areas to benefit from seasonal environments (Moore et al., 1993; Alerstam et al., 2003; Pulido, 2007; Ramenofsky and Wingfield, 2007), but we are still far from understanding many aspects of this important life cycle phase in birds
*Corresponding author. E-mail: [email protected].
Author(s) agree that this article remains permanently open access under the terms of the Creative Commons Attribution
License 4.0 International License

184 Int. J. Biodivers. Conserv. (Faaborg et al., 2010). Much of our knowledge about bird migration along the Gulf of Mexico has pertained to broad-scale patterns of timing and spatial extent of trans-Gulf migration (Gauthreaux, 1971; Gauthreaux and Belser, 1998; Gauthreaux, 1999). Investigations have concentrated more on describing details of spring migration than autumn migration (Able, 1972; Buskirk, 1980; Gauthreaux, 1999), and most studies have been conducted on the northern Gulf coast (Gauthreaux, 1971; Gauthreaux and Belser, 1998; Gauthreaux, 1999). There has been considerably less research carried out in areas along the western Gulf Coast (Forsyth and James, 1971; Langschied, 1994; Arnold, 2009), and many fine-scale characteristics of bird migration have not been sufficiently studied in these areas. Consequently, most information on bird migration in this region comes from anecdotal observations or volunteer-driven surveys.
The Texas coast is well known as an important region that supports birds during migration with >400 species known to traverse the region during autumn or spring migrations (Rappole and Blacklock, 1985; Stutzenbaker and Weller, 198; Shackelford and Lockwood, 2005). The lower Texas coast contains large tracts of relatively undeveloped habitat that attracts birds during migration and is well situated to serve as a critical corridor for migratory birds (Fulbright and Bryant, 2002). Limited information makes it problematic to assess impacts of human development on migratory birds in this region, which has led to a great need for research to quantify bird migration characteristics along the lower Texas coast. Quantifying the temporal and spatial use of the landscape by migratory birds is important because this information can be coupled with factors that influence their movements, such as weather patterns, land use changes, etc. Such information on bird migration enables resource managers to predict how birds will be impacted by human development and improves their ability to curtail potential negative effects on birds. It also allows managers to determine whether management strategies are effective for bird-habitat conservation (Faaborg et al., 2010). The need to better understand bird migration is particularly relevant given the recent upsurge of development interests along the lower Texas coast, particularly large-scale wind farms (Kuvlesky et al., 2007). Wind energy development has the potential to greatly impact migratory birds through large-scale habitat alteration, as well as creating obstructions within the airspace that can become problematic when these man-made structures correspond to height of migratory movement (Kuvlesky et al., 2007). Because the spatial arrangement of stopover habitats and the temporal availability of resources along migration routes are important to the migration strategies of birds (Moore et al., 1995), it is essential to have a thorough understanding of the movement patterns of migratory birds.
Effectively monitoring bird migration has been difficult because many species migrate over a large geographic extent, migrate at night, or travel at altitudes that limit the utility of visual observations. Recent advances in technology have made radar an effective method to assess movements of migrating birds (Gauthreaux and Belser, 2005; Kunz et al., 2007; Bridge et al., 2011). Here, we applied radar technology to measure key metrics of bird migration to generate baseline information on bird migration patterns along the lower Texas coast. Our objective was to quantify the chronology, magnitude, and flight altitudes of migrating birds during migration along the lower Texas coast. Key information on peak migration timing and magnitude, as well as the flight altitudes during migration can be used to predict seasonal and daily periods when birds may be most at risk for collisions with wind turbines.
METHODOLOGY
Study area description
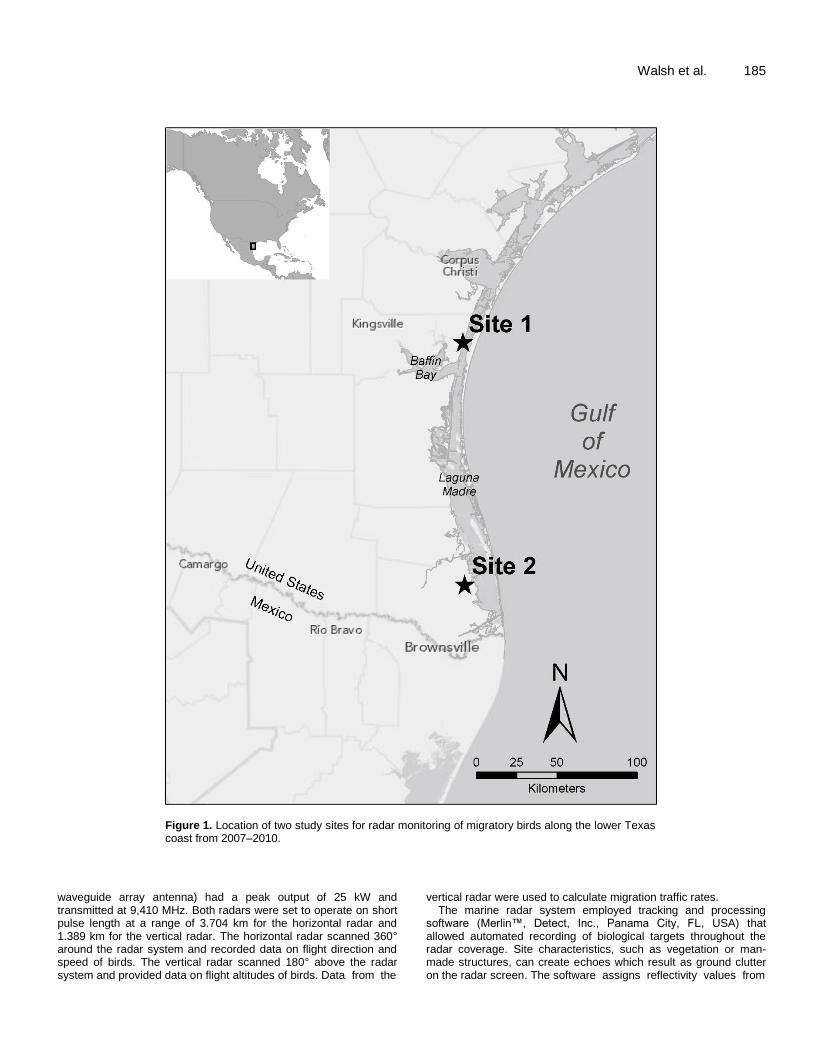
We conducted a three-year study using radar to monitor bird migration along a 200 km section of the lower coast of Texas from Corpus Christi to Brownsville (Figure 1). Padre Island, a barrier island, separates the mainland coast and Laguna Madre from the western part of the Gulf of Mexico (Blair, 1950; Judd, 2002; Tunnel, 2002). Private ranches and federally protected areas occupy a majority of the landscape (Hilbun and Koltermann, 2002). Dominant habitat types include wetlands, native prairies, shrublands, and woodlands (Fulbright and Bryant, 2002). We selected two study sites along the lower Texas coast to assess bird movements in the
region. One site was 20 km south of Corpus Christi (Site 1; 27° 25'N 97° 22'W, 8 m above sea level) on the Laureles Division of the King Ranch, Inc. and was 1 km inland from the mainland coast. A second site was located 134 km south of Site 1 on Laguna Atascosa National Wildlife Refuge (Site 2; 26° 12’N 97° 22’W, 6 m above sea level) 5.82 km inland from the mainland coast. We collected bird migration data at Site 1 from autumn 2007 to spring 2010 and at Site 2 during autumn 2008 to spring 2010. Our radar monitoring periods were 15 August to 17 November in autumn and 15 March to 1 June in spring, and were selected to correspond with known periods of migratory bird passage in the Gulf of Mexico region (Buskirk, 1980; Gauthreaux, 1999) and southern Texas in particular (Langschied, 1994; Arnold, 2009). Radar equipment and data collection An automated, marine radar system (Merlin™, Detect, Inc., Panama City, FL, USA) monitored birds continually at each site. Radar systems were equipped with one S-band surveillance radar that operated in a horizontal position and one X-band surveillance radar that was tilted 90° and operated in a vertical position. Both surveillance radars ran concurrently and sampled every 2.5 s during radar monitoring periods in autumn and spring at each site. The S-band surveillance radar (hereafter horizontal radar, JMA 5330, Japan Radio Company, Tokyo, Japan, slotted waveguide array antenna) had a peak output of 30 kW and transmitted at 3,050 MHz. The X-band surveillance radar (hereafter vertical radar, JMA 5320, Japan Radio Company, Tokyo, Japan, slotted
Walsh et al. 185
Figure 1. Location of two study sites for radar monitoring of migratory birds along the lower Texas coast from 2007–2010.
waveguide array antenna) had a peak output of 25 kW and transmitted at 9,410 MHz. Both radars were set to operate on short pulse length at a range of 3.704 km for the horizontal radar and 1.389 km for the vertical radar. The horizontal radar scanned 360° around the radar system and recorded data on flight direction and speed of birds. The vertical radar scanned 180° above the radar system and provided data on flight altitudes of birds. Data from the
vertical radar were used to calculate migration traffic rates. The marine radar system employed tracking and processing
software (Merlin™, Detect, Inc., Panama City, FL, USA) that allowed automated recording of biological targets throughout the radar coverage. Site characteristics, such as vegetation or man-made structures, can create echoes which result as ground clutter on the radar screen. The software assigns reflectivity values from

186 Int. J. Biodivers. Conserv. the ground clutter of the current environment and discounts those echoes from being considered as targets (Krijgsveld et al., 2011; Gerringer et al., 2016). Organisms identified on radar are referred to as targets given that it is difficult to discern the number and species (Mabee et al., 2006). The Merlin software recorded date, time, location, altitude, bearing, and over thirty radar signature characteristics for each target and automatically recorded the information to an Access database. For flight altitude data, the software recorded the height above ground level for each target. We also collected digital recordings of raw vertical radar data that showed biological activity within a 2.778 km radius. We post-processed radar data during the first season to determine the accuracy of the software to track bird-like targets consistently in the vertical radar (based on corroboration with digital recorded data). We plotted the images to display the geographic position of targets using different values for operational settings of clear air threshold, minimum target size, and minimum intensity. We examined the images to determine how changes in operational settings influenced the tracking of targets. From this review, we identified the optimal settings for the radar system to enhance the detection of birds and to minimize the recording of non-bird observations. These settings were applied to the vertical radar at both sites during all subsequent seasons.
We employed several measures to remove non-bird targets from our datasets. First, targets had to meet target size requirements to be tracked by Merlin software. We selected a minimum target size of 13 and 17 pixels, for the vertical and horizontal radar, respectively. Size requirements were held constant across the range settings of each radar. Second, we further excluded targets that tracked poorly. Targets had to be detected on at least 3 of 4 succeeding radar scans to be automatically recorded by the software as a track. Because of the shorter wavelengths of the vertical radar, insect contamination is common in radar studies (Bruderer, 1997; Mabee et al., 2006). We excluded targets from our vertical radar data that were tracked for < 5 detections to reduce tracking of insects. Third, because insects typically have slower airspeeds than birds (< 6 m/s for insects; Diehl et al., 2003; Mabee et al., 2006), we calculated the proportion of targets with airspeeds < 6 m/s from the horizontal radar data for each hour of each survey day and considered these to be non-bird targets. When the proportion of non-bird targets comprised >10% of the targets recorded for that hour, the hour was removed in the vertical radar dataset (Mabee et al., 2006). Birds and bats may overlap in air speeds which presents a problem in radar studies to classify targets as birds or bats (Larkin, 1991; Bruderer and Boldt, 2001; Kunz et al., 2007). Bats exhibit erratic flight patterns when foraging and this behavior may aid in discriminating between bats and birds (Kunz et al., 2007). We recognize that our data may contain some bat targets given that some species, such as, the Mexican free-tailed bat are known to occur in large concentrations in Texas (Tuttle, 1997).
Our final post-processing measure to reduce non-bird targets was to inspect radar data for periods when environmental conditions or clutter obstructed visible bird activity. We visually reviewed 17,799 h of vertical recordings to identify start and stop times of rainfall, fog, or smoke events. Vertical data occurring between these event times, including any questionable events, were omitted from the datasets. Although the horizontal radar is less susceptible to tracking non-bird targets, such as insects or rain, we plotted images to display the geographic position of targets and searched for target groupings that signified rainfall patterns. We also omitted targets from our horizontal radar data that tracked for < 5 detections to reduce observations that may have been caused from the false tracking of temporary clutter (that is, rain or wave clutter).
We automatically collected weather data (that is, temperature,
relative humidity, dew point, barometric pressure, precipitation, and wind direction and speed) every 5 min during migration periods using a weather station (Vantage Pro2 weather station, Davis Instruments, Hayward, CA, USA) at each radar station. Ground-level wind measurements were selected for calculation of target airspeeds because winds aloft data from the National Weather Service stations nearest to each site were only available for two hours out of a 24-h period (that is, 0000 and 1200). Given the scale of our collected radar observations, missing wind values were replaced with interpolated values. We used the preceding wind direction to replace missing direction values. Missing wind speed values were replaced with the average of the preceding and subsequent values of wind speed. Statistical analysis
Prior to analysis, we used a unique identifier to summarize the measurements of individual targets having multiple radar observations into a single observation for each dataset. A track identification number is given to a target track by the software after a target has been detected for 3 of 4 succeeding scans. Subsequent detections of the same target are associated with the identical track identification number. The track and associated track identification number ceases when the target has remained undetected for 3 succeeding scans by the radar (Krijgsveld et al., 2011; Gerringer et al., 2016). We treated each single observation as an individual record and did not distinguish between single or flock targets due to the unknown number and bird species of radar observations (Mabee et al., 2006). Because of this aspect of radar technology, we acknowledge that it is likely that we underestimated the magnitude of bird migration in our study (Fijn et al., 2015). For our comparison of migration characteristics between diurnal and nocturnal periods we used the onset and end of civil twilight to distinguish between nocturnal and diurnal time periods (Zehnder et al., 2001). Civil twilight times for each site were obtained from the U.S. Naval Observatory website (http://aa.usno.navy.mil/data/docs/ RS_OneDay.php). To simplify our analysis, we categorized the time periods by the hours of the day that were always light throughout autumn and spring migration to denote the diurnal period (0700 to 1800 h), and the hours that were always dark to denote the nocturnal period (2000 to 0500 h).
We conducted a preliminary analysis using the first 30,000 observations recorded from the radars at each site and during each year and season to determine a threshold for distance from the radar for bird targets to include in our estimation of passage rate. We estimated detectability functions specific to year, season, and site using the half-normal key function and cosine adjustment term in program Distance (Laake et al., 1993). We used Akaike’s Information Criterion (Akaike, 1973) to choose the appropriate key function and adjustment factors that provided the optimal model fit. From this initial analysis, the effective detection radius ranged from 607 m (95% CI: 585–629 m) to 745 m (95% CI: 704–789 m) for Site 1, and ranged from 492 m (95% CI: 480–504 m) to 620 m (95% CI: 602–638 m) at Site 2. Since each radar had an effective detection radius at or above 500 m during each year and season, we calculated the migration traffic rate (MTR) as the number of detected targets that crossed a line 500 m on each side of the radar per hour (that is, targets km-1 h-1) (Lowery, 1951). We adjusted MTR because sampling effort sometimes varied within a given hour (that is, due to filtering times with rain, fog, etc.). We used the start and end times of radar operation and weather events to determine our actual observation time for each season and site. Next, we multiplied the number of targets during the actual observation time by the number of minutes of radar operation time for each hour. Given that MTR is a count datum, this variable is not well suited to a

Walsh et al. 187
Table 1. Mean migration traffic rate (MTR, targets km-1 h-1) and flight altitude (m agl) for autumn (August 15–November 17) and spring (March 15–June 1) migration at two sites along the lower Texas coast from 2007–2010.
Study location Season Year Observation perioda n
b No. of tracks
c
Mean ± SE
MTR Flight altitude
Site 1
Autumn
2007 Aug 21–Nov 9 77 2,021,609 1,250 ± 117 508 ± 4
2008 Aug 15–Nov 14 88 3,255,060 1,704 ± 150 457 ± 4
2009 Aug 28–Nov 18 78 2,451,815 1,485 ± 139 450 ± 4
Spring
2008 Mar 15–Jun 2 80 1,463,224 796 ± 73 558 ± 4
2009 Mar 11–Jun 1 83 1,304,670 701 ± 63 592 ± 4
2010 Mar 19–Jun 2 46 377,578 406 ± 49 477 ± 5
Site 2
Autumn 2008 Aug 15–Nov 19 90 1,108,335 575 ± 46 319 ± 4
2009 Aug 13–Nov 8 96 1,527,012 918 ± 71 315 ± 4
Spring 2009 Mar 14–Jun 2 76 567,664 347 ± 30 425 ± 4
2010 Mar 23–Jun 1 71 738,875 476 ± 43 419 ± 4 a
Exact start and end dates of fieldwork. b
Number of nights of radar monitoring. c Number of radar observations included in data analysis obtained
from vertical radar.
normal distribution. Analysis of count data generally uses a Poisson distribution, but this requires for the mean and variance to be equal. Most often, count data exhibit over-dispersion that indicates the variance is larger than the mean. Thus, we used a Chi-Square Goodness-of-Fit test to assess the fit of a negative binomial distribution for MTR. Based on this test, we chose to model MTR assuming that it followed a negative binomial distribution to account for over-dispersed data (McCullagh and Nelder, 1989).
Because we initiated sampling at Site 1 a year prior to initiating sampling at Site 2, we conducted two separate analyses to enable inclusion of all 3 years of sampling. Thus, we compare all 3 years using only data from Site 1, and compare sites using data from years 2 and 3 when both radar systems were operational to provide a detailed analysis of movement along the lower Texas coastline. Given that we could not replicate our two sites in the classical sense, we consider our two sites as our populations of interest; statistical inferences are limited to these two sites. First, we used ANOVA to describe variation in mean MTR and mean flight altitude among three factors: season, year, and site. Second, ANOVA was used to describe variation in mean MTR and mean flight altitude for Site 1 between two factors: season and year. Third, we also used ANOVA to describe variation in mean MTR and mean flight altitude for each site among three factors: season, year, and time of day (that is, diurnal vs. nocturnal periods). The main factor of year in all ANOVAs was based upon a biological year: Year 1 = (autumn 2007–spring 2008); Year 2 (autumn 2008–spring 2009); and Year 3 (autumn 2009–spring 2010). Lastly, we performed post hoc contrasts to further investigate significant three-way interactions using CONTRAST statements. All post hoc contrasts held year constant to examine the other two-way effects on mean MTR or mean flight altitude. When 3-way interactions were non-significant, we performed a post hoc mean comparison test to partition significant two-way interactions using SLICE statements. Post hoc means were separated using the Fisher’s protected LSD test. We used the GLIMMIX procedure for comparisons of mean MTR and used GLM procedure for comparisons of mean flight altitude. Least square (LS) means were used for comparisons of MTR. We performed statistical analyses in SAS (SAS Institute, Inc. 2009) or statistical program R (CirStats and Circular Packages, R Development Core Team, 2006).
RESULTS We monitored bird migration during 16,360 h of radar operation during 452 days and nights at Site 1 and during 333 days and nights at Site 2. We excluded 657.7 h due to environmental contamination (precipitation, fog, and smoke) for Site 1, and 781.9 h for Site 2. Missing observations due to radar system shutdown (routine generator maintenance or equipment failure) occurred for 1,032 h for Site 1 and 336 h for Site 2. From our horizontal dataset, we initially included 11,466,254 radar tracks in our calculations of airspeed and omitted 208,439 targets (1.81%) because these targets were not within our airspeed thresholds. Consequently, we also excluded 0.4% of targets from our vertical dataset that corresponded to hours with >10% of targets with airspeeds below our threshold in our horizontal dataset. We analyzed 14,815,842 radar tracks from our vertical dataset. Migration traffic rate MTR varied considerably between seasons and sites (Table 1). Mean daily MTR (that is, 24 h period) varied between 27 and 5,457 targets km
-1 h-
1 during autumn and
between 7 and 3,484 during spring (Figures 2 and 3). Nocturnal MTR varied between 16 and 7,156 targets km
-1
h-1 in autumn and between 5 and 5,883 targets km
-1 h-
1 in
spring. Overall MTR was 57–266% greater in autumn than in spring at both sites (Table 2). Additionally, MTR at Site 1 was 62–196% greater than at Site 2. We experienced maintenance issues with the radar system at Site 1 in spring 2010 and were unable to monitor during

188 Int. J. Biodivers. Conserv.
Figure 2. Mean migration traffic rates (targets km-1 h-1) during autumn (August 15–November 17) 2007 to 2009 and spring (March 15–June 1) 2008 to 2010 at Site 1 along the lower Texas coast.
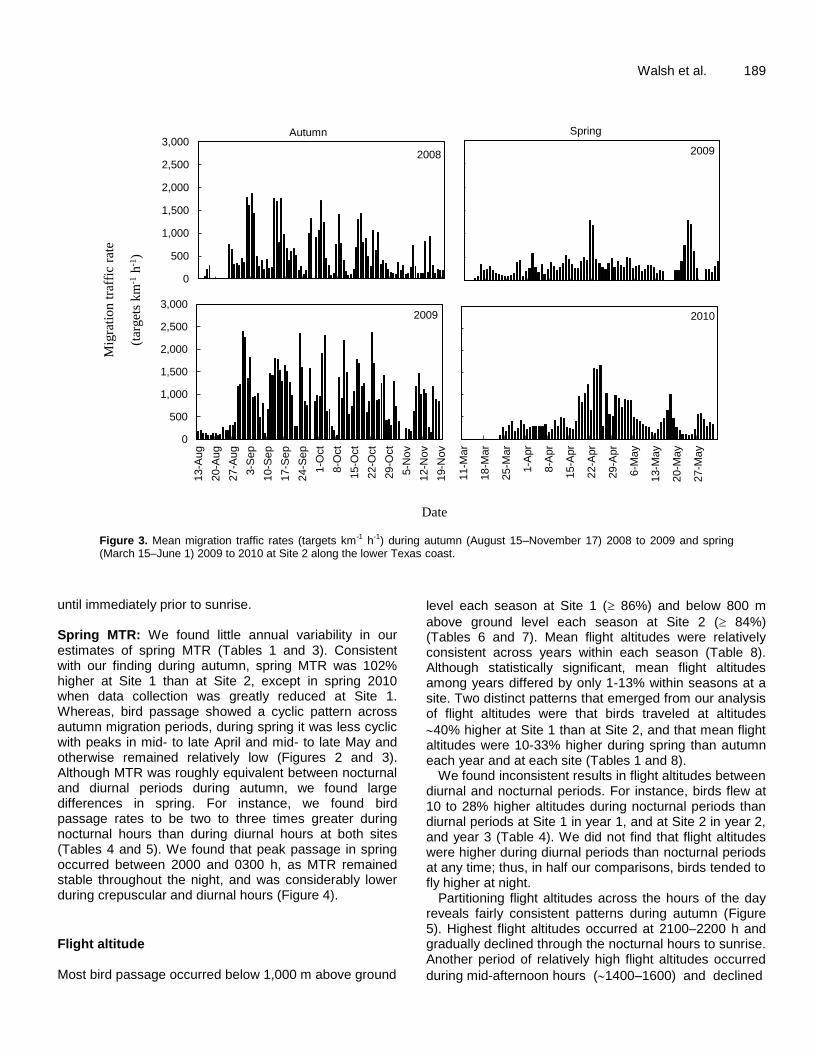
the majority of the period of peak movement. Thus, the MTR estimated at Site 1 in spring 2010 is likely conservative. Autumn MTR: Overall MTR during autumn was similar across years varying from 1,250 ± 117 to 1,704 ± 150 targets km
-1 h
-1 at Site 1 and from 575 ± 46 to 918 ± 71
targets km-1
h-1
at Site 2 (Tables 1 and 3). Mean daily MTR exhibited an undulating pattern across autumn with no distinct peak apparent, but rather a protracted migration throughout our defined migration period
(Figures 2 and 3). The magnitude of the peaks was consistently lower after mid-October each year.
The pattern of bird passage throughout the day and night was relatively uniform during autumn, as diurnal (1,562 ± 150 targets km
-1 h
-1) and nocturnal (1,492 ±150
86 targets km-1
h-1
) passage rates were similar; a pattern consistent between sites (Tables 4 and 5). The highest bird passage typically occurred around mid-day followed by a decline to about 1800 h when in general the lowest passage rates occurred (Figure 4). There was a sharp increase at 1900 when MTR remained relatively high
Walsh et al. 189
Figure 3. Mean migration traffic rates (targets km-1 h-1) during autumn (August 15–November 17) 2008 to 2009 and spring (March 15–June 1) 2009 to 2010 at Site 2 along the lower Texas coast.
until immediately prior to sunrise. Spring MTR: We found little annual variability in our estimates of spring MTR (Tables 1 and 3). Consistent with our finding during autumn, spring MTR was 102% higher at Site 1 than at Site 2, except in spring 2010 when data collection was greatly reduced at Site 1. Whereas, bird passage showed a cyclic pattern across autumn migration periods, during spring it was less cyclic with peaks in mid- to late April and mid- to late May and otherwise remained relatively low (Figures 2 and 3). Although MTR was roughly equivalent between nocturnal and diurnal periods during autumn, we found large differences in spring. For instance, we found bird passage rates to be two to three times greater during nocturnal hours than during diurnal hours at both sites (Tables 4 and 5). We found that peak passage in spring occurred between 2000 and 0300 h, as MTR remained stable throughout the night, and was considerably lower during crepuscular and diurnal hours (Figure 4).
Flight altitude Most bird passage occurred below 1,000 m above ground
level each season at Site 1 ( 86%) and below 800 m
above ground level each season at Site 2 ( 84%) (Tables 6 and 7). Mean flight altitudes were relatively consistent across years within each season (Table 8). Although statistically significant, mean flight altitudes among years differed by only 1-13% within seasons at a site. Two distinct patterns that emerged from our analysis of flight altitudes were that birds traveled at altitudes
40% higher at Site 1 than at Site 2, and that mean flight altitudes were 10-33% higher during spring than autumn each year and at each site (Tables 1 and 8).
We found inconsistent results in flight altitudes between diurnal and nocturnal periods. For instance, birds flew at 10 to 28% higher altitudes during nocturnal periods than diurnal periods at Site 1 in year 1, and at Site 2 in year 2, and year 3 (Table 4). We did not find that flight altitudes were higher during diurnal periods than nocturnal periods at any time; thus, in half our comparisons, birds tended to fly higher at night.
Partitioning flight altitudes across the hours of the day reveals fairly consistent patterns during autumn (Figure 5). Highest flight altitudes occurred at 2100–2200 h and gradually declined through the nocturnal hours to sunrise. Another period of relatively high flight altitudes occurred
during mid-afternoon hours (1400–1600) and declined
0
500
1,000
1,500
2,000
2,500
3,000
13
-Au
g
20
-Au
g
27
-Au
g
3-S
ep
10
-Sep
17
-Sep
24
-Sep
1-O
ct
8-O
ct
15
-Oct
22
-Oct
29
-Oct
5-N
ov
12
-No
v
19
-No
v
Autumn
2008
0
500
1,000
1,500
2,000
2,500
3,000
13-A
ug
20-A
ug
27-A
ug
3-S
ep
10-S
ep
17-S
ep
24-S
ep
1-O
ct
8-O
ct
15-O
ct
22-O
ct
29-O
ct
5-N
ov
12-N
ov
19-N
ov
2009
0
500
1,000
1,500
2,000
2,500
3,000
11-…
18-…
25-…
1-A
pr
8-A
pr
15-…
22-…
29-… 6-…
13-…
20-…
27-…
Spring
2009
0
500
1,000
1,500
2,000
2,500
3,000
11-M
ar
18-M
ar
25-M
ar
1-A
pr
8-A
pr
15-A
pr
22-A
pr
29-A
pr
6-M
ay
13-M
ay
20-M
ay
27-M
ay
2010
Mig
rati
on t
raff
ic r
ate
(t
arget
s km
-1 h
-1)
Date

190 Int. J. Biodivers. Conserv. Table 2. Three-way ANOVAs comparing mean migration traffic rates (MTR, targets km-1 h-1) and flight altitude (m agl) by season, year, and site along the lower Texas coast in 2008–2010.
Migration metric Sourcea Post hoc tests Num df Den df F P
MTR
Season year site 1 620 1.00 0.32
Season year 1 620 4.67 0.03
Slice effect by season
Year (Autumn) 1 620 3.83 0.05
Year (Spring) 1 620 1.36 0.24
Slice effect by year
Season (Year 2) 1 620 65.84 <0.001
Season (Year 3) 1 620 103.95 <0.001
Season site 1 620 15.73 <0.001
Slice effect by site
Season (Site 1) 1 620 132.68 <0.001
Season (Site 2) 1 620 44.7 <0.001
Slice effect by season
Site (Autumn) 1 620 86.53 <0.001
Site (Spring) 1 620 7.83 0.01
Year site 1 620 32.58 <0.001
Slice effect by site
Year (Site 1) 1 620 12.99 0.0003
Year (Site 2) 1 620 20.39 <0.001
Slice effect by year
Site (Year 2) 1 620 108.27 <0.001
Site (Year 3) 1 620 2.81 0.09
Flight altitude
Season year site 1 13655 89.19 <0.001
Contrast within year 2
Site season 1 13655 15.30 <0.001
Contrast within year 3
Site season 1 13655 83.57 <0.001 a Season = autumn (August 15–November 17) and spring (March 15–June 1) migration. Year = 2 (autumn 2008–spring 2009) and 3 (autumn 2009–
spring 2010).
18-25% by 1800-1900 h. Lowest flight altitudes were associated around crepuscular periods at 0400–0500, 0800–0900, and 1800–1900 h (Figure 5). Flight altitudes during spring did not show the distinct pattern across the hours of the day as exhibited in autumn, particularly at Site 1. However, birds appeared to travel at relatively low altitudes around crepuscular periods, and generally fly higher during nocturnal hours compared to diurnal hours, particularly at Site 2 (Figure 5). DISCUSSION Given our considerable sample sizes, statistical significance was commonly found among differences that appeared to be biologically similar. Thus, we focus our discussion on several pronounced patterns in the
temporal and spatial distribution of migrating birds that became evident from multiple year comparisons that we believe have biological merit. Migration traffic rate We documented MTR of well over 5,000 targets km
-1 h
-1
during many nights in autumn along the lower Texas coast. Coastal areas in other regions have also demonstrated high nocturnal passage rates. Zehnder et al. (2001) reported a mean nocturnal MTR of 1,319 targets km
-1 h
-1 at a coastal site in south Sweden with
nocturnal bird passage as high as 6,618 targets km-1
h-1
. Likewise, Fortin et al. (1999) estimated a mean nocturnal MTR to be ~ 1,000 targets km
-1 h
-1 along the northwest
coast of the Mediterranean Sea with peak nocturnal

Walsh et al. 191
Table 3. Output from 2-way ANOVAs comparing migration traffic rates (MTR, targets km-1 h-1) and flight altitudes (m agl) by season and year for Site 1 along the lower Texas coast in 2007–2010.
Migration metric Sourcea Post hoc tests Num df Den df F P
MTR
Season year 2 446 8.85 0.0002
Slice effect by season
Year (Autumn) 2 446 2.91 0.06
Year (Spring) 2 446 10.22 < 0.001
Slice effect by year
Season (Year 1) 1 446 11.73 0.0007
Season (Year 2) 1 446 49.59 < 0.001
Season (Year 3) 1 446 71.35 < 0.001
Flight altitude
Season year 2 10052 103.64 < 0.001
Slice effect by season
Year (Autumn) 2 10052 65.90 < 0.001
Year (Spring) 2 10052 166.21 < 0.001
Slice effect by year
Season (Year 1) 1 10052 86.98 < 0.001
Season (Year 2) 1 10052 673.88 < 0.001
Season (Year 3) 1 10052 18.04 < 0.001 a
Season = autumn (August 15–November 17) and spring (March 15–June 1) migration. Year = 1 (autumn 2007–spring 2008), 2 (autumn 2008–spring 2009), and 3 (autumn 2009–spring 2010).
Table 4. Migration traffic rates (MTR, targets km-1 h-1) and mean flight altitude (m agl) during diurnal (0700–1700 hr) and nocturnal (2000–0400 hr) time periods for autumn (August 15–November 17) and spring (March 15–June 1) migration at two sites along the lower Texas coast from 2007–2010.
Study location
Season Year No. of tracks MTR
P Altitude
Diurnal Nocturnal Diurnal Nocturnal P
Site 1
Autumn
2007 1,790,482 1,400 ± 143 1,216 ± 124 0.33 481 ± 15 562 ± 15 0.001
2008 2,779,155 1,869 ± 179 1,674 ± 160 0.42 450 ± 14 490 ± 14 0.04
2009 2,116,393 1,457 ± 151 1,630 ± 165 0.44 456 ± 15 461 ± 15 0.81
Spring
2008 1,298,391 477 ± 48 1,297 ± 130 <0.001 539 ± 15 595 ± 15 0.01
2009 1,160,574 377 ± 37 1,168 ± 115 <0.001 617 ± 14 578 ± 14 0.05
2010 327,705 213 ± 28 636 ± 84 <0.001 473 ± 19 503 ± 19 0.27
Site 2
Autumn 2008 932,861 745 ± 73 375 ± 36 <0.001 292 ± 14 348 ± 14 0.01
2009 1,248,326 960 ± 91 864 ± 82 0.44 329 ± 14 318 ± 14 0.56
Spring 2009 479,412 222 ± 24 506 ± 54 <0.001 426 ± 15 488 ± 16 0.01
2010 638,458 370 ± 41 633 ± 69 0.001 381 ± 16 487 ± 16 <0.001
migration of 1,600 targets km
-1 h
-1 soon after sunset.
Coastal areas often concentrate bird migration because they border large water bodies that are energetically challenging for birds to cross without the opportunity to refuel or rest. This appears to be true for the Texas coast as well, as our estimates of MTR (1,200–1,700 targets
km-1
h-1
) in autumn are 600% higher than estimates of MTR from other radar studies monitoring bird movements
in North America. For instance, Mabee et al. (2006) reported mean MTR of 199 targets km
-1 h
-1 along an
Appalachian ridge in West Virginia. Harmata et al. (2000) estimated a mean MTR of 41 targets km
-1 h
-1 at a
grassland site in Montana. Similarly, Mabee and Cooper (2004) reported mean MTR of 19.0–26.3 targets km
-1 h
-1
at two wind energy sites in eastern Oregon and Washington during autumn. Following the coast is often a

192 Int. J. Biodivers. Conserv.
Table 5. Output from 3-way ANOVAs comparing migration traffic rates (MTR, targets km-1 h-1) by season, year, and time of day at two sites along the lower Texas coast in 2007–2010.
Study location
Migration metric
Sourcea Post hoc tests
Num df
Den df
F P
Site 1 MTR
Season year time of day 2 888 0.37 0.69
Year time of day 2 888 0.61 0.54
Year 2 888 12.07 <0.001
Time of day 1 888 70.87 <0.001
Season year 2 888 17.93 <0.001
Slice effect by season
Year (Autumn) 2 888 4.75 0.01
Year (Spring) 2 888 21.64 <0.001
Slice effect by year
Season (Year 1) 1 888 25.09 <0.001
Season (Year 2) 1 888 102.19 <0.001
Season (Year 3) 1 888 146.69 <0.001
Season time of day 1 888 84.19 <0.001
Slice effect by season
Night (Autumn) 1 888 0.32 0.58
Day (Spring) 1 888 139.94 <0.001
Slice effect by time of day
Season (Night) 1 888 22.87 <0.001
Season (Day) 1 888 313.50 <0.001
Site 2 MTR
Season year time of day 1 650 9.02 0.003
Contrast within year 2
Season Time of day 1 650 54.86 < 0.001
Contrast within year 3
Season Time of day 1 650 9.78 0.002 a Season = autumn (August 15–November 17) and spring (March 15–June 1) migration. Year = 1 (autumn 2007–spring 2008), 2 (autumn 2008–
spring 2009), and 3 (autumn 2009–spring 2010). Time of day = nocturnal (movement between 2000–0400 h) and diurnal (movement between 0700–1700 h) periods.
safer route and typically optimal when migration speed is not of primary importance (Alerstam and Lindström, 1990). Although birds that detour along the coast rather than making a direct crossing of a large water body may increase their migration distance, they are allowed to make stopovers more frequently to rest and refuel and are not required to store as much energy as they would for a long, nonstop flight (Alerstam and Lindström, 1990; Alerstam et al., 2003).
Migration traffic rates in autumn were 124% greater than spring across our study. This substantial difference in bird passage is possibly explained by two potential causes. First, mortality during migration and winter at least partially contributes to a lower return passage rate (Sillett and Holmes, 2002). Second, migrants may be using different migration pathways between autumn and spring. The timing of arrival on breeding areas in spring can have a significant effect on the fitness of migratory
birds (Kokko, 1999). Early-arriving individuals can benefit from reduced competition for better territories and mates, a longer breeding season that allows more time to renest if the first nest fails (Smith and Moore, 2005), and more food resources for young, which is important because available food resources tend to become reduced as the breeding season progresses (Guyn and Clark, 1999). The benefits of arriving early on breeding areas have led to a faster migration for many birds in spring (Karlsson et al., 2012; Tøttrup et al., 2012). Because migrants are under greater time constraints in spring (Fransson, 1995; Kokko, 1999), more birds may use routes that are more direct during spring (e.g. trans-Gulf or inland). The notion of more direct migratory routes during spring is also supported by the more directed flight paths of birds in spring compared to autumn in this region (Contreras, 2013).
We found that migration during spring is largely

Walsh et al. 193
Figure 4. Mean migration traffic rates (birds km-1 h-1) by hour of day for autumn (15 August to 17 November) at Site 1 (A) and Site 2 (B), and during spring (March 15–June 1) at Site 1 (C) and Site 2 (D) during 2007 to 2010 along the lower Texas coast. Data are shown as
2007 = , 2008 = , 2009 = , and 2010 = .
nocturnal, as mean MTR was 157% greater at night than during the day across the entire study. Forsyth and James (1971) similarly reported a higher number of nocturnal migrants along the western Gulf coast than diurnal migrants in the spring. This pattern of largely nocturnal flights in the Gulf region is also strongly supported by the steady number of birds appearing in early morning hours (Forsyth and James, 1971; Lowery, 1951). The timing of peaks in spring migrants differs depending upon arrival location along the Gulf coast. Migrants that appear in southern areas arrive in higher numbers earlier than those migrants along northern areas in which peaks correspond as spring advances (Gauthreaux and Belser, 1999). However, our findings indicate that nocturnal migration is a strategy that birds use in the spring to be more efficient with their time spent
en route to breeding areas. Because most birds are visual foragers and are unable to forage at nighttime, migrants use the night to travel and can spend time foraging to replenish energy reserves during the daytime (Kerlinger, 1995; Newton, 2010). It is also possible that nocturnal migration is more likely for migrants covering long distances between breeding and wintering areas, and travelling in cool air temperatures at night may minimize overheating and dehydration risks during these lengthy flights (Kerlinger, 1995; Newton, 2010).
We found that autumn migration was far more protracted with numerous peaks in MTR across the entire autumn period. Similarly, Tøttrup et al. (2012) demonstrated that the length of time that a passerine migrant was in migration in autumn extended well beyond that of spring due to lengthy autumn stopovers. Most
0
500
1,000
1,500
2,000
2,500
3,000
0:0
0
1:0
0
2:0
0
3:0
0
4:0
0
5:0
0
6:0
0
7:0
0
8:0
0
9:0
0
10
:00
11
:00
12
:00
13
:00
14
:00
15
:00
16
:00
17
:00
18
:00
19
:00
20
:00
21
:00
22
:00
23
:00
A
0
500
1,000
1,500
2,000
2,500
3,000
0:0
0
1:0
0
2:0
0
3:0
0
4:0
0
5:0
0
6:0
0
7:0
0
8:0
0
9:0
0
10:0
0
11:0
0
12:0
0
13:0
0
14:0
0
15:0
0
16:0
0
17:0
0
18:0
0
19:0
0
20:0
0
21:0
0
22:0
0
23:0
0
C
0
500
1,000
1,500
2,000
2,500
3,000
0:0
0
2:0
0
4:0
0
6:0
0
8:0
0
10:0
0
12:0
0
14:0
0
16:0
0
18:0
0
20:0
0
22:0
0
0
500
1,000
1,500
2,000
2,500
3,000
0:0
0
2:0
0
4:0
0
6:0
0
8:0
0
10:0
0
12:0
0
14:0
0
16:0
0
18:0
0
20:0
0
22:0
0
B D
Time of day
(hour)
Mig
rati
on t
raff
ic r
ate
(tar
get
s km
-1 h
-1)
Time of day (h)
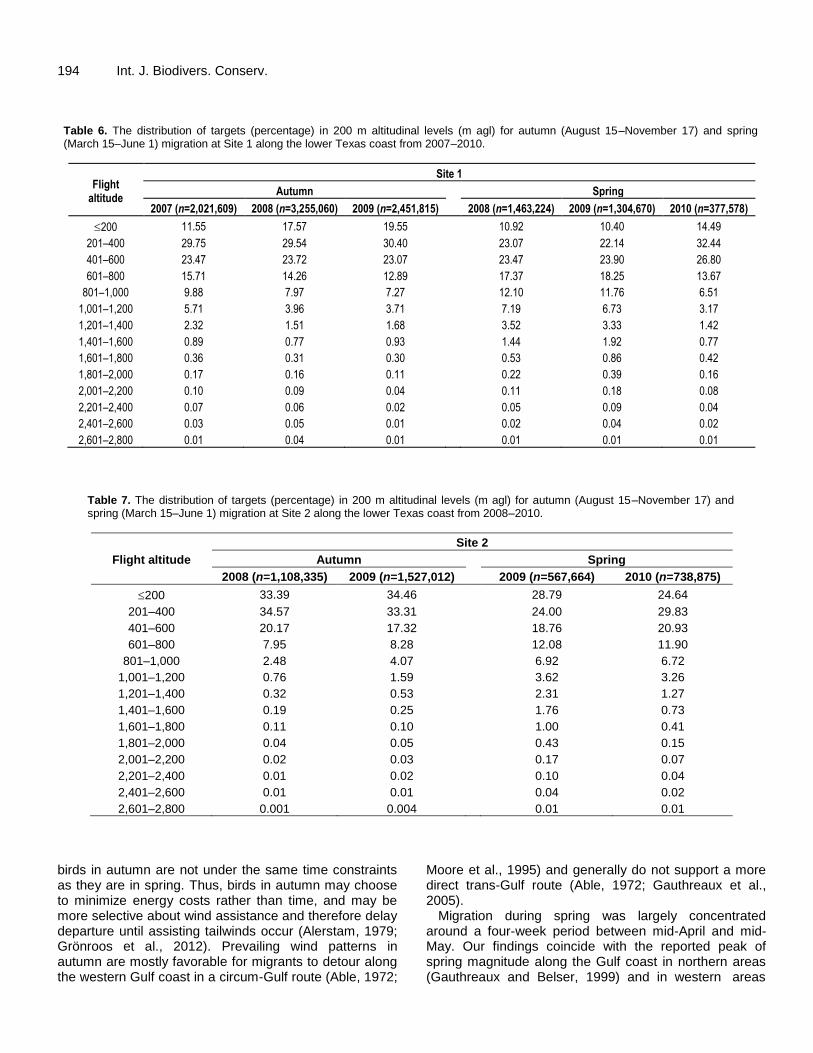
194 Int. J. Biodivers. Conserv. Table 6. The distribution of targets (percentage) in 200 m altitudinal levels (m agl) for autumn (August 15–November 17) and spring (March 15–June 1) migration at Site 1 along the lower Texas coast from 2007–2010.
Flight altitude
Site 1
Autumn
Spring
2007 (n=2,021,609) 2008 (n=3,255,060) 2009 (n=2,451,815) 2008 (n=1,463,224) 2009 (n=1,304,670) 2010 (n=377,578)
200 11.55 17.57 19.55 10.92 10.40 14.49
201–400 29.75 29.54 30.40 23.07 22.14 32.44
401–600 23.47 23.72 23.07 23.47 23.90 26.80
601–800 15.71 14.26 12.89 17.37 18.25 13.67
801–1,000 9.88 7.97 7.27 12.10 11.76 6.51
1,001–1,200 5.71 3.96 3.71 7.19 6.73 3.17
1,201–1,400 2.32 1.51 1.68 3.52 3.33 1.42
1,401–1,600 0.89 0.77 0.93 1.44 1.92 0.77
1,601–1,800 0.36 0.31 0.30 0.53 0.86 0.42
1,801–2,000 0.17 0.16 0.11 0.22 0.39 0.16
2,001–2,200 0.10 0.09 0.04 0.11 0.18 0.08
2,201–2,400 0.07 0.06 0.02 0.05 0.09 0.04
2,401–2,600 0.03 0.05 0.01 0.02 0.04 0.02
2,601–2,800 0.01 0.04 0.01 0.01 0.01 0.01
Table 7. The distribution of targets (percentage) in 200 m altitudinal levels (m agl) for autumn (August 15–November 17) and spring (March 15–June 1) migration at Site 2 along the lower Texas coast from 2008–2010.
Flight altitude
Site 2
Autumn Spring
2008 (n=1,108,335) 2009 (n=1,527,012) 2009 (n=567,664) 2010 (n=738,875)
200 33.39 34.46 28.79 24.64
201–400 34.57 33.31 24.00 29.83
401–600 20.17 17.32 18.76 20.93
601–800 7.95 8.28 12.08 11.90
801–1,000 2.48 4.07 6.92 6.72
1,001–1,200 0.76 1.59 3.62 3.26
1,201–1,400 0.32 0.53 2.31 1.27
1,401–1,600 0.19 0.25 1.76 0.73
1,601–1,800 0.11 0.10 1.00 0.41
1,801–2,000 0.04 0.05 0.43 0.15
2,001–2,200 0.02 0.03 0.17 0.07
2,201–2,400 0.01 0.02 0.10 0.04
2,401–2,600 0.01 0.01 0.04 0.02
2,601–2,800 0.001 0.004 0.01 0.01
birds in autumn are not under the same time constraints as they are in spring. Thus, birds in autumn may choose to minimize energy costs rather than time, and may be more selective about wind assistance and therefore delay departure until assisting tailwinds occur (Alerstam, 1979; Grönroos et al., 2012). Prevailing wind patterns in autumn are mostly favorable for migrants to detour along the western Gulf coast in a circum-Gulf route (Able, 1972;
Moore et al., 1995) and generally do not support a more direct trans-Gulf route (Able, 1972; Gauthreaux et al., 2005).
Migration during spring was largely concentrated around a four-week period between mid-April and mid-May. Our findings coincide with the reported peak of spring magnitude along the Gulf coast in northern areas (Gauthreaux and Belser, 1999) and in western areas

Walsh et al. 195
Table 8. Output from 3-way ANOVAs comparing mean flight altitudes (m agl) by season, year, and time of day at two sites along the lower Texas coast in 2007–2010.
Study location Migration metric Sourcea Post hoc tests Num df Den df F P
Site 1 Flight altitude
Season year time of day 2 888 2.78 0.06
Season time of day 1 888 2.15 0.14
Season 1 888 56.95 < 0.001
Time of Day 2 888 21.85 0.001
Season year 2 888 12.16 < 0.001
Slice effect by season
Year (Autumn) 2 888 10.01 < 0.001
Year (Spring) 2 888 20.97 < 0.001
Slice effect by year
Season (Year 1) 1 888 9.68 0.002
Season (Year 2) 1 888 80.27 < 0.001
Season (Year 3) 1 888 2.85 0.09
Year time of day 2 888 5.78 0.003
Slice effect by year
Time of day (Year 1) 1 888 21.30 < 0.001
Time of day (Year 2) 1 888 0.00 0.98
Time of day (Year 3) 1 888 1.06 0.30
Slice effect by time of day
Year (Night) 2 888 18.00 < 0.001
Year (Day) 2 888 9.64 < 0.001
Site 2 Flight altitude
Season year time of day 1 649 7.07 0.01
Contrast within year 2
Season Time of day 1 649 0.03 0.86
Contrast within year 3
Season Time of day 1 649 15.33 < 0.001 a Season = autumn (August 15–November 17) and spring (March 15–June 1) migration. Year = 1 (autumn 2007–spring 2008), 2 (autumn 2008–spring
2009), and 3 (autumn 2009–spring 2010). Time of day = nocturnal (movement between 2000–0400 h) and diurnal (movement between 0700–1700 h) period.
(Forsyth and James, 1971). Within these weeks, our data shows that MTR was up to four times greater than the rest of the season. Spring migration in most areas typically occurs over a relatively narrow time span compared to autumn (Fransson, 1995). Our findings support that peaks in spring migration occur at times when southerly winds along the Gulf of Mexico are reliable and steady between late April and early May (Gauthreaux, 1999; Moore et al., 1995). Forsyth and James (1971) found that the majority of spring migrants were taking advantage of southeasterly winds from eastern Mexico. Thus, southerly winds are important to migrants by providing wind assistance for northward movements from southern wintering areas (Gauthreaux, 1999; Moore et al., 1995). Furthermore, prevailing wind patterns in spring are especially critical for migrants that must cross directly over the Gulf of Mexico (Gauthreaux, 1999; Moore et al., 1995). Migrants that exploit favorable
winds can minimize their migration distance, as well as, increase their migration speed to reach breeding grounds early (Gauthreaux, 1999). Flight altitude Several patterns emerged from our analyses of flight altitudes of migratory birds along the lower Texas coast. First, the majority of targets detected by our radars (57% to 88%) occurred at altitudes within 600 m above ground level across seasons and sites, and 34% flew ≤200 m above ground level. Although this is partly due to the limitation of our radar units, this finding is consistent with previously described altitudes for nocturnal migrants in other parts of North America (Able, 1970; Gauthreaux, 1991; Mabee et al., 2006; Gagnon et al., 2011). This study shows that a relatively large proportion of targets

196 Int. J. Biodivers. Conserv.
Figure 5. Mean flight altitudes (m agl) by hour of day during autumn (August 15–November 17) at Site 1 (A) and Site 2 (B), and during spring (March 15–June 1) at Site 1 (C) and Site 2 (D) in 2007-2010 along the lower Texas coast. Data are shown as 2007 = ●, 2008 = □, 2009 = , and 2010 = ○.
used the airspace at altitudes that are greater than modern wind energy development; however, flock size and specific species remain unknown. Yet, there are situations that may force migrants to fly at lower altitudes. For example, migrants that must contend with the Gulf of Mexico may come upon adverse weather conditions (that is, strong rain and unfavorable winds (Gauthreaux and Belser 1998, Gauthreaux 1999). Forsyth and James (1971) reported that highest number of spring migrants grounded along the western Gulf coast corresponded to unfavorable weather conditions of frontal activity. Consequently, these type of situations may increase the number of migrants susceptible to impacts with wind turbines along the lower Texas coast. The rotor swept zone area in which migrants may be at risk is generally from 50 to 150 m above ground level (Katzner et al.,
2012). Thus, the minimum number of migrants at risk across a 1-km front in our study is between 5 to 10% at Site 1 and 13 to 19% at Site 2 (Tables 6 and 7).
Second, we found that flight altitudes were higher in spring than autumn. Schmaljohann et al. (2007) also reported birds to fly at higher altitudes during spring migration, and suggested that water loss may be an important factor in seasonal difference in flight altitudes. Other factors such as weather, time of day, location, geographic features, and type of flight (e.g. flapping vs. soaring) have also been found to influence the altitudinal distribution of birds in the airspace (Berthold, 2001; Newton, 2010). Wind conditions exert a pronounced influence on the altitudinal distribution of migratory birds. The higher flight altitudes we observed in spring may be partly explained by the prevailing wind patterns in spring,
0
100
200
300
400
500
600
700
8000
:00
1:0
0
2:0
0
3:0
0
4:0
0
5:0
0
6:0
0
7:0
0
8:0
0
9:0
0
10
:00
11
:00
12
:00
13
:00
14
:00
15
:00
16
:00
17
:00
18
:00
19
:00
20
:00
21
:00
22
:00
23
:00
0
100
200
300
400
500
600
700
800
0
100
200
300
400
500
600
700
800
0:0
0
2:0
0
4:0
0
6:0
0
8:0
0
10:0
0
12:0
0
14:0
0
16:0
0
18:0
0
20:0
0
22:0
0
0
100
200
300
400
500
600
700
800
0:0
0
2:0
0
4:0
0
6:0
0
8:0
0
10:0
0
12:0
0
14:0
0
16:0
0
18:0
0
20:0
0
22:0
0
Mea
n f
lighta
Alt
itud
e (m
agl)
Time of day (h)
A C
B D

which are advantageous for northern movement (Gauthreaux, 1999; Moore et al., 1995). By selecting altitudes with the best wind conditions, birds can minimize energy costs and increase migration speed (Richardson, 1978, 1990; Alerstam, 1979; Alerstam and Lindström, 1990). In contrast, prevailing wind patterns along the lower Texas coast are opposing the southward movement of birds in autumn. Previous findings have demonstrated that birds flying in headwinds (that is, unfavorable wind conditions) generally occur at lower altitudes than those birds migrating in tailwinds (that is, favorable wind conditions) (Kerlinger and Moore, 1989).
Lastly, consistent with previous views (Berthold, 2001; Newton, 2010), we found that flight altitudes were typically higher at night than during the day. Many studies have concentrated on flight altitudes of nocturnal migrants (Able, 1970; Gauthreaux, 1991; Zehnder et al., 2001; Mabee et al., 2006; Gagnon et al., 2011) or diurnal migrants (Mateos-Rodriguez et al., 2012), but our study is among the few to examine both nocturnal and diurnal migrants. Our results indicate that during spring, birds may be performing longer flights because nocturnal migrants are thought to primarily be those birds covering longer distances during migration (Newton, 2010). This result is also consistent with the higher flight altitudes that we report during spring. Our findings of a difference in altitudinal differences in time of day are consistent with reports at northern areas along the Gulf coast. Migrants making trans-Gulf flights appeared at greater altitudes than flights that were performed after in the daytime hours (Gauthreaux and Belser, 1999).
To be successful, migratory birds need to be able to acclimate to changing environments, successfully compete for common resources, avoid predation, and appropriately react to adverse weather (Moore and Simons, 1990; Moore et al., 1993). Therefore, many competing factors play a role in the successful completion of the migration journey, and safe arrival to breeding and wintering areas each year is of great importance to the stability of migratory bird populations. Understanding the migratory behavior of birds requires knowledge of the temporal and spatial patterns of migration to ensure that management and conservation measures put into place are effective (Faaborg et al., 2010). Information on the distribution of birds in autumn and spring will be increasingly important in areas known to concentrate birds during migration. Because of its geographic position and diverse habitats, the lower Texas coast has been considered to act as a major migration corridor for birds (Kuvlesky et al., 2007), and our study provides the first empirical evidence to support this claim. Thus, special attention should be directed to the lower Texas coast to ensure that birds passing through this region have the necessary stopover areas along their migration route. The ability to assess potential effects of ongoing human development along the lower Texas coast has been
Walsh et al. 197 hindered by limited data; thereby making it difficult to guide management efforts. In recent years, coastal areas in this region have been targeted for wind energy development because of its high wind-power potential.
Our study establishes a baseline on key migration characteristics, notably passage rates, migration timing, and flight altitudes, for future monitoring to increase our understanding of potential interactions between migratory birds and wind-energy development. These migration characteristics are critical to identifying those migrants at risk from wind energy development, particularly those birds found within the rotor swept zone. The peak timing and magnitude of migration provided by our study can be used to predict seasonal and daily periods when birds may be at risk for collisions. Further, the fine-scale data on bird movements of our study will allow for the monitoring over time to detect changes in the timing of migration. Based on our study, there is still considerable bird passage at flight altitudes that correspond to the rotor-swept area of wind turbines. Future monitoring of the spatial distribution of birds would enable the detection of avoidance behavior of wind turbines by birds. Most importantly, our data provide guidance on the operating times when migratory birds may be at higher risk of collision and on the placement of wind farms in sensitive areas known to funnel significant concentrations of migratory birds. Although migrants may be impacted directly by wind energy developments (that is, collisions), the footprint of the wind energy development may also have indirect impacts to birds (Kuvlesky et al., 2007; Belaire et al., 2014). Wind energy development will alter the availability and quality of stopover habitat that millions of migrants have traditionally depended upon along the lower Texas coast. Habitat loss and alteration of stopover areas may have significant impacts to migratory bird species at a continental level. Our study on baseline migration characteristics can be used to aid in detecting stopover habitats and migration pathways that birds use in this region. Our study also highlights the significance of the lower Texas Gulf coast to migratory birds. Moreover, our estimates of MTR should be considered conservative for this region because an unknown proportion of targets were flocks rather than individual birds. Interestingly, there was a striking difference in migration magnitude observed between coastal sites. Differences in location relative to the coast or in local topography might explain the contrasting magnitude in our study (Fortin et al., 1999). Variation in migration volume within coastal sites stresses the importance of continued research efforts to study the movements of migratory birds along the lower Texas coast. In addition, further research is warranted to assess how migrating birds respond to landscape features. The dispersion of migration traffic inland remains relatively unknown. Future research should focus on providing insight into the change of migration

198 Int. J. Biodivers. Conserv. magnitude from the mainland coastline to areas further inland. CONFLICT OF INTERESTS The authors have not declared any conflict of interests. ACKNOWLEDGEMENTS The authors thank D. Drake, O. N. Fitzsimmons, D. J. Reed, and A. D. Tjelmeland for assistance with field work and reviewing of radar data. We thank M. Schnupp for assistance with Program Distance. T. West and others at DeTect, Inc. provided important technical support throughout the project. We thank the King Ranch, Inc. and the Laguna Atascosa National Wildlife Refuge for permission to conduct field research on their properties. This research was funded by the Robert J. Kleberg, Jr. and Helen C. Kleberg Foundation and the Texas Parks and Wildlife Department. This is manuscript number 13-135 of the Caesar Kleberg Wildlife Research Institute. REFERENCES Able KP (1970). A radar study of the altitude of nocturnal passerine
migration. Bird–Banding 41:282-290. Able KP (1972). Fall migration in coastal Louisiana and the evolution of
migration patterns in the Gulf region. Wilson Bull. 84:231-242. Akaike H (1973). Maximum likelihood identification of Gaussian
autoregressive moving average models. Biometrika 60:255-265. Alerstam T (1979). Wind as selective agent in bird migration. Ornis
Scandinavica 10:76-93. Alerstam T, Lindstӧrm A (1990). Optimal bird migration: the relative
importance of time, energy, and safety. In: Gwinner E (ed). Bird migration: physiology and ecophysiology. Springer, Berlin, Heidelberg, New York. pp. 331-351.
Alerstam T, Hedenstrom A, Åkesson S (2003). Long-distance migration: evolution and determinants. Oikos 103:247-260.
Arnold AJ (2009). Chronology and terrestrial habitat use of migrating birds in southern Texas. M. S. thesis, Texas A&M University-Kingsville, Kingsville, TX, USA.
Belaire JA, Kreakie BJ, Keitt T, Minor E (2014). Predicting and mapping potential whooping crane stopover habitat to guide site selection for wind energy projects. Conserv. Biol. 28:541-550.
Berthold P (2001). Bird Migration: A General Survey. Oxford University Press, New York, NY, USA.
Blair WF (1950). The biotic provinces of Texas. Texas J. Sci. 2:93-117. Bridge ES, Thorup K, Bowlin MS, Chilson PB, Diehl RH, Fléron RW,
Hartl P, Kays R, Kelly JF, Robinson WD, Wikelski M (2011). Technology on the move: recent and forthcoming innovations for tracking migratory birds. Biosci. 61:689-698.
Bruderer B (1997). The study of bird migration by radar. Part 1: the technical basis. Naturwissenschaften 84:1-8.
Bruderer B, Boldt A (2001). Flight characteristics of birds: radar measurements of speed. Ibis 143:178-204.
Buskirk WH (1980). Influence of meteorological patterns and trans–Gulf migration on the calendars of latitudinal migrants. In: Keast A, Morton ES (eds). Migrant birds in the neotropics: ecology, behavior, distribution, and conservation. Smithsonian Institute Press, Washington, D.C., USA. pp. 485-491.
Contreras S (2013). Temporal and Spatial Patterns of Bird Migration
along the Lower Texas Coast. Ph.D. dissertation, Texas A&M University-Kingsville, Kingsville, TX, USA.
Diehl RH, Larkin RP, Black JE (2003). Radar observations of bird migration over the Great Lakes. The Auk 120:278-290.
Faaborg J, Holmes RT, Anders AD, Bildstein KL, Dugger KM, Gauthreaux, Jr. SA, Heglund P, Hobson KA, Jahn AE, Johnson DH, Latta SC, Levey DJ, Marra PP, Merkord CL, Nol E, Rothstein SI, Sherry TW, Sillett TS, Thompson, FR III, Warnock N (2010). Recent advances in understanding migration systems of New World land birds. Ecol. Mon. 80:3-48.
Fijn RC, Krijgsveld KL, Poot MJM, Dirksen S (2015). Bird movements at rotor heights measured continuously with vertical radar at a Dutch offshore windfarm. Ibis 157:558-566.
Fortin D, Liechti F, Bruderer B (1999). Variation in the nocturnal flight behaviour of migratory birds along the northwest coast of the Mediterranean Sea. Ibis 141:480-488.
Forsyth BJ, James D (1971). Springtime movements of transient nocturnally migrating landbirds in the gulf coastal bend region of Texas. The Condor 73:193-207.
Fransson T (1995). Timing and speed of migration in North and West European populations of Sylvia warblers. J. Avian Biol. 26:39-48.
Fulbright TE, Bryant FC (2002). The last great habitat. – Caesar Kleberg Wildlife Research Institute. Special Publication No. 1., Texas A&M University-Kingsville, Kingsville, TX.
Gagnon F, Ibarzabal J, Savard JL, Bélisle M, Vaillancourt P (2011). Autumnal patterns of nocturnal passerine migration in the St. Lawrence estuary region, Quebec, Canada: a weather radar study. Can. J. Zool. 89:31-46.
Gauthreaux SA (1971). A radar and direct visual study of passerine spring migration in southern Louisiana. The Auk 88:343-365.
Gauthreaux SA (1991). The flight behavior of migrating birds in changing wind fields: radar and visual analyses. Am. Zool. 31:187-204.
Gauthreaux SA (1999). Neotropical migrants and the Gulf of Mexico: the view from aloft. In: Able KA (ed). Gatherings of angels: migrating birds and their ecology. Cornell University Press, Ithaca, NY, USA. pp. 27-49.
Gauthreaux SA, Belser CG (1998). Displays of bird movements on the WSR–88D: patterns and quantification. Weather and Forecasting 13:453-464.
Gauthreaux SA, Belser CG (2005). Radar ornithology and the conservation of migratory birds. USDA Forest Service General Technical Report PSW-GTR-191.
Gauthreaux SA, Michi JE, Belser CG (2005). The temporal and spatial structure of the atmosphere and its influence on bird migration strategies. In: Greenberg R, Marra PP (eds). Birds of two worlds: the ecology and evolution of migration. The Johns Hopkins University Press, Baltimore, MD, USA. pp. 182-193.
Gerringer MB, Lima SL, DeVault TL (2016). Evaluation of an Avian Radar System in a Midwestern Landscape. Wildl. Soc. Bull. 40:150-9
Grönroos J, Green M, Alerstam T (2012). To fly or not to fly depending on winds: shorebird migration in different seasonal wind regimes. An. Behav. 83:1449-1457.Guyn KL, Clark RG (1999). Factors affecting survival of northern pintail ducklings in Alberta. The Condor 101:369-377.
Harmata AR, Podruzny KM, Zelenak JR, Morrison ML (2000). Passage rates and timing of bird migration in Montana. Am. Midland Nat. 143:30-40.
Hilbun NL, Koltermann AE (2002). Ranching Heritage. In: Tunnel JW Jr., Judd FW (eds). The Laguna Madre of Texas and Tamaulipas. Texas A&M University Press, College Station, TX, USA. pp. 59-70.
Judd FW (2002). The Tamaulipan Biotic Province. In: Tunnel JW Jr, Judd FW (eds). The Laguna Madre of Texas and Tamaulipas. Texas A&M University Press, College Station, TX, USA. pp. 38-58.
Karlsson H, Nilsson C, Bäckman J, Alerstam T (2012). Nocturnal passerine migrants fly faster in spring than in autumn: a test of the time minimization hypothesis. Anim. Behav. 83:87-93.
Katzner TE, Brandes D, Miller T, Lanzone M, Maisonneuve C, Temblay JA, Mulvihill R, Merovich,GT, Jr (2012). Topography drives migratory flight altitude of golden eagles: implications for on-shore wind

development. J. Appl. Ecol. 49:1178-1186. Kerlinger PH (1995). How birds migrate. Stackpole, Mechanicsburg, PA,
USA. Kerlinger PH, Moore FR (1989). Atmospheric structure and avian
migration. In: Power DM (ed). Current Ornithology 6. Plenum Press, New York, NY, USA. pp. 109-142.
Kokko H (1999). Competition for early arrival in migratory birds. J. Anim. Ecol. 68:940-950.
Krijgsveld KL, Fijn RC, Japink M, van Horssen PW, Heunks C, Collier MP, Poot MJM, Beuker D, Dirksen S (2011). Effect studies offshore wind farm Egmond aan Zee. Final Report. Bureau of Waardenburg bv. 334 p.
Kunz TH, Arnett EB, Cooper BA, Erickson WP, Larkin RP, Mabee T, Morrison ML, Strickland MD, Szewczak JM (2007). Assessing impacts of wind–energy development on nocturnally active birds and bats: a guidance document. J. Wildl. Man. 71:2449-2486.
Kuvlesky WP, Brennan LA, Morrison ML, Boydston KK, Ballard BM, Bryant FC (2007). Wind energy development and wildlife conservation: challenges and opportunities. J. Wildl. Man. 71:2487-2498.
Laake JL, Buckland ST, Anderson DR, Burnham KP (1993). DISTANCE User’s Guide V2.0. Colorado Cooperative Fish and Wildlife Research Unit, Colorado State University, Fort Collins, CO, 72 p.
Langschied TM (1994). Temporal variation in avian communities in southern Texas. M. S. thesis, Texas A&M University–Kingsville, Kingsville, TX, USA.
Larkin RP (1991). Flight speeds observed by radar, a correction: slow “birds” are insects. Behav. Ecol. Soc. 29:221-224.
Lowery GH (1951). A quantitative study of the nocturnal migration of birds. University of Kansas Publications, Museum Nat. Hist. 3:361-472.
Mabee TJ, Cooper BA (2004). Nocturnal bird migration in northeastern Oregon and southeastern Washington. Northwestern Nat. 85:39-47.
Mabee TJ, Cooper BA, Plissner JH, Young DP (2006). Nocturnal bird migration over an Appalachian ridge at a proposed wind power project. Wildl. Soc. Bull. 34:682-690.
Mateos-Rodríguez M, Liechti F (2012). How do diurnal long-distance migrants select flight altitude in relation to wind? Behav. Ecol. 23:403-409.
McCullagh P, Nelder JA (1989). Generalized Linear Models. Chapman and Hall, London, UK.
Moore FR III, Simons TR (1990). Habitat suitability and the stopover ecology of Neotropical landbird migrants. In Ecology and conservation of neotropical migrant landbirds (J. Hagen and D. Johnston, Editors). Smithsonian Institute Press, Washington, D. C., USA. pp. 345-355.
Moore FR III, Gauthreaux SA, Kerlinger P, Simons TR (1993). Stopover habitat: management implications and guidelines. In Status and management of neotropical migratory birds (D. Finch and P Stangel, Editors). USDA Technical Report RM-229, Rocky Mountain Forest and Range Experiment Station, Fort Collins, CO, USA. pp. 58-69.
Moore FR III, Gauthreaux SA Jr, Kerlinger P, Simons TR (1995). Habitat requirements during migration: important link in the conservation of neotropical landbird migrants. In: Martin T, Finch D (eds). Ecology and management of neotropical migratory birds. Oxford University Press. New York, NY, USA. pp. 121-144.
Newton I (2010). The Migration Ecology of Birds. Academic Press, London, UK.
Pulido F (2007). The genetics and evolution of avian migration. BioScience 57:165-174.
Ramenofsky M, Wingfield JC (2007). Regulation of migration. BioScience 57:135-143.
Rappole JH, Blacklock GW (1985). Birds of the Texas coastal bend: abundance and distribution. Texas A&M University Press, College Station, Texas.
Walsh et al. 199 Richardson WJ (1978). Timing and amount of bird migration in relation
to weather: a Review. Oikos 30:224-272. Richardson WJ (1990). Timing of bird migration in relation to weather:
updated review. In: Gwinner E (ed). Bird migration: physiology and ecophysiology. Springer, Berlin, Heidelberg, New York. pp. 78-101.
SAS Institute, Inc. (2009). SAS statistical software v. 9.2. SAS Institute, Inc., Cary, North Carolina.
Schmaljohann H, Liechti F, Bruderer B (2007). Songbird migration across the Sahara: the non–stop hypothesis rejected! Proceedings of the Royal Society of London B 274:735-739.
Shackelford CE, Lockwood MW (2005). The Birds of Texas: Occurrence and Seasonal Movements. Texas Parks and Wildlife.
Sillett TS, Holmes RT (2002). Variation in survivorship of a migratory songbird throughout its annual cycle. J. An. Ecol. 71:296-308.
Smith RJ, Moore FR (2005). Arrival timing and seasonal reproductive performance in a long–distance migratory landbird. Behav. Ecol. Sociobiol. 57:231-239.
Stutzenbaker CD, Weller MW (1989). The Texas Coast. In: Smith LM, Pederson RL, Kaminski RM, (eds). Habitat management for migrating and wintering waterfowl in North America. Texas Tech University Press, Lubbock, TX, USA. pp. 385-406.
Tunnell JW (2002). Geography, Climate, and Hydrography. In: Tunnell JW, Jr., Judd FW, (eds). The Laguna Madre of Texas and Tamaulipas. Texas A&M University Press, College Station, TX, USA. pp. 7-27.
Tøttrup AP, Klaassen RHG, Roine Strandberg R, Thorup K, Kristensen MW, Jørgensen PS, Fox J, Afanasyev V, Rahbek C, Alerstam T (2012). The annual cycle of a trans–equatorial Eurasian–African passerine migrant: different spatio–temporal strategies for autumn and spring migration. Proceed. Royal Soc. Lond. B 279:1008-1016.
Tuttle MD (1997). America’s neighborhood bats. University of Texas Press, Austin, TX, USA, 105 p.
Zehnder S, Åkesson S, Liechti F, Bruderer B (2001). Nocturnal autumn bird migration at Falsterbo, South Sweden. J. Avian Biol. 32:239-248.