high-depth-resolution range imaging with multiple...
TRANSCRIPT
High-depth-resolution range imaging withmultiple-wavelength superheterodyneinterferometry using 1550-nm lasersFENGQIANG LI,1,* JOSHUA YABLON,1 ANDREAS VELTEN,2,3 MOHIT GUPTA,4 AND OLIVER COSSAIRT1
1Department of Electrical Engineering and Computer Science, Northwestern University, 2145 Sheridan Road, Evanston, Illinois 60201, USA2Department of Biostatistics and Medical Informatics, University of Wisconsin-Madison, 1300 University Ave, Madison, Wisconsin 53706, USA3Department of Electrical and Computer Engineering, University of Wisconsin-Madison, 1300 University Ave, Madison, Wisconsin 53706, USA4Department of Computer Science, University of Wisconsin-Madison, 1210 Dayton Street, Madison, Wisconsin 53706, USA*Corresponding author: [email protected]
Received 1 June 2017; revised 28 July 2017; accepted 22 August 2017; posted 23 August 2017 (Doc. ID 297083); published 15 September 2017
Lasers and laser diodes are widely used as illumination sources for optical imaging techniques. Time-of-flight(ToF) cameras with laser diodes and range imaging based on optical interferometry systems using lasers are amongthese techniques, with various applications in fields such as metrology and machine vision. ToF cameras can haveimaging ranges of several meters, but offer only centimeter-level depth resolution. On the other hand, rangeimaging based on optical interferometry has depth resolution on the micrometer and even nanometer scale, butoffers very limited (sub-millimeter) imaging ranges. In this paper, we propose a range imaging system based onmulti-wavelength superheterodyne interferometry to simultaneously provide sub-millimeter depth resolution andan imaging range of tens to hundreds of millimeters. The proposed setup uses two tunable III-V semiconductorlasers and offers leverage between imaging range and resolution. The system is composed entirely of fiber con-nections except the scanning head, which enables it to be made into a portable device. We believe our proposedsystem has the potential to tremendously benefit many fields, such as metrology and computer vision. © 2017
Optical Society of America
OCIS codes: (140.0140) Lasers and laser optics; (100.3175) Interferometric imaging; (110.0110) Imaging systems.
https://doi.org/10.1364/AO.56.000H51
1. INTRODUCTION
Range or three-dimensional (3D) imaging techniques usinglasers or laser diodes as illumination sources can provide depthinformation of objects being scanned. These optical rangeimaging techniques have lots of important applications, such asmetrology [1] and machine vision, especially for robots andself-driving cars [2,3]. Among these range-imaging techniques,time-of-flight (ToF) cameras with a laser diode as the illumi-nation source and range imaging based on interferometry aretwo important types of systems. For range-imaging techniques,higher depth resolution and longer imaging range are alwayssought, in order to resolve finer details of an object and imagelarger-scale objects.
Recently, ToF cameras have been a promising range-imagingtechnique due to cost efficiency and compact size [4–7] com-pared with light detection and ranging (lidar) devices [8].ToF cameras have been widely used in machine perception andtracking applications such asMicrosoft’s Kinect [9] andmachinevision for robots [10]. ToF cameras typically employ high-frequency (generally 10–100 MHz) amplitude modulation of
the laser output. The modulating signal is simultaneously sentto ToF camera pixels as a reference. Correlation and demodu-lation between the reference signal and the reflection signal fromthe object are obtained to calculate depth information. ToFcameras can provide an unambiguous imaging range of severalmeters and depth resolution on the centimeter level [11]. Theexpression governing the correlation I t between the referenceand the received light is presented in Eq. (1) [12], which showsthat the modulation frequency f t controls the depth resolution.In order to increase depth resolution, higher modulation fre-quency is needed. However, depth resolution on themicrometerlevel is not possible because ToF sensors cannot be modulated atGHz frequencies.
On the other hand, range imaging based on laser interfer-ometry has depth resolution on the micrometer or nanometerscale and is used widely in metrology and biophotonics imagingto resolve fine features of various structures [13–19]. In optical-interferometry-based range imaging, a continuous wave laser issplit into two beams with one beam illuminating the object andthe other beam used as a reference. The optical frequency (f o)
Research Article Vol. 56, No. 31 / November 1 2017 / Applied Optics H51
1559-128X/17/310H51-06 Journal © 2017 Optical Society of America
serves as the modulation frequency. The detector receivesthe interference signal I o [as shown in Eq. (1)] between thereflection beam from the object and the reference beam [14].Since the modulation frequency f o is on the order of 1014 Hz,the depth resolution is much higher than that of ToF cameras.The drawback to this high depth resolution is sub-millimeterimaging range. Furthermore, this system can operate only oncritical platforms, such as isolated optical tables. In order tosolve the problem of limited imaging range, the optical fre-quency can be decreased by orders of magnitude to generatemillimeter or centimeter imaging range. However, stablesources of coherent electromagnetic radiation with such longwavelengths do not exist
I i � αi � βi cos
�4π
f i
cz � ϕi
�; i � t; o; p: (1)
Equation (1) (t: ToF cameras; o: range imaging based onoptical interferometry; p: proposed solution) shows the outputsin ToF cameras and interferometry-based range imaging with zrepresenting the distance from the sensor to the point of inter-est on the object, while c is the speed of light. αi, βi, and ϕi areconstants with different values in different imaging models.This equation shows that the modulation frequency controlsboth depth resolution and imaging range and that there is atradeoff between these two parameters. [In Eq. (1), the depthinformation can be demodulated with a phase of 4π�f i∕c�z.The maximum achievable phase difference without phasewrapping is 2π. Imaging range can be calculated with this maxi-mum phase value. Therefore, the higher the modulation fre-quency, the shorter the imaging range. For depth resolution, weassume that the resolution is limited by the sensor SNR. Thephase 4π�f i∕c�z ranges from 0 to 2π and is demodulated byusing the intensity information I i. Suppose the number of graylevels in the detectors is N . Then each gray level represents theresolution of the imaging system as c∕�2Nf i�. Therefore, thehigher the frequency, the higher the depth resolution.] The mo-tivation of this study is therefore to generate a GHz or evenTHz frequency f p with the same output model as shown inEq. (1) in order to have micrometer depth resolution, whilesimultaneously having an imaging range of several hundredmillimeters.
In this paper, we propose an imaging system using super-heterodyne interferometry [20] where two 1550-nm III–Vsemiconductor lasers with slightly different optical frequenciesare used to generate a GHz-frequency optical beat-note signalused for detection. In the following sections, a mathematicalmodel is developed and simulations are performed based onthis proposed method, and a prototype system is built andtested. This setup allows flexibility between imaging range anddepth resolution, since the lasers are tunable. Furthermore, thesystem can be operated in noisy environments and is com-pletely fiber based, which makes the device portable.
2. EXPERIMENTAL SETUP
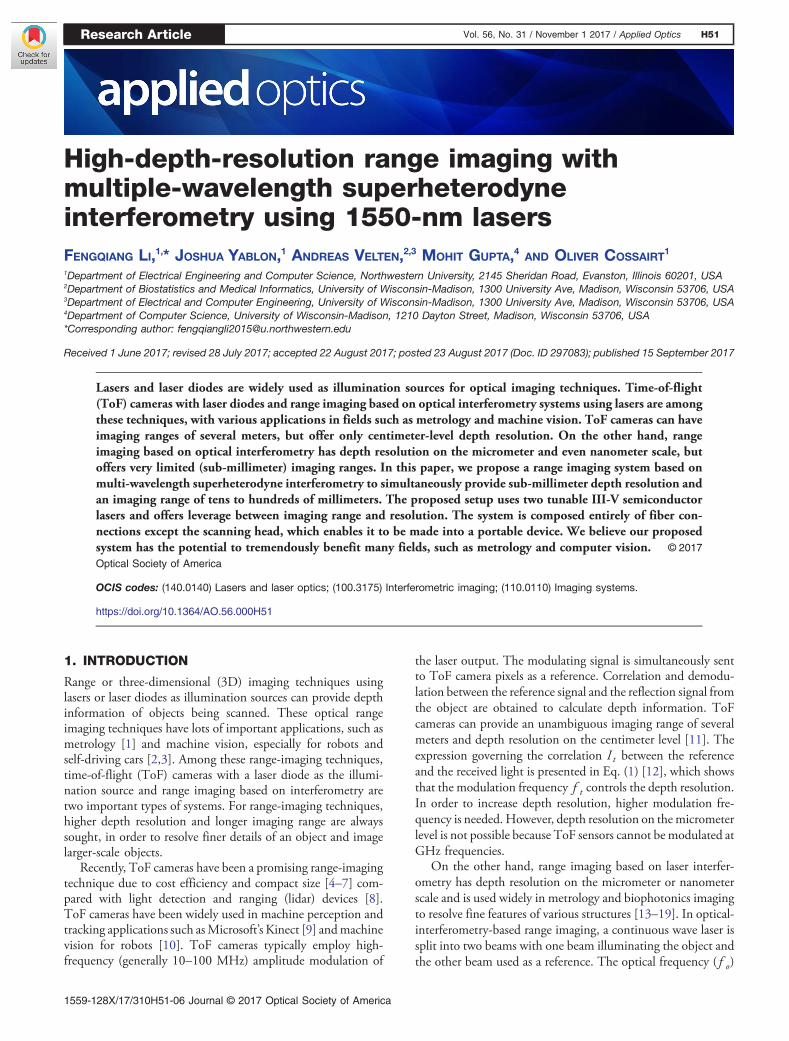
The schematic of our proposed setup is shown in Fig. 1. Thesystem is constructed with two InP tunable lasers (PPCL200,Pure Photonics) with a center wavelength of ∼1550 nm. Thelinewidth of each tunable laser is ∼10 KHz, which corresponds
to a coherence length of several tens of kilometers. Fiber cou-plers (FCs) are used to split and combine the beams, whileelectro-optic modulators (EOMs) are used to modulate thephase of the light. The galvo scans the beam across differentpoints on the object, and an avalanche photodiode (APD) de-tects the interference signal.
The beams from the two lasers are split by 90/10 fiber cou-plers with 90% of the input beams directed toward the samplearm. The two beams in the reference arm are combined, withhalf of each input beam directed toward the circulator. The com-bined beam is then guided to port P1 of the fiber circulator,which directs the beam to the collimator and galvo scanner.The beam reflected from the object is collimated with a lensand directed from port P2 to port P3 to the detector. In the refer-ence arm, the beam from laser 1 first goes though EOM 1(LN53S-FC, Thorlabs), which sweeps the phase of the beamwith values of −π∕2, 0, π∕2 to π. The beam after EOM 1 is thencombined with the beam from laser 2, with half of each beamguided to EOM 2 (the same model as EOM 1), which introdu-ces a high-frequency sinusoidal phase modulation to the beam.The beam from the reference arm is combined with the beamfrom the circulator port P3 by a 90/10 fiber coupler with 90% ofthe sample arm beamdirected toward the APD.The interferencesignal between these two beams is detected by the APD(APD430C, Thorlabs). The APD converts the optical signalinto an electrical signal, which is then sent into a quadraticsensor. This quadratic sensor contains a frequency mixer anda low-pass filter with cutoff frequency of 1.9 MHz. An NI dataacquisition (DAQ) card (PCIe 6363, National Instruments)digitizes the signal. The depth information for one point onthe object can then be calculated by using the four phase mea-surements. This process is then repeated for each point alongthe scan.
3. MATHEMATICAL MODEL
The mathematical model governing this proposed system is de-scribed in this section. The effect of environmental vibration tothe system is modeled using a velocity-based vibration model[21]. The intensities of lasers 1 and 2 are constants with valuesof kE1k2 and kE2k2, respectively. The wavelengths of lasers 1and 2 are λ1 and λ2, respectively. The electric field of the beam
Galvo
Laser 2
Laser 1
APDMixerNI Card
Computer
Quadratic sensor
FCFC
FC FC
FC
CIRP1
P2P3
EOM 1
EOM 2
D1D2
90/10
90/10
90/10
50/50
50/50
Lens
Object
Fig. 1. Schematic of our proposed setup: Two tunable lasers areused as the illumination sources. FC, fiber coupler; EOM, eletro-opticmodulator; CIR, fiber circulator; APD, avalanche photo-diode; D1,driver for EOM 1; and D2, driver for EOM 2. All fibers are polari-zation maintaining. The NI card and the two drivers are controlledwith a computer. Red lines, sample arm. Black lines, reference arm.
H52 Vol. 56, No. 31 / November 1 2017 / Applied Optics Research Article

reflected from the object to the detector is Es�t�, and the elec-tric field of the reference beam going into the detector is Er�t�,and can be written as
Es�t� � α1βE1ei�2πν1t�V t
λ1�4π
λ1Ls� � α2βE2e
i�2πν2t�V tλ2�4π
λ2Ls�; (2)
Er�t� � γ1E1ei�2πν1t�4π
λ1Lr�ψ�2πf t� � γ2E2e
i�2πν2t�4πλ2Lr�2πf t�;
(3)
where α1, α2, γ1, and γ2 are intensity reduction factors due tobeam splitting and fiber insertion loss. β is the efficiency ofbeam reflection from the object surface. ν1 and ν2 are the op-tical frequencies of laser 1 and laser 2, respectively. V representsthe velocity value in the velocity-based vibration model as de-scribed above. Lr is the optical path length for the light travelingin the reference arm, while Ls is the optical path length for thesample arm, which encodes the depth information of the ob-ject. ψ is the phase added by EOM 1, and f is the modulationfrequency of EOM 2.
The beam reflected from the object surface interferes withthe reference beam when they meet in the fiber coupler. Theoptical signal I�t� going into the APD can be written as follows(the APD converts the photonic signal into an electrical signal):
I�t� � �Es�t� � Er�t�� × �Es�t�� � Er�t���
� a0 � a1 cos
�V tλ1
� ϕ1 − ψ − 2πf t�
� a2 cos
�V tλ2
� ϕ2 − 2πf t�; (4)
where a0 � �α1βE1�2 ��γ1E1�2 ��α2βE2�2 ��γ2E2�2, a1 �2α1βγ1E2
1, and a2 � 2α2βγ2E22. a0, a1, and a2 are
constants. ϕ1 � 4πL∕λ1, and ϕ2 � 4πL∕λ2. L is equal to�Ls − Lr�, which is the optical path length difference betweenthe sample and reference arms.
In order to generate a GHz beat-note frequency (ν1 − ν2),the electrical signal from the APD is sent into a “quadraticsensor,” which is a frequency mixer combined with a low-passfilter. The signal after the mixer, S�t�, is as follows:
S�t� � I�t�2 ��a0 � a1 cos
�V tλ1
� ϕ1 − ψ − 2πf t�
�a2 cos
�V tλ2
� ϕ2 − 2πf t��
2
: (5)
S�t� contains DC components, components with frequencyof f , and 2f -frequency components. The low-pass filterremoves the f and 2f components, so that the signal afterthe low-pass filter L�t� is
L�t� � m1 · cos�V tΛ
� 4πLΛ
− ψ
�� m2; (6)
where m1 � a1a2, and m2 is a constant. Λ is the so-called“synthetic wavelength,” which is equal to λ1λ2∕�λ2 − λ1�.
A DAQ card converts the analog signal (L�t�) into a digitalsignal (o�t�) with satisfying Nyquist sampling condition. Thesynthetic wavelength is determined by the selection of λ1 and λ2and is on the order of tens of millimeters in our experiment.The synthetic wavelength is much larger than the amplitude of
most mechanical vibrations, thus rendering vibration effectsnegligible. The output signal is then
o�t� � m1 cos
�V tΛ
� 4πLΛ
− ψ
�� m2
≈ m1 cos
�4πLΛ
− ψ
�� m2: (7)
Since Λ equals c∕�ν1 − ν2�, the output signal o�t� can bewritten as
o�t� � m1 cos
�4π
ΔνcL − ψ
�� m2; (8)
whereΔν equals �ν1 − ν2�. Therefore, a new frequencyΔν witha value tunable anywhere from DC to THz range is generated,as proposed in Eq. (1).
Four measurements are taken at phase values of −π∕2, 0,π∕2, π using EOM 1 [4]:
o1 � oa cos�4π
ΔνcL�� ob; (9)
o2 � oa cos�4π
ΔνcL −
π
2
�� oa sin
�4π
ΔνcL�� ob;
(10)
o3 � oa cos�4π
ΔνcL − π
�� −oa cos
�4π
ΔνcL�� ob;
(11)
o4 � oa cos�4π
ΔνcL −
3π
2
�� −oa sin
�4π
ΔνcL�� ob:
(12)
The depth information (L) can be calculated as
L � c4πΔν
arctan
�o2 − o4o1 − o3
�: (13)
This process can be repeated for all points on the object’ssurface using a galvo scanner.
4. SIMULATION
To theoretically validate the concept of this proposed imagingsystem, we performed a simulation based on the mathematicalmodel. The wavelengths of the two lasers are set as 1550 nmand 1550.01 nm. The velocity of the environmental vibrationis set at 1 mm/s. The intensity reductions of α1 and α2 are set at0.49 for the sample arm, and γ1 and γ2 are set at 0.001. Themodulation frequency of EOM 2 is 15 MHz. The object ismodeled with the Lambertian model. White noise with SNRof 27.8 dB is added to the APD readout. Another white noisesource with SNR of 29 dB is added in the analog-to-digital(ADC) conversion.
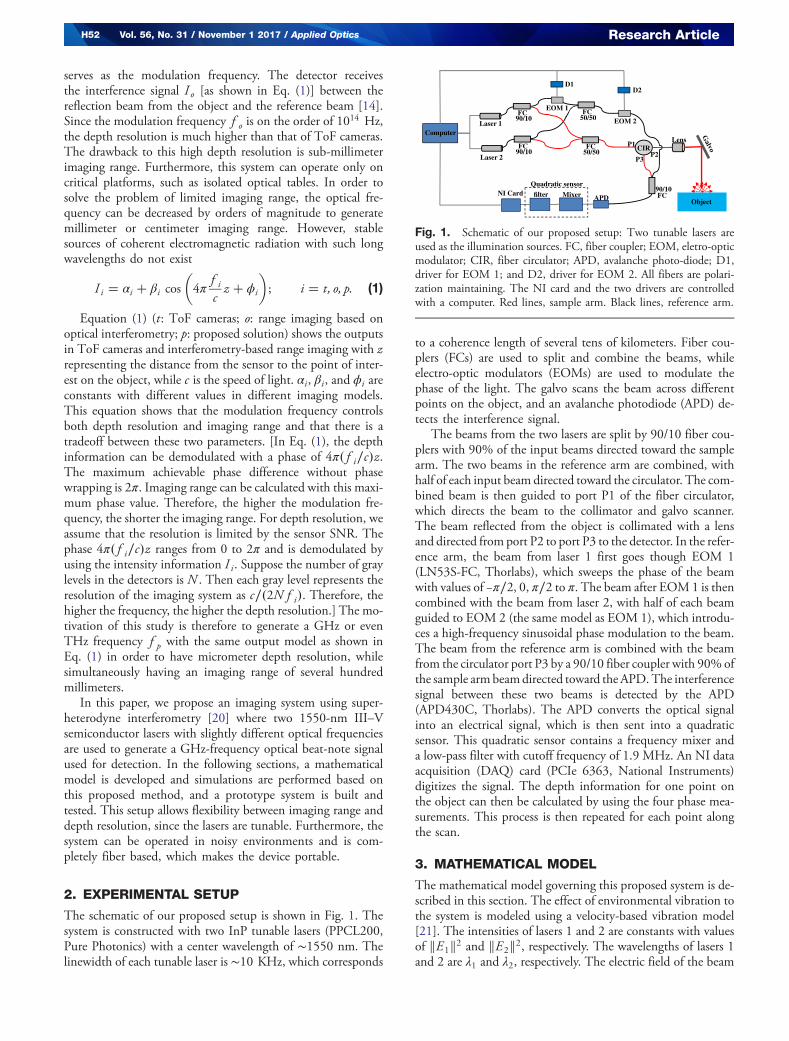
The signal processing flow for a single point on the surfaceof the object is shown in Fig. 2. The APD output of the re-ceived interference signal is shown in Fig. 2(a). As shown inFig. 2(b) of the interference sginal’s spectrum, the 15-MHzfrequency component is resolved by the APD. The mixer out-put is shown in Fig. 2(c) with its spectrum shown in Fig. 2(d).The DC component, 15-MHz component, and 30-MHz
Research Article Vol. 56, No. 31 / November 1 2017 / Applied Optics H53
component are clearly observed. The 15- and 30-MHz com-ponents are removed by the low-pass filter, as shown inFig. 2(e) with its spectrum shown in Fig. 2(f ). White noiseis added to the low-pass filter output and then sampled with
the DAQ card, as shown in Figs. 2(g) and 2(h) (marked withred line). The depth information is calculated with the previousfour-bucket method by sweeping the phase in EOM 1.
A 3D object containing many stair-steps with depth rangingfrom 0 to 100 mm with a step of 5 mm (from center to edge) isgenerated as the ground truth shown in Fig. 3(a). The depthinformation for the whole object calculated using the previousmethod without noise is shown in Fig. 3(b), while the depthinformation with noise is shown in Fig. 3(c). Phase wrappingoccurs if the depth is larger than the imaging range of 60 mm,as shown in Figs. 3(b) and 3(c). The cross-lines at the samelocation in Figs. 3(a)–3(c) are shown in Fig. 4. The simulatedmeasurement with noise is compared to the no-noise data andthe ground truth data, as shown in the inset [Fig. 4(b)]. Thedifference ΔL between simulated measurements with noise andground truth was compared and analyzed. The mean of ΔL is0.0026 mm with a standard deviation of 0.2226 mm. This in-dicates that the depth resolution is far less than 1 mm, withan imaging range of 60 mm. This gives the credibility to theconcept of our proposed imaging system.
5. EXPERIMENTS AND RESULTS
After validating this system, we built an experimental prototypeas previously described. The wavelengths of the two tunablelasers are 1550 nm and 1550.04 nm. The offset between λ1and λ2 in the prototype is set to be larger than that in thesimulation experiment to make the optical beat-note frequencystable. The output power of each laser is about 25 mW. Acustom-made driver controlled by the DAQ card is used todrive EOM 1. Another driver is used to drive EOM 2 with
Fig. 2. Signal processing flow for one point: (a) simulated APD out-put; (b) spectrum of simulated APD output; (c) signal after the mixerin the quadratic sensor; (d) spectrum of mixer output; (e) signal afterthe quadratic sensor; (f ) spectrum of the quadratic sensor output;(g) analog-to-digital conversion by the DAQ card (red line) of thequadratic sensor output (black line); and (h) inset of the signal in (g).
Fig. 3. (a) Groundtruth 3D objects; (b) simulated 3D images withno noise added in the APD and the NI card; and (c) simulated 3Dimages with noise added. The x axis and the y axis mark the pixelnumber in the x and y dimensions. Different colors represent thedepth information with values from 0 to 100 mm. Color bar unitsare in meters.
Fig. 4. A line plot across the simulated 3D object in Fig. 3(a), depthvalues on pixels along the line in simulated measurement with noise,simulated measurement without noise, and ground truth. The imagingrange is about 60 mm as shown in the plot; (b) inset of (a) shows azoomed-in offset between measurements and the ground truth. Thereis overlap between the noiseless simulated measurement and theground truth.
H54 Vol. 56, No. 31 / November 1 2017 / Applied Optics Research Article
a modulation frequency of 15 MHz. A low-pass filter with acutoff frequency of 22 MHz is used to remove high-harmoniccomponents of the output from driver 2 before sending thisdriver output to EOM 2. The half-wave voltage of EOM 1is approximately 3 volts.
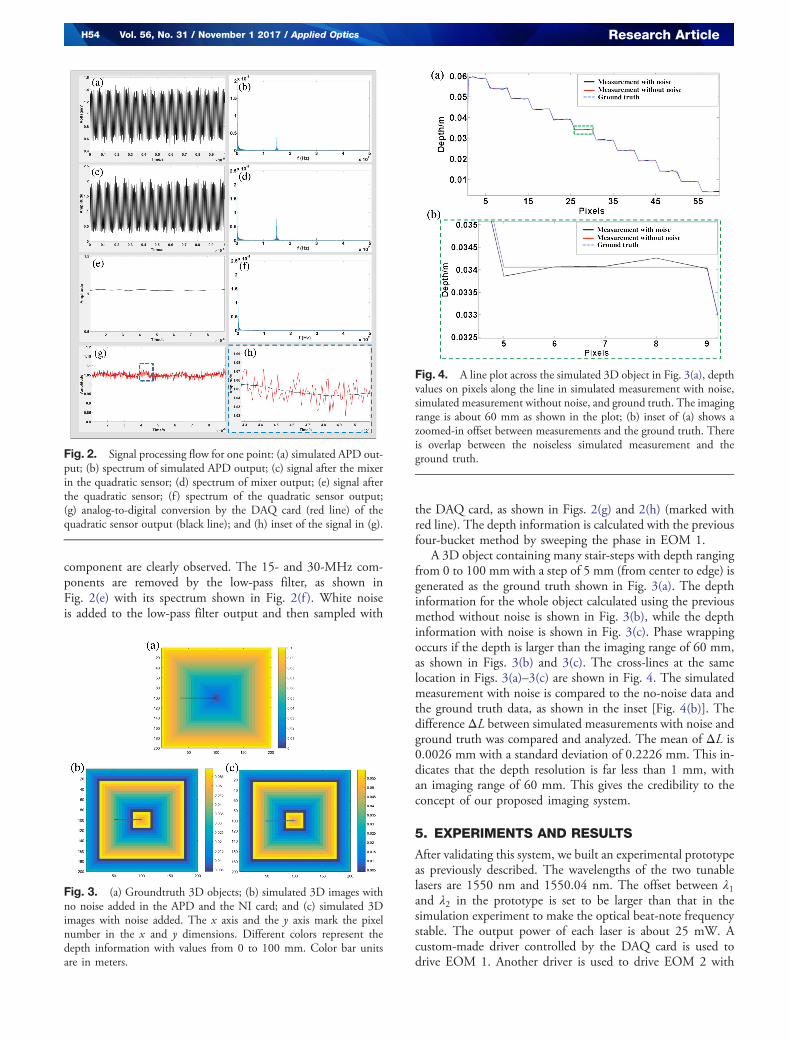
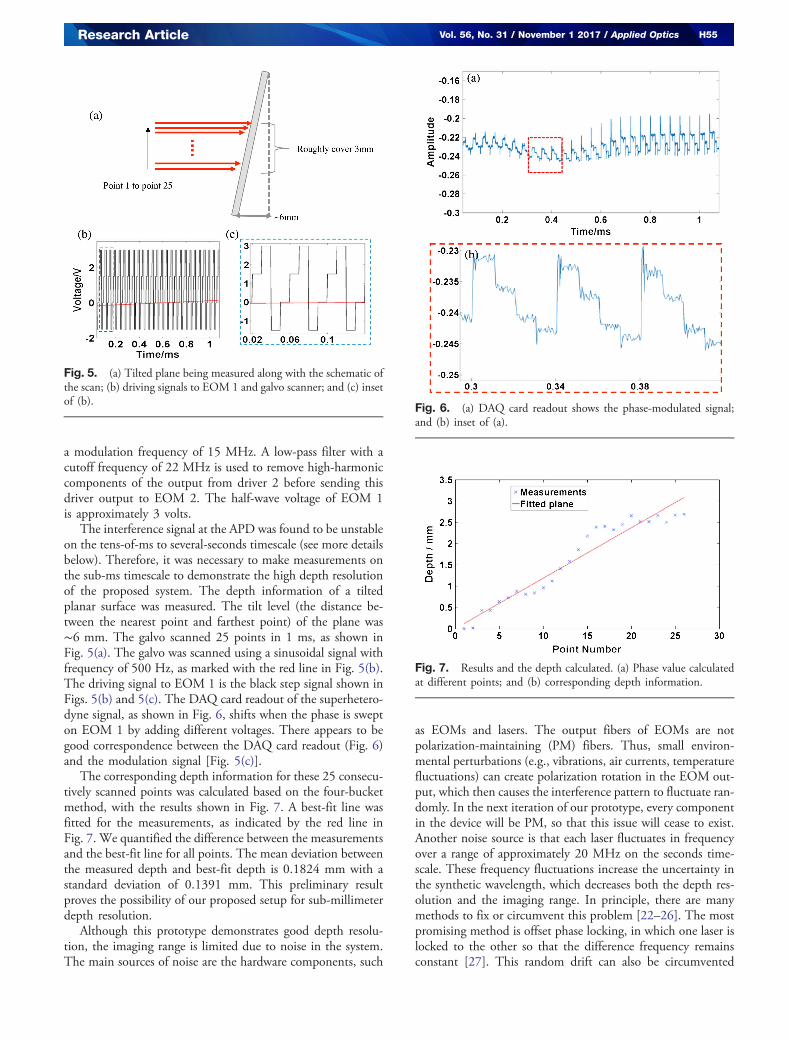
The interference signal at the APD was found to be unstableon the tens-of-ms to several-seconds timescale (see more detailsbelow). Therefore, it was necessary to make measurements onthe sub-ms timescale to demonstrate the high depth resolutionof the proposed system. The depth information of a tiltedplanar surface was measured. The tilt level (the distance be-tween the nearest point and farthest point) of the plane was∼6 mm. The galvo scanned 25 points in 1 ms, as shown inFig. 5(a). The galvo was scanned using a sinusoidal signal withfrequency of 500 Hz, as marked with the red line in Fig. 5(b).The driving signal to EOM 1 is the black step signal shown inFigs. 5(b) and 5(c). The DAQ card readout of the superhetero-dyne signal, as shown in Fig. 6, shifts when the phase is swepton EOM 1 by adding different voltages. There appears to begood correspondence between the DAQ card readout (Fig. 6)and the modulation signal [Fig. 5(c)].
The corresponding depth information for these 25 consecu-tively scanned points was calculated based on the four-bucketmethod, with the results shown in Fig. 7. A best-fit line wasfitted for the measurements, as indicated by the red line inFig. 7. We quantified the difference between the measurementsand the best-fit line for all points. The mean deviation betweenthe measured depth and best-fit depth is 0.1824 mm with astandard deviation of 0.1391 mm. This preliminary resultproves the possibility of our proposed setup for sub-millimeterdepth resolution.
Although this prototype demonstrates good depth resolu-tion, the imaging range is limited due to noise in the system.The main sources of noise are the hardware components, such
as EOMs and lasers. The output fibers of EOMs are notpolarization-maintaining (PM) fibers. Thus, small environ-mental perturbations (e.g., vibrations, air currents, temperaturefluctuations) can create polarization rotation in the EOM out-put, which then causes the interference pattern to fluctuate ran-domly. In the next iteration of our prototype, every componentin the device will be PM, so that this issue will cease to exist.Another noise source is that each laser fluctuates in frequencyover a range of approximately 20 MHz on the seconds time-scale. These frequency fluctuations increase the uncertainty inthe synthetic wavelength, which decreases both the depth res-olution and the imaging range. In principle, there are manymethods to fix or circumvent this problem [22–26]. The mostpromising method is offset phase locking, in which one laser islocked to the other so that the difference frequency remainsconstant [27]. This random drift can also be circumvented
Fig. 5. (a) Tilted plane being measured along with the schematic ofthe scan; (b) driving signals to EOM 1 and galvo scanner; and (c) insetof (b).
Fig. 6. (a) DAQ card readout shows the phase-modulated signal;and (b) inset of (a).
Fig. 7. Results and the depth calculated. (a) Phase value calculatedat different points; and (b) corresponding depth information.
Research Article Vol. 56, No. 31 / November 1 2017 / Applied Optics H55

to some extent by using a synthetic wavelength that corre-sponds to a very high beat-note frequency, so that the 40-MHzbeat-frequency drift is less significant. For example, if the syn-thetic frequency is set to 4 GHz, then a 40-MHz uncertaintywould correspond to an uncertainty in the beat-note (andtherefore an uncertainty in the synthetic wavelength) of onepercent. Finally, another way to circumvent this issue would beto create a second “reference arm” that would be used tomeasure and subtract the random drift when performing depthcalculations.
The next step is to design and build a new experimentalsystem that can solve the hardware instability issues. Offsetphase locking the lasers and replacing EOMs with acousto-optic modulators (AOMs) should make the system work forthe entire proposed frequency range, and should make it morereliable. We believe this new system will fill an important nichebetween 3D imaging based on optical interferometry and ToFimaging.
6. CONCLUSION
In conclusion, we have proposed a fiber-basedmulti-wavelengthinterferometry system using two 1550-nm lasers to achievesub-millimeter depth resolution and an imaging range of severaltens of centimeters. Our simulation and preliminary experimen-tal results have demonstrated that this idea is promising. Thissystem is more robust than other standard imaging systems be-cause it has a long imaging range, high resolution, is portable,and does not need to be operated in an isolated environment.This system can benefit the field of metrology by providinghigh-accuracy depthmeasurement with long image range simul-taneously. It also has the potential to provide high-accuracy3D models applicable to the fields of computer vision and com-puter graphics applications, such as 3D human face scanning.
Funding. National Science Foundation (NSF) (IIS-1453192); Office of Naval Research (ONR) (N00014-15-1-2735); Defense Advanced Research Projects Agency(DARPA) (HR0011-16-C-0028).
Acknowledgment. The authors would like to thank ShihTseng for building a custom driver for EOM 1.
REFERENCES1. K. J. Gåsvik, Optical Metrology (Wiley, 2003).2. S. Se and P. Jasiobedzki, “Photo-realistic 3Dmodel reconstruction,” in
Proceedings of IEEE International Conference on Robotics andAutomation (2006), pp. 3076–3082.
3. J. Levinson, J. Askeland, J. Becker, J. Dolson, D. Held, S. Kammel,J. Z. Kolter, D. Langer, O. Pink, V. Pratt, M. Sokolsky, G. Stanek, D.Stavens, A. Teichman, M. Werling, and S. Thrun, “Towards fullyautonomous driving: systems and algorithms,” in IEEE IntelligentVehicles Symposium (2011), pp. 163–168.
4. R. Lange and P. Seitz, “Solid-state time-of-flight range camera,” IEEEJ. Quantum Electron. 37, 390–397 (2001).
5. T. Möller, H. Kraft, J. Frey, M. Albrecht, and R. Lange, “Robust 3Dmeasurement with PMD sensors,” Range Imaging Day, Zürich 7, 8(2005).
6. R. Lange, P. Seitz, A. Biber, and S. C. Lauxtermann, “Demodulationpixels in CCD and CMOS technologies for time-of-flight ranging,”
in Electronic Imaging (International Society for Optics andPhotonics, 2000), pp. 177–188.
7. R. Schwarte, Z. Xu, H.-G. Heinol, J. Olk, R. Klein, B. Buxbaum, H.Fischer, and J. Schulte, “New electro-optical mixing and correlatingsensor: facilities and applications of the photonic mixer device(PMD),” in Lasers and Optics in Manufacturing III (InternationalSociety for Optics and Photonics, 1997), pp. 245–253.
8. C. Weitkamp, Lidar: Range-Resolved Optical Remote Sensing of theAtmosphere (Springer, 2006), Vol. 102.
9. Z. Zhang, “Microsoft Kinect sensor and its effect,” IEEEMultiMedia 19,4–10 (2012).
10. J. Sturm, N. Engelhard, F. Endres, W. Burgard, and D. Cremers, “Abenchmark for the evaluation of RGB-D SLAM systems,” in IEEE/RSJInternational Conference on Intelligent Robots and Systems (IROS)(IEEE, 2012), pp. 573–580.
11. S. Foix, G. Alenya, and C. Torras, “Lock-in time-of-flight (TOF) cam-eras: a survey,” IEEE Sens. J. 11, 1917–1926 (2011).
12. F. Heide, M. B. Hullin, J. Gregson, and W. Heidrich, “Low-budgettransient imaging using photonic mixer devices,” ACM Trans. Graph.(ToG) 32, 45 (2013).
13. J. H. Bruning, D. R. Herriott, J. E. Gallagher, D. P. Rosenfeld, A. D.White, and D. J. Brangaccio, “Digital wavefront measuring interferom-eter for testing optical surfaces and lenses,” Appl. Opt. 13, 2693–2703(1974).
14. T. Dresel, G. Häusler, and H. Venzke, “Three-dimensional sensingof rough surfaces by coherence radar,” Appl. Opt. 31, 919–925(1992).
15. H. Haitjema, “Achieving traceability and sub-nanometer uncertaintyusing interferometric techniques,” Meas. Sci. Technol. 19, 084002(2008).
16. Z. Wang, B. Potsaid, L. Chen, C. Doerr, H.-C. Lee, T. Nielson, V.Jayaraman, A. E. Cable, E. Swanson, and J. G. Fujimoto, “Cubicmeter volume optical coherence tomography,” Optica 3, 1496–1503(2016).
17. D. Huang, E. A. Swanson, C. P. Lin, J. S. Schuman, W. G. Stinson, W.Chang, M. R. Hee, T. Flotte, K. Gregory, C. A. Puliafito, and J. G.Fujimoto, “Optical coherence tomography,” Science 254, 1178–1181 (1991).
18. F. Li, Y. Song, A. Dryer, W. Cogguillo, Y. Berdichevsky, and C. Zhou,“Nondestructive evaluation of progressive neuronal changes in orga-notypic rat hippocampal slice cultures using ultrahigh-resolutionoptical coherence microscopy,” Neurophotonics 1, 025002 (2014).
19. F. Li, T. Xu, D.-H. T. Nguyen, X. Huang, C. S. Chen, and C. Zhou,“Label-free evaluation of angiogenic sprouting in microengineereddevices using ultrahigh-resolution optical coherence microscopy,”J. Biomed. Opt. 19, 016006 (2014).
20. R. Dändliker, R. Thalmann, and D. Prongué, “Two-wavelength laserinterferometry using superheterodyne detection,” Opt. Lett. 13, 339–341 (1988).
21. C. G. Gordon, “Generic vibration criteria for vibration-sensitive equip-ment,” Proc. SPIE 3786, 22–33 (1999).
22. M. Reich, R. Schieder, H. J. Clar, and G. Winnewisser, “Internallycoupled Fabry-Perot interferometer for high precision wavelengthcontrol of tunable diode lasers,” Appl. Opt. 25, 130–135 (1986).
23. L. Goldberg, H. Taylor, and J. Weller, “Fm sideband injection lockingof diode lasers,” Electron. Lett. 18, 1019–1020 (1982).
24. M. De Labachelerie, K. Nakagawa, Y. Awaji, and M. Ohtsu, “High-frequency-stability laser at 1.5 μmusing doppler-free molecular lines,”Opt. Lett. 20, 572–574 (1995).
25. Y. Chung and C. Roxlo, “Frequency-locking of a 1.5 μm DFB laser toan atomic krypton line using optogalvanic effect,” Electron. Lett. 24,1048–1049 (1988).
26. R. J. Jones and J.-C. Diels, “Stabilization of femtosecond lasers foroptical frequency metrology and direct optical to radio frequencysynthesis,” Phys. Rev. Lett. 86, 3288–3291 (2001).
27. F. Friederich, G. Schuricht, A. Deninger, F. Lison, G. Spickermann,P. H. Bolívar, and H. G. Roskos, “Phase-locking of the beat signalof two distributed-feedback diode lasers to oscillators working inthe MHz to THz range,” Opt. Express 18, 8621–8629 (2010).
H56 Vol. 56, No. 31 / November 1 2017 / Applied Optics Research Article