hemodynamic monitoring by nancy jenkins rn,msn. what is hemodynamic monitoring? it is measuring the...
TRANSCRIPT
Hemodynamic Monitoring
By
Nancy Jenkins RN,MSN
What is Hemodynamic Monitoring?
It is measuring the pressures in the heart

Hemodynamic Monitoring Baseline data obtained
– General appearance– Level of consciousness– Skin color/temperature– Vital signs– Peripheral pulses– Urine output

Hemodynamic Monitoring Baseline data correlated with data obtained
from technology (e.g., ECG; arterial, CVP, PA, and PAWP pressures
**Single hemodynamic values are rarely significant. Look at trends!!

Purpose of Hemodynamic Monitoring
Evaluate cardiovascular system
Pressure, flow, resistanceEstablish baseline values and evaluate trends
Determine presence and degree of dysfunction
Implement and guide interventions early to prevent problems

Hemodynamic Monitoring Components
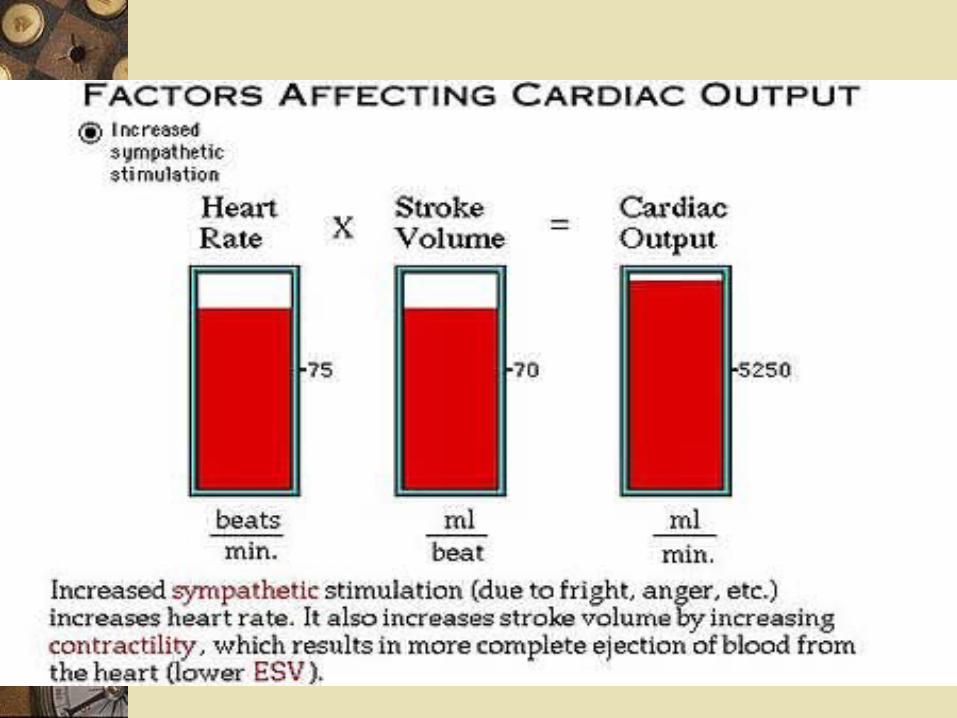
Heart Rate
Blood Pressure and MAP
CVP
Pulmonary Artery Pressures
Systemic Vascular Pressure (SVR)
Pulmonary Vascular Pressure (PVR)
Cardiac Output/ Cardiac Index
Stroke Volume

IVI fluid=preloadIV I

Comparing Hemodynamics to IV pump
Fluid =preload
Pump= CO or contractility (needs electricity)
Tubing =afterload


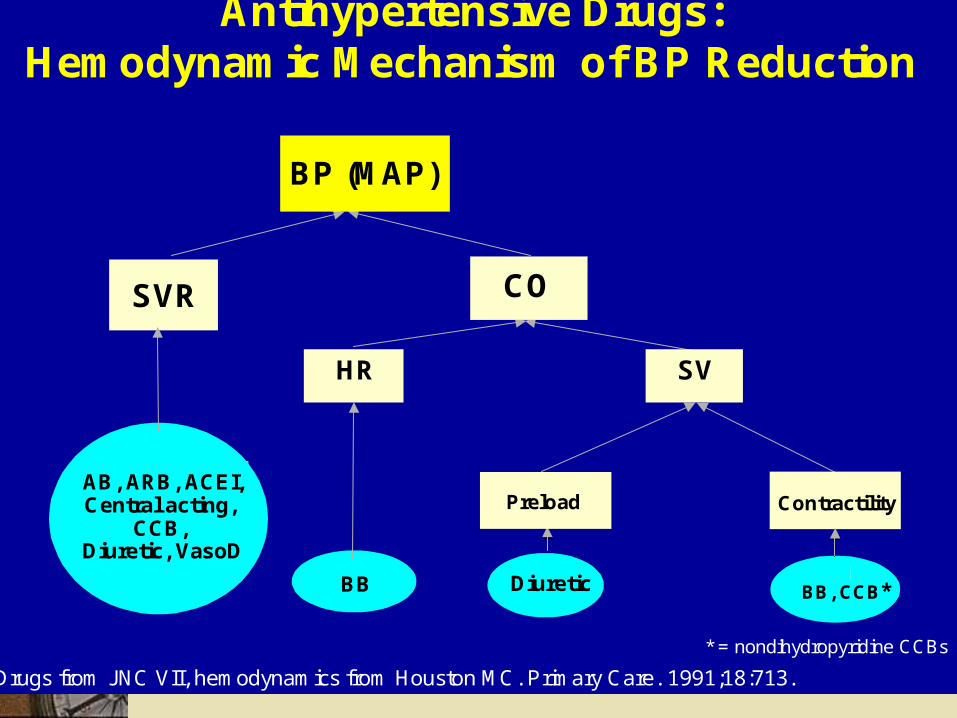
SV
SVR
Contractility
Diuretic
CO
AB, ARB, ACEI, Central acting,
CCB, Diuretic, VasoD
Preload
BB BB, CCB*
BP (MAP)
Drugs from JNC VII, hemodynamics from Houston MC. Primary Care. 1991;18:713.
Antihypertensive Drugs: Hemodynamic Mechanism of BP Reduction
HR
* = nondihydropyridine CCBs


Types of Invasive Pressure Monitoring
Continuous arterial pressure monitoring– Acute hypertension/hypotension– Respiratory failure– Shock– Neurologic shock

Types of Invasive Pressure Monitoring
Continuous arterial pressure monitoring (cont’d)– Coronary interventional procedures– Continuous infusion of vasoactive drugs – Frequent ABG sampling

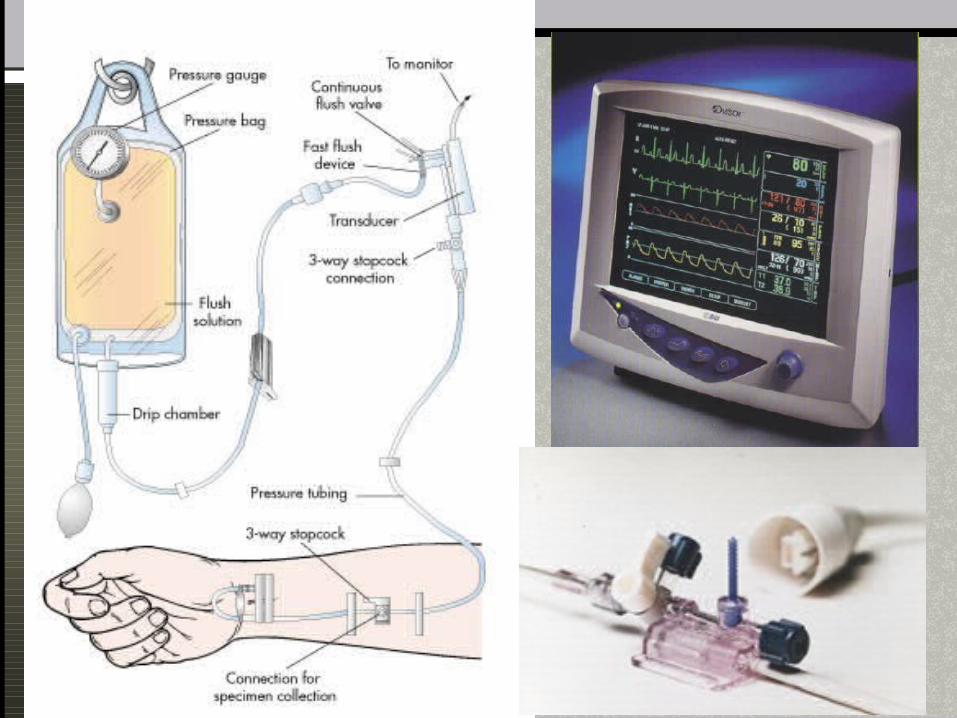
Components of an Arterial Pressure Monitoring System
Fig. 66-3

Arterial Line

Arterial Pressure Monitoring
High- and low-pressure alarms based on patient’s status
Risks– Hemorrhage, infection, thrombus formation,
neurovascular impairment, loss of limb
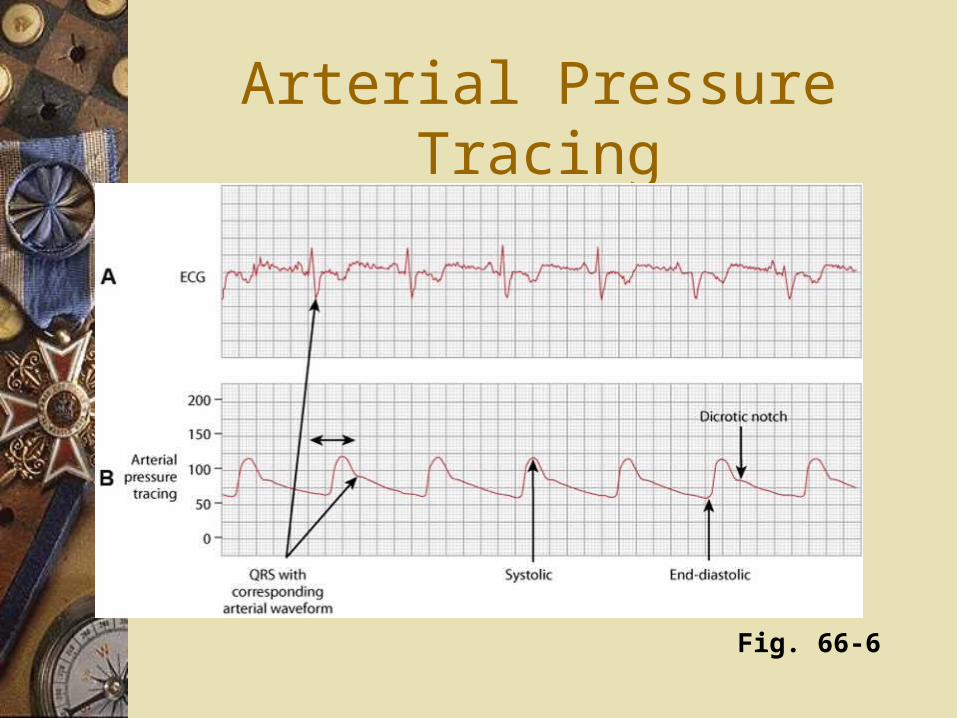
Arterial Pressure Tracing
Fig. 66-6

Arterial Pressure Monitoring
Continuous flush irrigation system– Delivers 3 to 6 ml of heparinized saline per
hour• Maintains line patency
• Limits thrombus formation
– Assess neurovascular status distal to arterial insertion site hourly


Dicrotic notch signifies the closure of the aortic valve.

Pulmonary Artery Pressure Monitoring
Guides management of patients with complicated cardiac, pulmonary, and intravascular volume problems– PA diastolic (PAD) pressure and PAWP:
Indicators of cardiac function and fluid volume status
– Monitoring PA pressures allows for therapeutic manipulation of preload

Manipulating the PA pressures affects the preload
Tru
e
Fal
se
50%50%1. True
2. False

Pulmonary Artery Pressure Monitoring
PA flow-directed catheter – Distal lumen port in PA
• Samples mixed venous blood
Thermistor lumen port near distal tip– Monitors core temperature– Thermodilution method measuring CO
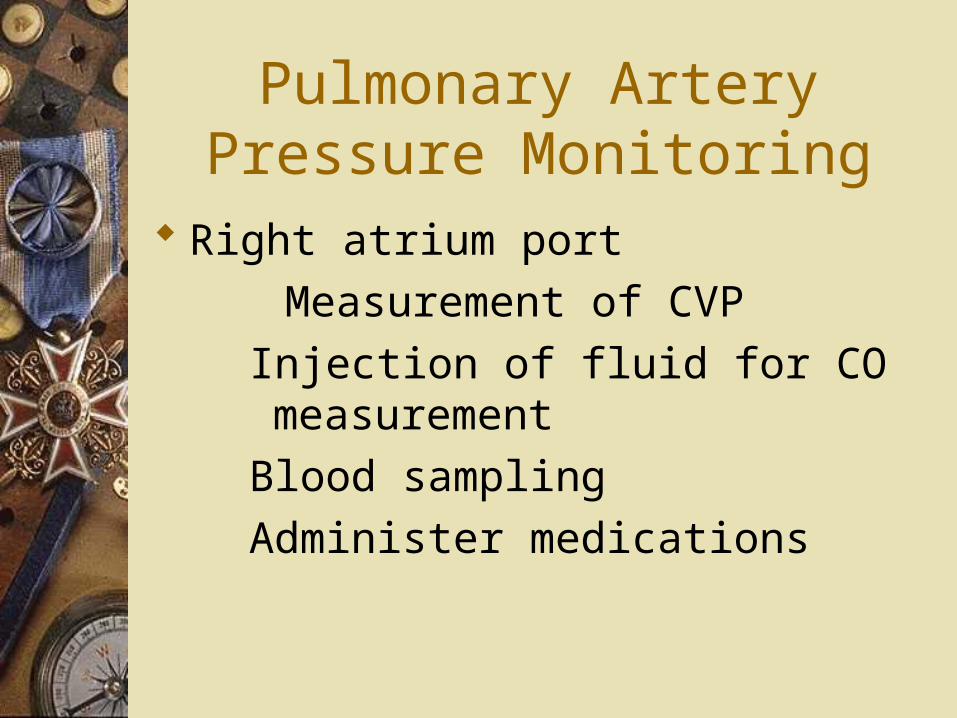
Pulmonary Artery Pressure Monitoring
Right atrium port
Measurement of CVP
Injection of fluid for CO measurement
Blood sampling
Administer medications

The proximal port or right atrial port is used to:
Mea
sure
the
CVP
Adm
inis
ter m
eds
Mea
sure
the
wed
ge ...
Dra
w b
lood
25% 25%25%25%1. Measure the CVP
2. Administer meds
3. Measure the wedge pressure
4. Draw blood

Pulmonary Artery Catheter
Fig. 66-7


PA Waveforms during Insertion
Fig. 66-9


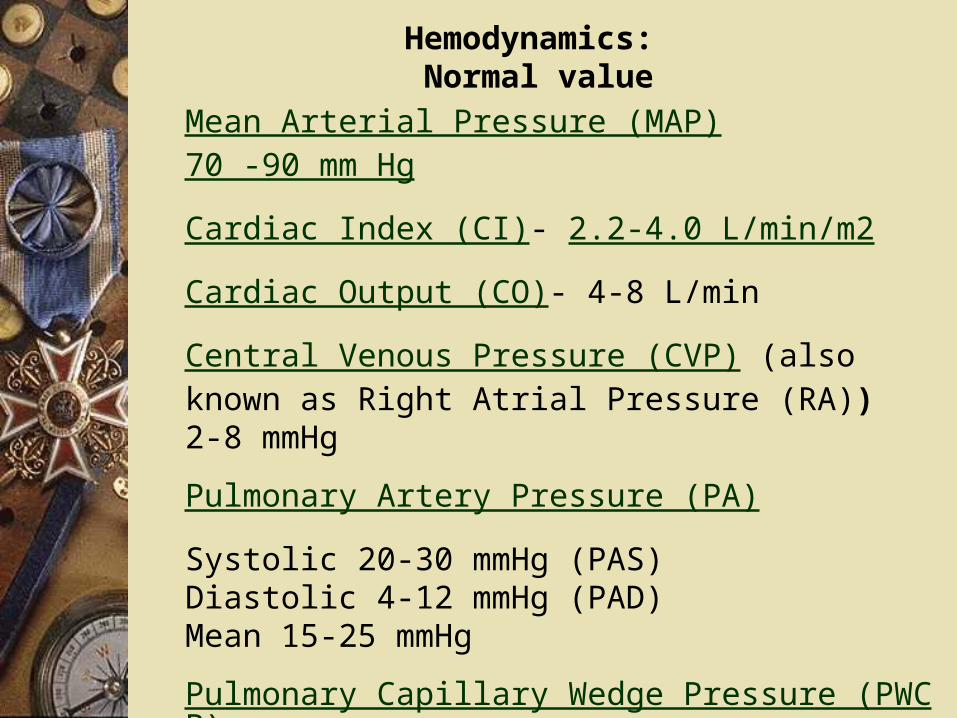
Hemodynamics: Normal value
Mean Arterial Pressure (MAP) 70 -90 mm Hg
Cardiac Index (CI)- 2.2-4.0 L/min/m2
Cardiac Output (CO)- 4-8 L/min
Central Venous Pressure (CVP) (also known as Right Atrial Pressure (RA)) 2-8 mmHg
Pulmonary Artery Pressure (PA)
Systolic 20-30 mmHg (PAS)Diastolic 4-12 mmHg (PAD)Mean 15-25 mmHg
Pulmonary Capillary Wedge Pressure (PWCP)
6-12 mmHg
Systemic Vascular Resistance(SVR) 800-1200

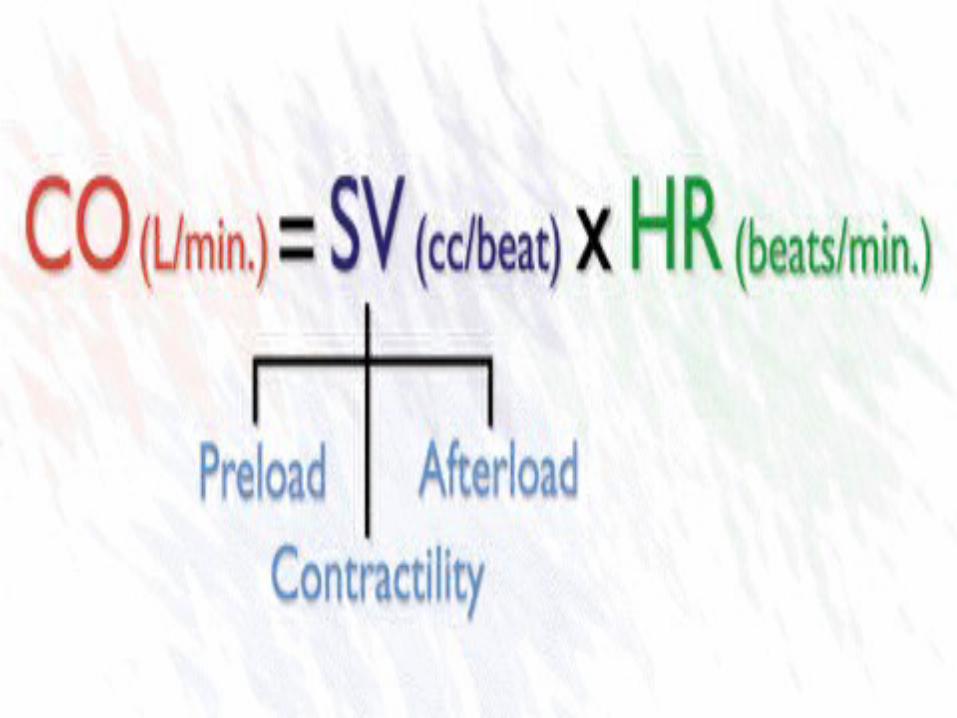
Cardiac Output
http://www.lidco.com/docs/Brochure.pdf
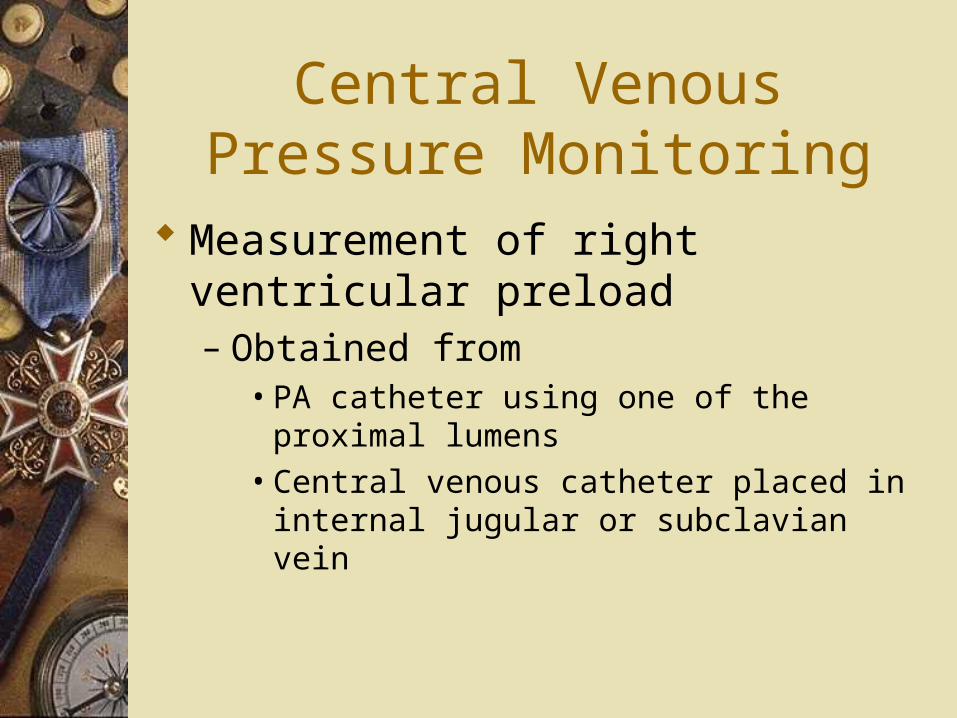
Central Venous Pressure Monitoring
Measurement of right ventricular preload– Obtained from
• PA catheter using one of the proximal lumens
• Central venous catheter placed in internal jugular or subclavian vein

Central Venous Pressure Waveforms
Fig. 66-11

Measuring Cardiac Output
Intermittent bolus thermodilution method Continuous cardiac output method

Measuring Cardiac Output
Fig. 66-12

Measuring Cardiac Output
SVR, SVRI, SV, and SVI can calculated when CO is measured– ↑ SVR
• Vasoconstriction from shock
• Hypertension
• ↑ Release or administration of epinephrine or other vasoactive inotropes
• Left ventricular failure
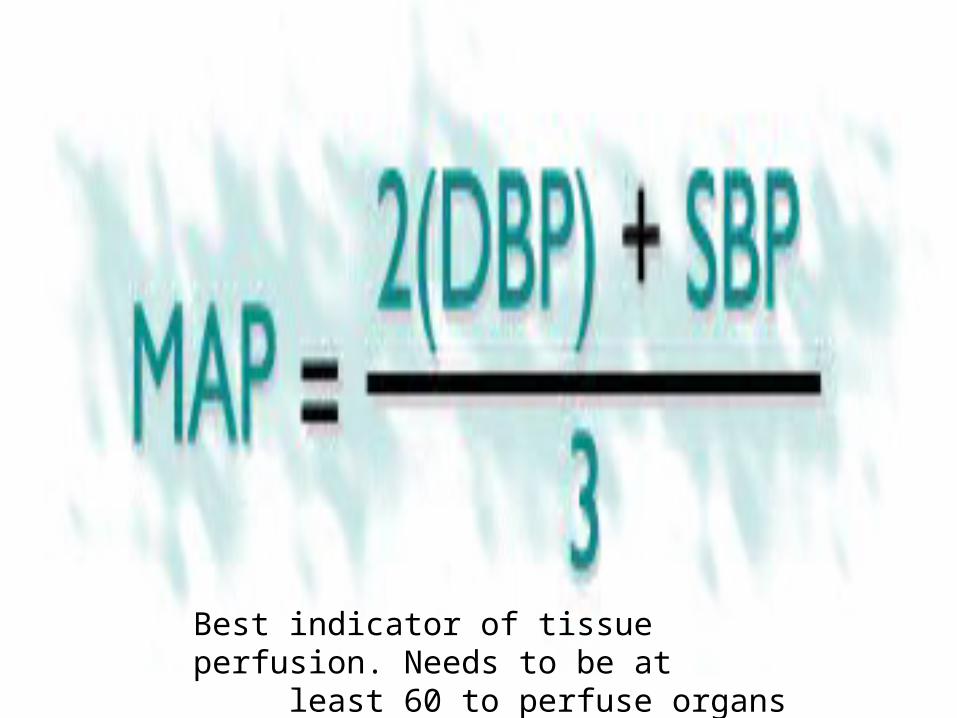
Best indicator of tissue perfusion. Needs to be at least 60 to perfuse organs

If a patient’s B/P is 140/80 the MAP would be:
120 80 10
0 60
25% 25%25%25%1. 120
2. 80
3. 100
4. 60


Complications with PA Catheters
Infection and sepsis – Asepsis for insertion and maintenance of
catheter and tubing mandatory– Change flush bag, pressure tubing, transducer,
and stopcock every 96 hours
Air embolus (e.g., disconnection)

Complications with PA Catheters
Ventricular dysrhythmias – During PA catheter insertion or removal– If tip migrates back from PA to right ventricle
PA catheter cannot be wedged– May need repositioning
Which would be complications in a patient with a PA catheter?
Arr
hyth
mia
s
Infe
ctio
n
Air
embolis
m
Ble
edin
g
25% 25%25%25%1. Arrhythmias
2. Infection
3. Air embolism
4. Bleeding

Complications with PA Catheters
Pulmonary infarction or PA rupture– Balloon rupture (e.g., overinflation)– Prolonged inflation– Spontaneous wedging– Thrombus/embolus formation

Noninvasive Hemodynamic Monitoring:Impedance Cardiography (ICG)
• 4 dual sensors with 8 lead wires placed on neck and chest
• Current transmitted by outer electrodes and seeks path of least resistance: blood filled aorta
• Baseline impedance (resistance) is measured using inner electrodes
• With each heartbeat, blood volume and velocity in the aorta change
• Corresponding change in impedance is measured
• Baseline and changes in impedance are used to measure and calculate hemodynamic parameters

Noninvasive Hemodynamic Monitoring
Impedance cardiography (ICG)– Continuous or intermittent, noninvasive
method of obtaining CO and assessing thoracic fluid status
• Impedance-based hemodynamic parameters (e.g., CO, SV, SVR) are calculated from Zo, dZ/dt, MAP, CVP, and ECG

Noninvasive Hemodynamic Monitoring
Major indications– Early signs and symptoms of pulmonary or
cardiac dysfunction– Differentiation of cardiac or pulmonary cause
of shortness of breath– Evaluation of etiology and management of
hypotension

Noninvasive Hemodynamic Monitoring
Major indications (cont’d)– Monitoring after discontinuing a PA catheter
or justification for insertion of a PA catheter– Evaluation of pharmacotherapy – Diagnosis of rejection following cardiac
transplantation
