helmand basin integrated irrigation and power …
TRANSCRIPT
HELMAND BASIN
INTEGRATED IRRIGATION AND POWER DEVELOPMENT
Water and Power Authority
Republic of Afghanistan
HELMAND BASIN
INTEGRATED IRRIGATION AND POWER DEVELOPMENT
Water and Power Authority
Republic of Afghanistan
EstabNshed1989
AFGHANISTAN CENTRE AT KABUL UN VERSITY
NAM °I
November 1975
Kabul
- i -
Table of Contents
Chapter 1 Introduction
Chapter 2 Hclmand River Basin
2.1 General 2 - 1
2.2 Helmand river 2 - 1
2.3 Helmand river basin 2 - 3
Chapter 3 Economic Conditions and Present stageof Development
3.1 General 3 1
3.2 Present stage of Agriculture in theHelmand valley 3 - 1
3.3 Crop pattern and cultural practices 3 - 2
3.4 Crop yields 3 - 3
3.5 Present stage of development 3 - 4
Chapter 4 Hydrology
4.1 Climate 4 - 1
4.2 River Runoff 4 - 2
4.3 Flood flows 4 - 4
4.4 Silt load 4 - 5
Page
1 - 1
Chapter 5 Land Potential, cropping patternand irrigation requirements
5.1 General
5.2 Soils
5.3 Land potential
5.4 Cropping pattern
5.5 Irrigation requirements of crops
5 - 1
5 - 2
5-6
5 -7
5 - 10
Chapter 6 Proposals for development Page
6.1 Irrigation 6 - 1
6.2 Power 6 - 3
Chapter 7 Kamal Khan Flood Diversion Dam andrelated works
7.1 General 7 - 1
7.2 Kamal Khan Dam 7 - 3
7.3 Qala Afzal Dam 7 - 4
7.4 Control Weir 7 - 4
Chapter S Upper Kajakai Dam at Olumbagh
8.1 General 8 - 1
8.2 Location S - i
8.3 Hydrology 8 - i
8,4 Design flood S - 2
8.5 Area -capacity of the proposedreservoir 8 - 2
8.6 Layout S - 3
8.7 Salient features 8 - 5
Chapter 9 Irrigation Works
9.1 Upper Helmand valley 9 - 1
9.2 Lower Helmand valley 9 - 2
9.3 Khanneshin diversion dam 9 - 3
9.4 Taghaz diversion dam 9 - 4
9.5 A low dam between Rodbar andChahar Burjak 9 - 4
9:6 Kamal Khan diversion dam 9 - 4
9.7 Khwabgah diversion dam 9 - 5
9.8 Sikhsar diversion dam 9 - 5
9.9 Lashkary canal 9 - 5
-iii- page
Chapter 10 Command area Development : 10 - 1
Chapter 11 Power Potential 11 - 1
Chapter 12 Estimate of Cost 12 - 1
Chapter 13 Phased Programme of Implementation 13 - 1
Chapter 14 Economic Evaluation 14 - 1
Chapter 15 Conclusions and Recommendations 15 - 1

- iv -
Tables
Chapter 4
Table - 4- 1/Average monthly & annual precipitation in mm
Table - 4 -2 Monthly average relative humidity -Max. &Min.in p rcent
Tabke - 4 -3 Monthly average max. & min. temperature in Deg.0
Table - 4 44 Monthly & annual velocity & max. velocityof wind in km /day
Table - 4 -5 Average monthly evaporation in the'Helmand valley
Chapter 5
Table 5 -
Table 5 -
Table 5 -
Table 5 -
Table 5 -
Table 5 -
Chapter 1
Table 11
Table 11
Chapter 1
Table 12
Chapter 13
Table 31
1 Land Potential of the Helmand basin
2 Irrigation Potential of the Helmand Basin
3 Monthly Crop Consumptive use Requirements
4 Irrigation Water Requirements - Crop Intensity 140%
5 Irrigation water requirements - crop intensity 120%
6 Monthly total water requirements for the rea
proposed for irrigation.
1.
- 1 Upper Kajakai Dam(Olumbagh) - Typical reservoir
Operation Table for the water year 1954 - 1955
- 2 Upper Kajakai Dam (Olumbagh dam) Typical reservoir
operation table for the water year 1961 - 1962
2.
- i Abstract of Cost
- 1 Phasing of Construction and Expenditure.
-v-
Chapter 14
Table 14 - 1 Present Crop Production and Gross Revenue
Table 14 - 2 Present Production Costs
Table 14 - 3 Cropped area after completion of the Project
Table 14 - 4 Future Crop Production and Gross Revenue
Table 14 - 5 Future Production Costs
Table 14 - 6 Upper Helmand valley -Existing irrigated area requiring im-
provements-Present crop production & Gross revenue
Table 14 - 7 Upper Helmand valley - Existing irrigated area re-
quiring improvements - Present production costs
Table 14 - 8 Upper Helmand valley - Existing irrigated area re-
quiring improvements - Future Crop Production and
Gross Revenue
j
able 14 - 9 Upper Helmand valley - Existing Irrigated area
requiring improvements - Future Production Costs
Table 14 - 10 Internal rate of return.
-vi-
Figures
Fig. 5 - 1 Helmand river basin - Irrigable areas
It
it
tr
It
It
t1
tt
"
t'
I!
7 - 1 Kamal Khan flood diversion dam and related works
8 - 1 Water spread area map for the proposed dam sites atOlumbagh
8 - 2 Area capacity curves for proposed reservoir onHelmand at Olumbagh
8 : 3 Topographic map of the proposed dam site atOlumbagh
8 - 4 Longitudinal section and typical cross section of rock -fillDam
8 - 5 Logitudinal section along proposed spillway channel
8 - 6 Longitudinal section along diversion tunnels
9 - i Helmand river basin - Khanneshin Diversion Dam - Right BankCanal
9 - 2 Helmand river basin - Taghaz Diversion Dam - Left BankCanal
9 - 3 Helmand river basin - Kamal Khan Diversion Dam - Right BankCanal
9 - 4 Helmand river basin - Rodbar Diversion Dam - Left Bank CanalKamal Khan Diversion Dam - Left Bank Canal
9 - 5 Helmand river basin - Khwabgah and Sikhsar Diversion Damsand canals
" 11 - i Transmission Lines connecting Kajakai to Kandahar -Kabul-Herat.
1a1
D
CHAPTER 1
INTRODUCTION
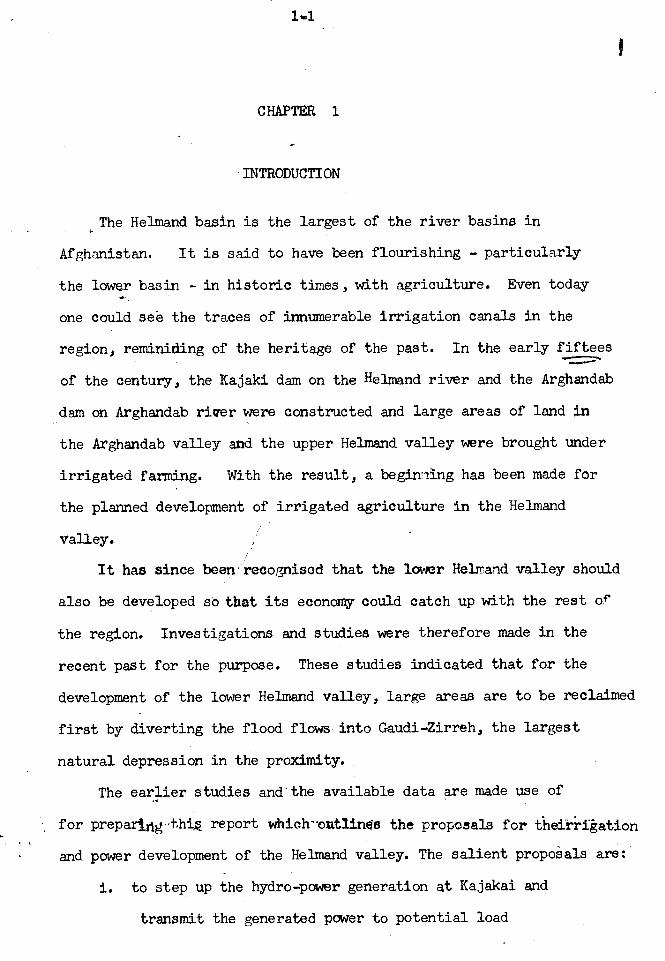
The Helmand basin is the largest of the river basins in
Afghanistan. It is said to have been flourishing - particularly
the lower basin - in historic times, with agriculture. Even today
one could see the traces of innumerable irrigation canals in the
region, reminiding of the heritage of the past. In the early fiftees
of the century, the Kajaki dam on the Helmand river and the Arghandab
dam on Arghandab ricer were constructed and large areas of land in
the Arghandab valley and the upper Helmand valley were brought under
irrigated farming. With the result, a beginning has been made for
the planned development of irrigated agriculture in the Helmand
valley.
It has since been 'recognised that the lower Helmand valley should
also be developed sò that its economy could catch up with the rest of
the region. Investigations and studies were therefore made in the
recent past for the purpose. These studies indicated that for the
development of the lower Helmand valley, large areas are to be reclaimed
first by diverting the flood flows into Gaudi- Zirreh, the largest
natural depression in the proximity.
The earlier studies and the available data are made use of
for prepartrigs this report which - outlines the proposals for theirrigation
and power development of the Helmand valley. The salient proposals are:
i. to step up the hydro power generation at Kajakai and
transmit the generated power to potential load
l' -2
centres in the valley and regions around
in a period of about five years from the
commencement of the plan to meet the growing
domestic and industrial needs of the region;
ii. reclaim large areas in the lower Helmand valley by
diverting the flood waters of the Helmand river at
Kamal Khan into Gaudi- Zirreh;
iii. undertake the construction of a number of irrigation diversion
dams and a network of irrigation and drainage systems along the
entire length of the river commencing from Garmab for bringing
under irrigated agriculture about 33,000 hectares of land in the
upper Helmand valley and about 200,000 hectares in the lower
Helmand valley;
iv. improve the irrigation and drainage facilities to about 30,000
hectares out of the 77,000 hectares irrigated area in the upper
Helmand valley;
v. construct a storage reservoir upstream of Kajakal reservoir
on Helmand river, another on the Arghandab river and possibly
a third on the Musa gala river to optimise the various facailities
such as irrigation, power and flood moderation;
vi. generate power at the upper Kajakai dam and transmit the same
to Kajakai system to meet the additional power needs etc.
The entire development as envisaged above, is programmed to be
substantially corm feted in about ten years.
--.,...
2 -1
3
CHAPTER 2
HEIMAND RIVER BASIN
2.1 Afghanistan is a mountainous country situated in the central
part of Asian main land. Mountain ranges run across the country
from North east to South west sloping steeply towards north and then
to south and west. These are a continuation of the Hindu Kush range
of mountains. The Helmand river basin, lies on the northern side of
the dividing mountain mass. Vast tracts of barren land stretch over
15,000 s lams at elevation ranging from 700 to 800 meters in the
south and south west of the country. The Helmand and Bakwa deserts
Hlin the south west and the Registan towards the south form part of
these barren lands. There are large land- locked lakes formed in
the south western parts of the country.
2.2 Helmand river
The Helmand river rises in the Kuh- i.Baba ranges of hills
west of Kabul at an elevation of about 5000 m. It flows west forr-----.some distance and runs south -west in a deep valley. It changes
its direction to the west again skirting Kuh- i- Waris. From Sharan
it runs south -west upto Girishk. The river is a mountain stream
flowing thro deep valleys till upto a few miles upstream of Girishk.
Most of the river yields are from the melting snow in the upper
reaches._, The Kajakai dam constructed across Helmand river in upper
reach issues regulated releases for irrigation lower down. Tributary
Musa Qala joins Helmand river between Kajakai and Girishk.
2-2
On emerging from the hills, the river winds its course thro a
relatively flat terrain where its waters are used for irrigation on
a large scale. The Bogra diversion dam at Girishk diverts water for
irrigation thro a right bank canal to the Marja, Nad -i -Ali and
Shamalan areas. The river after flowing for further distance dcps
to an elevation of about 750 meters at Qala Bist where the Arghandab
river joins the Helmand.
Arghandab river is a major tributary of Helmand river. It is
itself a river of considerable importance with a number of tributaries.
It takes its origin north west of Ghazni and flaws down in a south-
westerly direction passing a few kilometers from Kandahar city. Tarnak,
Atghast an and,Dóri_BusLare its three main tributaries. These tributaries
are seasonal. There is a dam constructed across Arghandab river and
the waters stored there are being utilised for irrigating large areas
of land in the Arghandab valley.
After the confluence of Arghandab river, the Helmand flows thro
the desert area Dasht i - Margo, passing by the places Darweshan, Khawaja
Ali, Chahar Burjak and Kemal Khan. There is a diversion dam at Darweshan
which diverts the regulated releases from Kajakai reservoir for irrigating
the narrow strip along the valley on the left. At Kamal Khan the river
takes a turn to the north and flows for about 50 kilometers before it
reaches the Iran - Afghanistan border. At the border the river branches
off intó a number of channels all of which finally drain into the
Hamuns.
Z-3
At Khwabgah, the Rud-i-Seistan branches away towards the left.
The Nad-i-Ali branch on trie right leads into Shela Charkh which was
originally a drainage channel and then finally into Hamun- i- Puzak.
The Helmand river after flowing for nearly 300 kilometers between
Qala Bist joins the land -locked lakes ( Hamuns).
The area of waterspread and volume of these Hamuns fluctuate
depending -on the flood flows drained into them by the rivers joining
them, the most important of which are the Helmand, the Khash and the
Farah. Hamun -i Puzak, Hamun -i- Sabari and Hamun-i-Kuh-ï Khawaja
are separated from each other by low saddle and hence flood flows will
be surplusing from one to tie other. When the water levels in all
these lakes swell, the excess flows discharge into Gaudi- Zirreh thro
Sari- i-Shellah, a drainage course leading to Gaudi-Zirreh.
2.3 Helmand river basin
The river above Kajakai is hilly and cost of the yields are
contributed from this catchment. There are isolated patches along
the river margins being cultivated in this stretch. Below Kajakai,
the river enters into an alluvial flood plain, bordering the river.
The area on the left between the Helmand river and the Arghandab
river is extensive with alluvial and fertile lands. This is known as
Seraj area. The alluvial strip on the right between Girishk art
Lashkargati along the river is irrigated by the canal taking off from
the Bogra diversion dam. The same canal also irrigates the lower
areas known as Shamalan area and the desert terrace land known as
2-4
Nad-i-Ali and Marja area covering nearly 30,000 hectares. There
e
are large extents of cultivable land in this area without irriga-
tion facilities.
Below the confluence of Arghandab, there is a narrow strip of ,
land extending i to 3 kilometers width on either side of the river
which hold potential arable lands. Most of these lands are under
irrigated agriculture for over a number of years, subject to availa-
bility of water diverted from the river by means of temporary impro-
vised diversion structures which are washed away season after season.
There are a number of open head river channels which do not carry
assured supplies. Irrigated agriculture therefore suffers mostly
for want of water during the critical period of crop growth.
The alluvial strip bordering the river fans out beyond Kamal
Khan forming the expansive plains covering Qala Fateh, Zaranj, Kang,
Kirki, Sherabad and Chakhansur areas. Parts of Chakhansur area
along the river are cultivated at present thro a system of existing
open head canals with no regulating arrangements. This area is
said to have been flourishing with intensive cultivation and habi-
tation in historic times. It is this area that holds out a
promise of extensive development of irrigation and agriculture, if
suitable ameliorative measures are taken.
3 -1
CHAPTER 3
ECONOMIC CONDITIONS AND PRESENTSTAGE OF DEVELOPPENT
3.1 General
Afghanistan is essentially an agricultural country where about
80% of the population have agriculture as their main occupation. Agri-
culture represents nearly 50% of the country's gross national product.
Industrial development of the country is still in its early stages
and employment in the industrial sector is only 1% of the working
population.
A complete census of the country's population has not been
taken so far. Several assessments made indicate that the population
in 70 -71 was around 16 million. Census covering about 15,000 villages
in 1968.69 indicated that the annual rate of population growth is of
the order of 24 while the annual increase of agricultural production
is about 1.3 %. There is therefore need to step up agricultural
production to keep pace with the population growth and for improving
the living standards of the people.
The diet of the people is oriented towards wheat whose per
capita consumption is about 160 kgs per year. In some of the recent
°'... a»i
years nearly 10% of the total wheat requirement had to be imported.
3.2 Present state of agriculture in the Helmand valley
Farming is done in the valley both by traditional and modern
methods. The modern.methods include preparing the land by mechanical
3 -2
means, use of fertilizers, insecticides ,, pesticides , land levelling
etc. Timely irrigation supplies are assured and regulated. The
traditional methods comprise of water supplies from river by tempo-
rary diversions thro open head channels, with no assured supplies
during the cropping period. The use of farm inputs is also very,
much limited.
Where the supplies are thro open head river channels there is
over-irrigation in the head reaches and under irrigation in the lower
reaches. Excessive irrigation in some area has created drainage
and salinity problems. The irrigation channels which are owned and
maintained by the beneficiaries themselves are generally in dis-repair.
As they do not have adequate carrying capacity/ they breach often
interrupting timely supplies.
The valley particularly the lower basin was said to be
flourishing with cultivation. The farmers of the area are therefore
traditionally well experienced in agricultural practices and are
aware of the benefits that accrue from irrigated agriculture, if
properly done. What is therefore necessary is the creation of ade-
quate irrigation facilities and infrastructural facilities for
agricultural development.
Farms are generally of the size of 2 to 7 heçtáres. Lack of
transport facilities in the lower basin stand in the way of growing
some of the cash crops.
3.3 Crop pattern and cultural practices
The agriculture economy is mainly built around the growing
of wheat. Other crops such as cereal grains, melons, vegetables,
tree fruits, grapes etc., constitute a small percentage. The existing
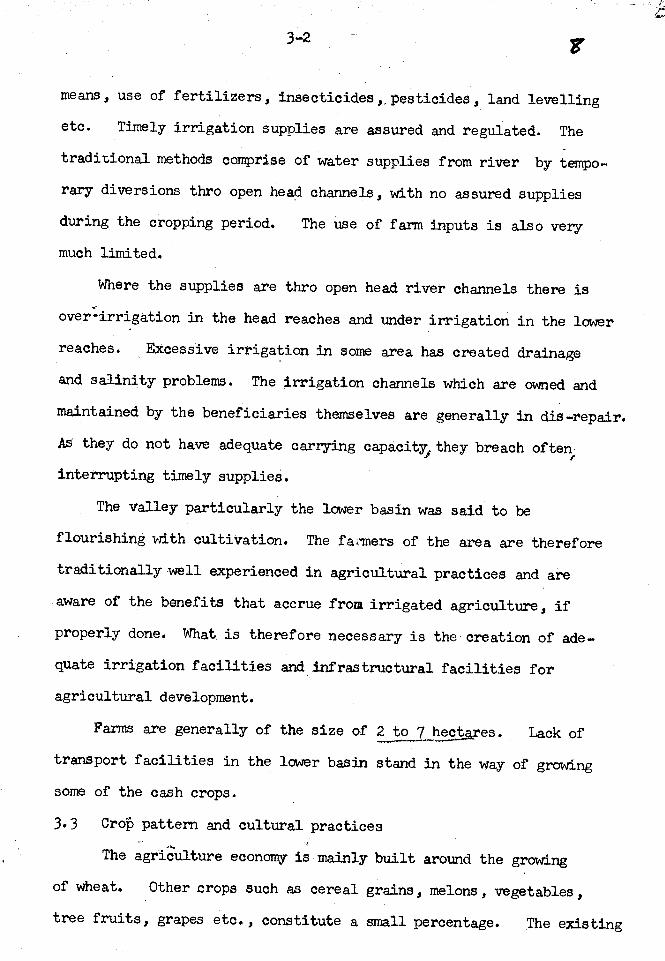
3 -3
cropping pattern is broadly as follows:
v b?
Wheat
Barley
73.0
10.0 %
Cotton 0.3 %
Corn '0.1 %
Sorghum 7.5 to
Melons 7.0 %
Mung Beans 0.1 lo
Other miscellaneous crops 2.0 `o
75-o
If sufficient water is available the more saline lands could
receive adequate water for leaching prior to land preparation and
seeding and drain the salts. In small isolated parts of the area,
lift irrigation is also practised by diesel driven pumps. Most
of the crops are sown broad -cast.
Wheat and barley are the principal crops sown from September
to January and harvested in April or early May. They generally
receive about four waterings subject to the availability of water
but more often they receive less than four irrigations. They are
thrashed in the traditional manner by oxen. Sumner crops are planted
in May and they take about four months to mature.
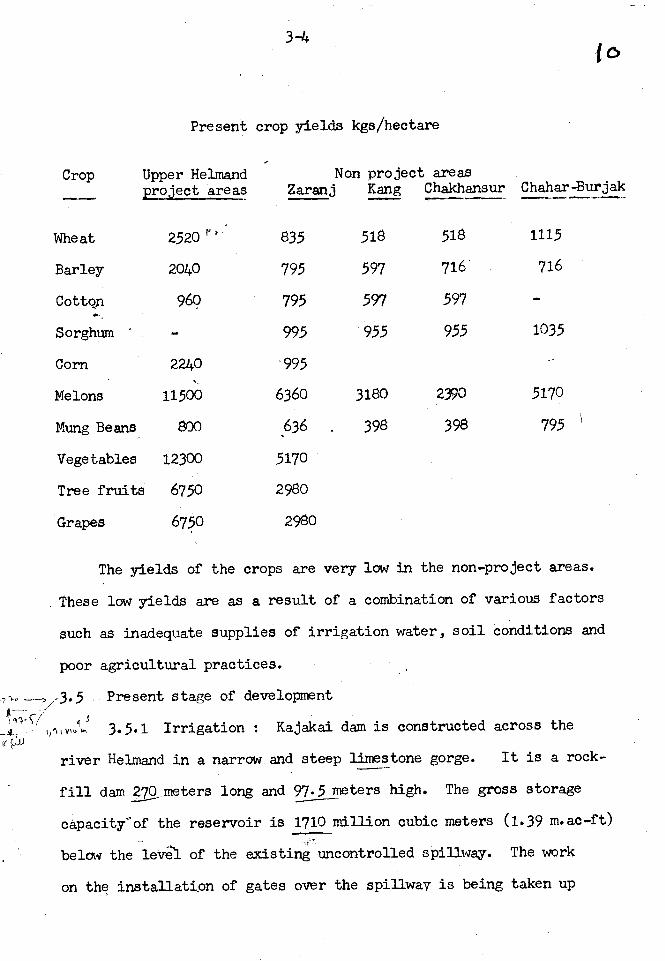
3.4 Crop yields
Present crop yields in the upper Helmand project areas and
in the non project areas of the lower basin are given below. The figures
given represent average yields for all land classifications :
3-4
Present crop yields kgs /hectare
Crop Upper Helmandproject areas
Non project areasZaranj Kang Chakhansur Chahar -Burjak
Wheat 2520 r'835 518 518 1115
Barley 2040 795 597 716 716
Cotton 960 795 597 597
Sorghum - 995 955 955 1035
Corn 2240 `995
Melons 11500 6360 3180 2390 5170
Mung Beans 800 636 398 398 795
Vegetables 12300 5170
Tree fruits 6750 2980
Grapes 6750 2980
The yields of the crops are very low in the non - project areas.
These low yields are as a result of a combination of various factors
such as inadequate supplies of irrigation water, soil conditions and
poor agricultural practices.
',o,x,3.5. Present stage of development
-Ï 000.4'., 3.5.1 Irrigation : Kajakai dam is constructed across theik çii
river Helmand in a narrow and steep limestone gorge. It is a rock -
fill dam 270 meters long and 97.5 meters high. The gross storage
capacity-of the reservoir is 1710 million cubic meters (1.39 m.ac -ft)
below the level of the existing uncontrolled spillway. The work
on the installation of gates over the spillway is being taken up
3-541
to raise the full reservoir level from elevation 1033.5 to elevation
1015 and thus increase the gross storage capacity to 2720 million
cubic meters. The regulated releases from the dam are being diverted
to Bogra and Darweshan where there are diversion structures across
the river. About 71,000 hectares of land are being irrigated presently
with a network of irrigation canals in the Seraj, Nad -i -Ali, Shamalan
and Darweshan areas. In addition about 6,000 hectares are being
irrigated under inundation canals. In the basin below Darweshan inclu-
ding the Chakhansur area, about 55,000 hectares of land is under
irrigation. Out of these 55,000 hectares of land only about 10,000
hectares get assured supplies for want of permanent diversion works
and intakes at the canal heads with suitable regulating arrangements.
40 The Arghandab dam on river Arghandab was constructed in 1952.CI
00" The earth dam is S40 meters long and 61 meters high with a storage
capacity of 415 million cubic meters. It irrigateslarge area of
land in the Arghandab valley.
3,5.2 Power: The Kajakai dam was constructed with the purpose
of creating irrigation and power potential. A power outlet was in-
corporated in the dam layout and the installation of power plant is
taken up recently after nearly twenty years of completion of the dam.
Two units of 16.51,is each are now being installed in the power
house under construction.
The çnly other hydro power installation in the basin is on
the Bogra canal with two units of 1.2 M.Ws each operating under a
head of about a meters. These units supply power to the nearby
towns of Girishk and Lashkargah.
R,,
3 -6
Power supply to the other areas in the Helmand valley such
as Kandahar, Zaranj etc., at present is mainly by means of diesel
installations.
It is thus seen that the electric power now available is not
adequate to meet even a fraction of domestic needs in the valley and
other places like Kandahar, Herat, Ghazni, Kabul, etc., which have
vast ;aotentialities for rapid domestic and industrial growth, if
only electric power could be supplied in the next four or five
years.
/.
4-1
CHAPTER 4
riiDR37CGY
4.1 Climate
13
The Helmand Arghandab valley lies between elevations varying
from_1,000 meters to 500 meters. The climate of the basin is
generally-hot and arid, particularly at the lower elevations. In the up --
3er valleys yavdrage daily maximum and minimum temperatures over
a period of record are 32 °C and 12 °C respectively. In the lower
basin a maximum of 52 °C is reported to have been recorded. Winters
in the upper valley are characterised with minimum temperatures
fallitg to -12 °C. The winters in the lower valley are however mild,
though occasionally minimum temperatures below freezing point are
reported to have been recorded. The skies are clear with bright.
sunshine throughout the year, cloudy days being an exception.
Another characteristic of the lower basin is the occurance of sand
and dust storms at any time round the year. These are mostly local
and do not last long. But the regional dust storms generally have
their origin in the south western part of the basin. The winds in
the area reach velocities as high as 120 to 160 kus per hour', forming
dense clouds of sand and dust. These storms render the visibility
poor. They last sometimes for days and the dust continues to fill
the atmosphere:,,Sor days even after the storms subside.
The precipitation in the higher elevations of the upper valley
occurs during the months of November to May in the form of snow and
rain and is the main contributing factor for the valley runoff.
4 -2 1 i
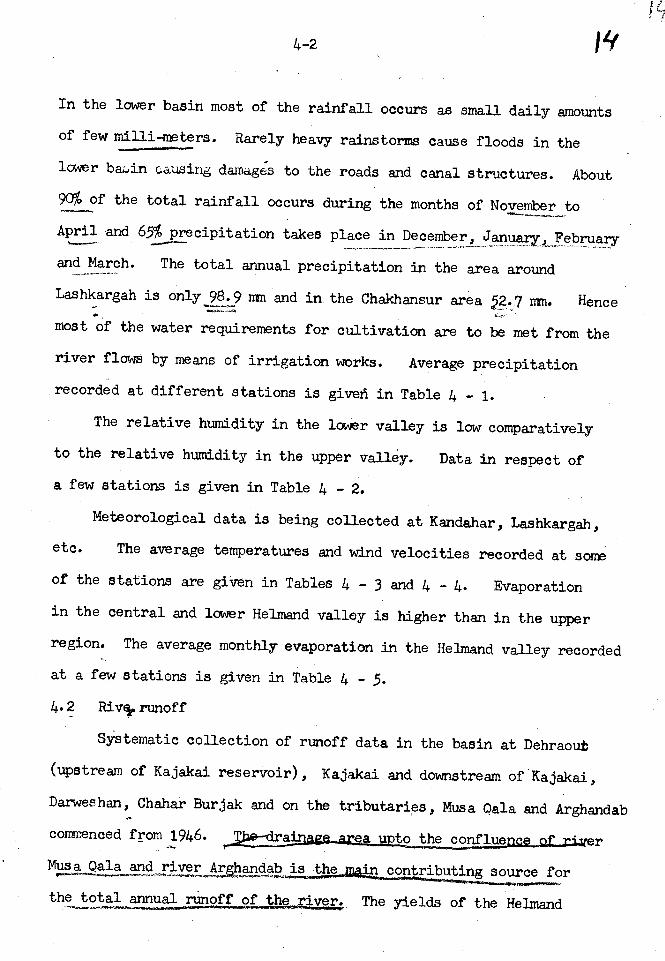
In the lower basin most of the rainfall occurs as small daily amounts
of few milli -meters. Rarely heavy rainstorms cause floods in the
lower bain causing damages to the roads and canal structures. About
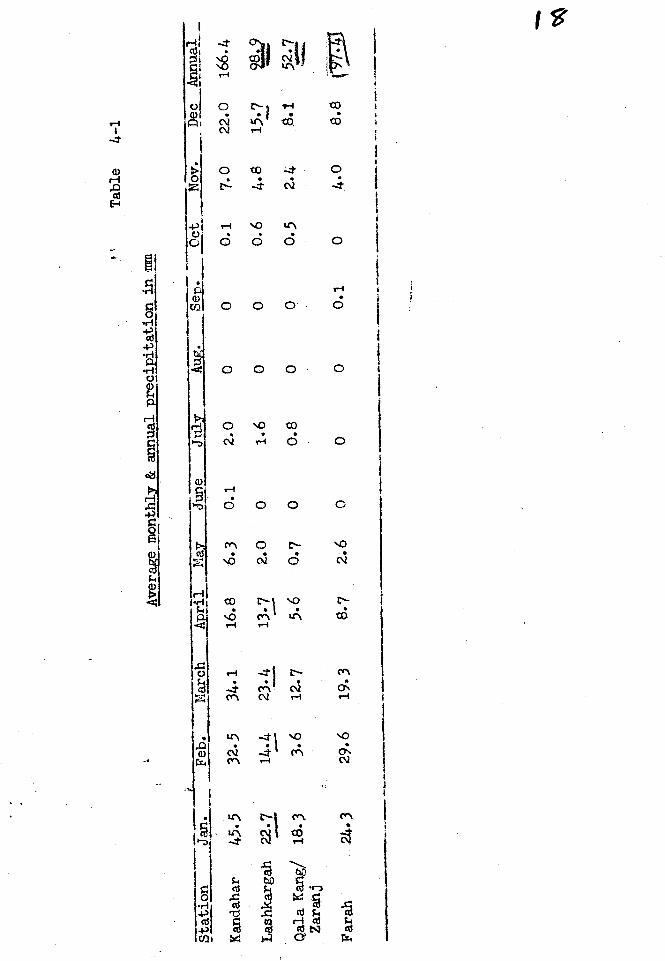
9D% of the total rainfall occurs during the months of November to
April and 65% precipitation takes place in December, January,_ February
and March. The total annual precipitation in the area around
Lashkargah is only 98.9 mm and in the Chakhansur area X2.7 nm. Hence
most of the water requirements for cultivation are to be met from the
river flaws by means of irrigation works. Average precipitation
recorded at different stations is given in Table 4 - 1.
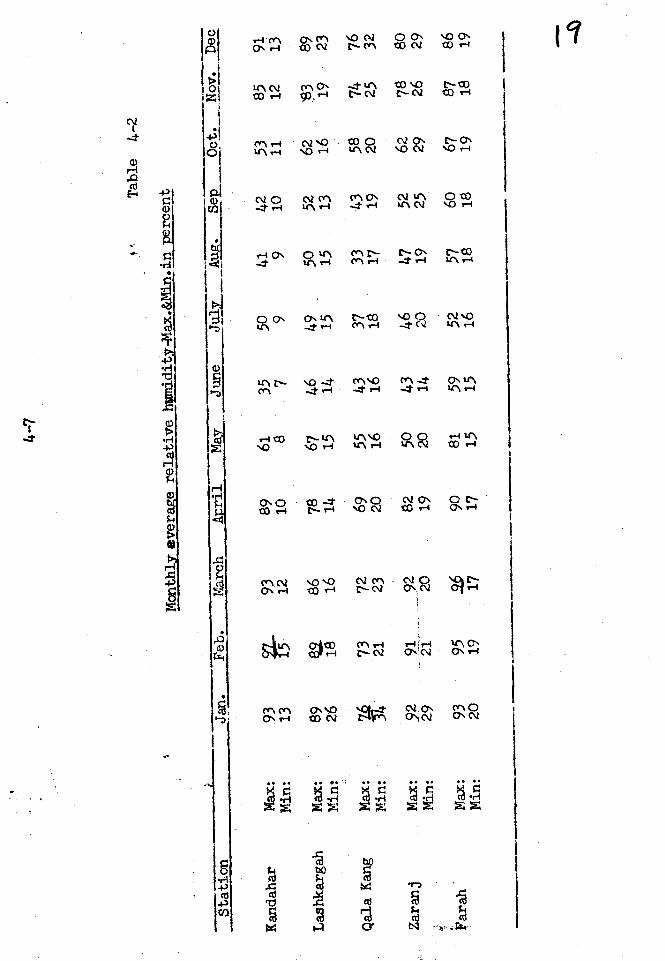
The relative humidity in the lower valley is low comparatively
to the relative humidity in the upper valley. Data in respect of
a few stations is given in Table 4 - 2.
Meteorological data is being collected at Kandahar, Lashkargah,
etc. The average temperatures and wind velocities recorded at some
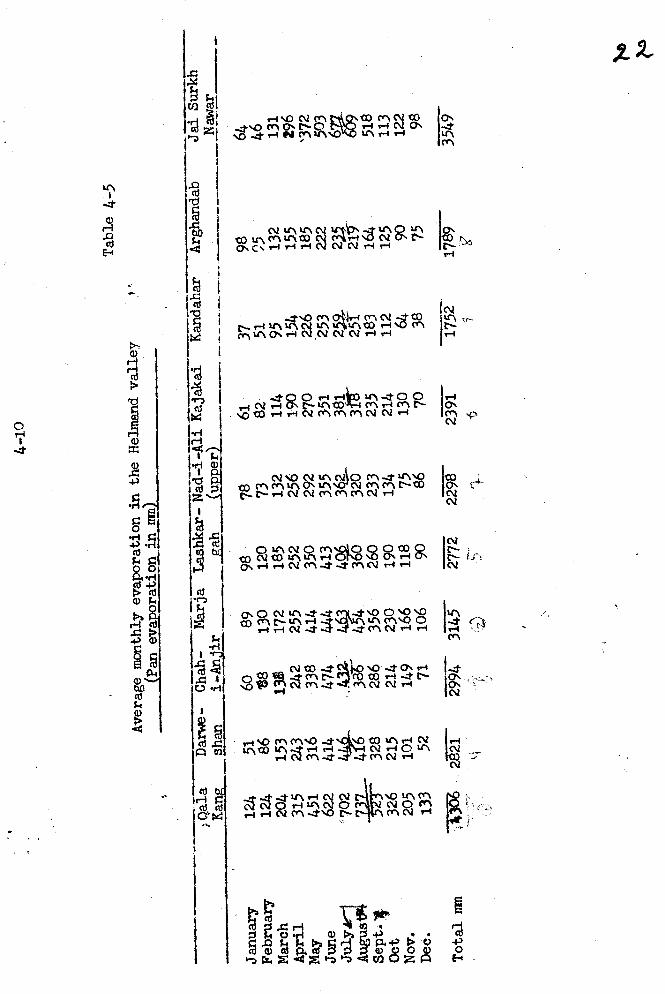
of the stations are given in Tables 4 - 3 and 4 - 4. Evaporation
in the central and lower Helmand valley is higher than in the upper
region. The average monthly evaporation in the Helmand valley recorded
at a few stations is given in Table 4 5.
4.2 Rivr runoff
Systematic collection of runoff data in the basin at Dehraout
(upstream of Kajakai reservoir), Kajakai and downstream of Kajakai,
Darweshan, Chahar Burjak and on the tributaries, Musa Qala and Arghandab
commenced from 1946. T. -a uto the conflue
Musa Qala and. river Arhandab is the contributing source for
the total annual runoff of the fiver. The yields of the Helmand
4 -3
15
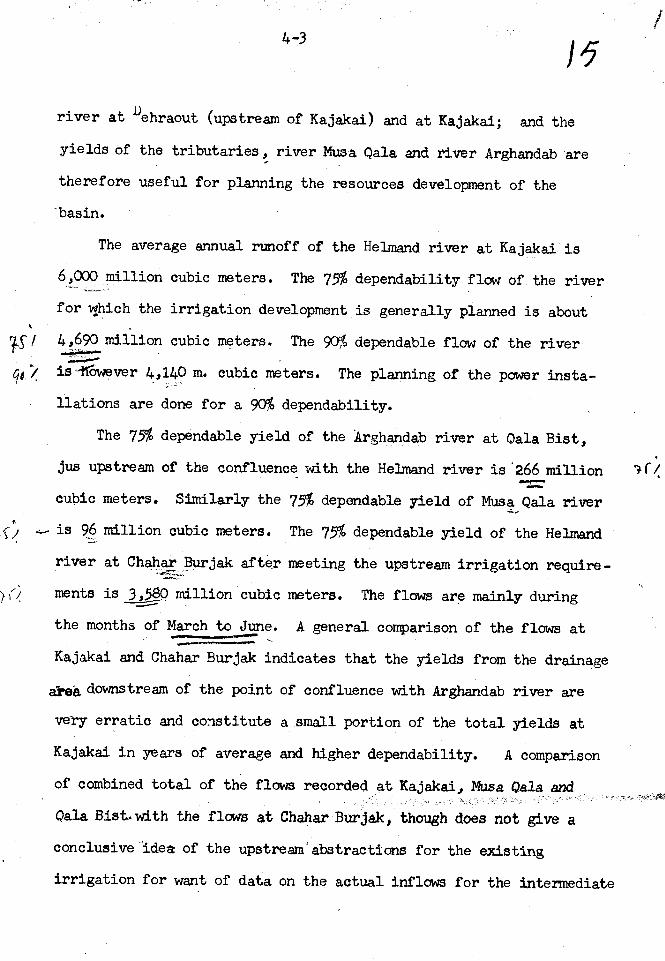
river at llehraout (upstream of Kajakai) and at Kajakai; and the
yields of the tributaries, river Musa Qala and river Arghandab are
therefore useful for planning the resources development of the
basin.
The average annual runoff of the Helmand river at Kajakai is
6,000 million cubic meters. The 75% dependability flow of the river
for which the irrigation development is generally planned is about
y-/ 4,690 million cubic meters. The 90% dependable flow of the river
9a 'is - ifowever 4,140 m. cubic meters. The planning of the power insta-
llations are done for a 90% dependability.
The 75% dependable yield of the Arghandab river at Oala Bist,
jus upstream of the confluence with the Helmand river is'266 million
cubic meters. Similarly the 75% dependable yield of Musa Qala river
6 {- is 96 million cubic meters. The 75% dependable yield of the Helmand
river at Chahar Burjak after meeting the upstream irrigation require-
ments is 3,580 million cubic meters. The flows are mainly during
the months of March to June. A general comparison of the flows at.00111.011S
Kajakai and Chahar Burjak indicates that the yields from the drainage
area downstream of the point of confluence with Arghandab river are
very erratic and constitute a small portion of the total yields at
Kajakai in years of average and higher dependability. A comparison
of combined total of the flows recorded at Kajakai, Musa Qala and
Qala Bist.with the flows at Chahar Burjak, though does not give a
conclusive-idea of the upstream abstractions for the existing
irrigation for want of data on the actual inflows for the intermediate
4(/
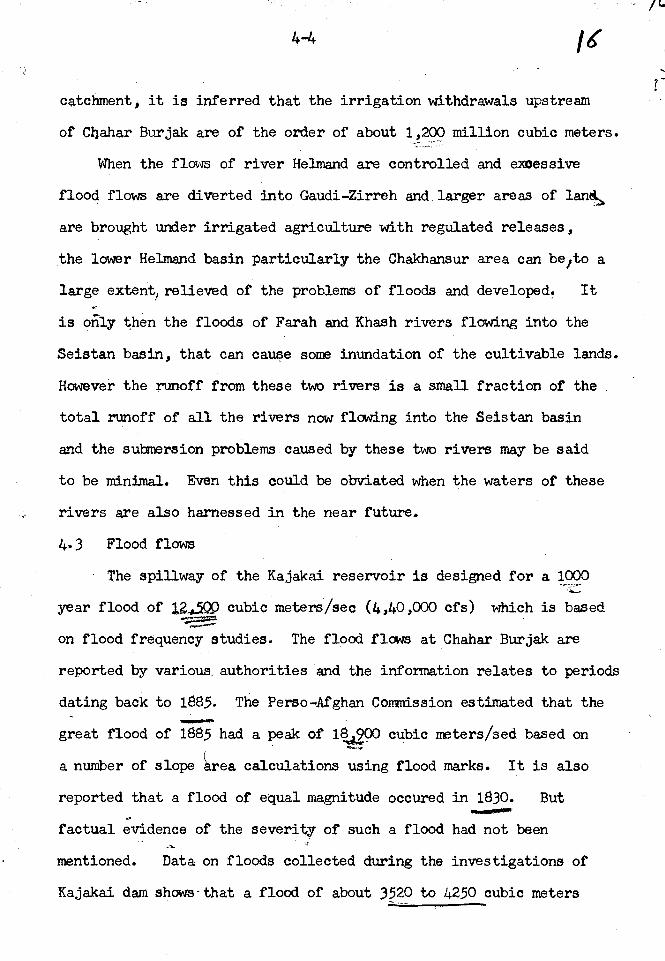
4-4 lcatchment, it is inferred that the irrigation withdrawals upstream
of Chahar Burjak are of the order of about 1,200 million cubic meters.
When the flows of river Helmand are controlled and excessive
flood flows are diverted into Gaudi-Zirreh and larger areas of land
are brought under irrigated agriculture with regulated releases,
the lower Helmand basin particularly the Chakhansur area can be /to a
large extent, relieved of the problems of floods and developed. It
is oñly then the floods of Farah and Khash rivers flowing into the
Seistan basin, that can cause some inundation of the cultivable lands.
However the runoff from these two rivers is a small fraction of the
total runoff of all the rivers now flowing into the Seistan basin
and the submersion problems caused by these two rivers may be said
to be minimal. Even this could be obviated when the waters of these
rivers are also harnessed in the near future.
4.3 Flood flows
The spillway of the Kajakai reservoir is designed for a 1000
year flood of 12.,5ß cubic meters /sec (4,40,000 cfs) which is based
on flood frequency studies. The flood flows at Chahar Burjak are
reported by various authorities and the information relates to periods
dating back to 1885. The Perso-Afghan Commission estimated that the
great flood of 188 had a peak of 18900 cubic meters /sed based on
a number of slope rea calculations using flood marks. It is also
reported that a flood of equal magnitude occured in 1830. But
factual evidence of the severity of such a flood had not been
mentioned. Data on floods collected during the investigations of
Kajakai dam shows-that a flood of about 3520 to 4250 cubic meters
I13tet
'''`._._---..-.-. . a._
31.....-.t3 1-
a,4 -5 .
l
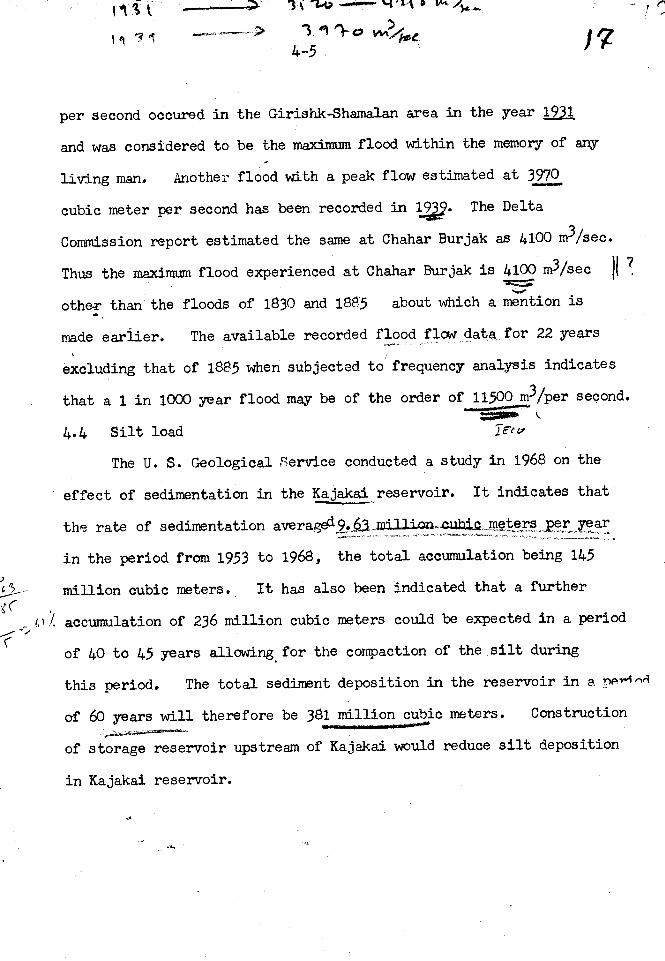
per second occured in the Girishk-Shamalan area in the year 1931
and was considered to be the maximum flood within the memory of any
living man. Another flood with a peak flow estimated at 3970
cubic meter per second has been recorded in 1. The Delta
Commission report estimated the same at Chahar Burjak as 4100 m3 /sec.
Thus the maximum flood experienced at Chahar Burjak is 4100 m3 /sec fi ?
other than the floods of 1830 and 1885 about which a mention is
made earlier. The available recorded flood flaw data for 22 years
excluding that of 1885 whensubjected to frequency analysis indicates
that a 1 in 1000 year flood may be of the order of 11500 /per second.
4.4 Silt load It? v
The U. S. Geological Service conducted a study in 1968 on the
effect of sedimentation in the Kajakai reservoir. It indicates that
the rate of sedimentation average19. 3._m llion- aubi.,am tern per year
in the period from 1953 to 1968, the total accumulation being 145
million cubic meters. It has also been indicated that a further
r,) /. accumulation of 236 million cubic meters could be expected in a period
of 40 to 45 years allowing ,for the compaction of the silt during
this period. The total sediment deposition in the reservoir in a pP ^r1
of 60 years will therefore be 381 million cubic meters. Construction
of storage reservoir upstream of Kajakai would reduce silt deposition
in Kajakai reservoir.
Table
4-1
Average monthly & annual precipitationin mm
Station
Jan.
Feb.
March
April
July
Aug.
Sep.
Oct
Nov.
Dec
Kandahar
45.5
32.5
34.1
16.8
_114zjune
6.3
0.1
2.0
00
0.1
7.0
22.0
Lashkargah
22.7
14.4
23.4
13.7
2.0
01.6
00
0.6
4.8
15.7
f....
....''
Qala Kang/
18.3
3.6
12.7
5.6
0.7
00.8
00
0.5
2.4
8.f
Zaranj
Farah
24.3
29.6
19.3
8.7
2.6
00
00.1
04.0
8.8
Annual
166.4
2242
52.7
Lr`
a) .-I M O.q 0 CCV Lt-- M LO C12 flO r-+O .-+ t
r1 (,1 M O` ...I. I" CO NO L"--t0Z tA r-i igU. r1 C' r- Ctit t0 riú ÑQ e-9 C2
C2 O 0.2 Mr-a u1 r-i r-1 t1 C2 r- I
I-4 ONt['l111^Cs.-1 CM 4-1 i r-t
HI. Q ON CT tr1 ti tO O or' M r-1 -4" Cs2 ul
Ce C` -.t -7 r-C r-+ON r-
lx) :8"f-1N >n `,2g ir C1 LO
,00. 2 v. í-I 02W r'i O 1'4
CrNO LO *4 C - ctii O`
CfN'
-1
Wir1
W" C2 0 Q\CV O r-1
C0 MM Q`O r-t t0
ri Z
a á $.1
tv ,,, ,Ur
ter
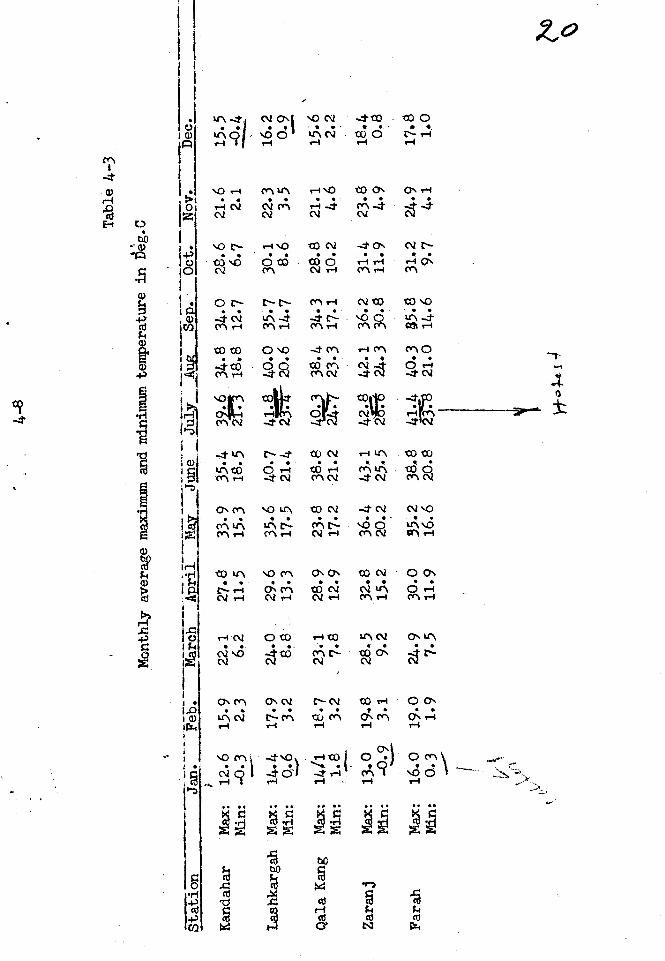
Table 4-3
,Monthly average maximwn and minimum temperature in
I3ég.0
Feb.
March
July
-bet._
Station
Jan.
1101
June
Aug
Sep.
Nov.
Dec.
Kandahar
Max:
12.6
15.9
22.1
.10:11
27.8
33.9
35.4
39.6
34.8
34.0
28.6
21.6
15.5
Min:
-0.3
2.3
6.2
11.5
15.3
18.5
21T3
18.8
12.7
6.7
2.1
-0.4
Lashkargah
Max:
14.4
17.9
24.0
29.6
35.6
40.7
41.8
40.0
35.7
30.1
22.3
16.2
Min:
0.6
3.2
8.8
13.3
17.5
21.4
23
20.6
14.7
8.6
3.5
0.9
Qala Kang
Max:
14/1
18.7
23.1
28.9
23.8
38.8
4ó,,
38.4
34.3
28.8
21.1
15.6
Min:
1.8
3.2
.7.8
12.9
17.2
21.2
2.4.
17.1
10.2
4.6
2.2
Zaranj
Max:
13.0
19.8
28.5
32.8
36.4
43.1
42.8
42.1
36.2
31.4
23.8
18.4
Min:
-0.9
3.1
9.2
15.2
20.2
25.5
Zane..
24.3
30.8
11.9
4.9
0.8
Farah
Max:
16.0
19.0
24.9
30.0
35.2
38..8
41.4
40.3
$5.8
31.2
24.9
17.8
Min:
0.3
1.9
7.5
11.9
16.6
20.8
278
21.0
14.6
9.7.
4.1
1.0
ii
H-0
4.4-
j4
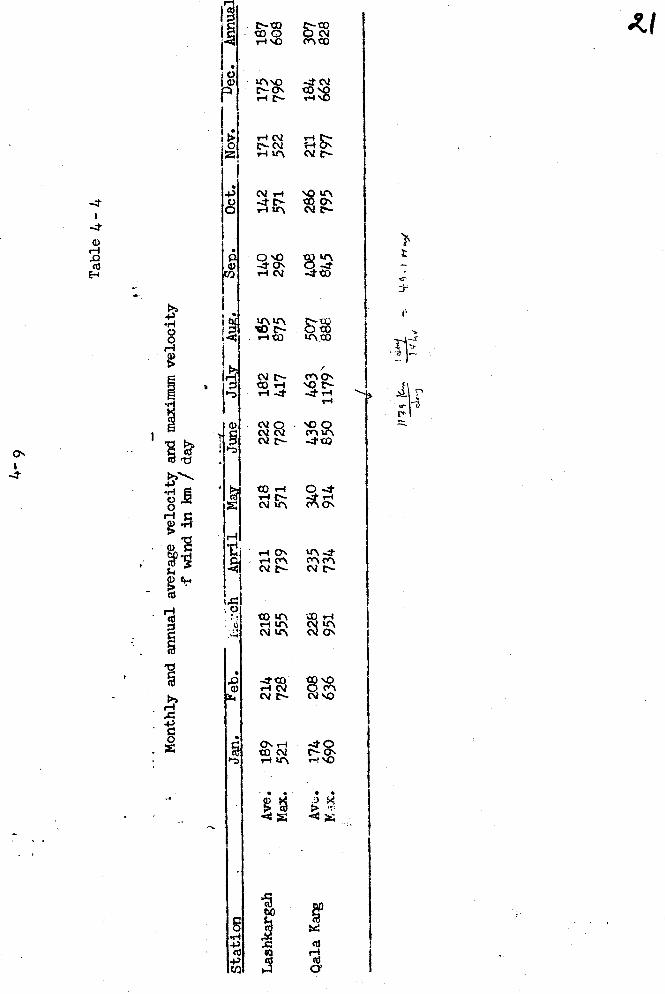
Table 4 - 4
Monthly and annual average velocity and maximum velocity
f wind in km /day
Jan.
Feb.
i-.7ch
April
M.
June
Jul'
A.
wed.
Oct.
Nov.
'éc.
Añnúal
Ave.
.189
214
218
211
218
222
182
165
140
142
171
175
187
Max.
521
728
555
739
571
720
417
875
296
571
522
796
608
Avt
174
208
228
235
340
436
463
507
408
286
211
184
307
690
636
951
734
914
850
1179'
$88
845
795
797
662
828
P7g1
- .r
-f e
o1F
tv,r
Average monthly evaporation in the Helmandvalley
4 '
(Pan evaporation in mn
Table 4 -5
¡Rala
Dame-
Chah-
Mar j a
Lashkar - Nad -i -Ali Ka j akai
Kandahar
Arghandab
Jai Surkh
Kang_
shah
i -Anjir
gah
(upper)
Nawar
January
February
124
124
51 86
60 18
89
130
98 120
78 73
61 82
37 51
98
nJc
6446
March
204
153
138
172
185
132
114
95
132
131
April
315
243
242
255
252
256
190
154
155
296
May
451
316
338
414
350
292
270
226
185
`372
June
622
414
474
444
413
355
351
253
222
503
July&
Aug
usta
702
74
6.4
32 386
40 454
4Q6,
360
36.4
..32
0381 3f
259.
251
a6 *¡
.
Sept
..
328
286
356
260
233
235
183
164
518
Oct
326
215
214
230
190
134
214
112
125
113
Nova
205
101
149
166
118
75
130
64
90
122
Dec.
133
52
71
106
90
86
70
38
75
98
Total mit
13306
2821
2994
3145
2772
2298
2391
1752
1789
3549
5 -1
CHAPTER
LAND POTENTIAL, CROPPING PATTERN AND IRRIGATION RE_-
QUIRENENTS
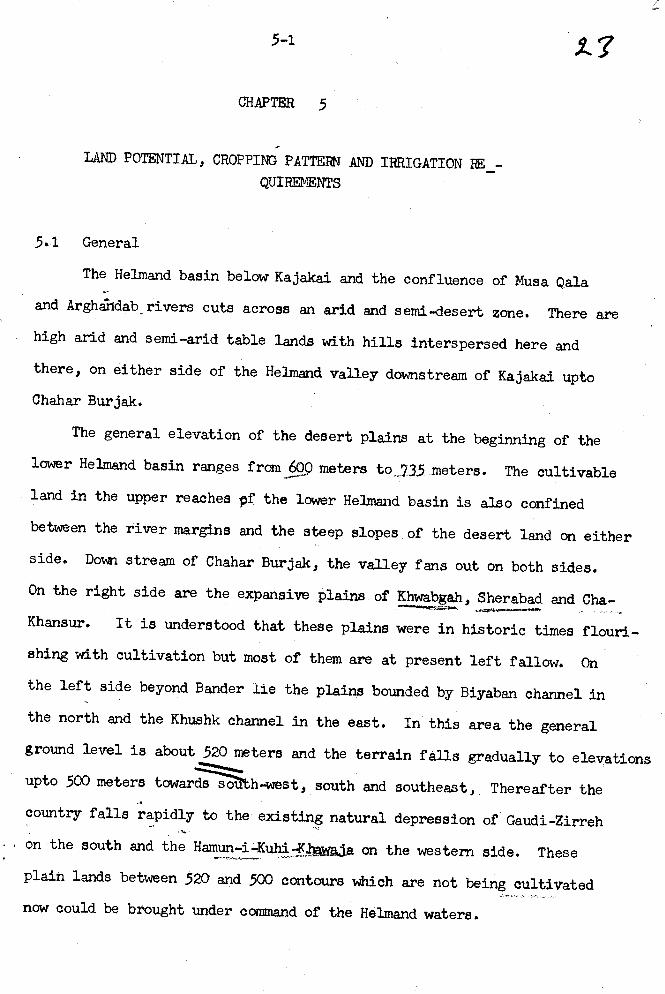
5.1 General
The Helmand basin below Kajakai and the confluence of Musa Qala
and Arghaidab_ rivers cuts across an arid and semi -desert zone. There are
high arid and semi -arid table lands with hills interspersed here and
there, on either side of the Helmand valley downstream of Kajakai upto
Chahar Burjak.
The general elevation of the desert plains at the beginning of the
lower Helmand basin ranges from 600 meters to 735.meters. The cultivable
land in the upper reaches pf the lower Helmand basin is also confined
between the river margins and the steep slopes of the desert land on either
side. Down stream of Chahar Burjak, the valley fans out on both sides.
On the right side are the expansive plains of Khwabgah, Sherabad and Cha-
Khansur. It is understood that these plains were in historic times flouri-
shing with cultivation but most of them are at present left fallow. On
the left side beyond Bander lie the plains bounded by Biyaban channel in
the north and the Khushk channel in the east. In this area the general
ground level is about 520 meters and the terrain falls gradually to elevations
upto 500 meters towardsth-west, south and southeast, Thereafter the
country falls rapidly to the existing natural depression of Gaudi- Zirreh
on the south and the Hamun-i-Kuhirpmaja on the western side. These
plain lands between 520 and 500 contours which are not being cultivated
now could be brought under command of the Helmand waters.
5 -2
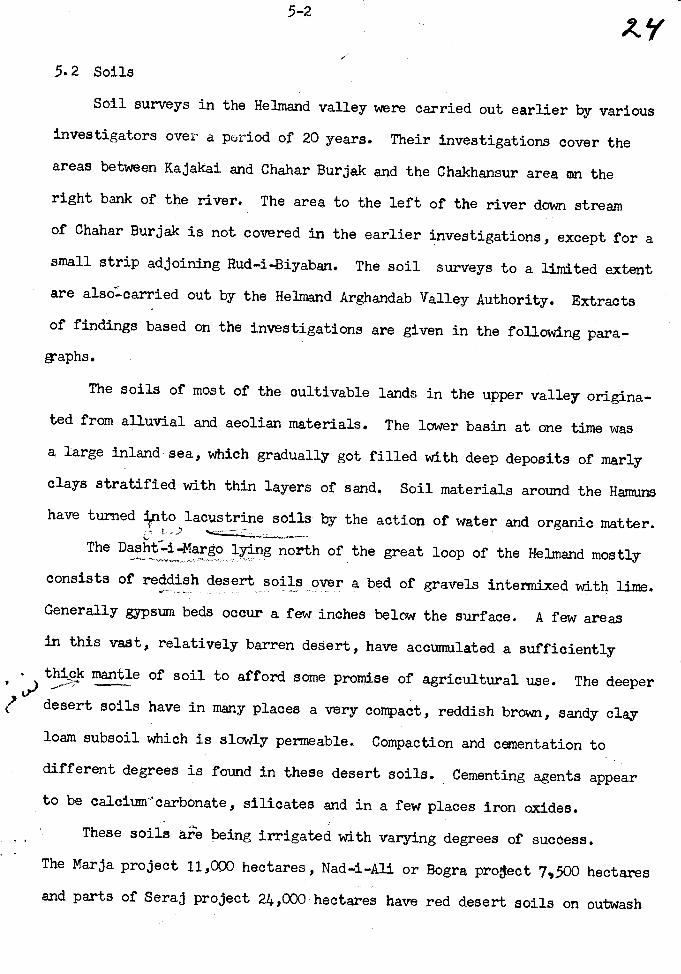
5.2 Soils
Soil surveys in the Helmand valley were carried out earlier by various
investigators over a period of 20 years. Their investigations cover the
areas between Kajakai and Chahar Burjak and the Chakhansur area mn the
right bank of the river. The area to the left of the river down stream
of Chahar Burjak is not covered in the earlier investigations, except for a
small strip adjoining Rud -i- Biyaban. The soil surveys to a limited extent
are also= -carried out by the Helmand Arghandab Valley Authority. Extracts
of findings based on the investigations are given in the following para-
graphs.
The soils of most of the cultivable lands in the upper valley origina-
ted from alluvial and aeolian materials. The lower basin at one time was
a large inland sea, which gradually got filled with deep deposits of manly
clays stratified with thin layers of sand. Soil materials around the Hamm
have turned onto lacustrine soils by the action of water and organic matter.
The Dasht -i -Margo lying north of the great loop of the Helmand mostly
consists of reddish desert soils over a bed of gravels intermixed with lime.
Generally gypsum beds occur a few inches below the surface. A few areas
in this vast, relatively barren desert, have accumulated a sufficiently
thick mantle of soil to afford some promise of agricultural use. The deeper
desert soils have in many places a very compact, reddish brown, sandy clay
loam subsoil which is slowly permeable. Compaction and cementation to
different degrees is found in these desert soils. Cementing agents appear
to be calcium -carbonate, silicates and in a few places iron oxides.
These soils are being irrigated with varying degrees of success.
The Marja project 11,000 hectares, Nad -i -Ali or Bogra protect 7,500 hectares
and parts of Seraj project 24,000 hectares have red desert soils on outwash
-j
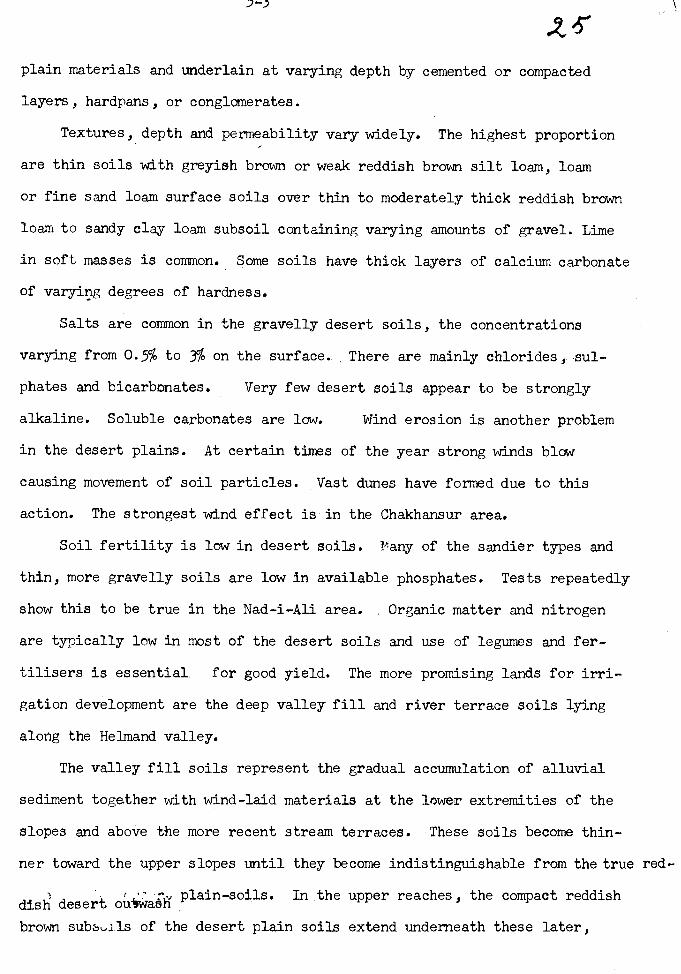
plain materials and underlain at varying depth by cemented or compacted
layers, hardpans, or conglomerates.
Textures, depth and permeability vary widely. The highest proportion
are thin soils with greyish brown or weak reddish brown silt loam, loam
or fine sand loam surface soils over thin to moderately thick reddish brown
loam to sandy clay loam subsoil containing varying amounts of gravel. Lime
in soft masses is common. Some soils have thick layers of calcium carbonate
of varying degrees of hardness.
Salts are common in the gravelly desert soils, the concentrations
varying from 0.5% to 3% on the surface.. There are mainly chlorides,. sul-
phates and bicarbonates. Very few desert soils appear to be strongly
alkaline. Soluble carbonates are low. Wind erosion is another problem
in the desert plains. At certain times of the year strong winds blow
causing movement of soil particles. Vast dunes have formed due to this
action. The strongest wind effect is in the Chakhansur area.
Soil fertility is low in desert soils. Many of the sandier types and
thin, more gravelly soils are low in available phosphates. Tests repeatedly
show this to be true in the Nad -i -Ali area. Organic matter and nitrogen
are typically low in most of the desert soils and use of legumes and fer-
tilisers is essential for good yield. The more promising lands for irri-
gation development are the deep valley fill and river terrace soils lying
along the Helmand valley.
The valley fill soils represent the gradual accumulation of alluvial
sediment together with wind-laid materials at the lower extremities of the
slopes and above the more recent stream terraces. These soils become thin-
ner toward the upper slopes until they become indistinguishable from the true red.
dish desert ou#washplain- soils. In the upper reaches, the compact reddish
brown subs,,l.ls of the desert plain soils extend underneath these later,
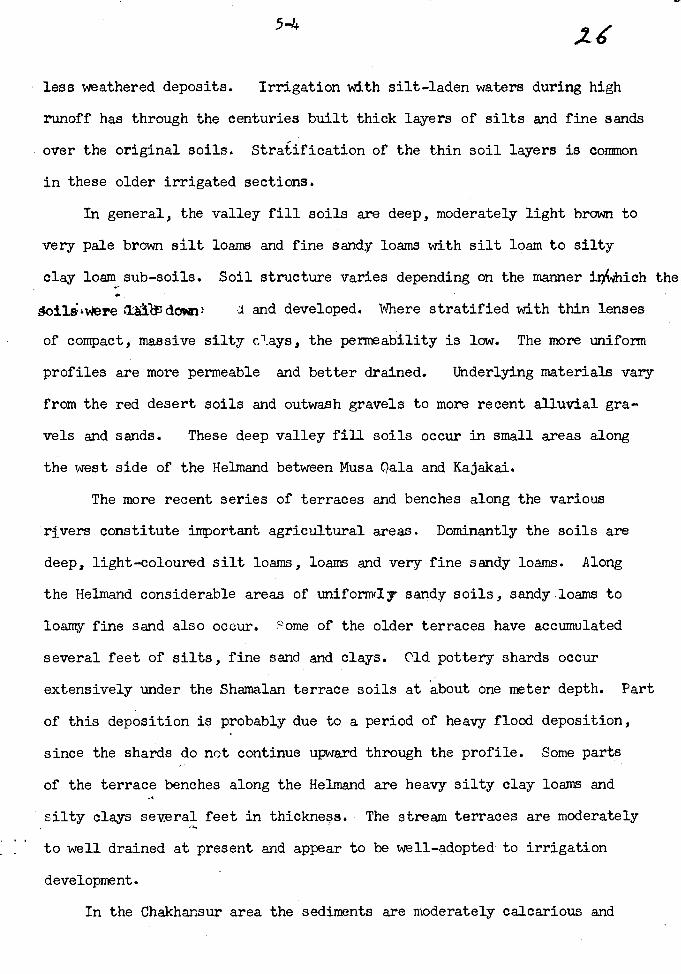
5-4 24'
less weathered deposits. Irrigation with silt -laden waters during high
runoff has through the centuries built thick layers of silts and fine sands
over the original soils. Stratification of the thin soil layers is common
in these older irrigated sections.
In general, the valley fill soils are deep, moderately light brawn to
very pale brown silt loans and fine sandy loans with silt loam to silty
clay loam sub -soils. Soil structure varies depending on the manner ix4..hich the
doilslwore aä down: 1 and developed. Where stratified with thin lenses
of compact, massive silty clays, the permeability is low. The more uniform
profiles are more permeable and better drained. Underlying materials vary
from the red desert soils and outwash gravels to more recent alluvial gra-
vels and sands. These deep valley fill soils occur in small areas along
the west side of the Helmand between Musa Gala and Kajakai.
The more recent series of terraces and benches along the various
rivers constitute important agricultural areas. Dominantly the soils are
deep, light - coloured silt loans, loans and very fine sandy loans. Along
the Helmand considerable areas of uniformly sandy soils, sandy .loans to
loamy fine sand also occur. some of the older terraces have accumulated
several feet of silts, fine sand and clays. Old pottery shards occur
extensively under the Shamalan terrace soils at about one meter depth. Part
of this deposition is probably due to a period of heavy flood deposition,
since the shards do not continue upward through the profile. Some parts
of the terrace benches along the Helmand are heavy silty clay loans and
silty clays several feet in thickness. The stream terraces are moderately
to well drained at present and appear to be well- adopted to irrigation
development.
In the Chakhansur area the sediments are moderately calcarious and
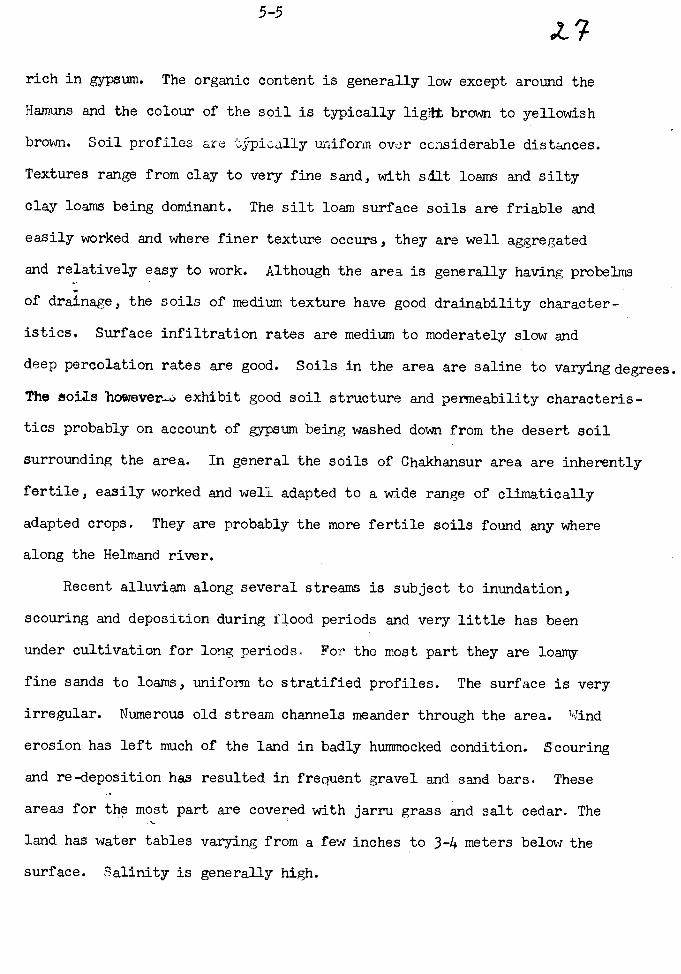
5 -5
oC,
rich in gypsum. The organic content is generally low except around the
Hamuns and the colour of the soil is typically ligFtt brown to yellowish
brown. Soil profiles are typically uniform over considerable distances.
Textures range from clay to very fine sand, with silt loams and silty
clay loams being dominant. The silt loam surface soils are friable and
easily worked and where finer texture occurs, they are well aggregated
and relatively easy to work. Although the area is generally having probelms
of drainage, the soils of medium texture have good drainability character-
istics. Surface infiltration rates are medium to moderately slow and
deep percolation rates are good. Soils in the area are saline to varying degrees.
The eaias however-:, exhibit good soil structure and permeability characteris-
tics probably on account of gypsum being washed down from the desert soil
surrounding the area. In general the soils of Chakhansur area are inherently
fertile, easily worked and well adapted to a wide range of climatically
adapted crops. They are probably the more fertile soils found any where
along the Helmand river.
Recent alluviam along several streams is subject to inundation,
scouring and deposition during flood periods and very little has been
under cultivation for long periods. For the most part they are loamy
fine sands to loams, uniform to stratified profiles. The surface is very
irregular. Numerous old stream channels meander through the area. Wind
erosion has left much of the land in badly hummocked condition. Scouring
and re- deposition has resulted in frequent gravel and sand bars. These
areas for the most part are covered with jarru grass and salt cedar. The
land has water tables varying from a few inches to 3 -4 meters below the
surface. Salinity is generally high.
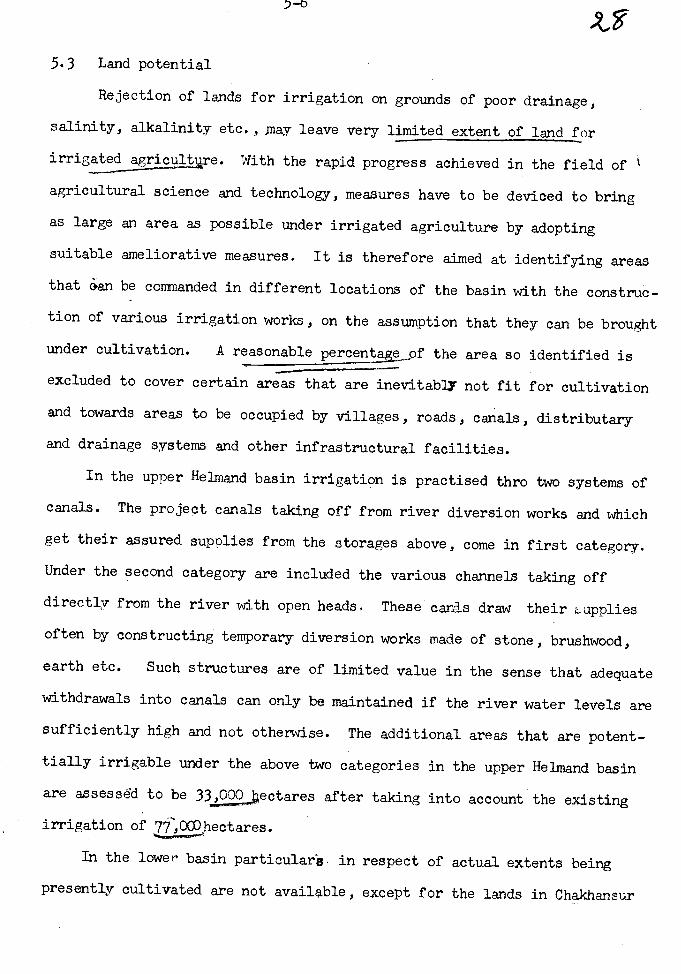
5-6
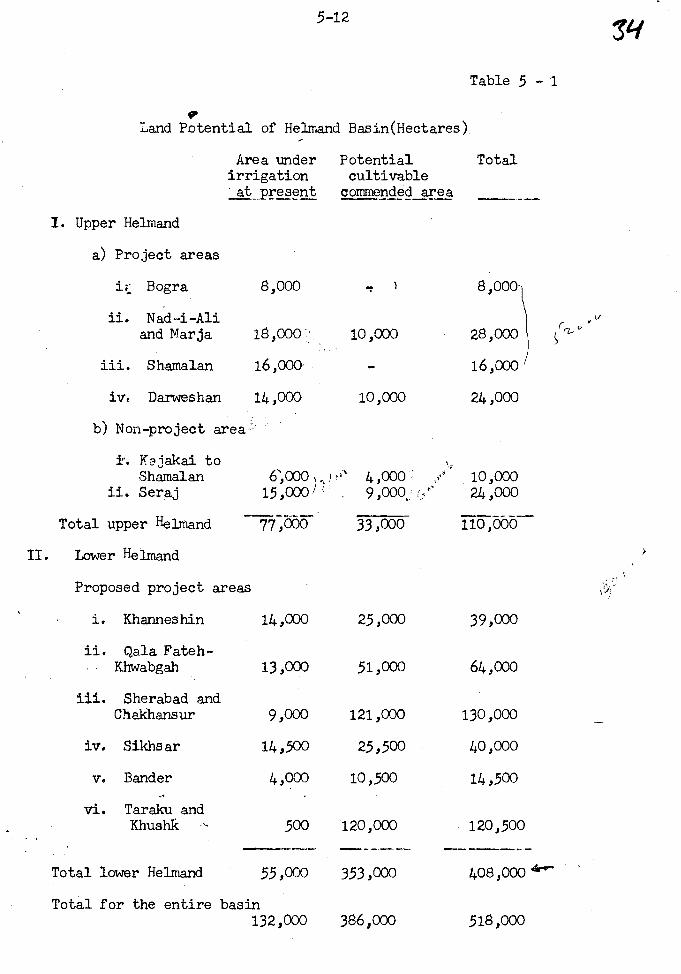
Av5.3 Land potential
Rejection of lands for irrigation on grounds of poor drainage,
salinity, alkalinity etc.,Inay leave very limited extent of land for
irrigated agriculture. With the rapid progress achieved in the field of
agricultural science and technology, measures have to be deviced to bring
as large an area as possible under irrigated agriculture by adopting
suitable ameliorative measures. It is therefore aimed at identifying areas
that o-an be commanded in different locations of the basin with the construc-
tion of various irrigation works, on the assumption that they can be brought
under cultivation. A reasonable percentagef the area so identified is
excluded to cover certain areas that are inevitably not fit for cultivation
and towards areas to be occupied by villages, roads, canals, distributary
and drainage systems and other infrastructural facilities.
In the upper Helmand basin irrigation is practised thro two systems of
canals. The project canals taking off from river diversion works and which
get their assured supplies from the storages above, come in first category.
Under the second category are included the various channels taking off
directly from the river with open heads. These cams draw their Lupplies
often by constructing temporary diversion works made of stone, brushwood,
earth etc. Such structures are of limited value in the sense that adequate
withdrawals into canals can only be maintained if the river water levels are
sufficiently high and not otherwise. The additional areas that are potent -
tially irrigable under the above two categories in the upper Helmand basin
are assessed to be 332000 ectares after taking into account the existing
irrigation of 77,00Dhectares.
In the lower basin particulars in respect of actual extents being
presently cultivated are not available, except for the lands in Chakhansur
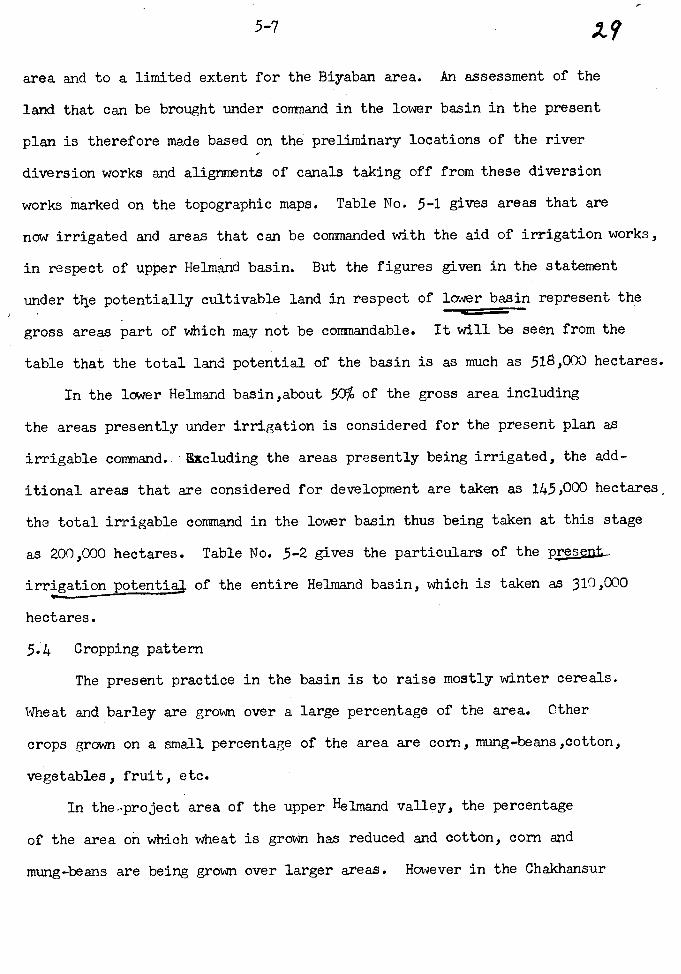
.5-7 17
area and to a limited extent for the Biyaban area. An assessment of the
land that can be brought under command in the lower basin in the present
plan is therefore made based on the preliminary locations of the river
diversion works and alignments of canals taking off from these diversion
works marked on the topographic maps. Table No. 5 -1 gives areas that are
now irrigated and areas that can be commanded with the aid of irrigation works,
in respect of upper Helmand basin. But the figures given in the statement
under the potentially cultivable land in respect of lower basin represent the
gross areas part of which may not be commandable. It will be seen from the
table that the total land potential of the basin is as much as 518,000 hectares.
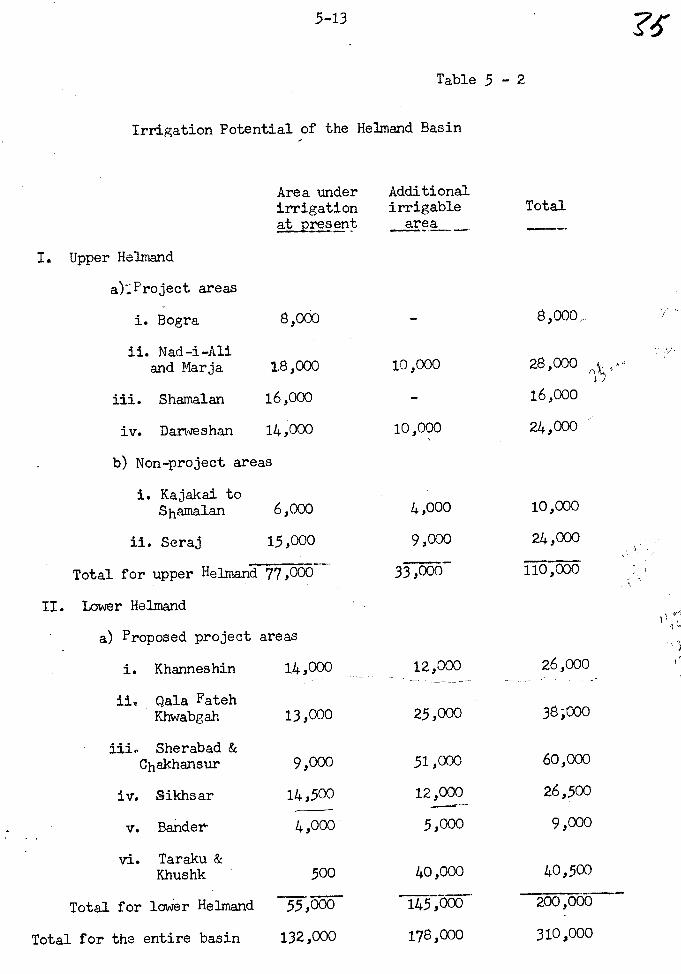
In the lower Helmand basin,about 50% of the gross area including
the areas presently under irrigation is considered for the present plan as
irrigable command. . xcluding the areas presently being irrigated, the add-
itional areas that are considered for development are taken as 145,000 hectares
the total irrigable command in the lower basin thus being taken at this stage
as 200,000 hectares. Table No. 5 -2 gives the particulars of the pres
irrigation potential of the entire Helmand basin, which is taken as 310,000
hectares.
5.4 Cropping pattern
The present practice in the basin is to raise mostly winter cereals.
Wheat and barley are grown over a large percentage of the area. Other
crops grown on a small percentage of the area are corn, mung- beans,cotton,
vegetables, fruit, etc.
In the -.project area of the upper Helmand valley, the percentage
of the area on which wheat is grown has reduced and cotton, corn and
mung -beans are being grown over larger areas. However in the Chakhansur
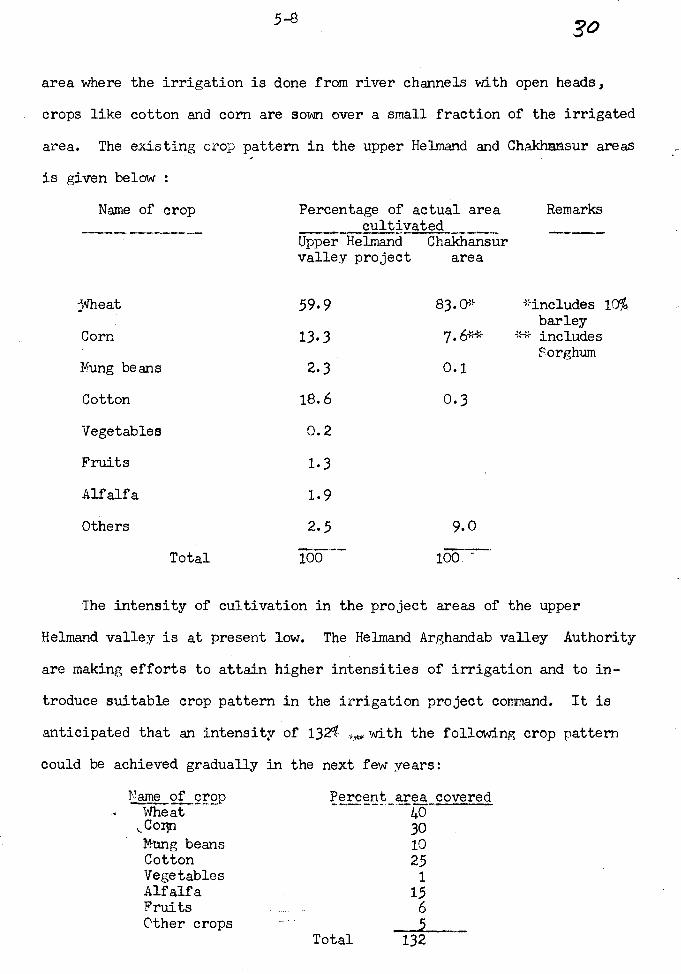
5-83o
area where the irrigation is done from river channels with open heads,
crops like cotton and corn are sown over a small fraction of the irrigated
area. The existing crop pattern in the upper Helmand and Chakhansur areas
is given below :
Name of crop Percentage of actual areacultivated
Remarks
10%.inlheat
Corn
Yung beans
Cotton
Vegetables
Fruits
Alfalfa
Others
Upper Helmandvalley project
59.9
13.3
2.3
18.6
0.2
1.3
1.9
2.5
Chakhansurarea
83.03
7.6--*
0.1
0.3
9.0
*includesbarley
-3; includes
Sorghum
Total 100__
100
The intensity of cultivation in the project areas of the upper
Helmand valley is at present low. The Helmand Arghandab valley Authority
are making efforts to attain higher intensities of irrigation and to in-
troduce suitable crop pattern in the irrigation project command. It is
anticipated that an intensity of 132/ :4 wdth the following crop pattern
could be achieved gradually in the next few years:
Name of crop Percent_äreácoveredPercent _area-Wheat
Cor9n 30Mting beans 10Cotton 25Vegetables 1
Alfalfa 15Fruits 6Other crops 5
Total 132
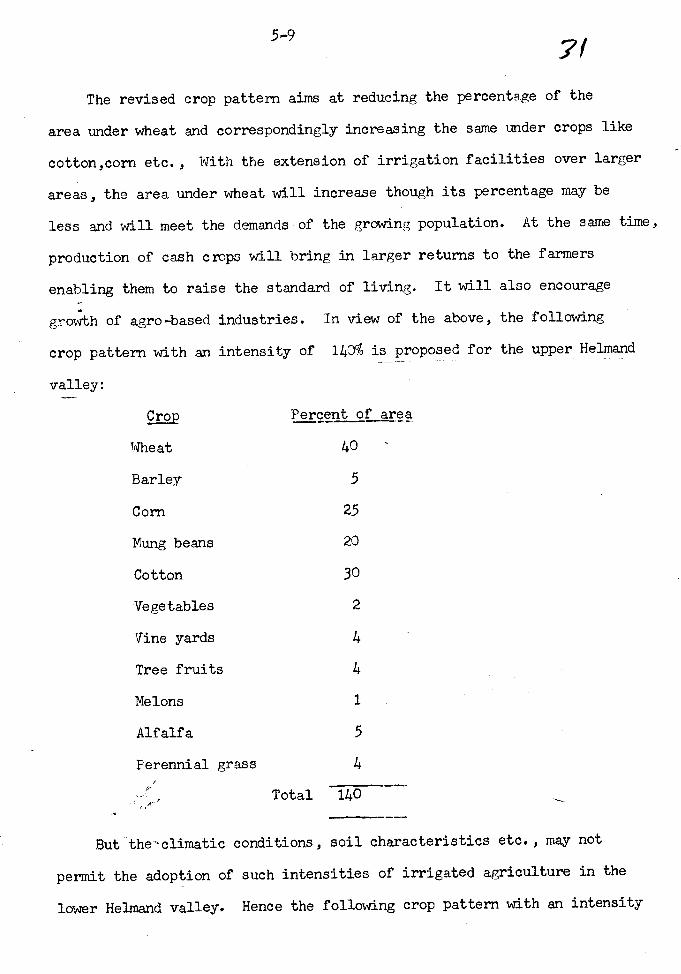
5 -9 7!The revised crop pattern aims at reducing the percentage of the
area under wheat and correspondingly increasing the same under crops like
cotton,corn etc., With the extension of irrigation facilities over larger
areas, the area under wheat will increase though its percentage may be
less and will meet the demands of the growing population. At the same time,
production of cash crops will bring in larger returns to the farmers
enabling them to raise the standard of living. It will also encourage
growth of agro-based industries. In view of the above, the following
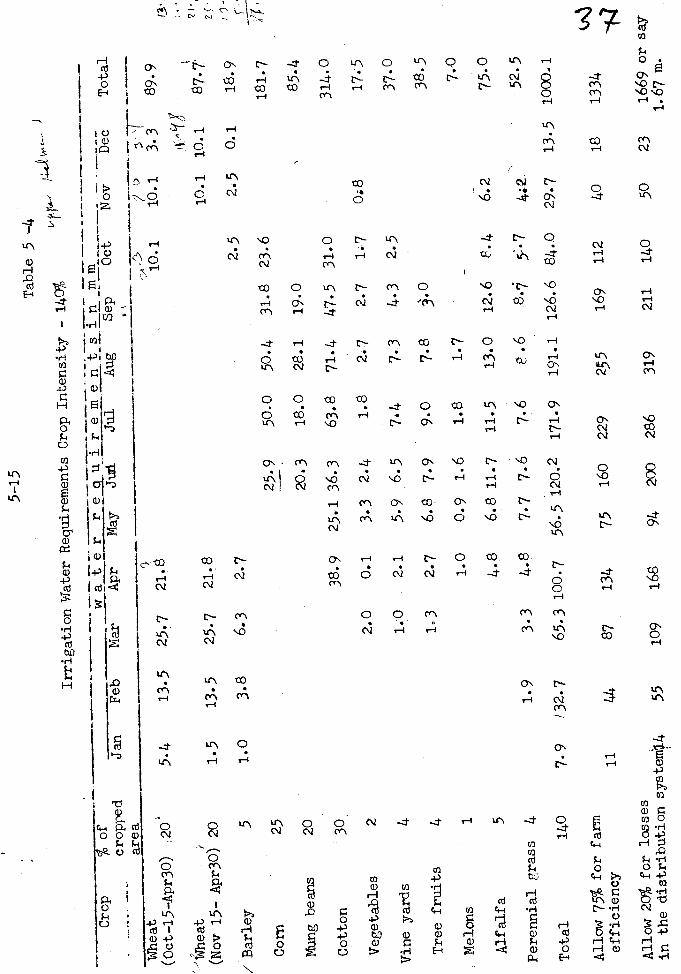
crop pattern with an intensity of 140 is proposed for the upper Helmand
valley:
Crop Percent of area
Wheat 40
Barley 5
Corn 25
Mung beans 20
Cotton 30
Vegetables 2
Vine yards 4
Tree fruits 4
Melons 1
Alfalfa 5
Perennial grass 4
Total 140
But the - climatic conditions, soil characteristics etc., may not
permit the adoption of such intensities of irrigated agriculture in the
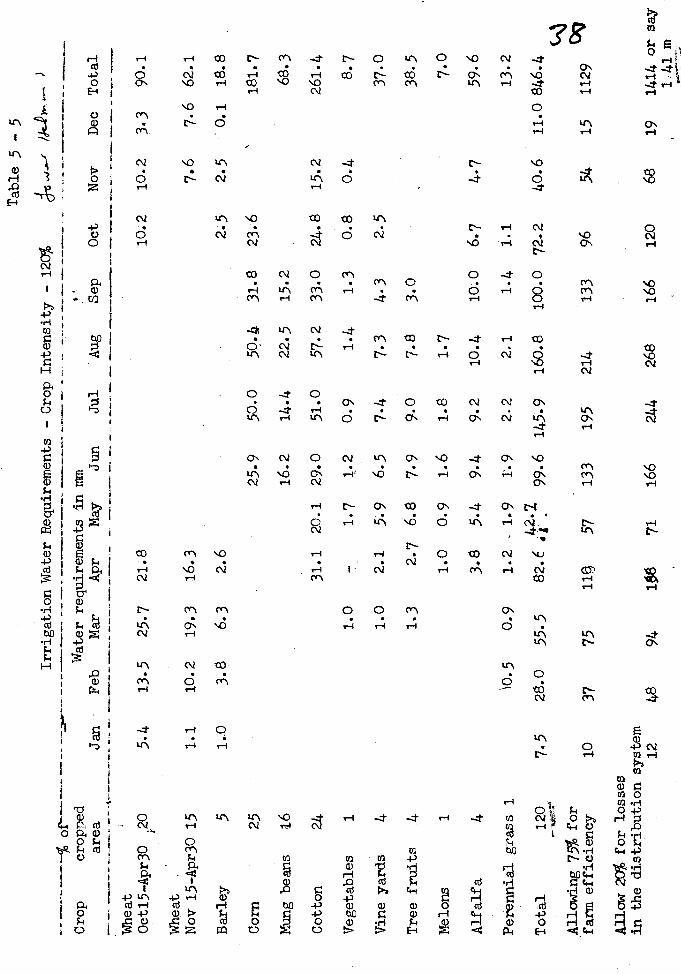
lower Helmand valley. Hence the following crop pattern with an intensity
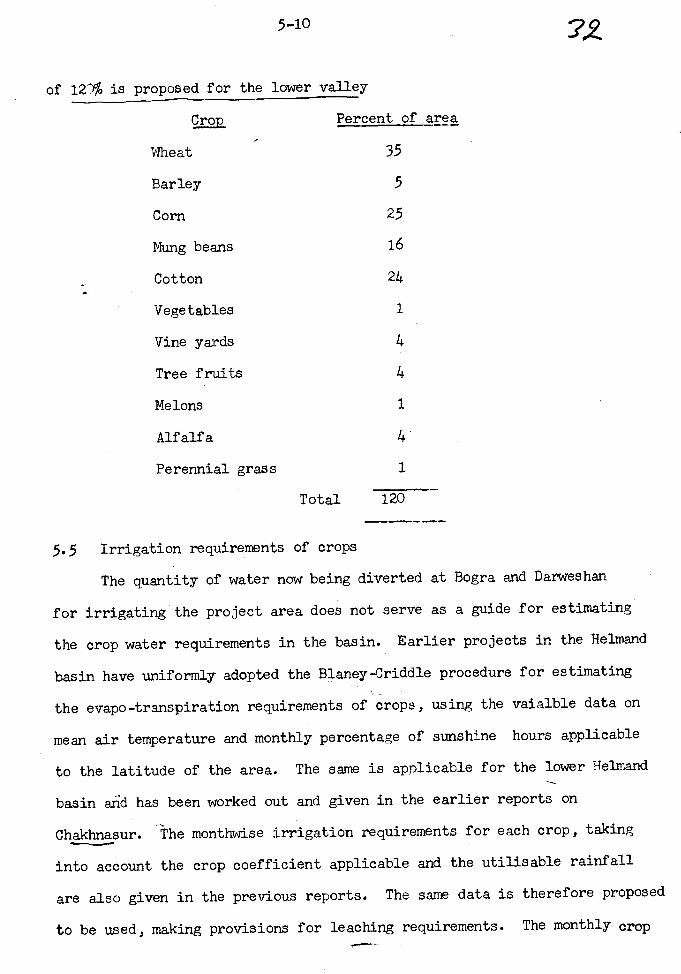
5-10 2.2
of 12TY% is proposed for the lower valley
Crop Percent of area
Wheat 35
Barley 5
Corn 25
Mung beans 16
Cotton 24
Vegetables i
Vine yards 4
Tree fruits 4
Melons 1
Alfalfa 4'
Perennial grass i
Total 120
5.5 Irrigation requirements of crops
The quantity of water now being diverted at Bogra and Darweshan
for irrigating the project area does not serve as a guide for estimating
the crop water requirements in the basin. Earlier projects in the Helmand
basin have uniformly adopted the Blaney -Criddle procedure for estimating
the evapo- transpiration requirements of crops, using the vaialbie data on
mean air temperature and monthly percentage of sunshine hours applicable
to the latitude of the area. The same is applicable for the lower Helmand
basin and has been worked out and given in the earlier reports on
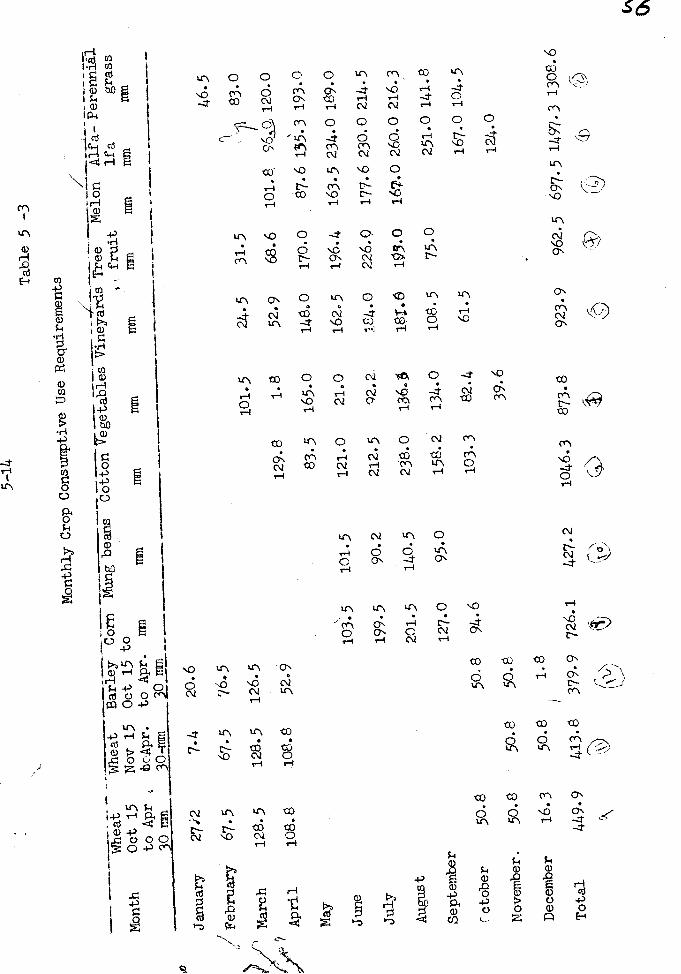
Chakhnasur. The monthwise irrigation requirements for each crop, taking
into account the crop coefficient applicable and the utilisable rainfall
are also given in the previous reports. The same data is therefore proposed
to be used, making provisions for leaching requirements. The monthly crop
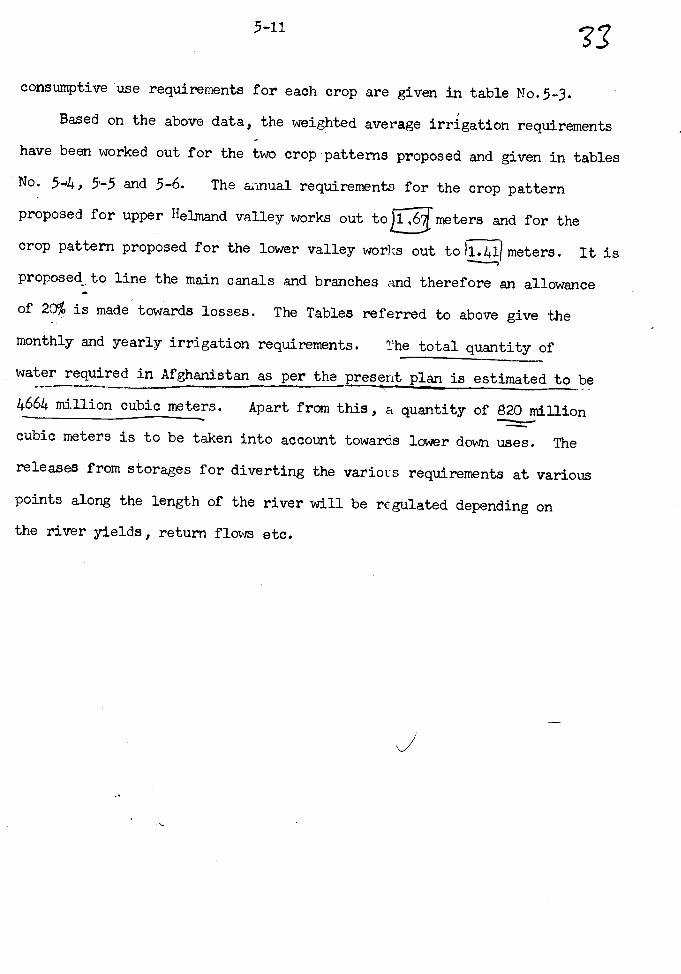
5 -11
consumptive use requirements for each crop are given in table No.5 -3.
?.3
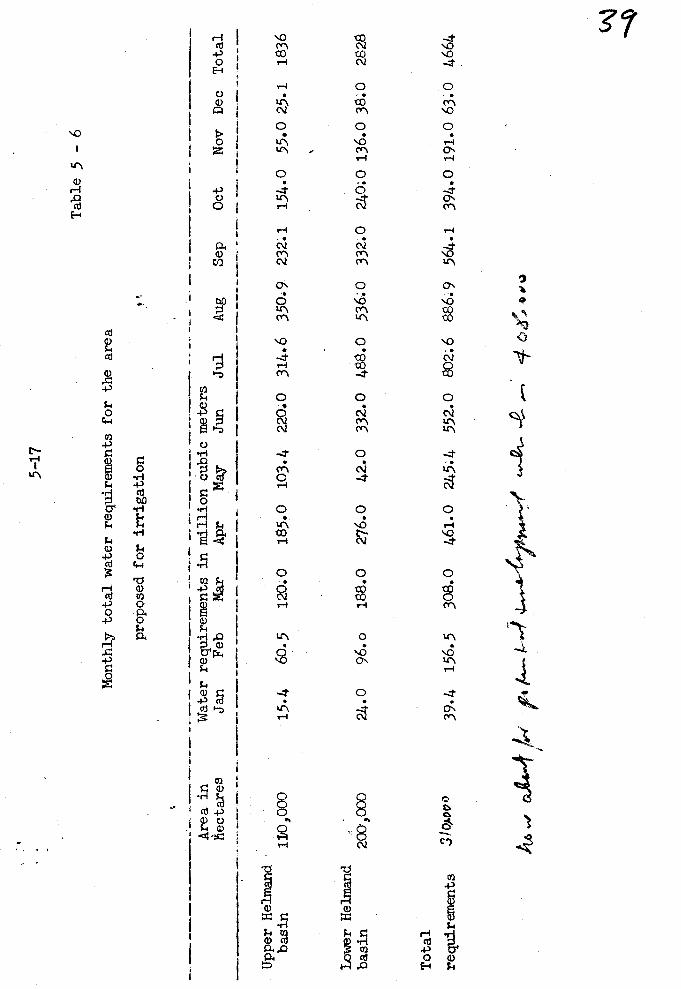
Based on the above data, the weighted average irrigation requirements
have been worked out for the two crop patterns proposed and given in tables
No. 5-Lf, 5-5 and 5 -6. The annual requirements for the crop pattern
proposed for upper Helmand valley works out to meters and for the
crop pattern proposed for the lower valley works out to11.41jmeters. It is
proposed. line the main canals and branches and therefore an allowance
of 20% is made towards losses. The Tables referred to above give the
monthly and yearly irrigation requirements. The total quantity of
water required in Afghanistan as per the resent plan is estimated to be
4664 million cubic meters. Apart from this, a quantity of 820 million
cubic meters is to be taken into account towards lower down uses. The
releases from storages for diverting the various requirements at various
points along the length of the river will be regulated depending on
the river yields, return flows etc.
5 -12
Table 5 - 1
9Land Potential of Helmand Basin(Hectares
Area under Potential Totalirrigation cultivable'at_present" commended area
T. Upper Helmand
Sit
a) Project areas
ii. Bogra
ii. Nad-i -Aliand Marja
8,000
18,000
- )
10,000
8,000
G28,000
iii. Shamalan 16,000 - 16,000
iv. Darweshan
b) Non project area
14,000 10,000 24,000
Jr. Ka jakai to ,I
Shamalan 6,000 + '` 4,000 ,5 =" 10,000ii. Seraj 15,00Òa f 9,000, 4`' 24,000
Total upper Helmand 77,-5667 33,000 110,00-
II. Lower Helmand
Proposed project areas
i. Khanneshin
ii. Qala Fateh-
14,000 25,E 39,000
Khwabgah 13,E 51,000 64,000
iii. Sherabad andChakhansur 9,000 121,000 130,000
iv. Sikhsar 14,500 25,500 40,000
v. Bander 4,000
vi. Taraku and
10,500 14,500
Khushk ti 500 120,000 120,500
Total lower Helmand 55,E 353,E 408,000 4r°"
Total for the entire basin132,000 386,000 518,000
5 -13
Table 5 - 2
Irrigation Potential of the Helmand Basin
Area under Additionalirrigation irrigable Total
at present area
I. Upper Helmand
a) :Project areas
i. Bogra 8,000
ii. Nad -i -Ali
- 8,000,.
and Marja 18,000 10,000 28,000
iii. Shamalan 16,000 - 16,000
iv. Darweshan 14,E
b) Non project areas
i. Kajakai to
10,000 24,000
Shamalan 6,000 4,000 10,000
ii. Seraj 15,000 9,000 24,000
Total for upper Helmand 77,000 33,E 110,000
II. Lower Helmand
a) Proposed project areas
i. Khanneshin
ii. Qala Fateh
14,000 12,000 26,000
Khwabgah
iii- Sherabad &
13,000 25,000 38;000
Chakhansur 9,000 51,000 60,000
iv. Sikhsar 14,500 12,000 26,500
v. Bander
vi. Taraku &
4,000 5,000 9,000
Khushk 500 40,000 40,500
Total for lower Helmand 55,000 145,ö 200,000
Total for the entire basin 132,E 178,000 310,000
?4"
5 -14
Table 5 -3
Monthly Crop Consumptive
Use Requirements
etab
les
Vineyards Tree
Melon Alfa- Perennidl
Wheat
Whe
atB
arle
y C
orn
Man
gbe
ans
Cot
ton
gy
Month
Oct 15
Nov 15
Oct 15 to
to Apr
tcApr.
to Apr.
mm
MM
man
MM
mm
30 r
an30 -arms
2 mm
January
27i2
7.4
20.6
February
67.5
67.5
76.5
March
128.5
128.5
126.5
April
108.8
108.8
52.9
May
June
July
August
September
'ctober
50.8
50.8
November.
50.8
50.8
50.8
December
16.3
50.8
1.8
Total
449.9
413.8
379.9
101.5
24.5
129.8
1.8
52.9
83.5
165.0
148.0
103.5
101.5
121.0
21.0
162.5
199.5
90.2
212.5
92.2.
184.0
201.5
140.5
238.0
1364
181.8
127.0
95.0
158.2
134.0
108.5
94.6
103.3
82.4
61.5
39.6
726.1
427.2
1046.3
873.8
923.9
fruit
lfa
grass
mm 31.5
68.6
mm
mm
IIun
101.8.
,
96;ÿ,
46.5
83.0
120.0
170.0
87.613.3
193.0
196.4
163.5
234.0
189.0
226.0
177.6
230.0
214.5
155.0
167.0
260.0216.3
75.0
251.0
141.8
167.0
104.5
124.0
962.5
697.5
1497.3
1308.6
5 -15
Table 5 -4
Irrigation Water Requirements Crop
Intensity - 140°0
J"°
Crop
%of
water requirement sin
mm
cropped
Jan
Feb
Mar
Apr
May
Junk
Jul
Aug.
Sep
Oct
Nov
Dec
Total
area
Wheat
(Oct- 15- Apr30)
20.
5.4
13.5
25.7
21.8
`Wheat
f
(Nov 15- Apr30) 20
1.5
13.5
25.7
21.8
/ Barley
51.0
3.8
6.3
2.7
Corn
Mung beans
Cotton
Vegetables
Vine yards
Tree fruits
Melons
Alfalfa
Perennial grass
Total
25
20
30 2 4 4 1 5 4
140
7.9
1.9
132.7
Allow 75% for farm
efficiency
11
44
Allow 20% for losses
in the distribution
system1.4
55
38.9
25.1
25.9
50.0
18.0
63.8
50.4
28.1
71.4
20.3
36.3
2.0
0.1
3.3
2.4
1.8
2.7
1.0
2.1
5.9
6.5
7.4
7..3
1.3
2.7
6.8
7.9
9.0
7.8
1.0
O.9
1.6
1.8
1.7
4.8
6.8
11.7
11.5
13.0
3.3
4.8
7.7
7.6
7.6
8.6
65.3
100.7
56.5
120.2
171.9
191.1
87
134
75
160
229
255
109
168
94
200
286
319
31.8
19.0
47.5
2.7
4.3
J.0
.5
10.1
2.5
23.6
31.0
1.7
2.5
'D
10.1
10.1
2.5
0.8
3 7
3.3
V ctS
10.1
0.1
89.9
I
87.7'
18.9
181.7
85.4
314.0
17.5
37.0
38.5
13.)
71)
19- 1. . ?,
7.0
12.6
8.4
6.2
75.0
8.7
5:.7
4:2
..1
126.6
84..0
29.7
13.5
1000.1
169
112
40
18
1334
211
140
50
23
1669 or say
1.67 m.
_--%
f. _.._
Crop
cropped
area
Jan
Irrigation
Water
Feb
Water Requirements - Crop Intensity
requirements in mm
Mar
Apr
May
Jun
Jul
Aug
- 120%
Sep
Oct
Table 5
- 5
Total
Nov
Dec
Wheat
Oct15 -Apr30
.20
5.4
13.5
25.7
21.8
10.2
10.2
3.3
90.1
Wheat
Nov 15 -Apr30 15
1.1
10.2
19.3
16.3
7.6
7.6
62.1
Barley
51..0
3.8
6.3
2.6
2.5
2.5
0.1
18.8
Corn
25
25.9
50.0
50.1
3.1.8
23.6
181.7
Mung beans
16
16.2
14.4
22.5
15.2
68.3
Cotton
24
31.1
20.1
29.0
51.0
57.2
33.0
24.8
15.2
261.4
Vegetables
11.0
-1.7
1.2
0.9
1.4
1.3
0.8
0.4
8.7
Vine yards
41.0
2.1
5.9
6.5
7.4
7.3
4.3
2.5
37.0
Tree fruits
41.3
2.7
6.8
7.9
9.0
7.8
3.0
38.5
Melons
11.0
0.9
1.6
1.8
1.7
7.0
Alfalfa
43.8
5.4
9.4
9.2
10.4
10.0
6.7
4.7
59.6
Perennial grass 1
10.5
0.9
1.2
1.9
1.9
2.2
2.1
1.4
1.1
13.2
Total
120
7.5
28.0
55.5
82.E
;_
Z99.6
145.9
160.8
100.0
72.2
40.6
11.0
846.4
Allowing 75% for
farm efficiency
10
37
75
11g
57
133
195
214
133
96
54
15
1129
09
Allow 20% for losses
in the distribution system
12
48
94
108
71
166
244
268
166
120
68
19
1414 or say
1 :41 m
5 -17
Table 5 -6
Monthly total water requirements for the area
proposed for irrigation
Water requirements in million cubic
Jan
Feb
Mar
Apr
May
Aug
Sep
Oct
Area in
iectare3
meters
Jun
Jul
Nov
Dec
Total
Upper Helmand
basin
130,000
15.4
60.5
120.0
185.0
103.4
220.0
314.6
350.9
232.1
154.0
55.0
25.1
1836
Lower Helmand
basin
200,000
24.0
96.o
188.0
276.0
42.0
332.0
488.0
536:0
332.0
240:0
136.0
38.0
2828
Total
requirements
310.
0010
39.4
156.5
308.0
461.0
245.4
552.0
802.6
886.9
564.1
394.0
191.063.0
4664
400
6-1 -70
CHAPTER 6
PROPOSAIS FER DEVELOPMENT
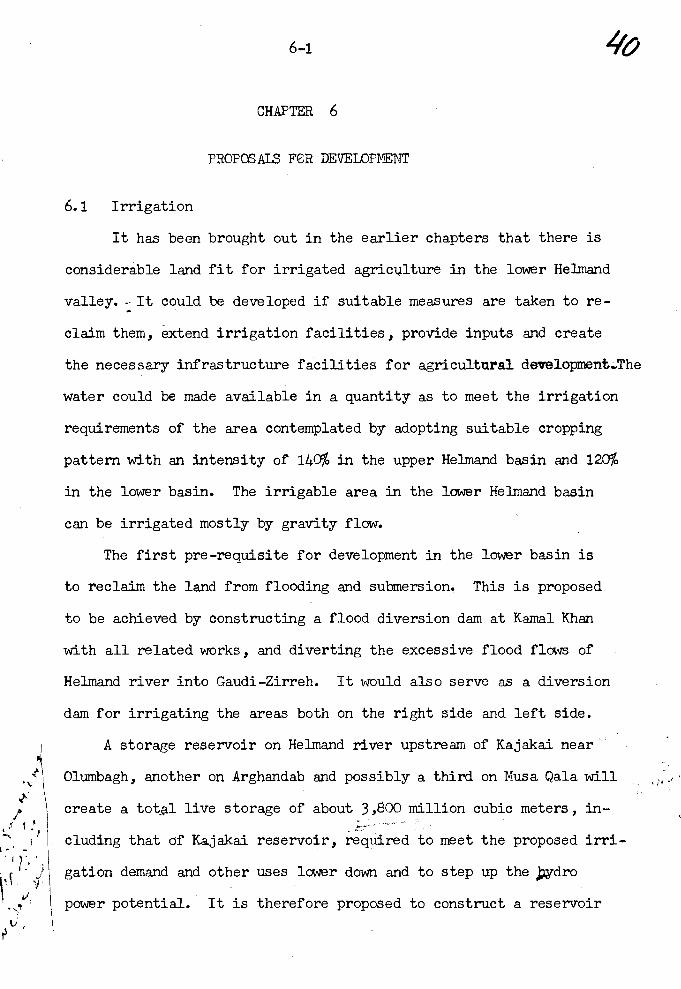
6.1 Irrigation
It has been brought out in the earlier chapters that there is
considerable land fit for irrigated agriculture in the lower Helmand
valley. It could be developed if suitable measures are taken to re-
claim them, extend irrigation facilities, provide inputs and create
the necessary infrastructure facilities for agricultural development,.The
water could be made available in a quantity as to meet the irrigation
requirements of the area contemplated by adopting suitable cropping
pattern with an intensity of 140% in the upper Helmand basin and 120%
in the lower basin. The irrigable area in the lower Helmand basin
can be irrigated mostly by gravity flow.
The first pre -requisite for development in the lower basin is
to reclaim the land from flooding and submersion. This is proposed
to be achieved by constructing a flood diversion dam at Kamal Khan
with all related works, and diverting the excessive flood flows of
Helmand river into Gaudi- Zirreh. It would also serve as a diversion
dam for irrigating the areas both on the right side and left side.
A storage reservoir on Helmand river upstream of Kajakai near
Olumbagh, another on Arghandab and possibly a third on Musa Qala will
create a total live storage of about 3,$00 million cubic meters, in-
eluding that of Kajakai reservoir, required to meet the proposed irri-
gation demand and other uses lower down and to step up the j rdro
power potential. It is therefore proposed to construct a reservoir
6-2
yi
on Helmand river upstream of Kajakai reservoir, one on Arghandab
river and possibly a third on Musa Qala.
The regulated releases let down from the storage dams higher
up are therefore to be diverted for irrigation at suitable points
lower down by constructing a series of diversion works.
It is considered that a minimum of two diversion dams, at
Khanneshin and Taghaz on the upstream of Kamal Khan dam and two
diversion dams Khwabgah and Sikhsar downstream of Kamal Khan dam
will be necessary. At these four diversion dams, there will be one canal
each, while at Kamal Khan diversion dam, there will be two canals
taking off from it. A fifth diversion dam upstream of Kamal Khan
dam but below Taghaz diversion dam may also be constructed. A
diversion dam below Kajakai dam at Garmab will have to be
constructed along with the necessary irrigation network for irrigating
the new areas in the upper Helmand valley.
Studies show that about 500 kms length of main canal system
would be needed to serve the area. In addition, there would be 2,000
km of laterals and sub l aLcrals .
The existing irrigation and drainage system covering an area
f about 30,000 hectares in the upper Helmand valley needs improvements
and these will have to be attended to.
The irrigation potential thus created can be utilised success-
fully, if there is agricultural development simultaneously. It is
therefore proposed to provide the necessary inputs and create the
infrastructure facilities in the command area.
6-3
6.2 Power
At Kajakai dam installation of two hydro generating units each
of 16.5 M.Ws capacity is nearing completion. With the increased storage
that will be created in the next two or three years at Kajakai dam as a
result of erection of spillway gates, it will be possible to utilise
it to step up power generation by installing additional unit with a
capacity of 116.5 M.Ws without clashing with the present irrigation
interests. This could. be done including erection of transmission lines
within five years, as what is needed is only the extension of power
house, installation of additional power units, enlarging the switchyard,
laying the transmission lines, construction of sub -stations etc., The
quickest way to meet the urgent needs of the valley in general and of
areas around Kandahar, Herat and Kabul in particular which have great
potential for rapid industrialisation, if only electric power, the
essential requirement for industrial growth is available, is by complet-
ing the installation of additional power units at Kajakai .dam and laying
the transmission lines to various load centres in the next 5 years.
Generation of power at the proposed diversion dams is not contem-
plated at present. It is however proposed to generate power at Kamal
Khan flood diversion dam,, where a low head power plant could be ins -
talled. The power generation would fluctuate between g to 2 T .Ws. /
At the upper Kajakai dam (at Olumbagh) it is however possible to
operate the reservoir for maximising firm power generation, as the
power releases from this dam are re-regulated at the Kajakai damn lower
down to suit the irrigation releases.! 0 2M.Ws of firm power with a
system load factor of 0.5 can be generated at this dam. It is therefore
proposed to have a power plant with an installed capacity of 90 M.Ws
6-4 9?at this darn by the time the power generated at Kajakai is fully utilised
and demand for additional power grows.
The additional storage space created at Kajakai, the proposed
complex of additional storage reservoirs, diversion dams, canal systems
would ensure the following benefits :
Firm power of 120 M.Ws at 0.5 load factor at Kajakai dam'
with an installed capacity of 150 M.
2. :Immunity to the lands to an extent of about 1100,000 hectares
in the lower Helmand basin from flooding and inundation;
3. Irrigated agriculture over 233,000 hectares of land in
addition to the existing 77,000 hectares of land in upper
valley;
4. Additional firm power of 60 M.Ws at 0.5 load factor at upper
Kajakai dam with an installed capacity of 90 M.Ws.
3
7 -1
CHAPTER 7
KAMAL KHAN FLOOD DIVERSION DAN" AND RELATED WORKS
vy
7.1 General
The yields of the Helmand river particularly in the months of March,
April _And may in about one at of there v rs. II .Kajakai are very much
more than what the storages can absorb, with the result the excessive
floods flow down the reservoirs. In the water year 1956 -57 the river
yields in the months of March, April, May and June at Kajakai were
1440, 2990, 3120 and 1270 million cubic meters respectively. Again in
the water year 1964 -65, the river yields in the months of March, April,
May and June at Kajakai were 1185, 2164, 2360_ and 1110 til1ion'cub a 'meters
respectively. The yields of Musa Qala river and those of Arghandab river
in 1956 -57 are also considerably high. Such excess flood volumes empty
into Hamuns lower down, the water levels of which backup flooding large
areas.
The peak flood discharges of the Helmand river at Darweshan in the
years 1957, 1961, 1965 and 1967 varied between 3760 m3 /sec and 2180 m3/
sec. The corresponding peaks at Chahar Burjak also varied between
3300 m3 /sec and 2180 m3 /sec., even after the construction of the Kajakai---
reservoir. Large areas to an extent of about 100,000 hectares in the
reaches below Khwabgah are reported to have been flooded during these
years. It is reported that flood protection dykes breached whenever
there were flood inflows. Re-construction of these dykes is reported
'0
7 -2
to be a recurring feature involving heavy cost and labour. About 100,000
hectares of land is said to suffer in most of the years due to flooding
and inundation on account of excess flood volumes and peaks.
A large number of flood protection works and more costly diversion
structures are to be constructed all along the river channel course to
prevent flooding. And large storages are to be created to absorb large
flood volumes to prevent inundation. Both or either of these measures
will be prohibitively costly. A natural depression like Gaudi- Zirreh
which has a large storage space can only absorb such excess flood volumes
and flood peaks without flooding and inundating valuable lands.
Two alternative sites one at Rodbar and the other at Kamal Khan
were investigated for diversion of excessive flood waters to Gaudi- Zirreh.
The diversion at Kamal Khan takes advantage of the natural channels,
Rud-i-Biyaban and Rud -i- Khushk thro which excess flood flows could be
economically led into Gaudi- Zirreh. The alternative of flood diversion
at Kamal Khan is therefore selected.
The flood control scheme is to divert excess flood flows of the
Helmand river westward into Rud -i- Biyaban then south into Gaudi- Zirreh
thro Rud -i- Khushk. The water diverted into Gaudi- Zirreh would dissipate
by evaporation. Flows are diverted into Hud -i Biyaban by Kamal Khan dam
and into Rud -i- Khushk by Qala Afzal dam. A control weir is proposed at
the point of diversion into Rud-i-Biyaban to maintain diversion levels at
the outlet structures in Kamal Khan dam. A road bridge over the control
weir and taken over the Kemal Khan dam would connect the left and right
banks of Rud-i-Biyaban and both the banks of Helmand. A law dyke on the
right bank of Rud-i-Biyaban provides access to Qala Afzal dam, apart from
protecting low lying lands against flooding. An irrigation outlet at
7 -3
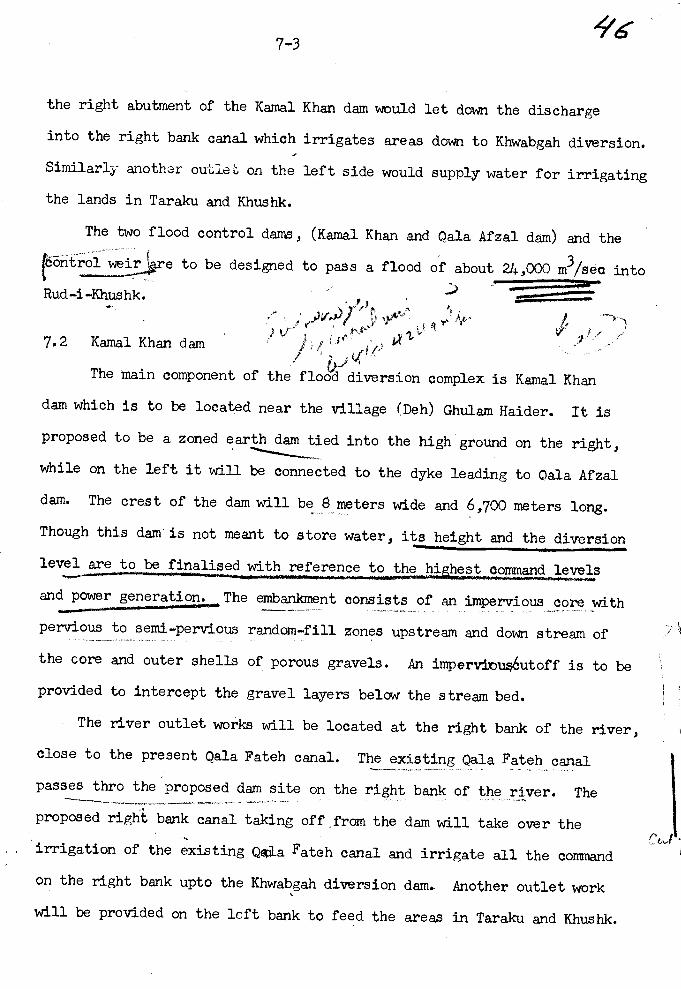
the right abutment of the Kamal Khan dam would let down the discharge
into the right bank canal which irrigates areas down to Khwabgah diversion.
Similarly another outlet on the left side would supply water for irrigating
the lands in Taraku and Khushk.
The two flood control dams, (Kamal Khan and Qala Afzal dam) and the
C6htrol weir
Rud-i-Khushk.
to be designed to pass a flood of about 24,000 m3 /sea into
7.2 Kamal Khan dam
N"'
The main component of the flood diversion complex is Kamal Khan
dam which is to be located near the village (Deh) Ghulam Haider. It is
proposed to be a zoned earth dam tied into the high ground on the right,
while on the left it will be connected to the dyke leading to Qala Afzal
dam. The crest of the dam will be 8 meters wide and 6,700 meters long.
Though this dam is not meant to store water, its height and the diversion
level are to be finalised with reference to the hi hest command levels
and power generation. The embankment consists of an impervious core with
pervious to semi- pervious random -fill zones upstream and down stream of
the core and outer shells of porous gravels. An impervimts6utoff is to be
provided to intercept the gravel layers below the stream bed.
The river outlet works will be located at the right bank of the river,
close to the present Qala Fateh canal. The existing Qala Fateh canal
passes thro the proposed dam site on the right bank of the river. The
proposed right bank canal taking off,from the dam will take over the
irrigation of the existing Q4a Fateh canal and irrigate all the command
on the right bank upto the Khwabgah diversion dam. Another outlet work
will be provided on the left bank to feed the areas in Taraku and Khushk.
i
7-l+
97
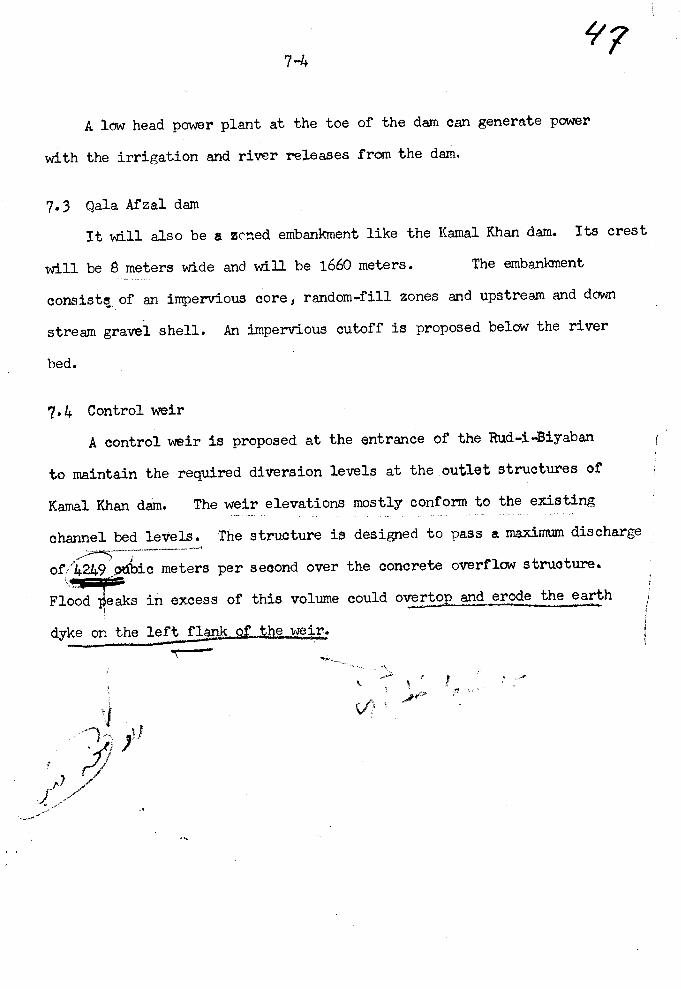
A low head power plant at the toe of the dam can generate power
with the irrigation and river releases from the dam.
7.3 Qala Afzal dam
It will also be a zoned embankment like the Kamal Khan dam. Its crest
will be 8 meters wide and will be 1660 meters. The embankment
consisté of an impervious core, random -fill zones and upstream and down
stream gravel shell. An impervious cutoff is proposed below the river
bed.
7.4 Control weir
A control weir is proposed at the entrance of the Rud- i- Biyaban
to maintain the required diversion levels at the outlet structures of
Kamal Khan dam. The weir elevations mostly conform to the existing
channel bed levels. The structure is designed to pass a maximum discharge
of/ 4249 pubic meters per second over the concrete overflow structure.
Flood peaks in excess of this volume could overtop and erode the earth
dyke on the left flank of the weir..rowavsor*
8 -1
L/7
CHAPTER 8
UPPER KAJAKAI DAM AT OLUMEAGH
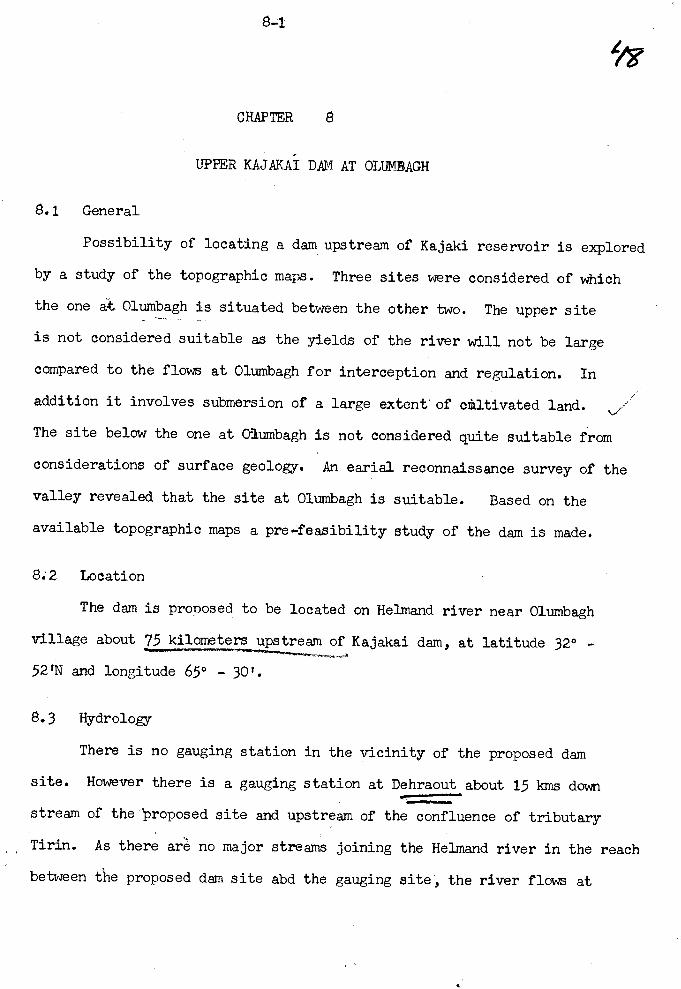
8.1 General
Possibility of locating a dam upstream of Kajaki reservoir is explored
by a study of the topographic maps. Three sites were considered of which
the one at Olumbagh is situated between the other two. The upper site
is not considered suitable as the yields of the river will not be large
compared to the flows at Olumbagh for interception and regulation. In
addition it involves submersion of a large extent of ozàltivated land.
The site below the one at Olumbagh is not considered quite suitable from
considerations of surface geology. An earial reconnaissance survey of the
valley revealed that the site at Olumbagh is suitable. Based on the
available topographic maps a pre- feasibility study of the dam is made.
8:2 Location
The dam is proposed to be located on Helmand river near Olumbagh
village about 75 kilometers upstream of Kajakai dam, at latitude 32° -
52'N and longitude 65° - 30'.
8.3 Hydrology
There is no gauging station in the vicinity of the proposed dam
site. However there is a gauging station at Dehraout about 15 kris down
stream of the-proposed site and upstream of the confluence of tributary
Tirin. As there aré no major streams joining the Helmand river in the reach
between the proposed dam site abd the gauging site, the river flows at
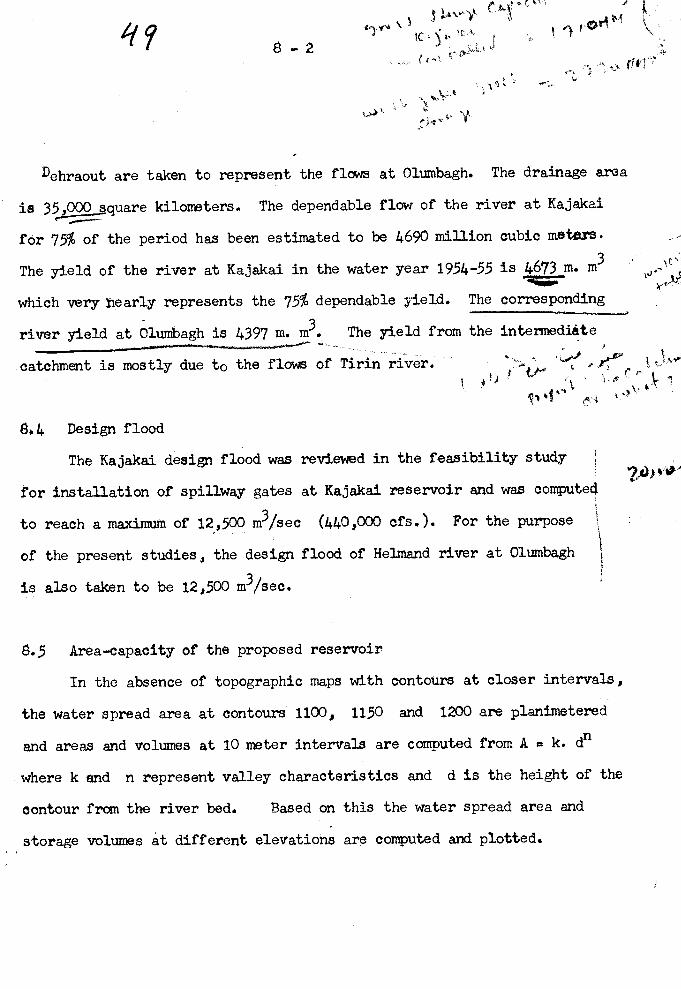
y9 8 -2
Dehraout are taken to represent the flows at Olumbagh. The drainage area
is 35,000 square kilometers. The dependable flow of the river at Kajakai
for 75% of the period has been estimated to be 4690 million cubic meurs.
The yield of the river at Kajakai in the water year 1954 -55 is 4673 m. m3
which very pearly represents the 75% dependable yield. The corresponding
river yield at Olumbagh is 4397 114 m?
. The yield fran the bate
catchment is mostly due to the flows of Titan river.
8,4 Design flood
The Kajakai design flood was reviewed in the feasibility study
for installation of spillway gates at Kajakai reservoir and was computed
to reach a maximum of 12,500 m3 /sec (440,000 cfs.). For the purpose
of the present studies, the design flood of Helmand river at Olumbagh
is also taken to be 12,500 m3 /sec.
8.5 Area -capacity of the proposed reservoir
In the absence of topographic maps with contours at closer intervals,
the water spread area at contours 1100, 1150 and 1200 are planimetered
and areas and volumes at 10 meter intervals are computed from A = k. do
where k and n represent valley characteristics and d is the height of the
contour from the river bed. Based on this the water spread area and
storage volumes at different elevations are computed and plotted.
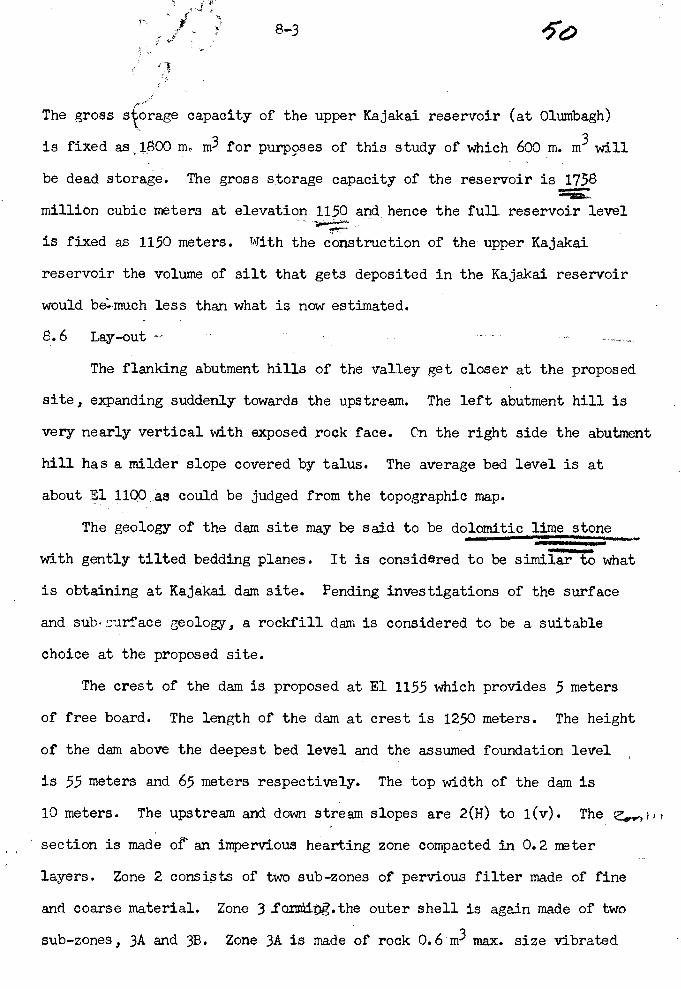
The gross storage capacity of the upper Kajakai reservoir (at Olumbagh)
is fixed as 1800 m. m3 for purposes of this study of which 600 m. m3 will
be dead storage. The gross storage capacity of the reservoir is 1758
million cubic meters at elevation 1150 and hence the full reservoir level
8-3
is fixed as 1150 meters. With the construction of the upper Kajakai
reservoir the volume of silt that gets deposited in the Kajakai reservoir
would be -much less than what is now estimated.
8.6 Lay -out
The flanking abutment hills of the valley get closer at the proposed
site, expanding suddenly towards the upstream. The left abutment hill is
very nearly vertical with exposed rock face. On the right side the abutment
hill has a milder slope covered by talus. The average bed level is at
about El 1100. as could be judged from the topographic map.
The geology of the dam site may be said to be dolomitic lime stone01.101NNXIMINesseepaa.
with gently tilted bedding planes. It is considered to be similar to what
is obtaining at Kajakai dam site. Pending investigations of the surface
and subcurface geology, a rockfill dam is considered to be a suitable
choice at the proposed site.
The crest of the dam is proposed at El 1155 which provides 5 meters
of free board. The length of the dam at crest is 1250 meters. The height
of the dam above the deepest bed level and the assumed foundation level
is 55 meters and 65 meters respectively. The top width of the dam is
10 meters. The upstream and down stream slopes are 2(H) to 1(v). The e,,.,01;
section is made of an impervious hearting zone compacted in 0.2 meter
layers. Zone 2 consists of two sub -zones of pervious filter made of fine
and coarse material. Zone 3.fonn ing.the outer shell is again made of two
sub- zones, 3A and 3B. Zone 3A is made of rock 0.6 m3 max. size vibrated
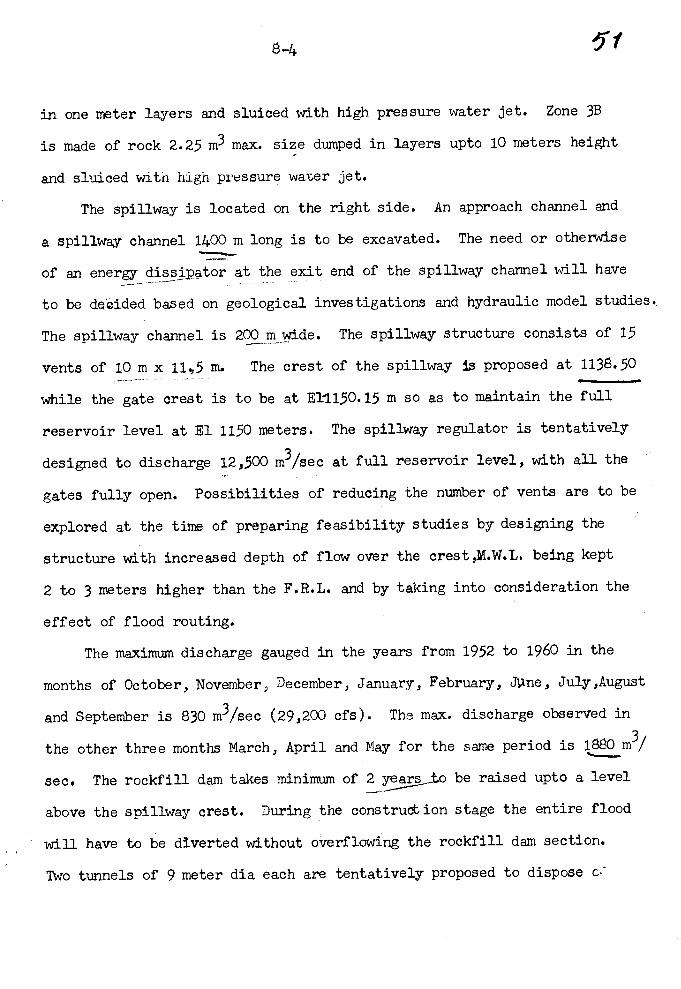
8-4 5f
in one meter layers and sluiced with high pressure water jet. Zone 3B
is made of rock 2.25 m3 max. size dumped in layers upto 10 meters height
and sluiced with high pressure water jet.
The spillway is located on the right side. An approach channel and
a spillway channel 1400 m long is to be excavated. The need or otherwise
of an energy dissipator at the exit end of the spillway channel will have
to be deáided based on geological investigations and hydraulic model studies.
The spillway channel is 200 m wide. The spillway structure consists of 15
vents of 10 m x 11,5 m. The crest of the spillway is proposed at 1138.50
while the gate crest is to be at E11150.15 m so as to maintain the full
reservoir level at El 1150 meters. The spillway regulator is tentatively
designed to discharge 12,500 m3 /sec at full reservoir level, with all the
gates fully open. Possibilities of reducing the number of vents are to be
explored at the time of preparing feasibility studies by designing the
structure with increased depth of flow over the crest,M.W.L. being kept
2 to 3 meters higher than the F.R.L. and by taking into consideration the
effect of flood routing.
The maximum discharge gauged in the years from 1952 to 1960 in the
months of October, November, December, January, February, Jane, July,August
and September is 830 m3/sec (29,200 cfs). The max. discharge observed in
the other three months March, April and May for the same period is 1220m3/
sec. The rockfill dam takes minimum of 2 years to be raised upto a level
above the spillway crest. During the construction stage the entire flood
will have to be diverted without overflowing the rockfill dam section.
Two tunnels of 9 meter dia each are tentatively proposed to dispose c"
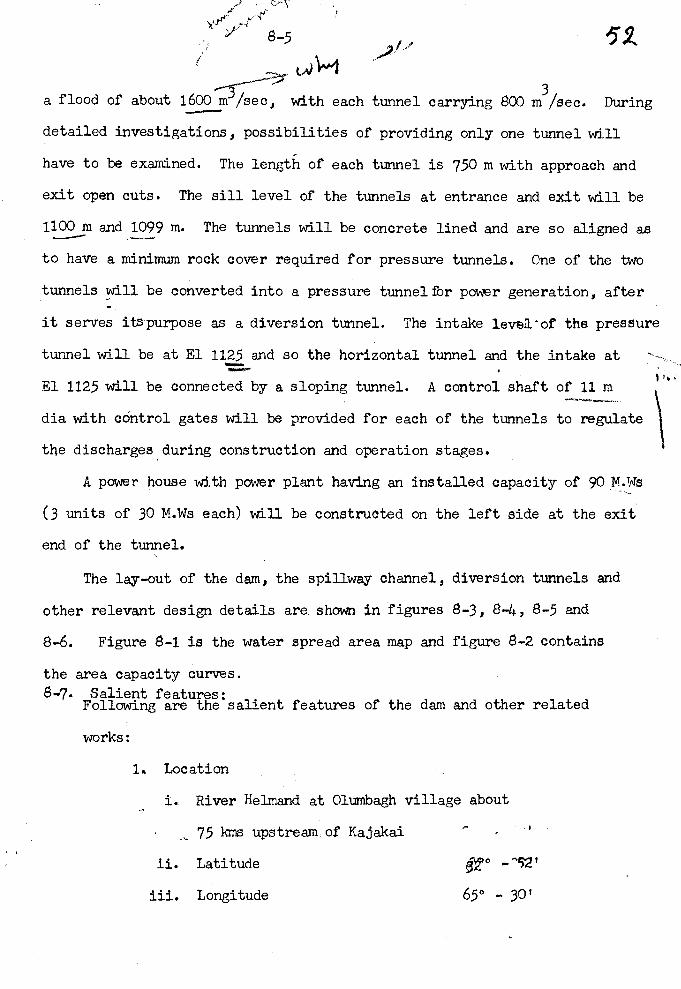
52
3a flood of about 1600 m /sec, with each tunnel carrying 800 m /sec. During
detailed investigations, possibilities of providing only one tunnel will
have to be examined. The length of each tunnel is 750 m with approach and
exit open cuts. The sill level of the tunnels at entrance and exit will be
1100 m and 1099 m. The tunnels will be concrete lined and are so aligned as
to have a minimum rock cover required for pressure tunnels. One of the two
tunnels will be converted into a pressure tunnel for power generation, after
it serves itspurpose as a diversion tunnel. The intake leva -of the pressure
tunnel will be at El 1125 and so the horizontal tunnel and the intake at
El 1125 will be connected by a sloping tunnel. A control shaft of 11 m
dia with control gates will be provided for each of the tunnels to regulate
the discharges during construction and operation stages.
A power house with power plant having an installed capacity of 90 M.Ws
(3 units of 30 M.Ws each) will be constructed on the left side at the exit
end of the tunnel.
The lay -out of the dam, the spillway channel, diversion tunnels and
other relevant design details are shown in figures 8 -3, 8-4, 8 -5 and
8-6. Figure 8 -1 is the water spread area map and figure 8 -2 contains
the area capacity curves.
8 -7. Salient features:Following are the salient features of the dam and other related
works:
1. Location
i.. River Helmand at Olumbagh village about
75 kms upstream :of Kajakai
ii. Latitude
iii. Longitude
dr -7521
650 - 30r
1
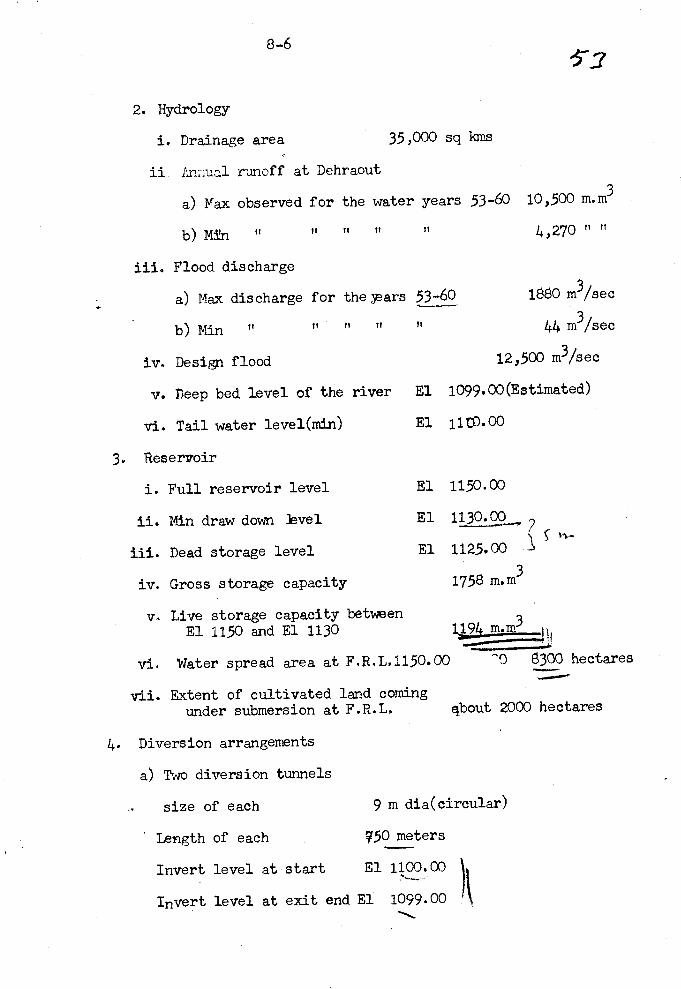
8 -6
6-3
2. Hydrology
i. Drainage area 35,000 sq kms
ii. Annual runoff at Dehraout
a) Max observed for the water years 53-60 10,500 m.m3
b) Min n n n rr rr 4,270 n
iii. Flood discharge
a) Max discharge for the ears 53 -60 1880 m3 /sec
b) Min "n n If tr 44 m3/sec
iv. Design flood 12,500 m3 /sec
v. Deep bed level of the river El 1099.00(Estimated)
vi. Tail water level(min) El 1101.00
3. Reservoir
i. Full reservoir level El 1150.00
ii. Min draw down level El 1130.00
iii. Dead storage level El 1125.00
iv. Gross storage capacity 1758 m.m3
v., Live storage capacity betweenEl 1150 and El 1130 1194 mmrP
vi. Water spread area at F.R.L.1150.00 8300 hectares:e...-
vii. Extent of cultivated land comingunder submersion at F.R.L, elbout 2000 hectares
4. Diversion arrangements
a) Two diversion tunnels
size of each
Length of each
9 m dia(circular)
750 meters
Invert level at start El 1100.00
Invert level at exit end El 1099.00 )\
r..
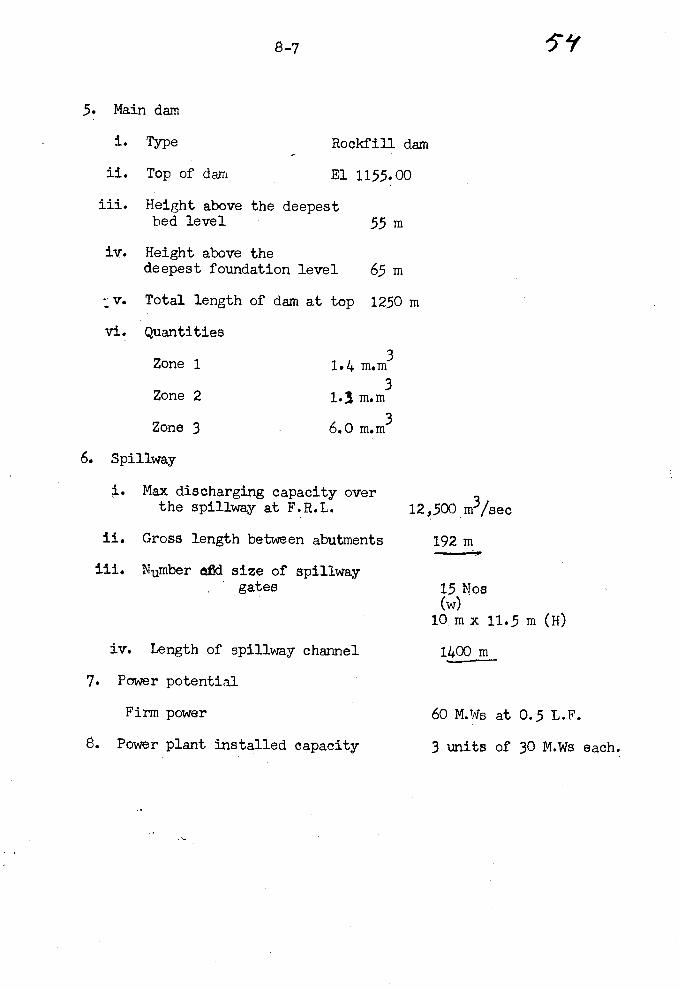
8-7
Main dam
i. Type
ii. Top of dam
Rookfill dam
El 1155.00
iii. Height above the deepestbed level 55 m
iv. Height above thedeepest foundation level 65 m
!v. Total length of dam at top 1250 m
vi. Quantities
Zone 1 1.4 m.m3
Zone 2 1.3 m.m3
Zone 3 6.0 m.m3
6. Spillway
i. Max discharging capacity overthe spillway at F.R.L. 12,500 m3 sec
ii. Gross length between abutments 192 m
iii. Number ad size of spillwaygates 15 Nos
(w)
10mx11.5m(H)
1400 miv. Length of spillway channel
7. Power potential
Firm power
8. Power plant installed capacity
60 M.Ws at 0.5 L.F.
3 units of 30 M.Ws each.
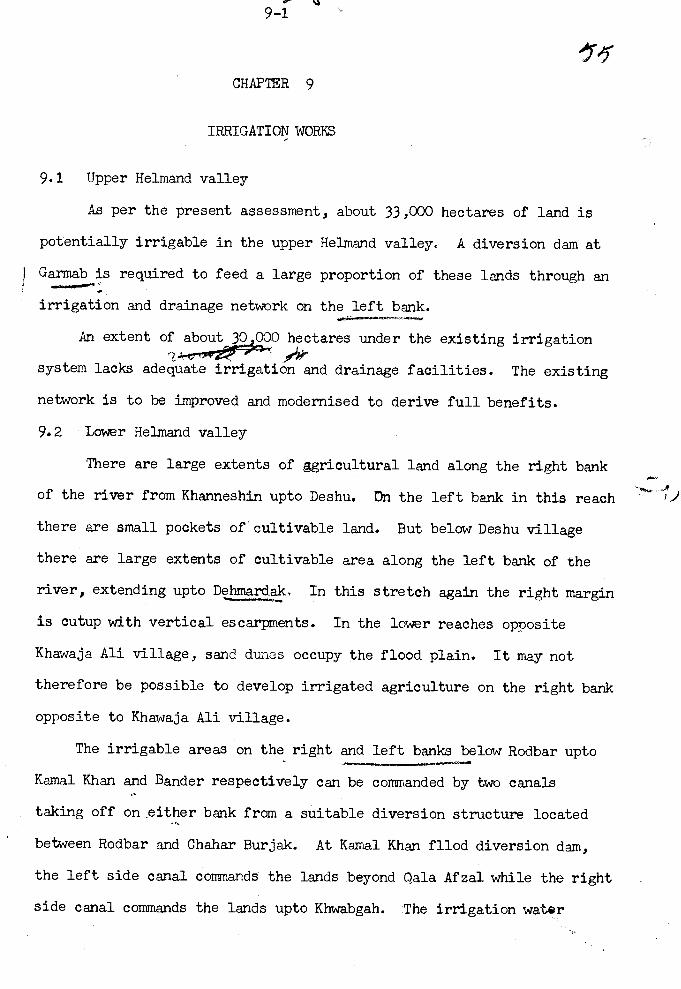
9 -1
CHAPTER 9
IRRIGATION WORKS
9.1 Upper Helmand valley
As per the present assessment, about 33,000 hectares of land is
potentially irrigable in the upper Helmand valley. A diversion dam at
Garmab is required to feed a large proportion of these lands through an
irrigation and drainage network on the left bank.
An extent of about 30 000 hectares under the existing irrigation
system lacks adequate irrigation and drainage facilities. The existing
network is to be improved and modernised to derive full benefits.
9.2 Lower Helmand valley
There are large extents of ggricultural land along the right bank
of the river from Khanneshin upto Deshu. On the left bank in this reach
there are small pockets of cultivable land. But below Deshu village
there are large extents of cultivable area along the left bank of the
river, extending upto Dew, In this stretch again the right margin
is cutup with vertical escarpments. In the lower reaches opposite
Khawaja Ali village, sand dunes occupy the flood plain. It may not
therefore be possible to develop irrigated agriculture on the right bank
opposite to Khawaja Ali village.
The irrigable areas on the right and left banks below Rodbar upto
Kamal Khan and Bander respectively can be commanded by two canals
taking off on either bank from a suitable diversion structure located
between Rodbar and Chahar Burjak. At Kamal Khan flood diversion dam,
the left side canal commands the lands beyond Qala Afzal while the right
side canal commands the lands upto Khwabgah. The irrigation water
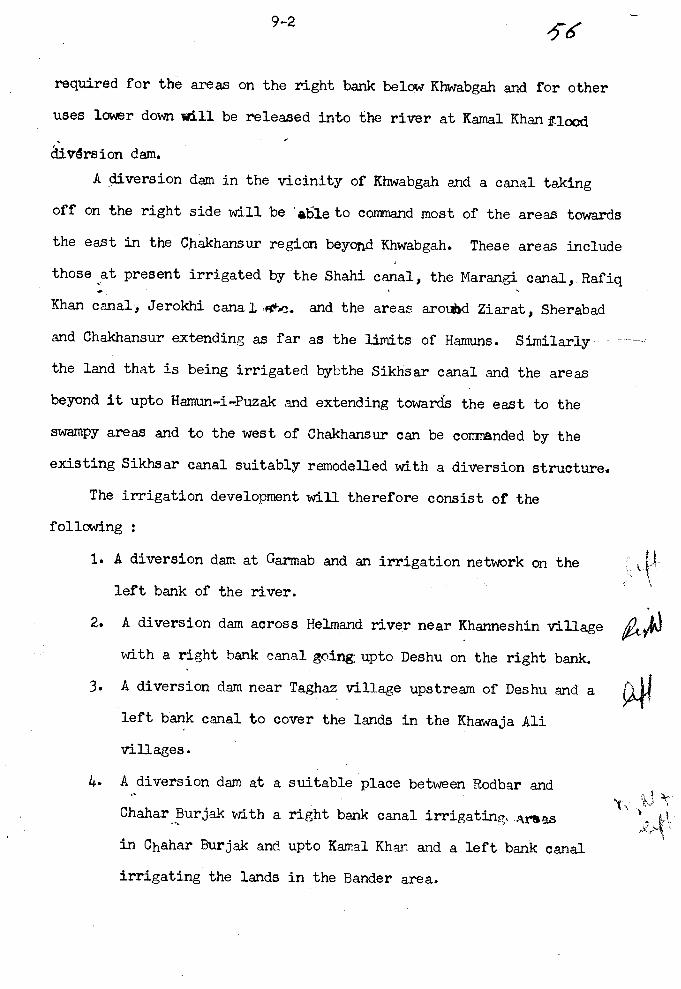
9 -2
required for the areas on the right bank below Khwabgah and for other
uses lower down will be released into the river at Kamal Khan flood
diversion dam.
A diversion dam in the vicinity of Khwabgah and a canal taking
off on the right side will be able to command most of the areas towards
the east in the Chakhansur region beyond Khwabgah. These areas include
those at present irrigated by the Shahi canal, the Marangi canal, Rafiq
Khan canal, Jerokhi canal, ,00-.c. and the areas around Ziarat, Sherabad
and Chakhansur extending as far as the limits of Hamuns. Similarly
the land that is being irrigated bybthe Sikhsar canal and the areas
beyond it upto Hamun -i Puzak and extending towards the east to the
swampy areas and to the west of Chakhansur can be commanded by the
existing Sikhsar canal suitably remodelled with a diversion structure.
The irrigation development will therefore consist of the
following :
1. A diversion dam at Garmab and an irrigation network on the
left bank of the river.
2. A diversion dam across Helmand river near Khanneshin village i
with a right bank canal goingupto Deshu on the right bank.
3. A diversion dam near Taghaz village upstream of Deshu and a4./1
left bank canal to cover the lands in the Khawaja Ali
villages.
4. A diversion dam at a suitable place between Rodbar and
Chahar Burjak with a right bank canal irrigating, .aras
in Chahar Burjak and upto Kamal Khan and a left bank canal
irrigating the lands in the Bander area.
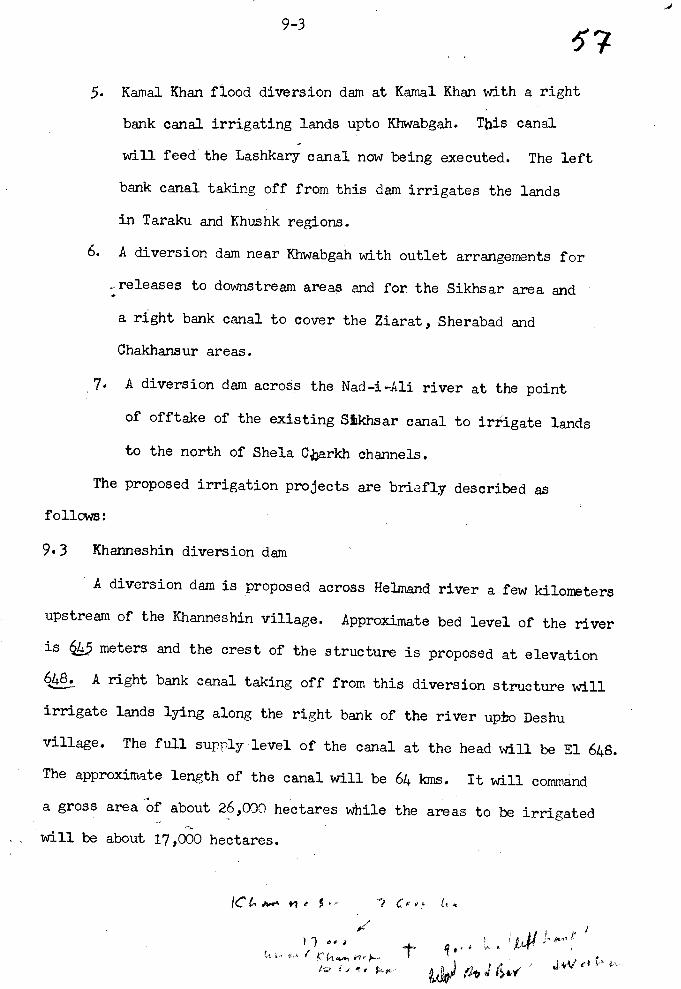
9 -3
5. Kamal Khan flood diversion dam at Kamal Khan with a right
bank canal irrigating lands upto Khwabgah. This canal
will feed the Lashkary canal now being executed. The left
bank canal taking off from this dam irrigates the lands
in Taraku and Khushk regions.
6. A diversion dam near Khwabgah with outlet arrangements for
releases to downstream areas and for the Sikhsar area and
a right bank canal to cover the Ziarat, Sherabad and
Chakhansur areas.
7. A diversion dam across the Nad -i -Ali river at the point
of offtake of the existing Sikhsar canal to irrigate lands
to the north of Shela C,harkh channels.
The proposed irrigation projects are briefly described as
follows:
9.3 Khanneshin diversion dam
A diversion dam is proposed across Helmand river a few kilometers
upstream of the Khanneshin village. Approximate bed level of the river
is lE2.t meters and the crest of the structure is proposed at elevation
648. A right bank canal taking off from this diversion structure will
irrigate lands lying along the right bank of the river upbo Deshu
village. The full supply level of the canal at the head will be El 648.
The approximate length of the canal will be 64 kms. It will command
a gross area of about 26,000 hectares while the areas to be irrigated
will be about 17,000 hectares.
IC t, .r+ M
? oo,G1 a... r: e
. ` )-41y{f tl ,..
i Ì}#/
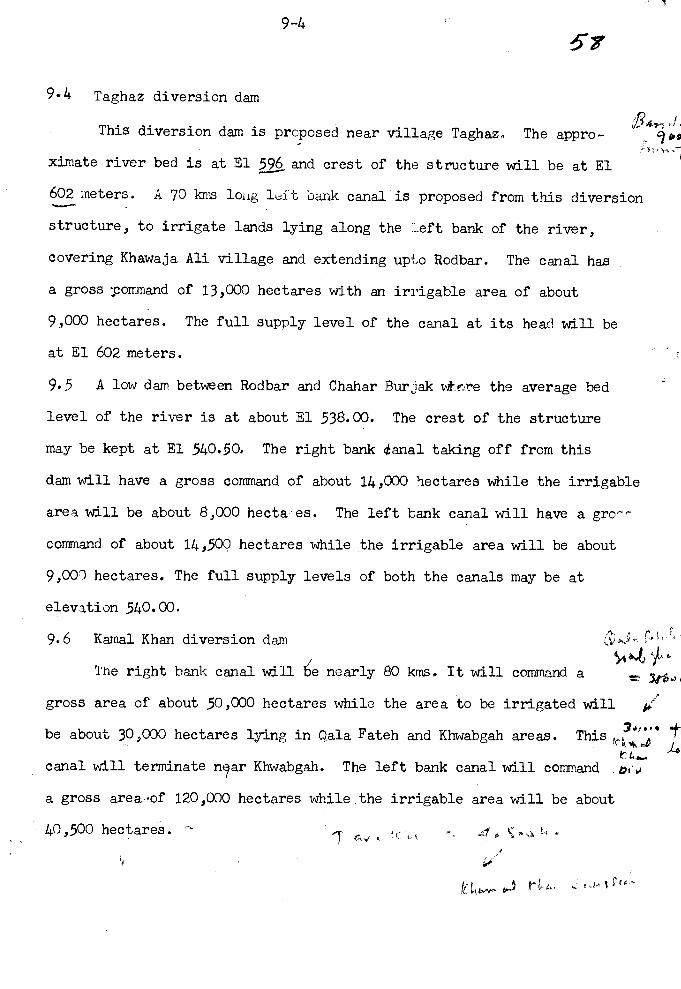
9 -4
57
9,4 Taghaz diversion dam
This diversion dam is proposed near village Taghaz. The appro- y 9
ximate river bed is at E1 596 and crest of the structure will be at El
602 meters. A 70 kms 1eí t bank canal is proposed from this diversion
structure, to irrigate lands lying along the left bank of the river,
covering Khawaja Ali village and extending upto Rodbar. The canal has
a gross ;command of 13,000 hectares with an irrigable area of about
9,000 hectares. The full supply level of the canal at its head will be
at El 602 meters.
9.5 A low dam between Rodbar and Chahar Burjak wt,nrre the average bed
level of the river is at about El 538.00. The crest of the structure
may be kept at El 540.50. The right bank ¡anal taking off from this
dam will have a gross command of about 14,000 hectares while the irrigable
area will be about 8,000 hecta es. The left bank canal will have a grc-
command of about 14,500 hectares while the irrigable area will be about
9,00') hectares. The full supply levels of both the canals may be at
elevation 540.00.
9.6 Kamal Khan diversion damk
The right bank canal will be nearly 80 kms. It will command a 1ft.,
gross area of about 50,000 hectares while the area to be irrigated will
be about 30,000 hectares lying in Qala Fatah and Khwabgah areas. This
a,.,
canal will terminate n'ar Khwabgah. The left bank canal will command b,r
a gross area -of 120,000 hectares while the irrigable area will be about
40,500 hectares.
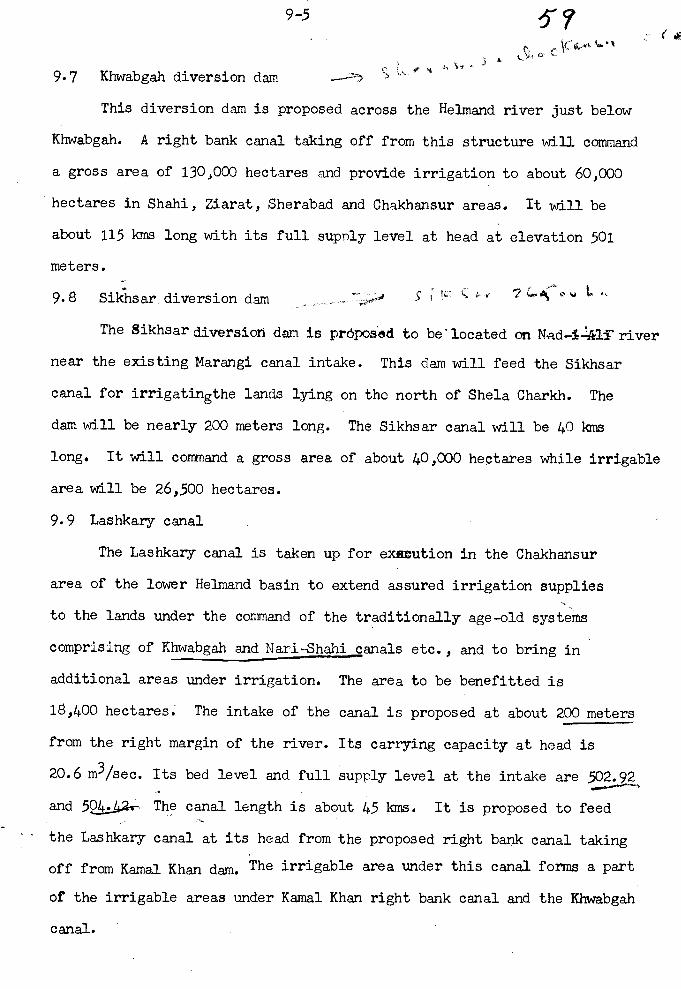
9 -5
9.7 Khwabgah diversion dam
This diversion dam is proposed across the Helmand river just below
Khwabgah. A right bank canal taking off from this structure will command
a gross area of 130,000 hectares and provide irrigation to about 60,000
hectares in Shahi, Ziarat, Sherabad and Chakhansur areas. It will be
about 115 kms long with its full supnly level at head at elevation 501
meters.
9.8 Sikhsar _ diversion dam S
The Sikhsar diversion dam is proposed to be'located on Mad--1411" river
near the existing Marangi canal intake. This dam will feed the Sikhsar
canal for irrigatingthe lands lying on the north of Shela Charkh. The
dam will be nearly 200 meters long. The Sikhsar canal will be 40 kms
long. It will command a gross area of about 40,000 hectares while irrigable
area will be 26,500 hectares.
9.9 Lashkary canal.
The Lashkary canal is taken up for execution in the Chakhansur
area of the lower Helmand basin to extend assured irrigation supplies
to the lands under the command of the traditionally age -old systems
comprising of Khwabgah and Nari - Shahi canals etc., and to bring in
additional areas under irrigation. The area to be benefitted is
18,400 hectares. The intake of the canal is proposed at about 200 meters
from the right margin of the river. Its carrying capacity at head is
20.6 m3/sec. Its bed level and full supply level at the intake are 502.92
and 504 The canal length is about 45 kms. It is proposed to feed
the Lashkary canal at its head from the proposed right bank canal taking
off from Kamal Khan dam. The irrigable area under this canal forms a part
of the irrigable areas under Kamal Khan right bank canal and the Khwabgah
canal.
1u -1
CHAPTER 10
COMMAND AREA DEVELOPMENT
CO
Creation of irrigation potential is not an end by itself. It is
only a means to achieve the goals of planned development of agriculture.
The former involves mostly works of engineering, But the agricultural
development requires multi -disciplinary efforts. Since the development
plan extends over an extensive potential land area, it is necessary
that adequate and timely attention is paid to the latter.
The following are some of the important aspects that require
attention :
i. It is understood that a limited number of families in the area
control most of the presently cultivated land, owning the land, water
rights, villages as well as most of the live -stock. The farming is carried
on largely by farm labour on direct employment or in return for a share of
the crop. Large scale development of irrigated agriculture, however,
needs settlement of increased number of agriculturists. Consolidation
of holdings, thus acquires a special relevance. Such consolidation includes
earmarking of areas required for roads, channels, drains, etc., and
redistribution of remaining area among the holders of land in such a way as
to make individual holdings more compact.
ii. Irrigation practices for different crops, particularly high
yielding varieties vary according to the habit of the crop, climatic
conditions and the nature, texture and depth of the soil. These factors
vary from place to place. Therefore, there is need for agricultural re-
search programme to develop suitable cropping patterns and manurial and
10 -2 62
agricultural practices. Other factors which call for attention are the
consumptive use of water for crops, water losses, the movement of water
and salts in the soil, control óf weeds, methods of irrigation and drainage
and selection of crops for saline, alkaline and water logged soils. It
would therefore be necessary to organize agricultural research and
demonstration farms in the command area.
iii. Efficient irrigated farming is not possible without adequate
supply of inputs like better seeds, fertilisers, pesticides etc.
Adequate arrangements for introducing seeds of new strains, fertilizers,
pesticides and insecticides and their storage and marketing are necessary
and therefore to be provided.
iv. Irrigated agriculture on such extensive areas has to be
necessarily market oriented. It creates large supplies for export and
sale. Roads within the command area, inter provincial highways, marketing
centres, ware-housing and storages at the marketing centres ate to be
constructed.
v. Live-stock raising is yet another aspect that needs to be
given serious thought. A few farmers pursue this activity along the
foreshores of the Hamuns. There is still extensive land potentially
suited for production of fie provided dependable water supply is,a.
ensured. When the entire area proposed under irrigation develops, possible
conjunctive use of ground water and surface water will help in the
raising of sheep and cattle and the development of sheep and cattle
industry. Coverage of the land with forage will also prevent soil erosion.
The cost of land levelling /shaping constitutes one of the major
items in the total cost of the area development in a project of this

10-3
magnitude. Levelling operations need implements and machinery.
They need technical guidance. This item of work which needs
engineering skills will have to be therefore executed along with
other engineering works. Suitable provision for the same is made
in the project cost.
Command area development is a very important task. It
requires a high degree of organizational and administrative co-
ordination between different disciplines and institutions. Broadly
a programme of area development needs the assistance of various disciplines,
irrigation, power, agriculture, animal husbandry, co- operation and
community development, various institutions such as ware - housing co-
operatives, government and or private banking corporations etc.
It even makes demands on communications, health and education services.
In effect the development of the command area calls for all the services
that are needed to build a new social and economic order. It may
therefore be necessary to have a special administrative agency for the
co- ordinated and expeditious development. Such an agency should exist
for the period of development.
,7CHAPTER 11
POWER POTENTIAL
The country's economic progress is not limited to the development
of agricultural sector only. Industrialisation is a must for improving
the living standards of the people and for making the country self -
reliant. Agricultural development opens up new horizons for setting'
up a large number of agro based and animal bye- product industries. The
region abounds in other untapped natural resources. All these need
electric energy. In the provinces covering the Helmand valley,the
total installed power (diesel and hydro) is onlyt 9.5 M.Ws which is
just an insignificant fraction of even 'the dôestic needs. A hydio° power
station with two units of 16.5 M.Wb each is being executed at the toe
of the Kajakai dam and is to be 'acmpleted a d eonuiasioned in the near
future.
With a shift in priorities for rapid industrial growth,the power
station at Kajakai with an installed capacity of 33 M .W,rwill not be
able to meet the rapidly growing power demand in the valley and other
important places like Kandahar, Herat, Kabul etc., where there are a
number of plans for industrial development in the next few years.
Kajakai is the only place where the power generation can be stepped
up with minimum effort, investment and time, as the available storage
is being increased by installing spillway crest gates and where water
conductor system,intake etc., were already completed at the time of
construction of the dam.
e
11 -2
Power studies show that firm power of 60 M.Ws at 100% load factor
(120 M.Ws at 0.5%L.F) could be generated with`the irrigation releases
in most of the months and by releasing additional power draft in the
two or three non -irrigation months of December, January and February..
The annual energy that will be available at Kajakai is assessed
to be 600 million KwHs. This power is to be transmitted to Kandahar,
Herat, Kabul and other load centres thro transmission lines of suitable
capacity. The transmission lines connecting Kajakai to Kandahar and to
Lashkargah are already under erection.
In the initial stages of development the power generated at Kajakai
will be transmitted for utilisation in the main power consuming centres
like Kandahar, Herat, Kabul etc., In the ultimate stage, however, when
the power projects on Harirud and Farahrud and those in the north are
completed, all the generating stations will be inter -connected forming
a national grid. In the context of formation of such a national grid,
the hydro pr plant at Kajakai and another at the proposed upper
Kajakai (Olumbagh) dam which have a commanding geographical disposition,
are considered very important.
As a first step towards promoting the industrial development of
the region, it is proposed to increase the installed capacity at Kajakai
dam by 116.5 M.Ws and lay the transmission lines extending to Herat,
Kabul, etc.,
The Kajakai reservoir was constructed to serve more than one
function, Led irrigation, power and possibly flood moderation. It
was also recognised at the same time that there will be a clash of
interests in trying to optimise any one particular use in the ultimate
stage of development. With the construction of the upper Kajakai dam
11 -3 65and one or two more each on Arghandab river and Musa Qala river,such
a situation is expected to be remedied to a large extent by the integrated
operation of the reservoirs. The upper Kajakai reservoir being located
only about 75 kms upstream and with the yields from the intermediate... _catchment being small, can be operated to intercept and regulate the
flows for maximising the prime power output.
The power releases from this dam can be with-held and re- regulated
at Kajakai dam primarily to meet the irrigation demands which could
be used for power generation. Hydro power station at upper Kajakai
( Olumbagh) dam has thus an important role to play in the power systemc' l
of the region and irrigation development in the valley.
A typical reservoir operation table(Tablell -1) for the water year?
1954 -55 which corresponds to a 75%dependability indicates that 7014.Ws xof firm power at 50% load factor can be generated. This station could be
used for peaking the power requirements in the system. Even in a year pf
90% dependability, nearly 60 M.Ws of firm power at 50% L.F. can be had,
fi
as it is mainly dependent on the flows in the eight non -flood months
and the live storage capacity of the reservoir. It is therefore proposed
to construct a hydro -power station at the proposed upper Kajakai(0lumba-
dam with an installed capacity of 90 M.Ws. It s anticipated that the4. 46.
annual energy generated at this staion would be 250 million KwHs in a
year of 90% dependability.
Detailed integrated reservoir operation studies will have to
be made to lay down the operation rule for maximising the combined
benefits of irrigation, power and flood control.
A transmission line will be laid from Olumbagh to Kajakai inter-
connecting the system laid ''for the transmission of l ajákai power.
11 -4
66
With the construction of the upper Kajakai (Olumbagh)dam, the
power benefits otherwise anticipated to accrue at Kajakai will
considerably improve.
Apart from the sizable power that can be generated at Kajakai
dam and upper Kajakai dam and fed into the regional grid, it will
be possible to install a low head hydro power plant at Kamal Khan flood
diversion dam where power upto 8 M.Ws could be generated from the
irrigation and other releases. The power so generated will be of
immediate benefit to the Chakhansur area.
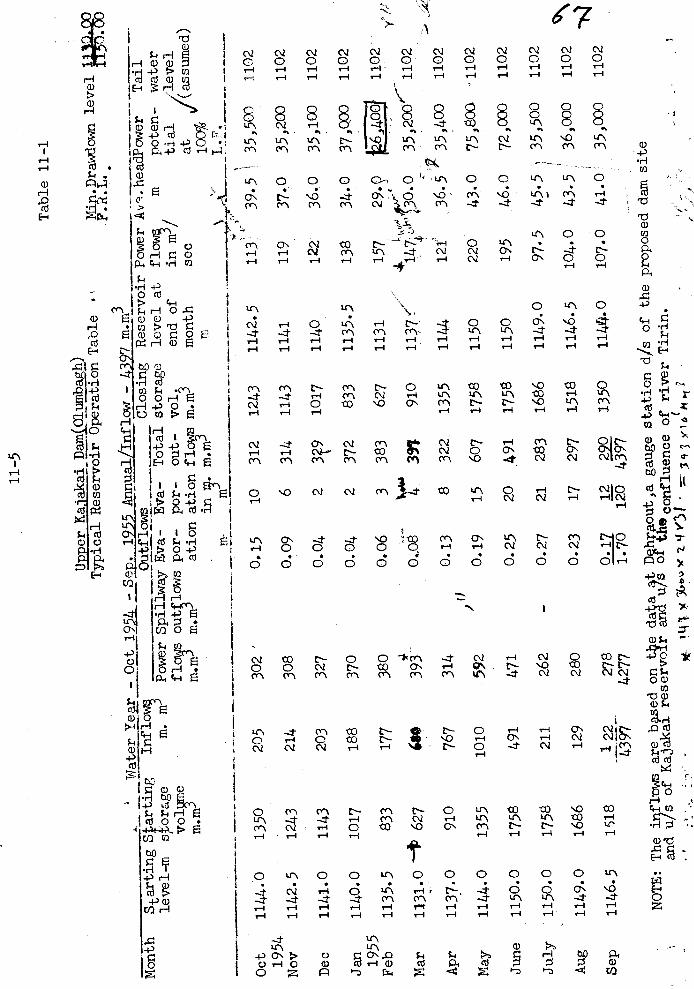
Water Year - Oct
Power
fl
Month
Starting Starting
Infi
level -m
s orage
m. m
vols
em
.m
Upp
er K
ajak
ai D
amQ
Olu
mba
gh)
Typical Reservoir Operation
1954 - Sep 1955 Annual/Inflow - 43
Outflows
Closing
Spillway Eva- Eva- Total storage
outflows por-
por-
out-
vol.
m.m3 m.m
ation ation flows
m.1713
Oct 1954
Nov
Dec
Jan
1144.0
1142.5
1141.0
1140.0
1350
1243
1143
1017
205
214
203
188
302
308
327
370
1955
Feb
1135.5
833
177
380 4
Mar
1131.0`3 627
4$0
393
Apr
May
1137.0
1144.0
910
1355
767
1010
314
592
fl )
June
1150.0
1758
491
471
July
1150.0
1758
211
262
-
Aug
1149.0
1686
129
280
Sep
1146.5
1518
122
278
4397
4277
m. m
m
0,15
10
0.09
6
0.04
2
0.04
2
0.06
3
0.,08
40.13
8
0.19
15
0.25
20
0.27
21
0.23
17
0.17
12
1.70
120
Table
.
97 m.m3
Reservoir
level at
end of
Table 11 -1
Min.Drawdown level 1132,0 -
F.R.L.
. t00
Power Av.headPower
Tail
flow
mpoten- water
inm/
month
sec
m
312
1243
1142.5
314
1143
1141
3 ?9
1017
1140
372
833
1135.5
383
627
1131
397
910
1137/
322
1355
1144
607
1758
1150
491
1758
1150
283
1686
1149.0
297
1518
1146.5
220
1350
1144.0
4397
NOTE: The inflows are based on
tbe data
t D hraout,a gauge
and u/s of Kajakai
reservoir
and
u/s
ofthe confluence
* 14'1 ,1
36.ou v 7'4'31
3 i 3
x
e,¡
i:.r
s
113'
b
39.5 '
119
37.0
122
36.0
138
34.0
157
29.0
tial
'leve
lat
(assumed)
100%
.
35,500
1102
35,200
1102
35,100
1102
37,Ó00
1102
157
1102
1102
I.4
714a
"ó. 0
35,2
00/-
'
12f
36.5
35,400
220
43.0
75,8oa
195
46.0
72,000
97.5
45.5
,
35,50o
104.0
43.5 /
36,000
107.0
41.0'
35,000
station d/s of the proposed dam
site
of river Tirin.
)bt4
a?
,
1102
-1102
1102
1102
1102.,l
1102
ry
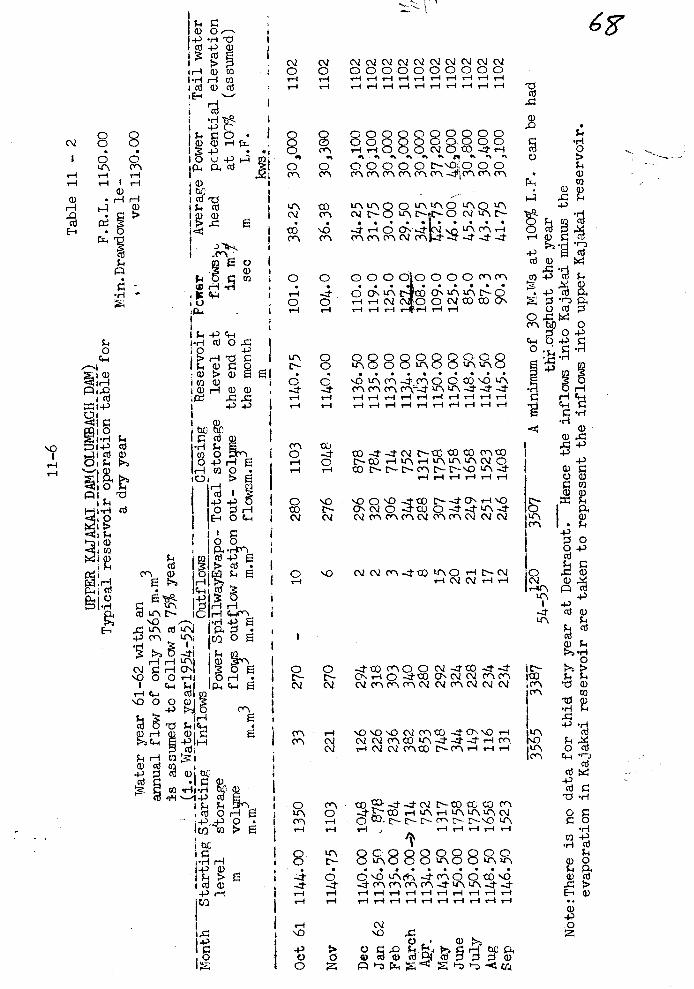
11 -6
UPPER KAJAKAI DAM(OLUMBAGH DAM)
Typical reservoir operation table for
a dry year
Water year 61 -62 with an
annual flow of only 3565
m..m3
is assumed to follow a 75% year
Month
Starting Starting
level
storage
mvolme
m. m
Inflows
m.m3
Outflows
_.._
Spillwa,yEvapo-
outglow ratjlon
m.m
m.m
Reservoir
level at
the end of
the month
Closing
Power
flows
m.m
Total storage
out- vol ne
f lowsm. m
Oct 61
1144.00
1350
33
270
-10
280
1103
1140.75
Nov
1140.75
1103
221
270
6276
1048
1140.00
Dec
1140.00
1048
126
294
2296
878
1136.50
Jan 62
1136.50
, P70
226
318
2320
784
1135.00
Feb
1135.00
784
236
303
3306
714
1133.00
March
1133.00 -> 714
382
340
4344
752
1134.00
AP?'.
1134.00
752
853
280
8288
1317
1143.50
May
1143.50
1317
748
292
15
307
1758
1150.00
June
1150.00
1758
344
324
20
344
1758
1150.00
July
1150.00
1758
149
228
21
249
1658
1148.50
Aug
1148.50
1658
116
234
17
251
1523
1146.50
Sep
1146.50
1523
131
234
12
246
1408
1145.00
Note:There is no
evaporation
Table 11 - 2
F.R.L. 1150.00
Min. Drawdown le-
.t
vel 1130.00
Average Power
Tail water
head
potential elevation
at 10T%
(assumed)
mkws.
k s .
101.0
38.25
303000
104.0
36.38
30,3Q0
1102
110.0
34.25
30,100
119.0
31.75
30,100
125.0
30.00
30,000
l29.50
30,000
i°11-.0
34.75
30,000
109.0
72715
37,200
125.0
45.00
,
461000.
85.0
45.25
30,800
87.3
43.50
30,400
90.3
41.75
30,100
35
3387
1102
1102
1102
1102
1102
1102
1102
1102
1102
1102
1102
54_520
3507
A minimum of 30 M.Ws at 100% L.F. can be had
th .oughout the year
data for thid dry year at Dehraout.
Hence the inflows into Kajakai minus the
in Kajakai reservoir are taken to represent the inflows into upper Kajakai
reservoir.
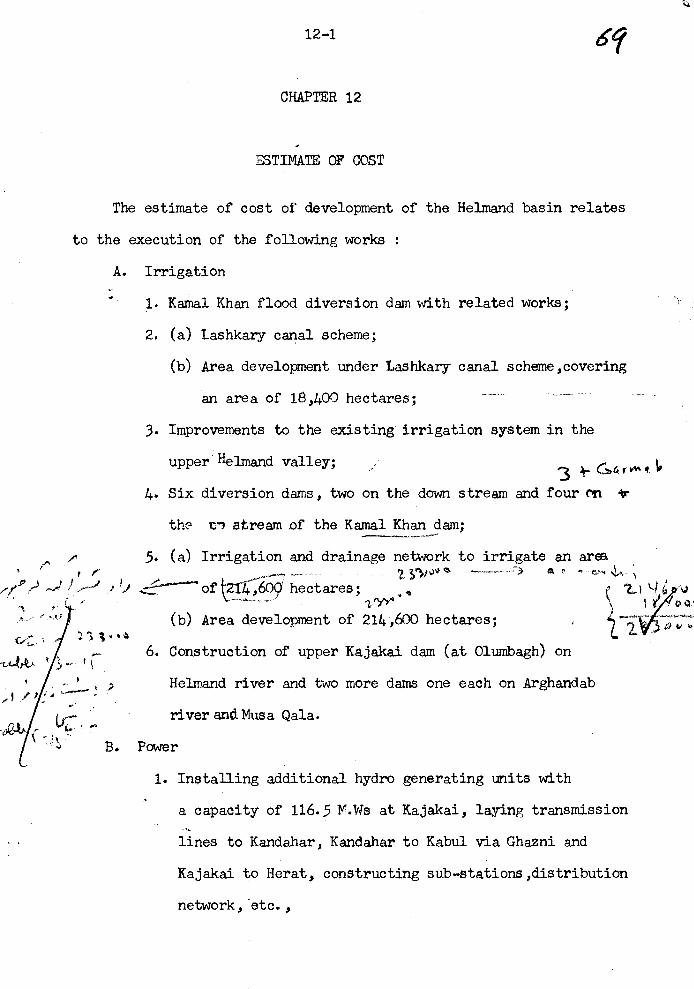
12 -1
CHAPTER 12
ESTIMATE OF COST
The estimate of cost of development of the Helmand basin relates
to the execution of the following works :
A. Irrigation
1. Kamal Khan flood diversion dam with related works;
2. (a) Lashkary canal scheme;
(b) Area development under Lashkary canal scheme,covering
an area of 18,400 hectares;
3. Improvements to the existing irrigation system in the
upper Helmand valley;
4. Six diversion dams, two on the down stream and four on
the to stream of the Kamal Khan dam;
5. (a) Irrigation and drainage network to irrigate an area
a \
(b) Area development of 214,600 hectares;1 ;..a
6. Construction of upper Kajakai dam (at Olumbagh) on
f 4,60ç hectares;
1,
Helmand river and two more dams one each on Arghandab
river and Musa Qala.
B. Power
1. Installing additional hydro generating units with
a capacity of 116.5 M.Ws at Kajakai, laying transmission
lines to Kandahar, Kandahar to Kabul via Ghazni and
Kajakai to Herat, constructing sub- stations,distribution
network, etc.,
12 -2
2. Construction of power house and installation of power
plant consisting of three units of 30 M.Ws each and
transmission lines from upper Kajakai dam to Kajakai
dam.
An abstract of the cost of the above works is given in
Table 12 - 1.
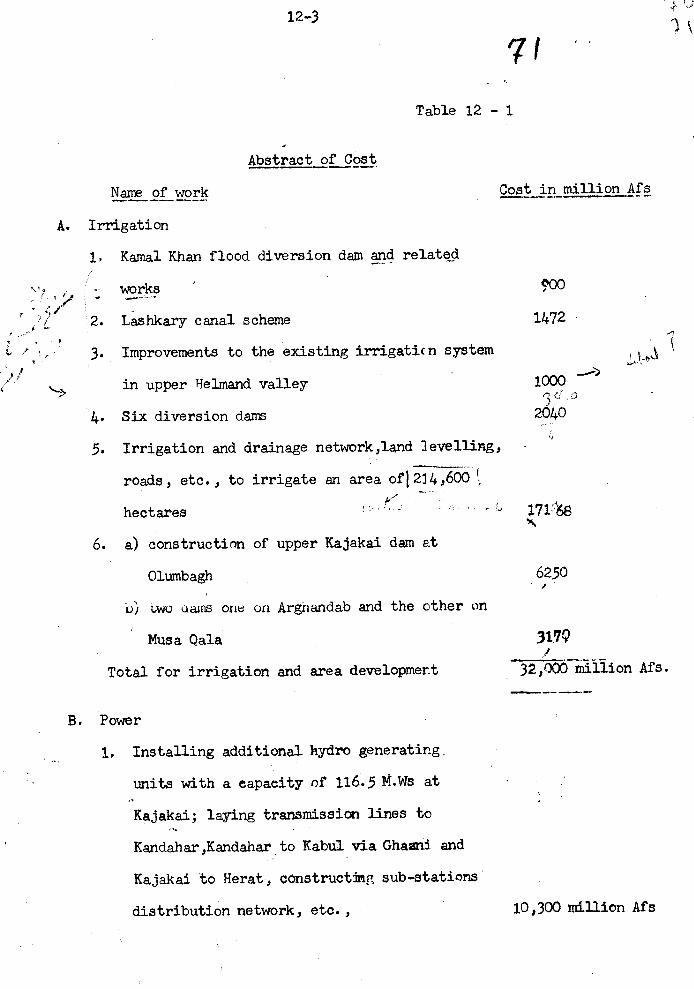
12 -3
Abstract of Cost
Name of work
A. Irrigation
1, Kamal Khan flood diversion dam and related
works
2. Lashkary canal scheme
3. Improvements to the existing irrigation system
in upper Helmand valley
Six diversion dame
5. Irrigation and drainage network,land levelling,
7/Table 12 - 1
roads, etc., to irrigate an area of t 214,600
hectares
6. a) construction of upper Kajakai dam at
Olumbagh
b) imo dams one ori Arghandab and the other on
Musa Gala
Total for irrigation and area development
B. Power
1. Installing additional hydro generating,
units with a capacity of 116.5 }.Ws at
Kajakai; laying transmission lines to
Kandahar,Kandahar to Kabul via Ghaani. and
Kajakai to Herat, constructing sub -stations
distribution network, etc.,
Cost in million Afs
900
1472
1000
)Cí',?
2040
171.'468
62501
.
3179
32,400 million Afs.
10,300 million Afs
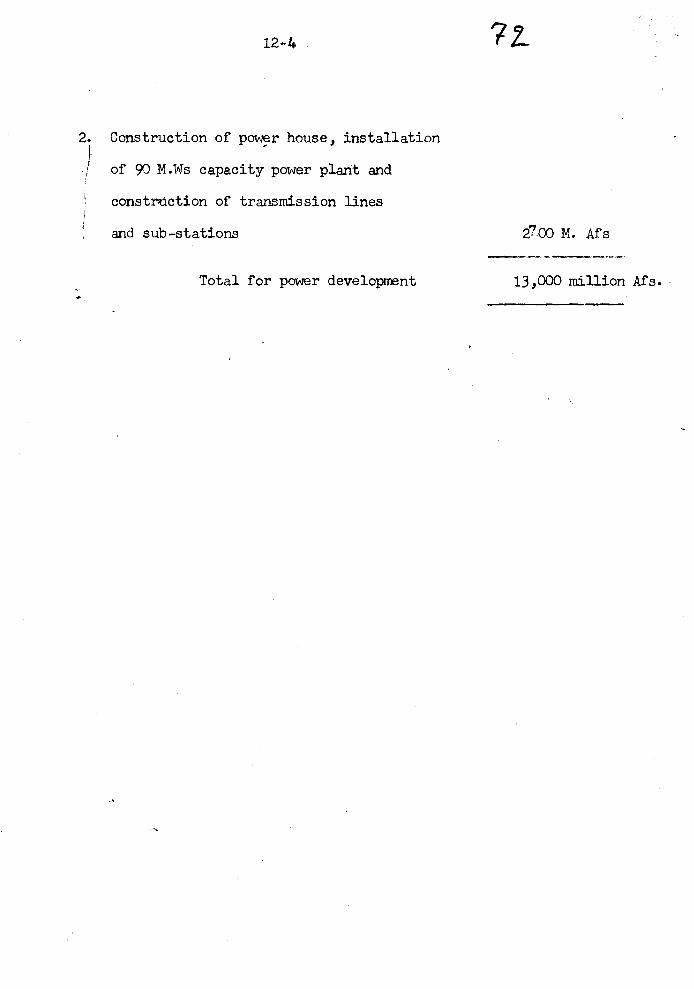
12 -4
2. Construction of power house, installation
of 90 M.Ws capacity power plant and
constriction of transmission lines
and sub- stations
72_
2' 00 M. Afs
Total for power development 13,E million Afs.
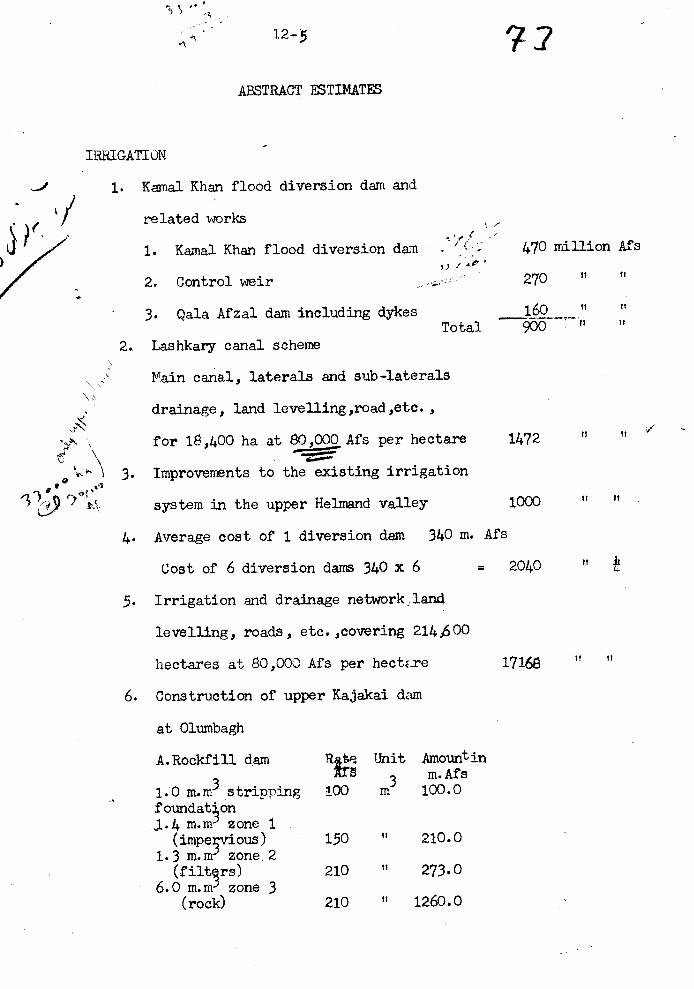
IRBIGATIÜN
12 -5
ABSTRACT ESTIMATES
J 1. Kama1 Khan flood diversion dam and
7.2
related works
1. Kamal Khan flood diversion dan ''` 470 million Afs
2. Control weir 270
3. Gala Afzal dam including dykes 160 " "
Total 900- " "
2. Lashkary canal scheme
Main canal, laterals and sub-laterals
drainage, land levelling ,road ,etc.,
for 18,400 ha at 80,000 Afs per hectare 1472
t1 3. Improvements to the existing irrigation
P, t,.4
system in the upper Helmand valley 1000
4 Average cost of 1 diversion dam 340 m. Afs
Cost of 6 diversion dams 340 x 6 2040
5. Irrigation and drainage network land
levelling, roads, etc. ,covering 2144500
hectares at 80,000 Afs per hectare 17168
6. Construction of upper Kajakai dam
at Olumbagh
A.Rockfill dam Rte Unit Amountinm.Afs
1.0 m. m3 stripping 100 m3 100.0foundat on
.. 4 m. m," zone 1
(impe3rvious) 150 " 210.01.3 m.m zone 2
(filtgrs) 210 " 273.06.0 U6 M) zone 3
(rock) 210 " 1260.0
It
r, It
It
It
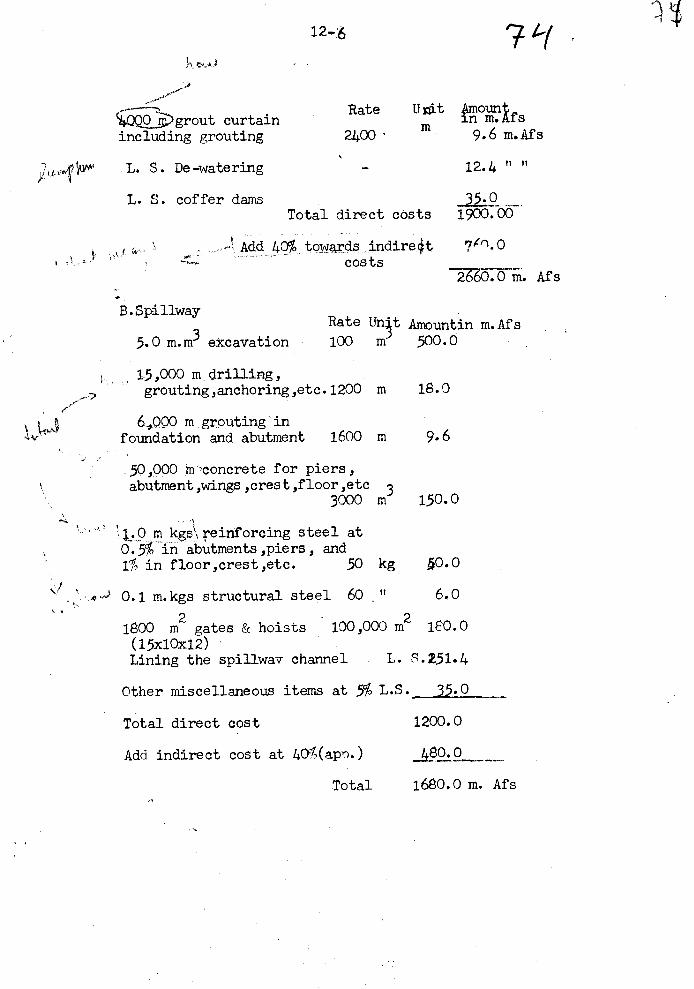
r,,(01S4.1"°
grout curtainincluding grouting
L. S. De watering
L. S. coffer dams
12-6
Rate Unit
2400..
7Amount
Afs
9.6 m.Afs
12.4"
35.0Total direct costs 1900.00
Add 400 towards indirect 7.4r1.0
costs
n
260.0 m. Afs
B.SpillwayRate Un'e t Amountin m.Afs
5.0 m.m3 excavation 100 m 500.0
15,000 m drilling,grouting,anchoring,etc.1200 m 18.0
64000 m grouting ' in
foundation and abutment 1600 m 9.6
50,000 m °concrete for piers,abutment,wings ,crest,floor,etc 3
3000 m 150.0
1.0 in kgs reinforcing steel at0. 5°f in abutments ,piers , and
110 in floor,crest,etc. 50 kg 50.0
0.1 m.kgs structural steel 60 ," 6.0
1800 m2 gates & hoists 100,000 m2 180.0(15x10x12)Lining the spillway channel L. x.251.4
Other miscellaneous items at 5% L.S. 35.0
Total direct cost
Add indirect cost at 401,(apn.)
Total
1200.0
t80.0_.._
1680.0 m. Afs
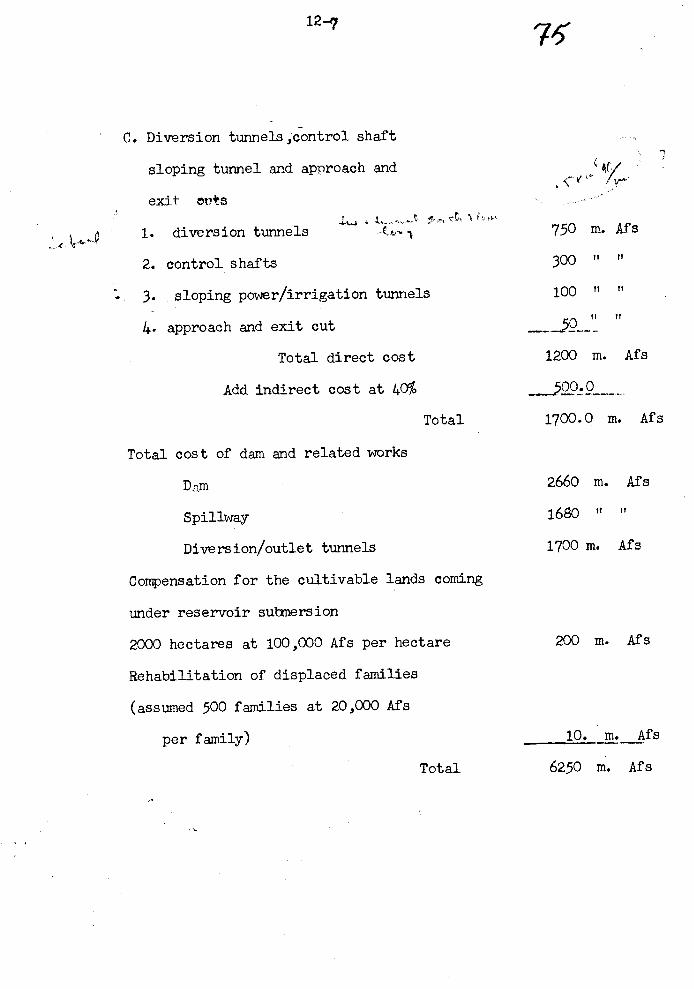
12 -7
C. Diversion tunnels,control shaft
sloping tunnel and approach and
exit ort.s
76"
1. diversion tunnels 750 m Af s
2. control shafts300
3. sloping power /irrigation tunnels 100 " "
4. approach and exit cut
Total direct cost
Add indirect cost at 40%
,t ,r
1200 m. Afs
_._ 500.0 ...
Total 1700.0 m. Afs
Total cost of dam and related works
Drym
Spillway
Diversion /outlet tunnels
Compensation for the cultivable lands coming
under reservoir submersion
2000 hectares at 100,000 Afs per hectare
Rehabilitation of displaced families
(assumed 500 families at 20,000 Afs
per family)
2660 m. Afs
1680 It I,
1700 m. Afs
200 m. Afs
10. m. Afs
Total 6250 m. Afs
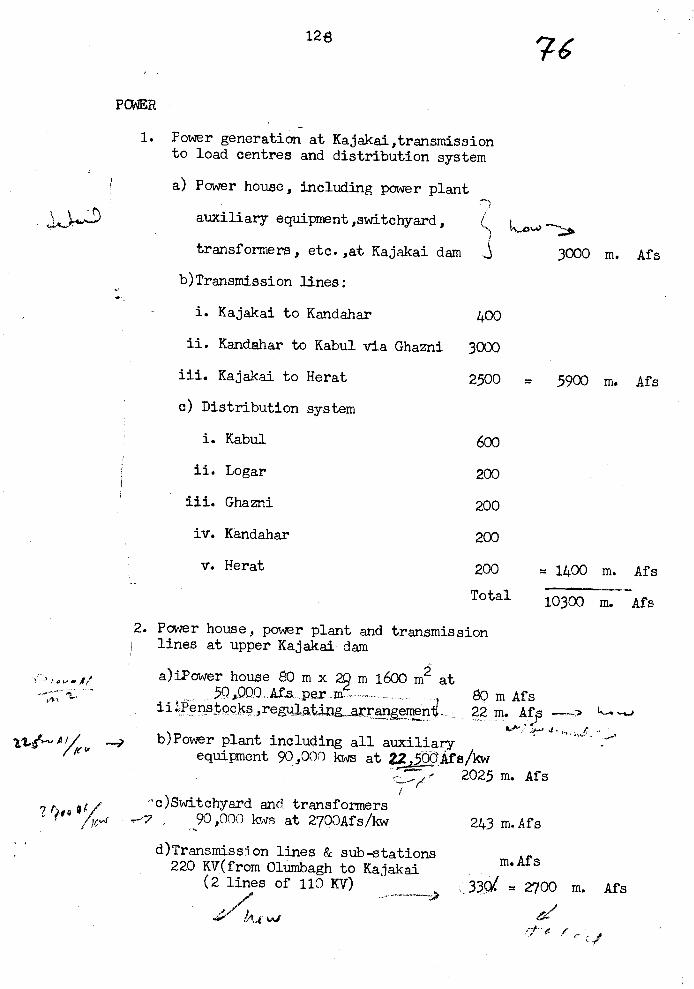
128
PC)WER
7C
1. Power generation at Kajakai,transmissionto load centres and distribution system
a) Power house, including power plant
auxiliary equipment,switchyard,i4,,,o4>
transformers, etc. ,at Kajakai dam
b)Transmission lines:
3000 m. Afs
i. Kajakai to Kandahar 400
ii. Kandahar to Kabul via Ghazni 3000
iii. Kajakai to Herat
c) Distribution system
i. Kabul
2500
600
5900 m. Afs
ii. Logar 200
iii. Ghazni 200
iv. Kandahar 200
v. Herat 200 = 1400 m. Afs
Total 10300 m. Afs
A
2. Power house, power plant and transmissionlines at upper Kajakai dam
a)iPower house 80 m x 22 m 1600 m2 at50,000 _.Afs per m
ii*. Penstocks,regulating rangemen ....
b)Power plant including all auxiliary
80mAfs22 m. Afy -- }
equipment 90,000 kws at 22;Afs /kw2025 m.
-c)Switchyard and transformers90,000 kws at 2700Af s /kw
d)Transmissi.on lines & sub-stations220 KV(from Olumbagh to Kajakai
(2 lines of 110 KV)
Af s
243 m. Af s
m.Afs
3304 = 2700 m. Afs
4/
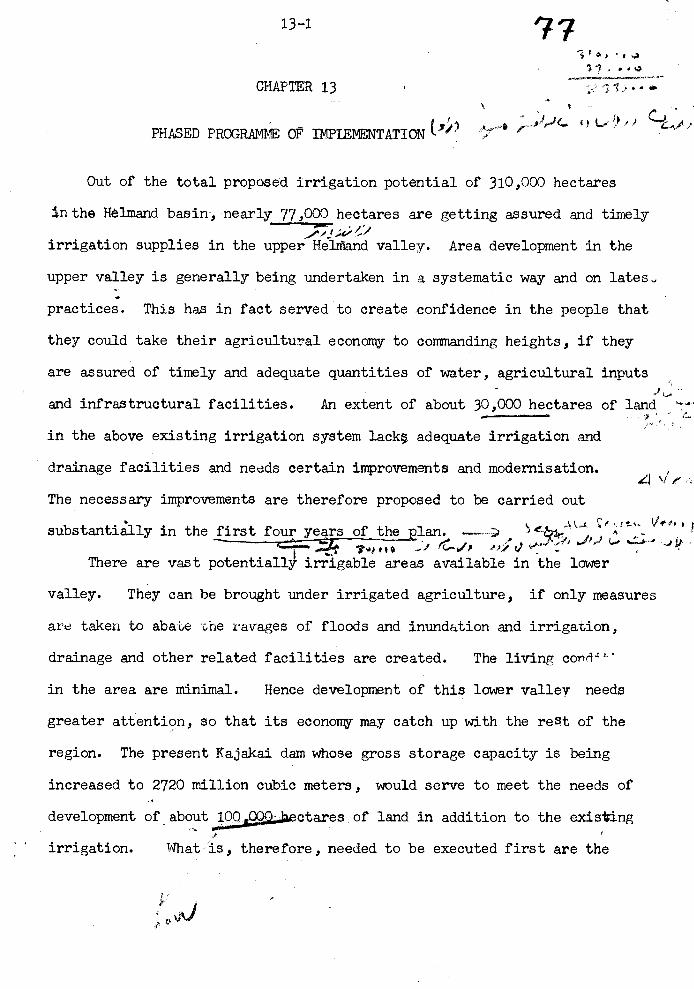
13 -1
CHAPTER 13
'7 7
PHASED PROGRAMME OF IMPLEMENTATION ix
i!Q, r.ai, .i)
Out of the total proposed irrigation potential of 310,000 hectares
in the Helmand basin-, nearly 77,000 hectares are getting assured and timely
irrigation supplies in the upper Hélinand valley. Area development in the
upper valley is generally being undertaken in a systematic way and on lates
practices. This has in fact served to create confidence in the people that
they could take their agricultural economy to commanding heights, if they
are assured of timely and adequate quantities of water, agricultural inputs
and infrastructural facilities. An extent of about 30,000 hectares of land ---
in the above existing irrigation system lacks adequate irrigation and
drainage facilities and needs certain improvements and modernisation.
The necessary improvements are therefore proposed to be carried out
;. ..!e,, Vte isubstantially in the first four years of the lan. -- u --, --)
9 i
-t - 70,1.1$ . /c'c.. r/' ,,, ti +,°" (......:;--- .J jF
There are vast potentially irrigable areas available in the lower
valley. They can be brought under irrigated agriculture, if only measures
are taken to abai.e the ravages of floods and inundation and irrigation,
drainage and other related facilities are created. The living coed 4'
in the area are minimal. Hence development of this lower valley needs
greater attention, so that its economy may catch up with the rest of the
region. The present Kajakai dam whose gross storage capacity is being
increased to 2720 million cubic meters, would serve to meet the needs of
development of about 1OOE,,,Z;,jectares of land in addition to the existing
irrigation. What is, therefore, needed to be executed first are the
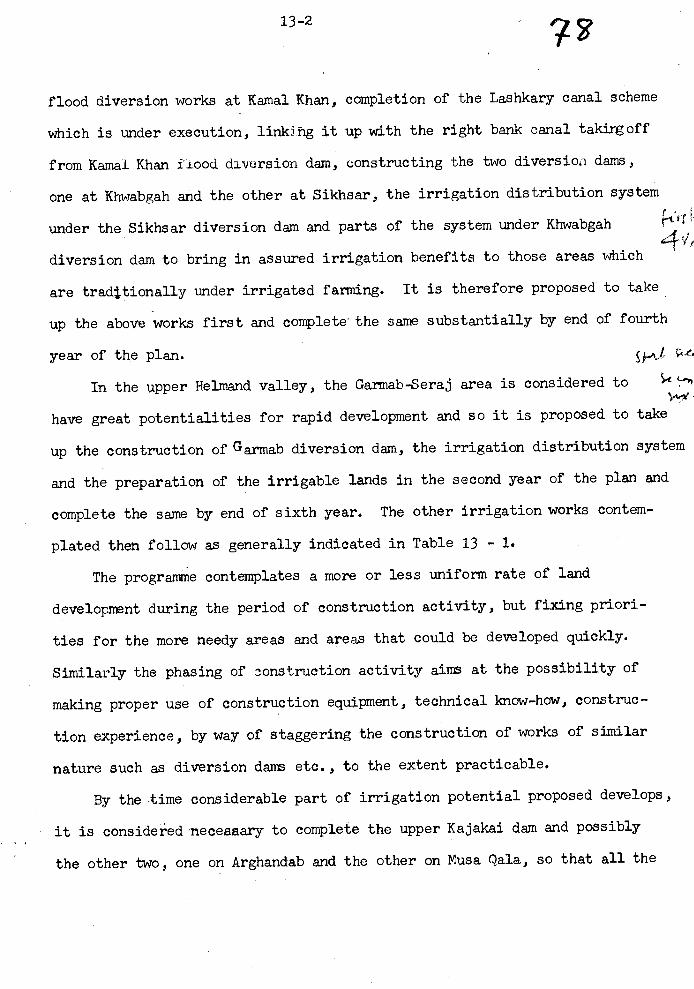
13 -2
flood diversion works at Kamal Khan, completion of the Lashkary canal scheme
which is under execution, linkdñg it up with the right bank canal taking off
from Kemal Khan flood diversion dam, constructing the two diversion dams,
one at Khwabgah and the other at Sikhsar, the irrigation distribution system
under the Sikhsar diversion dam and parts of the system under Khwabgah
diversion dam to bring in assured irrigation benefits to those areas which
are traditionally under irrigated farming. It is therefore proposed to take
up the above works first and complete the same substantially by end of fourth
year of the plan. ,
In the upper Helmand valley, the Garmab -Seraj area is considered to
have great potentialities for rapid development and so it is proposed to take
up the construction of G armab diversion dam, the irrigation distribution system
and the preparation of the irrigable lands in the second year of the plan and
complete the same by end of sixth year. The other irrigation works contem-
plated then follow as generally indicated in Table 13 - 1.
The programme contemplates a more or less uniform rate of land
development during the period of construction activity, but fixing priori-
ties for the more needy areas and areas that could be developed quickly.
Similarly the phasing of construction activity aims at the possibility of
making proper use of construction equipment, technical know -how, construc-
tion experience, by way of staggering the construction of works of similar
nature such as diversion dams etc., to the extent practicable.
By the time considerable part of irrigation potential proposed develops,
it is considered neceaaary to complete the upper Kajakai dam and possibly
the other two, one on Arghandab and the other on Musa tala, so that all the
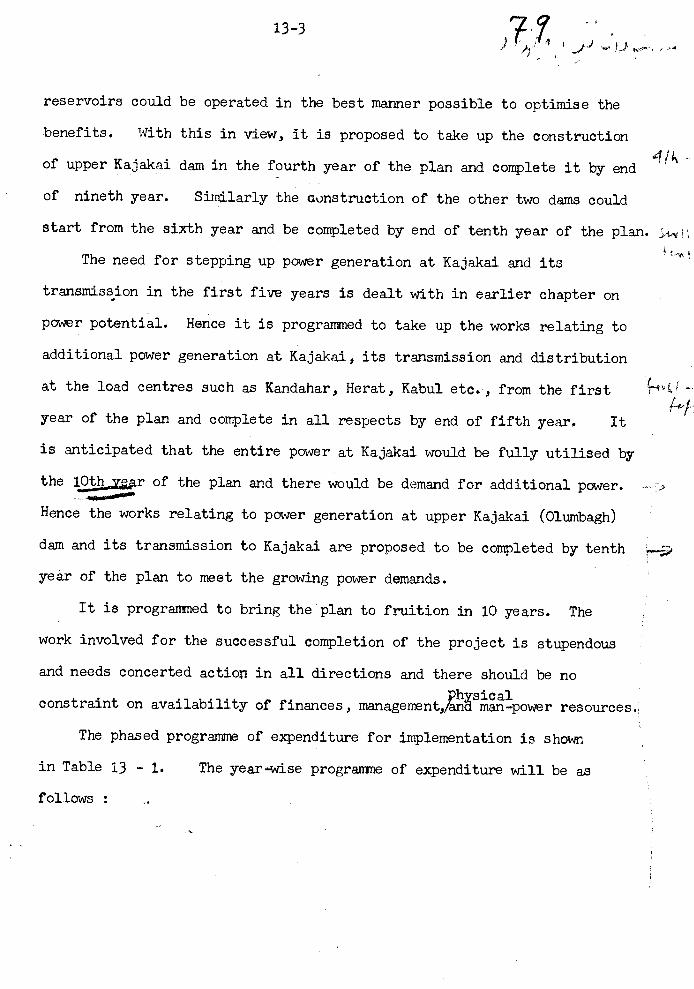
13 -3
reservoirs could be operated in the best manner possible to optimise the
benefits. With this in view, it is proposed to take up the construction
of upper Kajakai dam in the fourth year of the plan and complete it by end
of nineth year. Similarly the construction of the other two dams could
start from the sixth year and be completed by end of tenth year of the plan.?i
The need for stepping up power generation at Kajakai and its
transmission in the first five years is dealt with in earlier chapter on
power potential. Hence it is programmed to take up the works relating to
additional power generation at Kajakai, its transmission and distribution
at the load centres such as Kandahar, Herat, Kabul etc., from the first
year of the plan and complete in all respects by end of fifth year. It
is anticipated that the entire power at Kajakai would be fully utilised by
the 10tr of the plan and there would be demand for additional power.
Hence the works relating to power generation at upper Kajakai (Olumbagh)
dam and its transmission to Kajakai are proposed to be completed by tenth
year of the plan to meet the growing power demands.
It is programmed to bring the plan to fruition in 10 years. The
work involved for the successful completion of the project is stupendous
and needs concerted action in all directions and there should be no
h sicalconstraint on availability of finances, management, /and man-power resources.;
The phased programme of expenditure for implementation is shown
in Table 13 - 1. The year -wise programme of expenditure will be as
follows
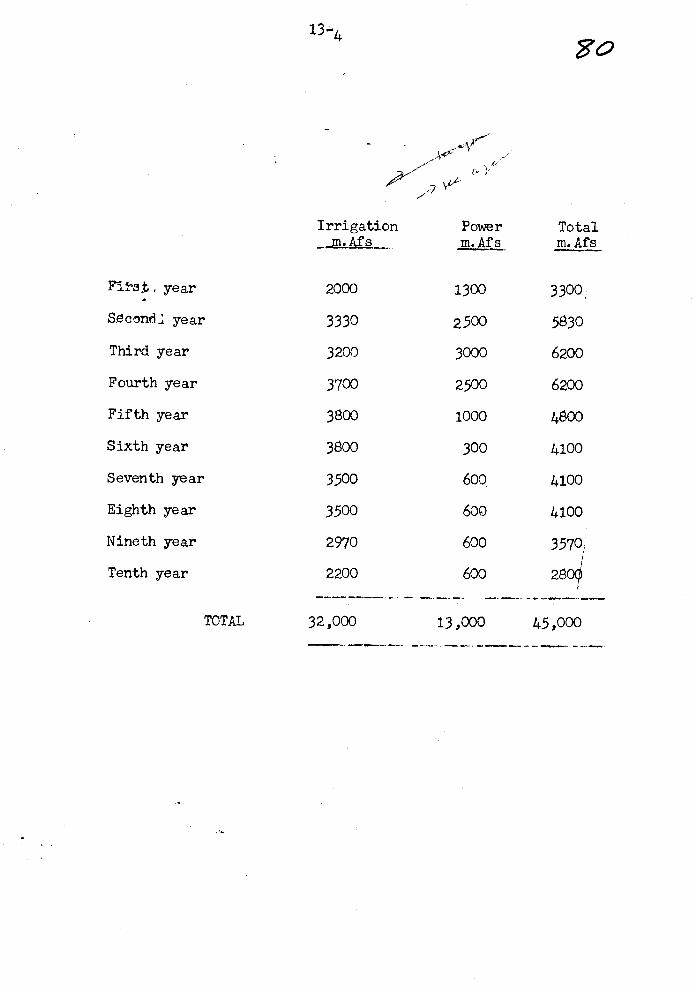
13 -4
Fa
Irrigationm. Af s
Powerm. Af s
Totalm. Afs
F±3, year 2000 1300 3300
Séc nd.; year 3330 2500 5530
Third year 3200 3000 6200
Fourth year 3700 2500 6200
Fifth year 3500 1000 4800
Sixth year 3500 300 4100
Seventh year 3500 600 4100
Eighth year 3500 600 4100
Nineth year 2970 600 3570,
Tenth year 2200 600 280?
TOTAL 32,000 13,000 45,000
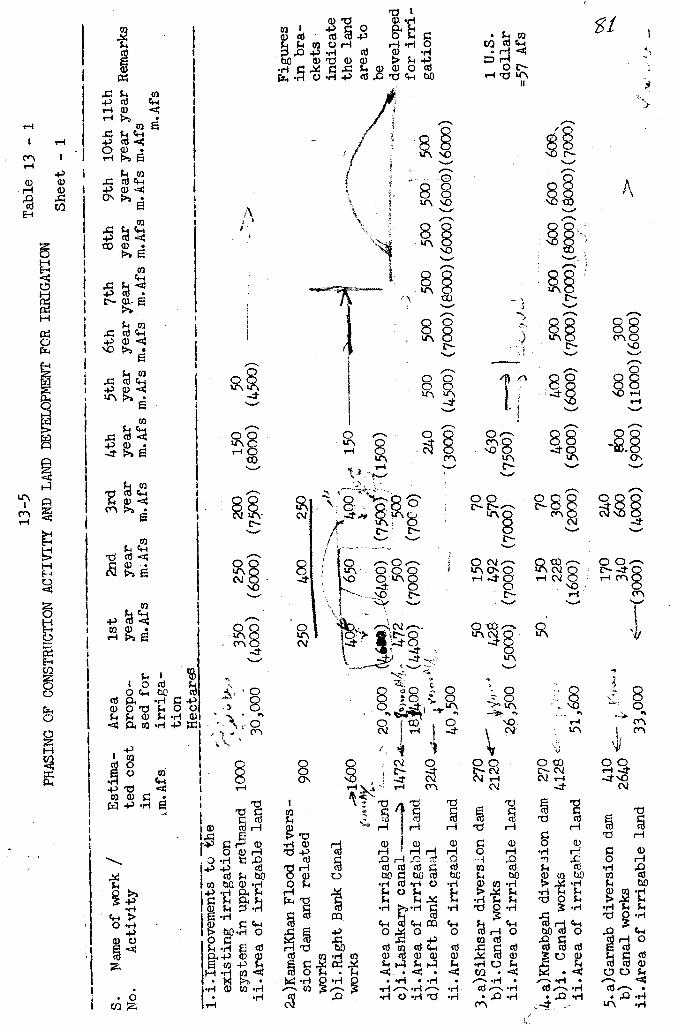
13 -5
PHASING OF CONSTRUCTION ACTIVITY AND LAND DEVELOPMENT FOR IRRIGATION
S.
Name of work f
Estima-
No.
Activity
ted cost
in
m. Afs
1.i.Improvements to the
existing irrigation
system in upper nelmand
1000
.350
250
200
150
50
ii.Area of irrigable land
Table 13 - 1
Sheet - i
Area
1st
2nd
4th
5th
6th
7th
8th
9th
10th 11th
propo-
year
year
year
year
year
year year
year
year year year Remarks
sed for
irriga -
tion
m.Afs
m.Afs
m.Afs
m.Afs m.Afs m.Afs
m.Afs m.Afs m.Afs m.Afs m. Afs
Hectares
2a)KamalKhan Flood divers -
sion dam and related
900
works
b)i.Right Bank Canal
30,0
00(4
000)
(600
0)(7
500)
(800
0)(4
500)
250
409
250
works
.1600
,m-4,
650
'4Q0'i
150
ii.Area of irrigable land
c) i. Lashkary canal
ii. Area of irrigable land
d) i. Left Bank canal
ii. Area of irrigable land
3.a)Sikhsar diversion dam
b) i. Canal works
ii.Area of irrigable land
4.a)Khwabgah diversion dam
b)i. Canal works
ii.Area of irrigable land
5.a)Garmab diversion dam
b) Canal works
ii.Area of irrigable land
'
20,000
1472.4 - .- ÷,.up!
1814400
3240
40,500
6414J_4400)
.4/2
500
(4400)
(7000)
4 _
'
;(7500500
(7000)
270
50
150
2120
a,
`'428
492
570
26,500
(5000)
(70Q0)
(7000)
270
50.
150
70
4128
,,.,
228
300
51,600
(.600)
(20oo)
410
170
240
2640
`-
340
600
33,000
(3000)
(4000)
1500)
240
_(3000)
500
(4500)
630
---
(7500)
500
500
500 500
500
(7000)(8000)(6000)(600Ó)(6000)
400
400
500
500
600
600
60O.
(5000) (6000) (7000)(7000)(8000)(8000){7000)
,ébo
600
300
(90) (11000)(6000)
Figures
in bra -
ckets
indicate
the land
area to
be
developed
for irri-
gation
1 U.S.
dollar
=57 Afs
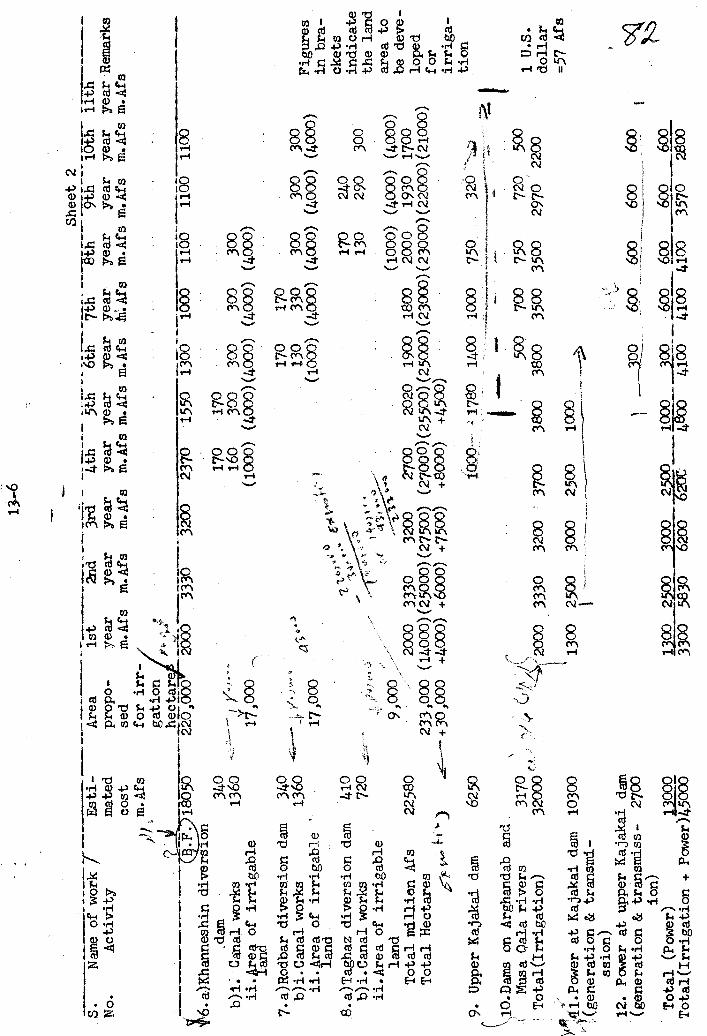
S.
Name of work f
Esti-
No.
Activity
mated
cost
> J m. Afs
'6.a)Khanneshin diversion
.dam
340
b)1. Canal works
1360
ii.frea
of irrigable
17,000
an
7.a)Rodbar diversion dam
340
b)i.Canal works
1360
ii.Area of irrigable
'
land
8.a)Taghaz diversion dam
410
b)i.Canal works
720
ii.Area of irrigable
land
Total million Afs
22580
Total Hectares ty
i!i.
y
1805
0
Area
1st
2nd
3rd
propo-
year
year
year
sed
m.Afs
for irr-
m.Afs
m.Afs
gation
hectare
220,000
2000
3330
3200
2370
1550
1300
1000
1100
1156
1100
Sheet 2
4th
5th
6th
7th -! nth
9th
10th
11th
year year
year year
year
year
year
year Remarks
m.Afs m.Afs m.Afs
hi.Afs
m.Afs m.Afs
m.Afs m.Afs
9. Upper Kajakai dam
6250
(10.Dams on Arghandab and
Musa Qala rivers
3170
Total(Irrigation)
32000
VO 41.Power at Kajakai dam
10300
,.(generation & transmi-
ssion)
12. Power at upper Kajakai dam
(generation & transmiss-
2700
ion)
Total (Power)
13000
Total(Irrigation + Power)45000
17,0
00
!k.
29,000
A3
2000
3330
3200
2700
2020
1900
1800
170
170
160
300
300
300
300
(1000) (4000)(4000) (4000) (4000)
170
170
130
330
(1000) (4000)
300
(400
0)
170
300
(400
0)
240
300
(400
0)
130
290
300
(1000)
(4000)
(4000)
2000
1930
1700
233,000 (14000)(25000)(275D0) (27000) (25500)(250 (23000)(23000)
+ 3
0 ,0
00+4000) +6000) +7500)
+8000)
+4500)
1000- ,:1780
1400
1000
50
2000
3330
1300
2500
1
,.....
7'-
500
700
750
3200
3700
3800
3800
3500
3500
3000
2500
10008._
329
__
___600
__.600
1120
2500
3000
2500
1000
300
600
600
600
600
3300
5830
6200
620C
4800
4100
4100 4100
3570
2850
(22000)(21000)
720
500
2970
2200
Figures
in bra-
ckets
indicate
the land
area to
be deve-
loped
for
irriga-
tion
1 U.S.
dollar
=57 Afs
14 -1
CHAPTER 14
ECONOMIC EVALUATION
F
14.1 Appraisal
The project consists of three components, irrigation, hydro power
and flood control. However the benefits accruing from flood control are
not quantified for purpose of this pre-feasibility study, while the
costs of flood diversion works at Kamal Khan and all three storages to
be constructed are taken into account. Similarly the cost of storages
is not apportioned to the three facilities separately for evaluating the
benefits and economic viability of wach component. The economic viability
of the entire plan is assessed from two considerations
1) benefit -cost ratio indicating the relation between the
total investment and the benefits that accrue after the
project is completed, and
2) internal rate of return.
The plan of development including construction of capital works is
assumed to be completed in 11 years. It is proposed to parry out improve-
ments to the irrigation and drainage network for an area of about 30,000
hectares out of th .- tt- t.ng irrigation in the upper
Helmand 2,43 -± ,the,, benefits that accrue on account of the
improvementa._.are taken into consideration. The existing irrigation of
about 55,000 hectares of land in the lower Helmand valley which is not
at present assured Of unfailing supplies will be stabilised and the
benefits from the project will accrue to these lands.. The rate of
irrigation and agricultural development is indicated in Table 13 -1
14-2
under Chapter 13 on Phased Programme of Implementatio .t
iccThe existing cropping pattern over the 5 0 ,,,hectares of land,
the average yields, the average production costs and the net revenue are
given in Tables 14 -1 and 14 -2. After completion of the project and area
development, assured and regulated irrigation supplies will be available,
improved seeds, fertilizers etc., and other infrastructural facilities
will be introduced. Hence the crop yields should improve considerably.
Tables 14 -4 and 14 -5 gire the cropping pattern, intensity of irrigation,
the yields, the production costs and the net revenue after the project.
Similar data in respect of the 30,000 hectares of land for which irrigation
drainage and other facilities are to be improved, is given in the Tables
14 -6, 14 -7, 14-e and 14 -9.
It is programed to complete the installation of additional hydro-
power generating units at Kajakai and erection of transmission lines to
various load receiving centres and distribution network by the end of
y`" fifth dear. The first stage of power benefits will therefore start
accruing from the sixth year. When the other power stations on Hari Rud,
Farah Rud and in the north are completed, commissioned and interconnected
with Kajakai power by forming a national grid, the transmission lines now
proposed to be laid will serve to transmit the loads from various generating
stations in a bi- directional way. Hence the cost of transmission lines is
to be apportioned ultimately to more than Kajakai system. For the present,
the entire cost of transmission is however proposed to be charged to
this project.
14 -3 7"
The power at the upper Kajakai dan is programmed to be made
available in the 11th year. Benefits from this will therefore accrue
from llt ear. -'i /1 `.
tic c. >,
The benefit -cost ratio for the entire project (irrigation and
power) is worked out. Estimated cost of one KWH of hydro -electric
energy at load centres is worked out, taking the annual costs of
power generation and transmission and the total energy that could be
generated and consumed annually.
The annual costs for irrigation and power are worked out on
the following basis :
i) the total investment costs at the end of the construction
and development activity are arrived at by adding the
interest that accrues during the period of activity at
2 interest;
ii) the cost of annual maintenance and operation of the
irrigation and power components of the project is taken
as 1`% of the investment cost;
iii) amortization of the investment is based on a capital recovery
factor corresponding to a 50 year life and interest rate of 2-14
in respect of irrigation works and storages. In the case of
hydro -power component it is based on a recovery factor correspond..
ing to a 35 year life and interest rate of 2. Provision for
renewals and replacements of electrical plant etc. is also made.
14 -4
14.2 Benefit cost ratio
Present net revenue from crop production is estimated to be
133.00 + 166.43 = 299.43 M. Afs- (Tables 14-2 and 14 -7). Future net revenue
from crop production, after the completion of the project is assessed
to be 4800.00 + 735.15 = 5535.155t m. Afs (Tables 14 -5 and 14 -9).
Irrigation benefits due to/project = 5535.15 - 299.43 = 5235.72 M. Afs
Total units of energy that can be
generated at Kajakai and utilised = 600 x 106 KIREs.
Allowing 10% losses in transmission
and distribution,net energy = 540 x 106 KuHs.
Total units of energy that can be generated
at upper Kajakai dam and utilised = 250 x 106 KWHs
Allowing 10% losess in transmission
and distribution, net energy = 225 x 106 KWHs
Total net energy = 540 x 106 + 225 x 146 =765 x 106
Assuming that the selling rate of electrical
energy in the region is 1.3 Afs per rill
Gross revenue from power = 765 x 106 x 1.3 = 994.5 m. Afs
Allowing 10% towards administration
and collection charges, net revenue
from power = 895.05 million Afghanis
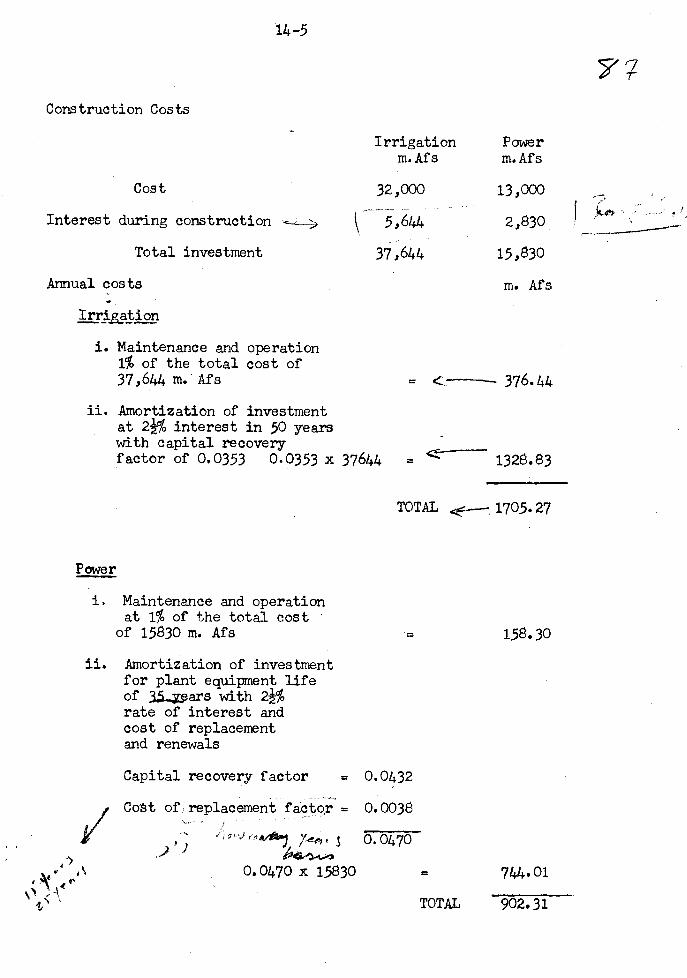
14-5
Construction Costs
Irrigationm. Afs
Powerm.Afs
Cost 32,000 13,000
Interest during construction 5,44 2,830
Total investment 37,644 15,830
Annual costs m. Afs
Irrizätión
i. Maintenance and operation1% of the total cost of37,644 m.
,
Als = ------ 376.44
ii. Amortization of investmentat 2 interest in 50 yearswith capital recoveryf actor of 0.0353 0.0353 x 37644 = 1328.83
TOTAL .---, 1705.27
=
Power
i. Maintenance and operationat 1% of the total cost '
of 15830 m. Als = 158.30
ii. Amortization of investmentfor plant equipment lifeof 35ars with 2i%rate of interest andcost of replacementand renewals
Capital recovery factor = 0.0432
Coat of replacement factor = 0.0038
7 S 0.0470
0.0470 x 15830 744.01
TOTAL 902.31
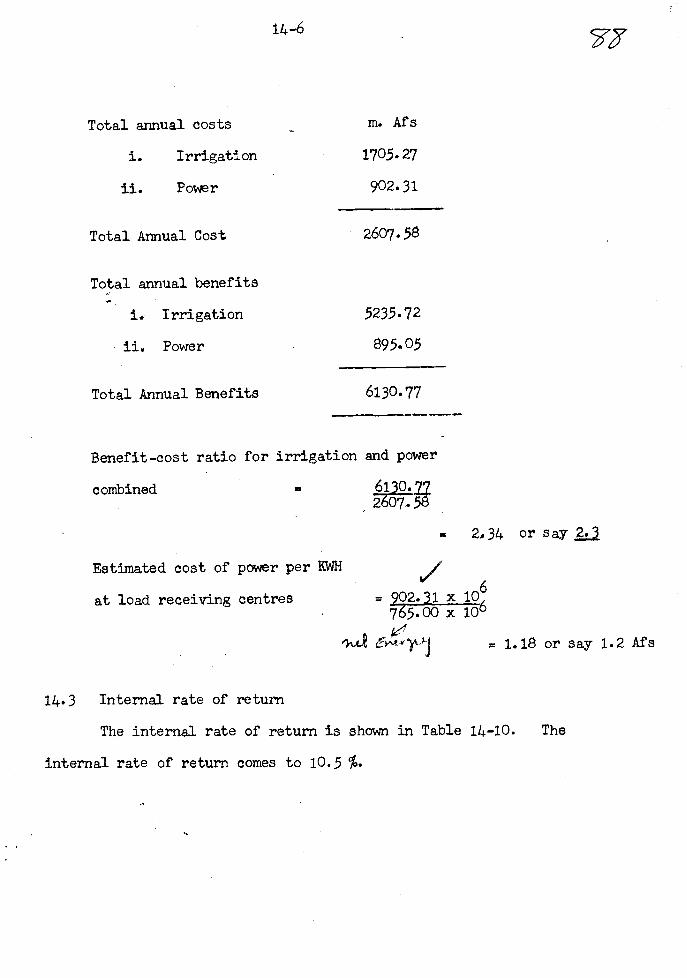
14-6
Total annual costs m. Afs
i. Irrigation 1705.27
ii. Power 902.31
Total Annual Cost 2607.58
Total annual benefits
i. Irrigation
ii. Power
5235.72
895.05
Total Annual Benefits 6130.77
Benefit -cost ratio for irrigation and power
combined 6130.222607..58
Estimated cost of power per KWH
at load receiving centres
= 2.34 or say 2.
6= 902.31 x 10765.00 x 106
ek,A1 6»ei,
gÓ
= 1..18or say 1.2Afs
14.3 Internal rate of return
The internal rate of return is shown in Table 14 -10. The
internal rate of return comes to 10.5 .
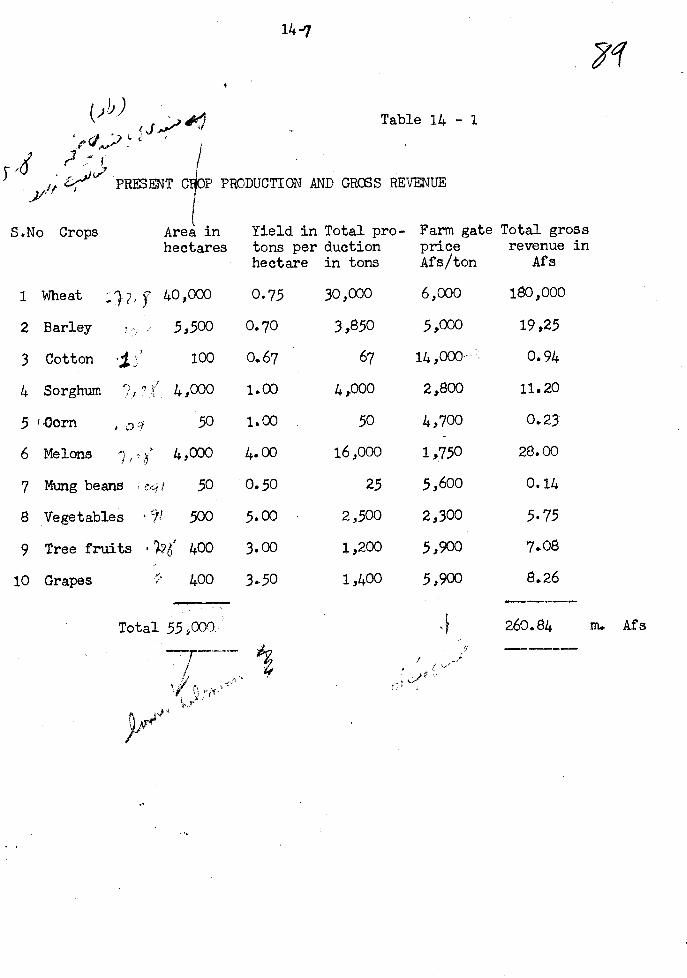
141
Table 14 - 1
PRESENT CHOP PRODUCTION AND GROSS REVENUE
S.No Crops Area in Yield in Total pro - Farm gate Total gross
hectares tons per duction price revenue inhectare in tons Afs/ton Af s
1 Wheat 7. 40,000
2 Barley 5,500
3 Cotton , V'' 100
4 Sorghum r', ?; ` 4,000
5 ',Corn pi 50
6 Melons ; m
? 4,000
7
8
9
10
Mung beans M t 50
Vegetables .9! 500
Tree fruits . 7.2' 400
Grapes 400
Total 55,000
0.75 30,000 6,000 180,000
0.70 3,850 5,000 19,25
0.67 67 14,000 0.94
1.00 4,000 2,800 11.20
1.00 50 4,700 0.23.
4.00 16,000 1,750 28.00
0.50 25 5,600 0.14
5.00 2,500 2,300 5.75
3.00 1 ,200 5,900 7.08
3.50 1,400 5,900 8.26
260.84
yq
m. Af s
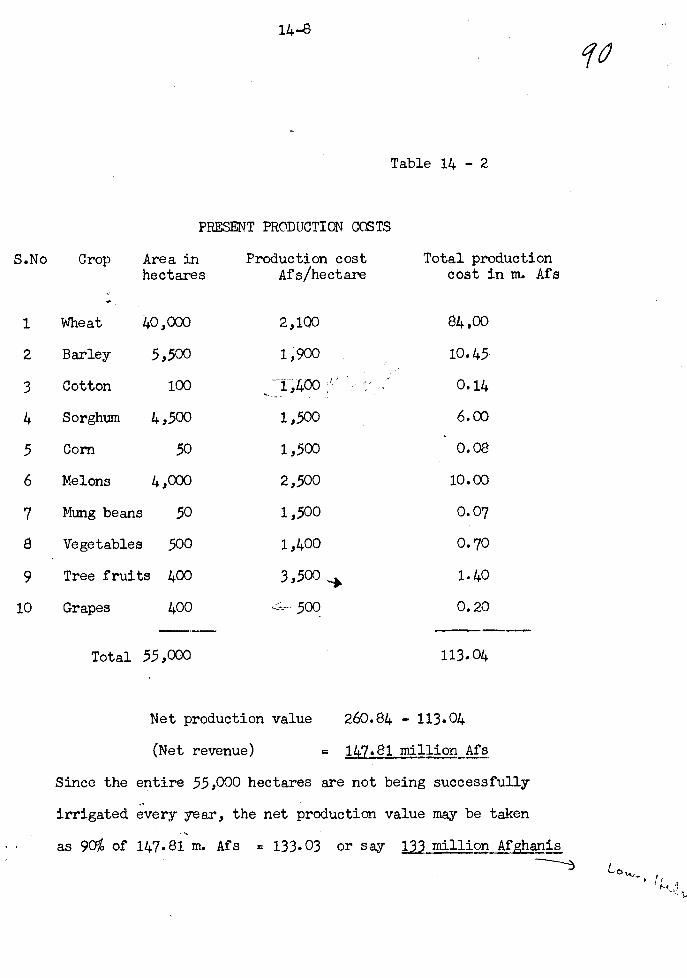
14-5
Table 14 - 2
PRESENT PRODUCTION COSTS
S.No Crop Area inhectares
Production costAfs /hectare
Total productioncost in m. Afs
1 Wheat 40,000 2,100 84,00
2 Barley 5,500 1,900 10.45
3 Cotton 100 1,400 0.14
4 Sorghum 4,500 1,500 6.00
5 Corn 50 1,500 0.08
6 Melons 4,000 2,500 10.00
7 Mung beans 50 1,500 0.07
8 Vegetables 500 1,400 0.70
9 Tree fruits 400 3,500 1.40
10 Grapes 400 500 0.20
Total 55,E 113.04
Net production value
(Net revenue)
Since the entire 55,000 hectares
260.84 - 113.04
= 147.81 million Afs
are not being successfifily
irrigated every year, the net production value may be taken
as 90% of 147.81 m. Afs = 133.03 or say 133 million Afghanis
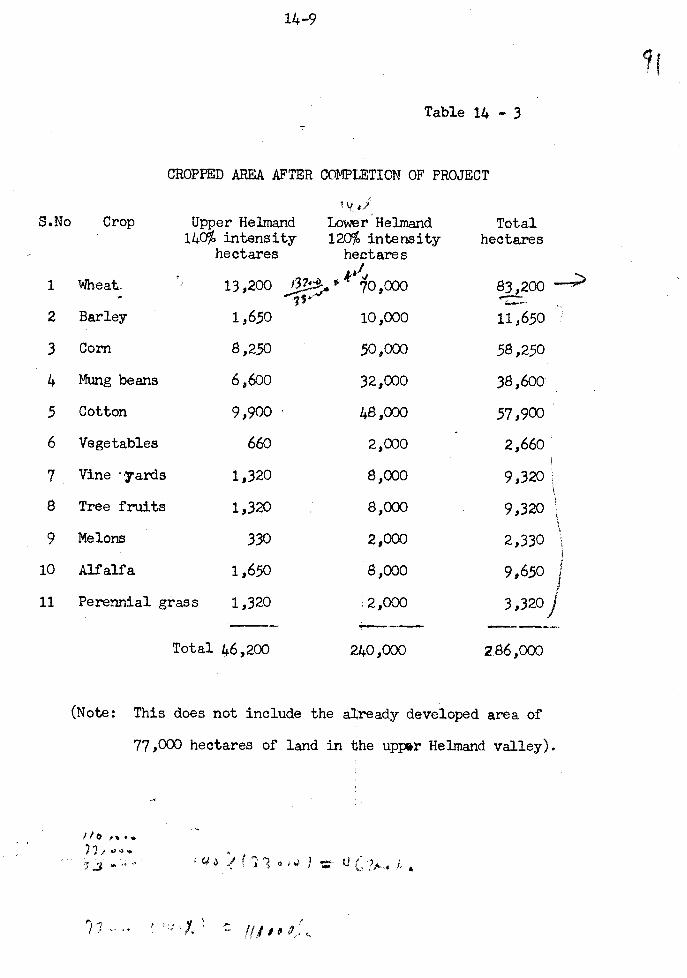
14 -9
S.No
Table 14 - 3
CROPPED AREA AFTER COMPLETION OF PROJECT
lyts,,
Crop Upper Helmand Lower'Helmand Total14 intensity 120% intensity hectares
hectares hectares
1 ?meat. 13,200 83 ,200
2 Barley 1,650 10,000 11,650
3 Corn 8,250 50,000 58,250
4 Mung beans 6,600 32,000 38,600
5 Cotton 9,900 48,000 57,900
6 Vegetables 660 2,000 2,660
7 Vine -yards 1,320 8,000 9,320
8 Tree fruits 1,320 8,000 9,320
9 Melons 330 2,000 2,330
10 Alfalfa 1,650 8,000 9,650
11 Perennial grass 1,320 '2,000 3,320
Total 46,200 240,000 2 .86,o00
(Note: This does not include the already developed area of
77,000 hectares of land in the upper Helmand valley).
-
' u 3
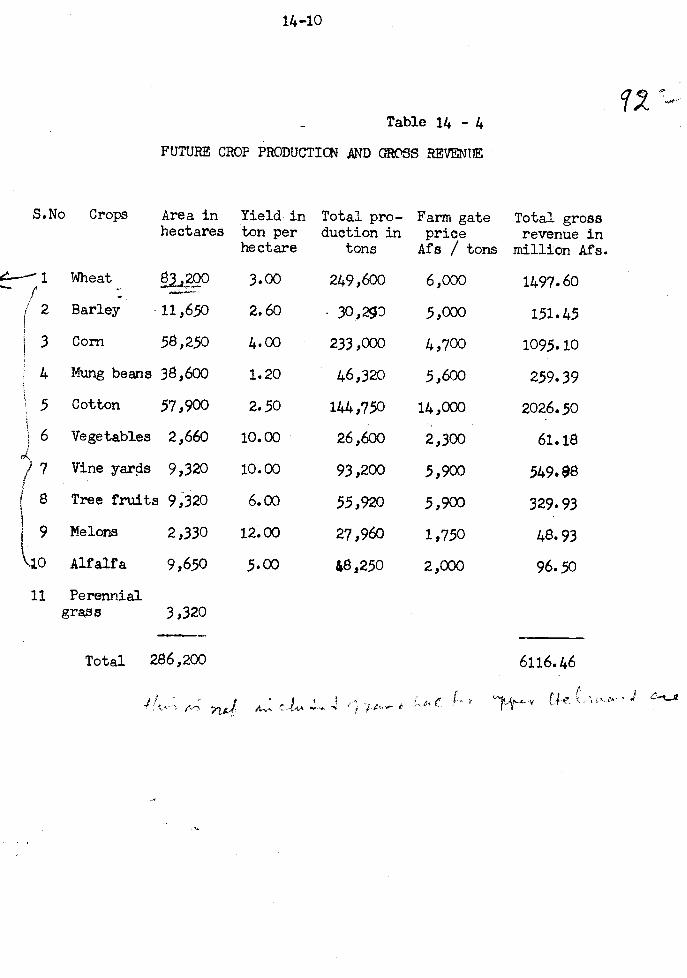
14 -10
Table 14 - 4
FUTURE CROP PRODUCTION AND GROSS REVENUE
S.No Crops Area inhectares
Yield inton perhectare
Total pro-duction in
tons
Farm gateprice
Afs / tons
Total grossrevenue in
million Afs.
Wheat 814200--¡"1_/ z Barley - 11,650
3.00
2.60
249,600
30,280
6,000
5,000
1497.6o
151.45
3 Corn 58,250 4.00 233,000 4,700 1095.10
4 Mung beans 38,600 1.20 46,320 5,600 259.39
5 Cotton 57,900 2.50 144,750 14,000 2026.5o
6 Vegetables 2,660 10.00 26,600 2,300 61.18
7 Vine yards 9,320 10.00 93,200 5,900 549.88
8 Tree fruits 9,320 6.00 55,920 5,900 329.93
(4:Melons 2,330
Alfalfa 9,650
12.00
5.00
27,960
48,250
1,750
2,000
48.93
96.50
11 Perennialgrass 3,320
Total 286,200 6116.46
Cfr. J C-_a
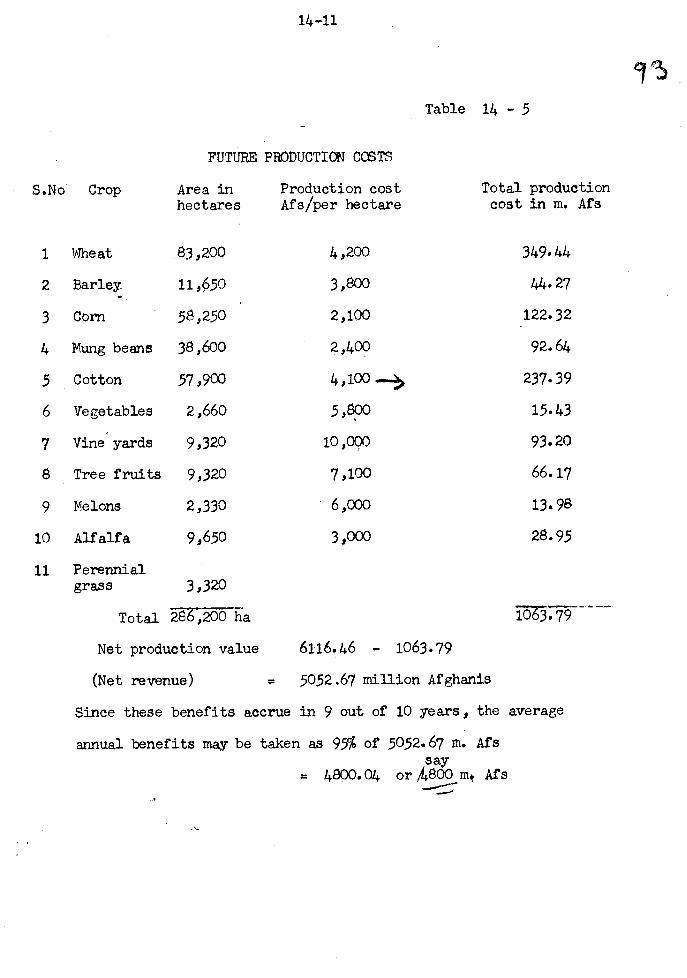
14 -11
1
FUTURE PRODUCTION COSTS
Table 14 - 5
S.No Crop Area in Production cost Total production
hectares Afs /per hectare cost in m. Afs
1 Wheat 83,200 4,200 349.44
2 Barley 11,¢50 3,800 44.27
3 Corn 58,250 2,100 122.32
4 Mung beans 38,60o 2,400 92.64
5 Cotton 57 ,900 4,100 ... 237.39
6 Vegetables 2,660 5,800 15.43
7 Vine yards 9,320 100000 93.20
8 Tree fruits 9,320 7,100 66.17
9 Melons 2,330 6 ,000 13.98
10 Alfalfa 9,650 3,000 28.95
11 Perennialgrass 3,320
Total 286,200 ha
Net production value
(Net revenue)
6116.46 - 1063.79
= 5052.67 million Afghanis
Since these benefits accrue in 9 out of 10 years, the average
annual benefits may be taken as 95% of 5052.67 m. Afssay
= 4800.04 or/4800 m. Afs
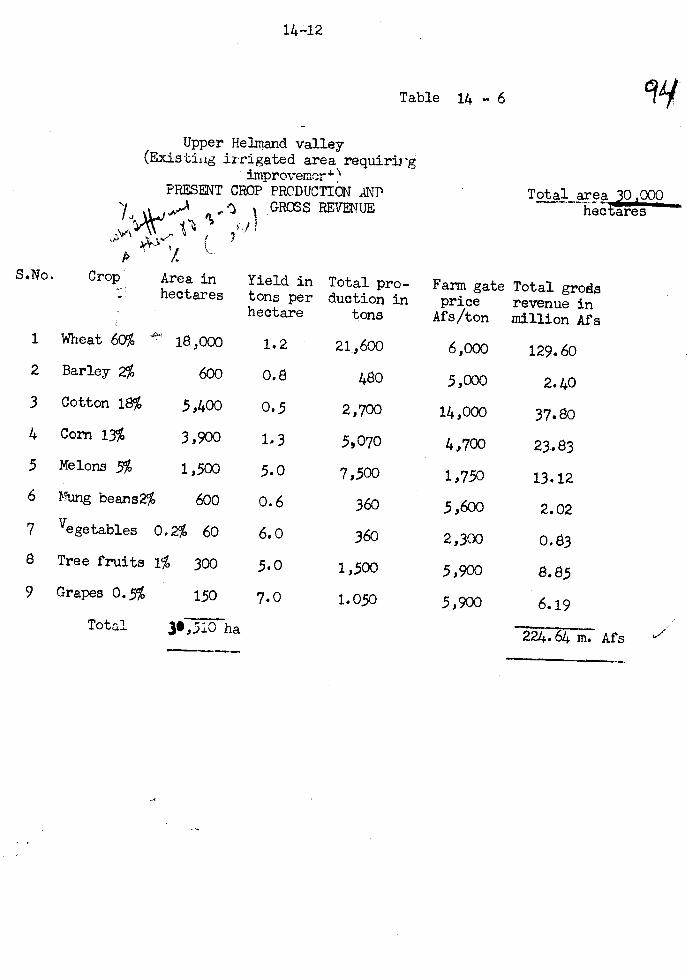
14.12
Table 14 - 6
Upper Helmand valley(Existing irrigated area requirirg
improver:rPRESENT CROP PRODUCTION AND
GROSS REVENUE
i
Area in Total pro -hectares duction in
tons
S.No. Crop Yield intons perhectare
Farm gateprice
Afs /ton
9f
Total area 0,000hectares
Total grodsrevenue inmillion Afs
1
2
Wheat 60%
Barley 2%
18,000
600
1.2
0.8
21,600
480
6,000
5,000
129.60
2.40
3 Cotton 18% 5,400 0.5 2,700 14,000 37.804 Corn 13% 3,900 1.3 5,070 4,700 23.83
5 Melons 5% 1,500 5.0 7,500 1,750 13.126 Mung beans2% 600 0.6 360 5,600 2.02
7 Vegetables 0.2% 60 6.0 360 2,300 0.83
8 Tree fruits 1% 300 5.0 1,500 5,900 8.859 Grapes 0.5% 150 7.0 1.050 5,900 6.19
Total 30,510 ha224.64 m. Afs
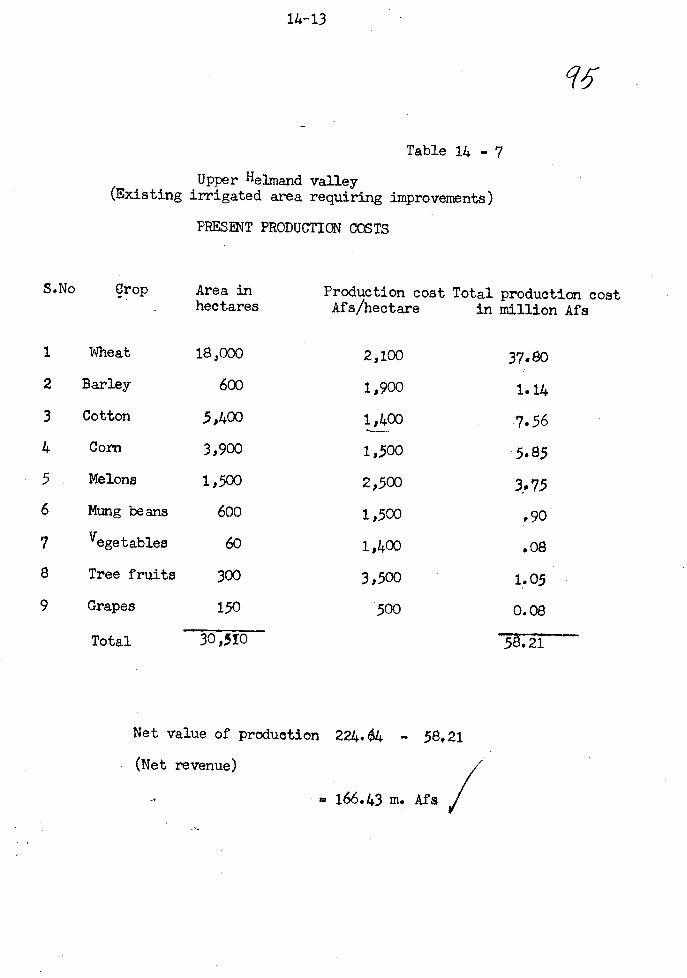
14 -13
q5
Table 14 - 7
Upper Helmand valley(Existing irrigated area requiring improvements)
PRESENT PRODUCTION COSTS
S.No Crop Area inhectares
Production cost Total production costAfs /hectare in million Afs
1 Wheat 18,000 2,100 37.80
2 Barley 600 1,900 1.14
3 Cotton 5,400 1,400 7.56
4 Corn 3,900 1,500 5.85
5 Melons 1,500 2,500 3.756 Mung beans 600 1,500 .90
7 Vegetables 60 1,400 .08
8 Tree fruits 300 3,500 1.05
9 Grapes 150 500 0.08
Total 30,510 58.21
Net value of production 224.64 - 58.21
(Net revenue)
= 166.43 m. Afs
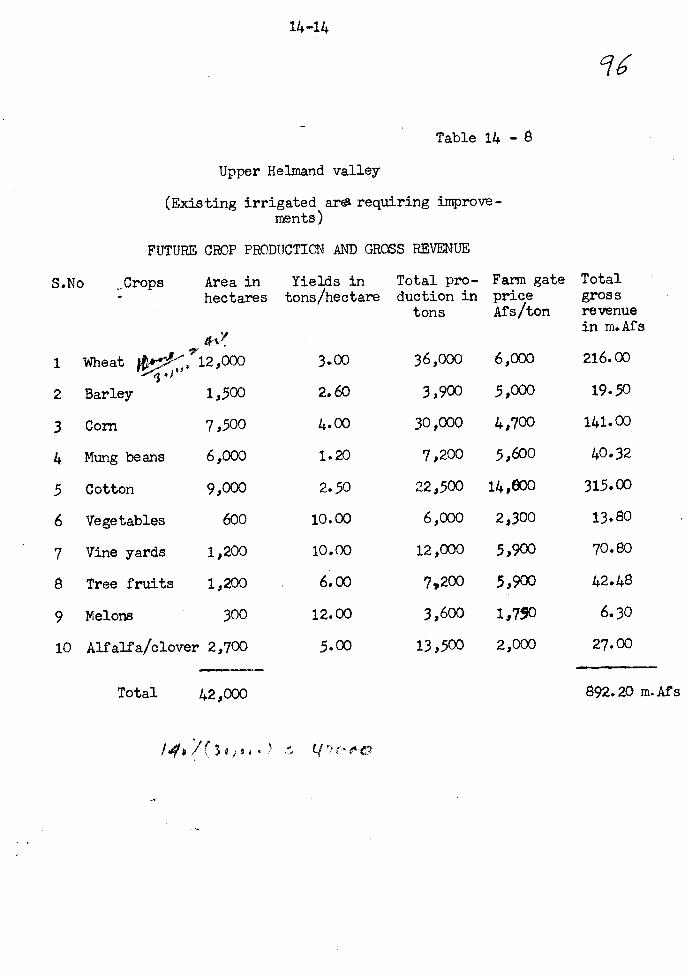
14 -14 lTable 14 - 8
Upper Helmand valley
(Existing irrigated art. requiring improve-ments)
FUTURE CROP PRODUCTION AND GROSS REVENUE
S.No ,Crops Area in Yields in Total pro-
hectares tons /hectare duction intons
Farm gatepriceAfs /ton
Totalgrossrevenuein m.Afs
1 Wheat 12,000 3.00 36,000 6,000 216.00
2 Barley 1,500 2.60 3,900 5,000 19.50
3 Corn 7,500 4.00 30,000 4,700 141.0o
4 Mung beans 6,000 1.20 7,200 5,600 40.32
5 Cotton 9,000 2.50 22,500 14,600 315.00
6 Vegetables 600 10.00 6,000 2,300 13.80
7 Vine yards 1,200 10.00 12,000 5,900 70.80
8 Tree fruits 1,200 6.00 7,200 5,900 42.48
9 Melons 300 12.00 3,600 1,790 6.30
10 Alfalfa /clover 2,700 5.00 13,500 2,000 27.00
Total 42,000 892.20 m.Afs
40s/ 3 e. ?
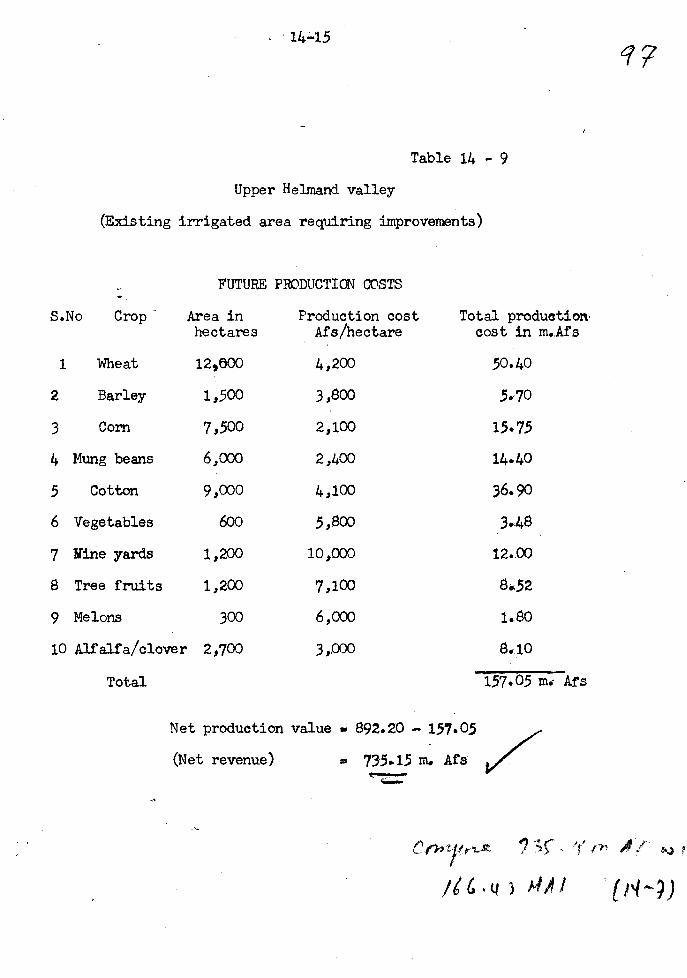
14-15
q7
Table 14 - 9
Upper Helmand valley
(Existing irrigated area requiring improvements)
FUTURE PRODUCTION COSTS
S.No Crop Area inhectares
Production costAfs /hectare
Total production,cost in m..Afs
i Wheat 120800 4,200 50.40
2 Barley 1,500 3,800 5.,70
3 Corn 7,500 2,100 15.75
4 Mung beans 6,000 2,400 14.40
5 Cotton 9,000 4,100 36.90
6 Vegetables 600 5,800 3.48
7 Mine yards 1,200 10,000 12..00
8 Tree fruits 1,200 7,100 8..52
9 Melons 300 6,000 1.:80
10 Alfalfa /clover 2,700 3,000 8.40
Total 157.05 m: Afs
Net production value = 892.20 - 157.05
(Net revenue) = 735.15 m. Afs--.._.
41,..
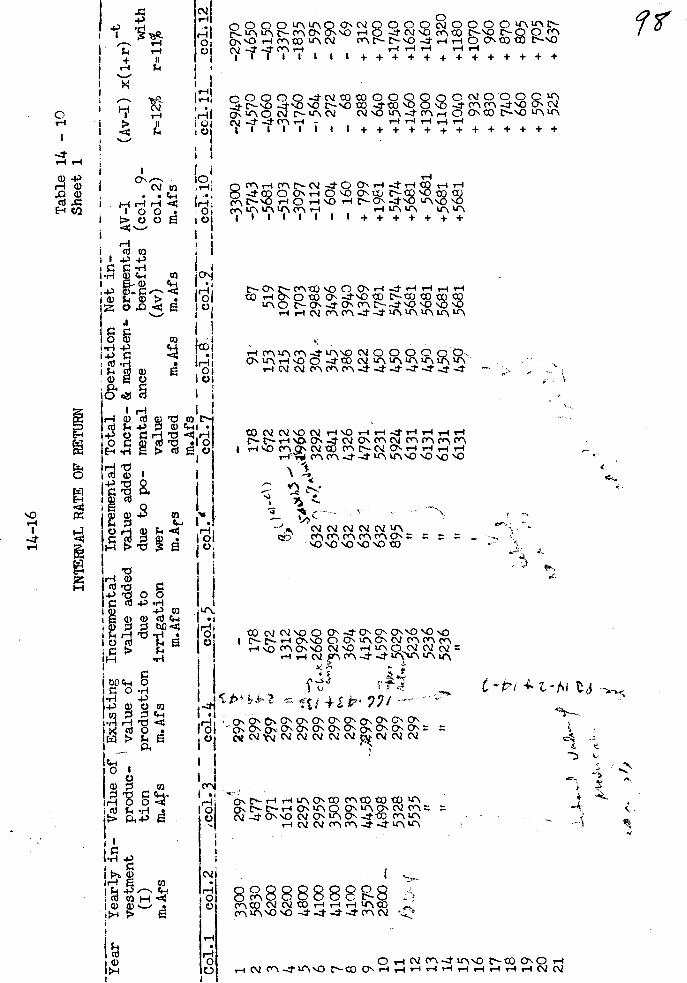
Yea
r
Col.1
1 2 3 5 6 7 8 9 10
11 12
13
14
1516
17
18
1920
21
Yearly in-
vestment
(I)
m.
Afs
Value of
Exi
stin
gpr
oduc
-'
value of
tion
production
m.Afs
m.Afs
co1.2
:col.2
,3300
5830
6200
6200
4800
4100
4100
4100
3570
2800
.-.
f3`,
299-
477
971
1611
2295
2959.
3508
3993
4458
4898
5328
5535
14 -
16
INTERNAL RATE OF RETURN
Incremental
value added
due to
irrigation
m.Afs
co1.5
299
299
'4:
178
199
672
299
>\
1312
299 -1%_,
1996
299
c G.K2660
299 "tt
"s3209
299
-.2299
t3694
4159
299
299
299
It tt
:1'),
4599
,4
;.5P29
5236
5236
5236
Jus.
j71.
-Ev4
'
J 1
11
Incremental Total Operation Net in-
value added incre- & maintenu aremental
due to po- mental ance
benefits
wer
value
m.Afs
added
m.Afs
m.Afs
coi.'
co1.7
col.8.
- 178
91-
,-t1>
672
153
',,1312
215
aa),
3 ,,,
,i196
626
363
2 ^;
r7"
3292
304-
632
3841
345
632
4326
386
632 "
4791
422
632
5231
450
895
5924
450
11 it 11 It
6131
450
6131
450
6131
450
6131
450
Table 14 - 10
Sheet 1
AVI
(Av I)
(col. 9-
r=12
°ß(Av)
in.Afs
col.9
87
519
col.2)
m.Afs
co1.10
-3300
-5743
-5681
1097
-5103
1703
-309
72988
-1112
3496
- 604
3940
- 160
4369
+ 799
4781
+1981
5474
+5474
5681
+5681
5681
+ 5681
5681
+5681
5681
+5681
x(1 +r)-t
with
r =11%
colli
co1.12
-2940
-2970
-4570
-4650
-4060
-4150
-3240
-3370
-176
0-1
835
564
- 595
- 272
- 290
-68
-69
+ 288
+ 312
+ 640
+ 700
+1580
+1740
+1460
+1620
+1300
+1460
+1160
+ 1320
+1040
+1180
+ 932
+1070
+ 830
+ 960
+ 740
+ 870
+ 660
+ 805
+ 590
+ 705
+ 525
+ 637
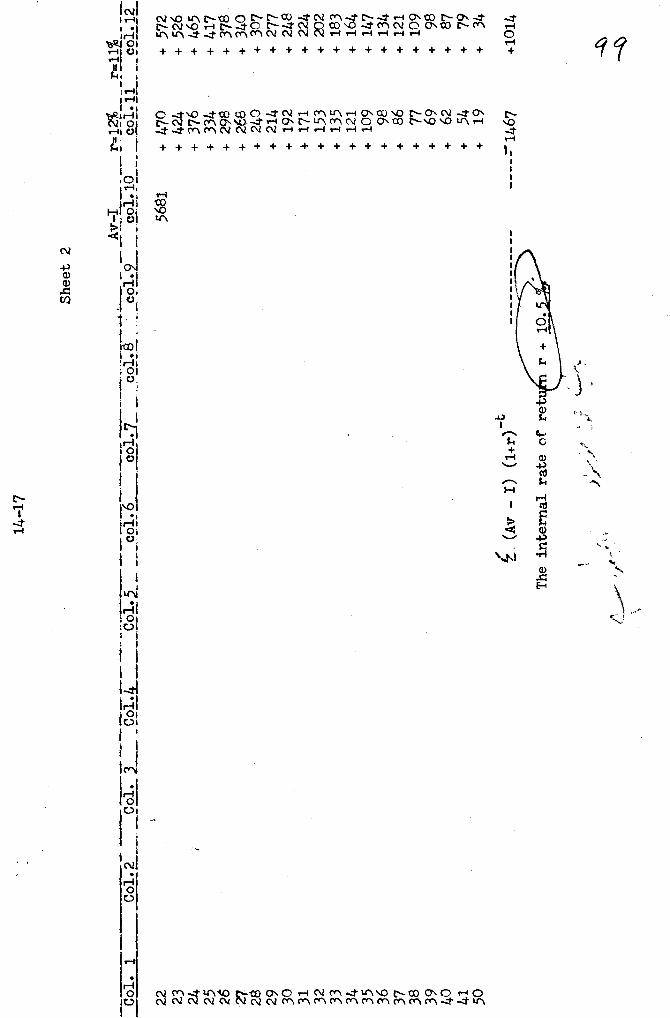
Col. 1
Col.2
Col. 3
Col.4
Col.5
co1.6
co1l7
col.8
co1.9
co1.10
co1.11
co1.12
Sheet 2
Av -I
r=14
22
23242526
27
28 29
30
31 32
33 34
35
36
3738
3940
4150
(Av - I) (l+r)-t
The internal rate of re
5681
470
+1+
572
424
526
376
465
334
417
298
378
2E8
340
240
307
214
277
+ 192
248
+ 1
7122
4+
153
202
+ 1
3518
3+ 121
+ 164
+ 109
147
+98
+ 134
+86
+ 121
+77
+ 109
+69
+98
+62
+87
+54
+79
+19
+34
-1467
+1014
151
CHAPTER 15
CONCLUSIONS AND RECOMMENDATIONS
15.1 Conclusions
The new Regime of Afghanistan have launched on a number of
development plans to improve the Nation's economy and raise the standards
of living. In accordance with the above objectives this report is prepared
outlining an integrated development of the Helmand irrigation and power
potential in about gleven :veaxs commencing from theyear 125.4. It is
based on the data and information contained in the numerous studies made
so far.
i. The Helmand valley is endowed with natural resources for the
economic development of the area, if only they are exploited in a planned
way. There is land potential of about 51$,000 hectares, with large areas
having irrigation potentialities. Only 77,000 hectares of land is presently
being irrigated in the upper Helmand valley with regulated releases from
Kajakai reservoir and a network of irrigation system. Under the present
plan assured irrigation benefits could be extended to an additional extent
of about 33,000 hectares in the Helmand Province and an area of 200,000
hectares of land in the Helmand and Nimruz provinces without shutting the
potentialities of bringing under irrigation larger areas at a later date.
The presently proposed area of 200,000 hectares in the lower valley includes
the 55,000 hectares of land now being irrigated most of which does not get
assured Supplies.
ii. It is equally essential to diversify the development activities
simultaneously in more than one sector, to make the region self-reliant
and to create self generating economy. Industrialisation is one of the most
15 -2 fa 1
important facets of economic development. The Helmand valley and other
areas around Kandahar, Kabul, Ghazni and Herat abound in other untapped
natural resources which could be exploited to great advantage. For this
purpose a number of plans are being finalised for developing varied
industries in the region in the next few years. But the essential pre-
requisite for industrial development is electric power which has to be
made available economically and in the quickeat possible time. It is
therefore most relevant in this context that the power potential at Kajakai
is fully exploited by installing additional hydro - generating units, laying
the transmission lines to load centres such as Kandahar, Herat, Kabul, etc.,
and laying of the distribution network. An additional power of 116.5 J .Ws
may therefore be installed and transmission and distribution network completed
3in the first five years of the plan along with the proposed irrigation
development.rarrn,vv. -. &,, t.P
iii. Vast cultivable commanded areas, at times exceeding 10 hec-
tares in the lower Helmand valley particularly in the Chakhansur area are
subject to constant ravages of floods and inundation. Even after the
creation of additional storages upstream, these areas will be subjected to
rigours of the frequency and intensity of floods in terms of volume as well
as peaks. They could be reclaimed and brought under beneficial use only
by diverting the excessive floodwaters of Helmand river into Gaudi- Zirreh
at Kamal Khan by constructing a flood diversion dam and related works. The
Kamal Khan dam is also located at the most suitable place so as to extend
benefits to irrigable areas under its command. The dam has also power
potential. This complex of works will also provide for two important
bridges in this area.
.%es c.,.' /3 !/
J
15-3 102
iv. The storage reservoirs to be constructed should have adequate
live storage capacity not only to meet the irrigation needs of the extents
nbw proposed but should also be sufficient to meet the future needs of
possible extension of irrigated agriculture. Adequate storage to optimise
the power benefits will also be required without conflict of interests
between power and irrigation. It will also be necessary to provide adequate
wry over /flopd storag9. 'An aggregate total. -of aboutj5,0004nillion cubicpp {i- ; I ,etisI e'-^
Meters of lifë storage including that of Kajdlcai will, therefore, have to
be considered subject to confirmation by feasibility studies of the storage
dams.
v. Pre feasibility studies have indicated that a storage dam near
Olumbagh on Helmand river upstream of Kajakai could be constructed, creating=
a gross storage of 1,75e million cubic meters. The possibility of inereas-
ling the storage capacity of this dam by increasing its height will have to
4 'jf3'exámined at the time of feasibility studies. Similarly it is considered
feasible to construct a storage dam on Arghandab river and possibly a third
on Musa Qala to fulfil the needs referred to in above.
vi. The proposed dam at Olumbagh will in addition create a firm
power potential of nearl .IM.Ws. the
installed capacity bein 9. M fig. This will meet the additional power
demands of the region by the time the power generated at Kajakai is utilised.
vii. The integrated operation of Kajakai reservoir and the proposed
upper Kajakai reservoir along with those proposed on Musa Qala and Arghandab
rivers will be needed to optimise the overall benefits.
viii.. A diversion dam at Garmab along with irrigation and drainage=
network and land levelling /shaping will extend irrigation benefits to a
large proportion of the 33,000 hectares in the upper Helmand valley.
f
15 -4
ix. The existing irrigation network in the upper Helmand valley needs
certain improvements by way of_providing adequate drainage and irrigation
facilities, etc. These improvements will modernise the system.
3
. '" Four diversion dams one each at Khanneshin, Taghaz, Khwabgah and ¡Sikhsar and a fifth one at Rodbar along with an irrigation and drainage )
network and land levelling /shaping etc., will extend irrigation benefits
to about 200.000 hectares.
xi. Agricultural development of the irrigated area needs to be
undertaken simultaneously with the creation of irrigation potential by way
of providing all the necessary infrastructural facilities such as fertilizer
and other inputs, transport facilities, ware -housing, marketing centres,
research and demonstration farms etc.
xii. The estimated cost of development of irrigation and power is
45,000 million Afghanis (790 million U.S. dollars) out of which the power
luSi rind
component is 13,000 million Afghanis (22S million U. S. dollars). The plan
is expected to be completed in 11 years.
xiii. The benefit -cost ratio for irrigation and power combined will
be 2.3 based on the given rate of interest and the internal rate of return
t will be 10.5%. Flood control benefits that accrue on account of the cons -
truction of Kamal Khan flood diversion dam and storages upstream are not
however taken into consideration for economic evaluation. The entire cost
of transmission lines which in the ultimate stage serve not only the two
Kajakai power stations but also others, is charged to this project. If
the economic evaluation is done taking these factors into consideration,
the benefit -cost ratio and the internal rate of return will be higher.
15-5 104'
xiv. The plan of development as envisaged above will increase
agricultural production and make available J. rge blocks of electric power
for the establishment of agro-based, animal bye product and other industries
in the area. This will infuse confidence in the people of the area for a
better future.
15.2 Recommendations
It is recommended that the following activities which constitute
major elements of the plan for the integrated development of the Helmand
basin are to be undertaken in the order of sequence indicated for fulfill-
ing the objectives :
i. The construction of power house and installing of additional
power units with a capacity of 116.5 M.Ws. at Kajakai, laying of tram.-
mission lines to Herat and Kabul and related distribution network are to be14.0-1 6444
taken up and completed in the first five years of the plan.'2
ii. The Kamal Khan flood diversion dam along with other related
works which are thoroughly studied are to be executed in the initial stages
of the plan. The dam and related works are to be so constructed as to maxi-
mise the irrigation and power benefits.
iii. The Lashkary canal scheme now under execution should be completed
in all respects in the first three years of the plan and the agricultural
development of the area should be completed without time lag. This will
serve as a pilot scheme for the overall irrigation and agricultural develop-
ment in. the valley.
iv. Detailed planning and engineering for the irrigation and agri-
cultural development of about 200,000 hectares in the lower Helmand valley
and about 33,000 hectares in the upper Helmand valley should be undertaken.
'IcA ti
15 -6
v. Improvements to the existing irrigation and drainage networks
covering about 30,000 hectares out of 77,000 hectares in the upper Helmand
valley are to be taken up and completed.
vi. Feasibility studies for the upper Kajakai dam (Olumbagh dam)
including power, the dam on Arghandab river and a third dam on Musa Qala
should be made.
vii. Construction of diversion dam at Garmab, Khanneshin, Taghaz,
Rodbar, -Khwabgah and Sikhsar along with the irrigation`añd drainage networks,
land levelling etc., is to be taken up and completed by end of tenth year
btoot :L 'of the plan.
viii. The upper Kajakai dam is to be taken up fay 9,mao.&tIorî in the
fough year of the plan and completed in the rilet-hiear. of plan i.e. by
the time major part of irrigation works referred to in vii above are
completed.
ix. The dams on Musa Qala and Arghandab rivers are to be taken up
for execution and completed. 7
x. The hydro power plant at upper Kajakai dam is to be installed
and the transmission line to Kajakai dam constructed by end of 1,Qth year
of the plan.
xi. The agricultural development of the entire irrigated area is to
be completed by the time irrigation potential is created without time lag.
A chart showing the phasing of activities and expenditure is
attached.
The sudcessful completion of the various works referred to above
will usher in the'following benefits c
i. Firm power of 120 M.Its at 0.5 load factor at Kajakai dam,
the installed capacity being 150 M.Ws;
ii. Immunity to the lands to an extent of about 100,000 hectares
15 -7 G
in the lower Helmand valley against flooding and inundation;
iii. Irrigated agriculture over 233,000 hectares of land in addition
to the existing 77,000 hectares of land in the upper Helmand
valley;
iv. Additional firm power of 60 l.Ws at 0.5 load factor at upper
Kajakai dam, the installed capacity being 90 M.Ws.
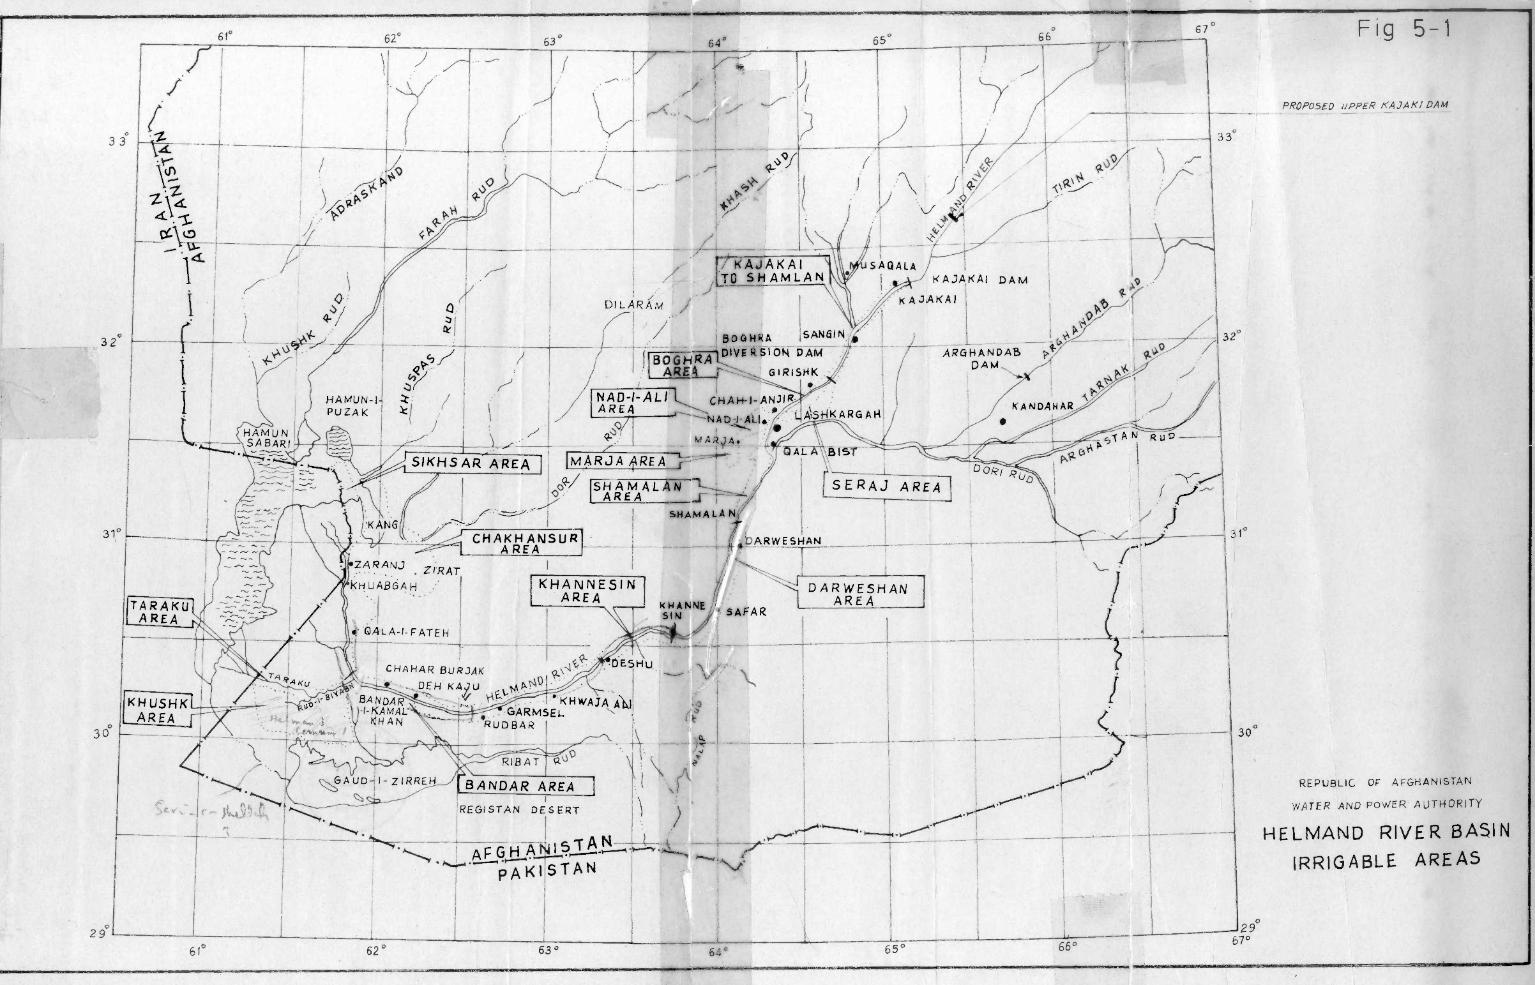
1° 9° 3064° 65° 66 67°
33
3 2°
31°
30
29
33
KAJAKAI DAMKAJAKAI
HAMUNSA BARI
QPti
/ I NAD-I-ALMJ ( AREA \GRAN-I-A JIRY `` NAD-LI
i
Q I MARA !. / T
SIKHSAR AREA MARJA AREA joO:(t/ SÁRgALAN IE 1-i/`'%'`/ SHAMA
,
.. , .
I.: CHAKHANSUR } f DARWESHANAREA
I BOGHRAARE4-
32°
ASHK ARG AMKANDAHAR
ST
SERAJ AREADORiRu
31°
TARAKUAREA
KHANNESINAREA
SAFAR
liA L A-1- FATE H
BANDAR AREA
61° 62° 63° 64 65° 66°
0°
290
67°
Fig 5-
PROPOSED UPPER KAJAKlDAM
REPUBLIC OF AFGHANISTAN
WATER AND POWER AUTHORITY
HELMAND RIVER BASINIRRIGABLE AREAS
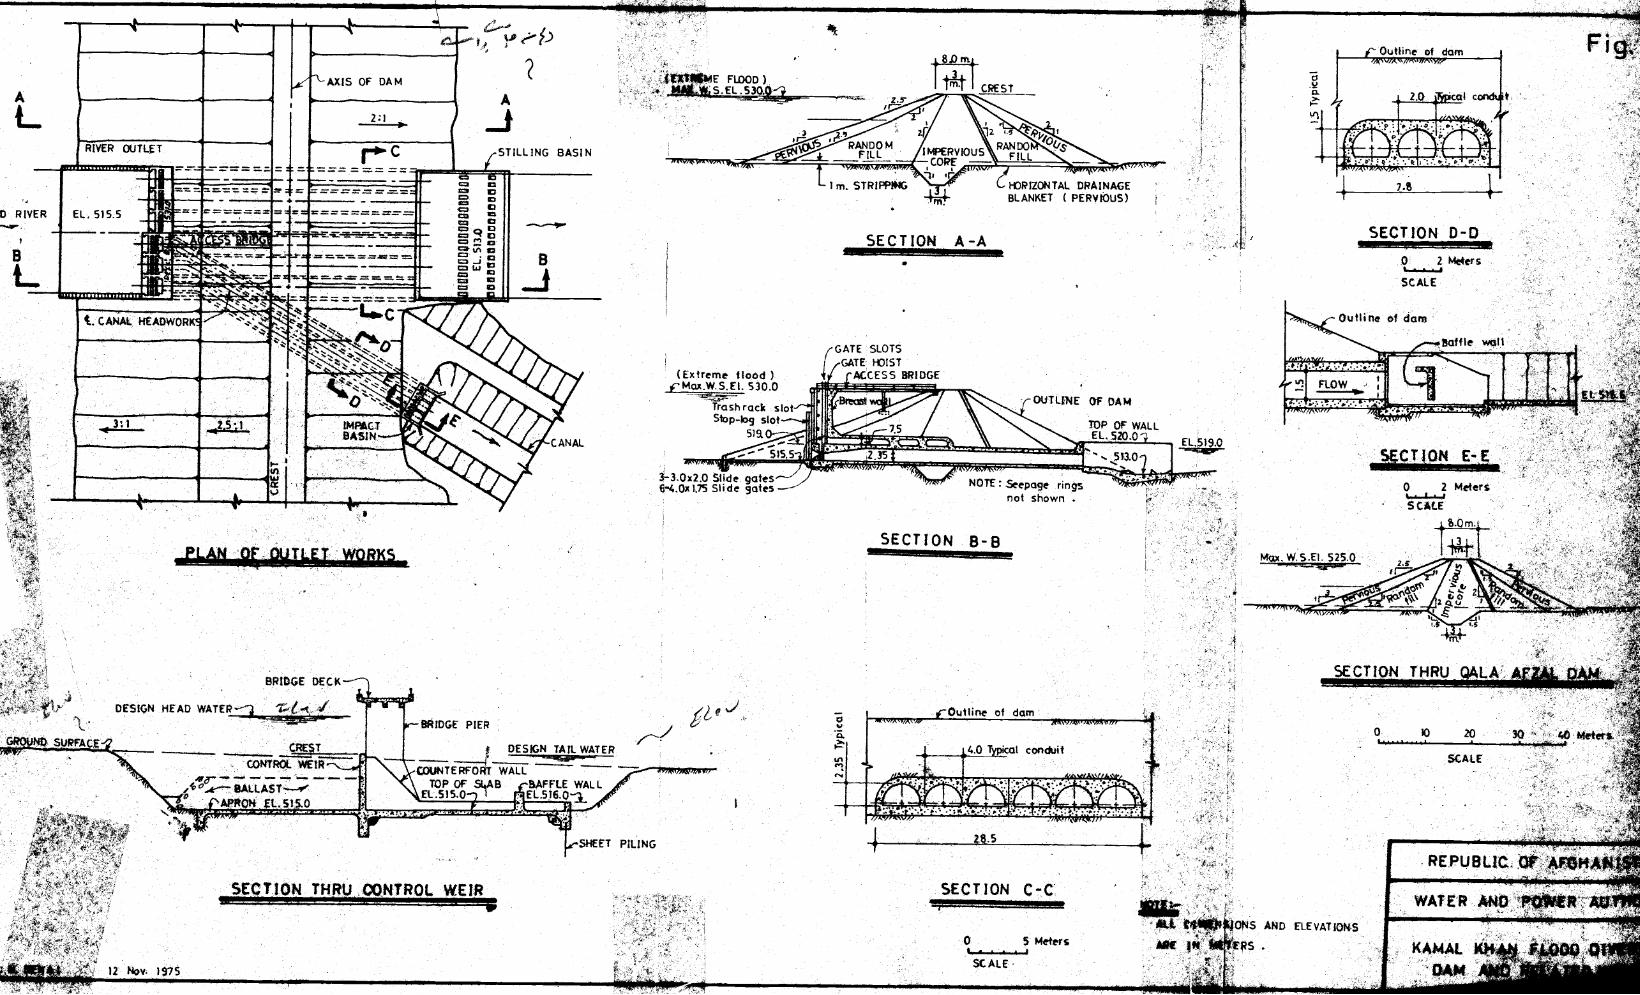
á.2a 2.0 t cal c
STILLING BASIN
I m. STRIPPING HORIZONTAL DRAINAGEBLANKET ( PERVIOUS)
SECTION A -Astammemessmemina
GATE SLOTSGATE 1-015T
ACCESS BRIDGE
PLAN4441T14T =R S
BRIDGE DECK
DESIGN HEAD WATER --4,
CREST
CONTROL WEIR
APRON L. Sl 0
.---BRIDGE PIER
DESIGN TAIL WATER
COUNTERFOR WALL-
TOP OF SLAB BAFFLE WALLEL.515.0 I EL.5ÌE.0 -j
(Extreme floodç Max.W. S. Et. 530.0
Trash rack slotStop-log slot
51a
OUTLINE OF DAM
TOP OF WALLEL, 520.0
EL.S19.0"...NACIP^
3- 3.0x2.0 Slide gates6-4.0x1.75 Slide yates
úq
NOTE : Seepage ringsnot shown .
SECTION 8-8issemeneweememmew
SECTION D -Dgiemeammonamme
0' z Meters
SCALE
Outline of dam
FLOWS.,
Baffle wall
Max. W. S.El. 525.0
t
L` zz 4 L t t %
tB S
SECTIïïN THRU LA
Outline of dam
0 10 20...... ....4,0 'co t conduit
SCALE
12 Nov. )975
SECTION THRU . CONTROE. WEIRineweamemmetean
SHEET PILING P,r
DNS AND ELEVATIONS
RS .ì ,