hedge fund wisdom - specials-images.forbesimg.com
TRANSCRIPT

1
table of contents
p.06 Baupost Group hedge fund portfolios:
Q4 2020
a quarterly publication by marketfolly.com
Q4 2020 www.hedgefundwisdom.com
Each quarter, hedge funds are required to disclose their portfolios to the Securities & Exchange Commission (SEC) via 13F filings.
These filings disclose long U.S. equity positions, American
Depositary Receipts (ADRs), stock options (puts/calls), warrants, as well as convertible notes. They do not disclose positions in other asset classes (such as commodities, currencies, or debt). They also do not reveal foreign market holdings, short sales, or cash positions.
Hedge Fund Wisdom, a quarterly publication by
www.marketfolly.com aggregates, updates, and analyzes the latest portfolios of top hedge funds. This issue reveals portfolio holdings as of December 31st, 2020.
Background:
In This Issue: - Consensus buy & sell lists revealing which stocks were most
popular among these managers
- Portfolio updates on 25 prominent hedge funds: data tables, expert commentary & historical context on each fund’s moves
- Investment thesis summaries on 2 stocks that saw notable hedge fund activity
- To navigate the newsletter, simply click on a page number in
the Table of Contents column on the right to go to that page
p.08 Berkshire Hathaway p.10 Greenlight Capital p.12 Lone Pine Capital p.14 Appaloosa Management p.16 Pershing Square Capital p.18 Maverick Capital p.38 Third Point p.41 Sequoia Fund p.43 Paulson & Co p.45 Tiger Management p.47 ValueAct Capital p.49 Bridger Capital p.51 Omega Advisors p.53 Coatue Management p.57 Fairholme Capital p.59 Tiger Global p.63 Hound Partners p.68 Glenview Capital p.71 Viking Global p.75 Farallon Capital p.80 Icahn Capital p.82 Brave Warrior Advisors
investment thesis summaries p.90 Credit Acceptance (CACC)
p.84 Pennant Investors
consensus buy / sell lists: p.02 Most popular trades
Quote of the Quarter:
"I don’t think [the market] will be as ebullient in the next year. So as we go into this new period, I think you’re going to see a pickup in growth and inflation. And with that, you’re going to also see a pickup in deficits. That pickup in deficits means that the government, particularly the United States, will have to sell a lot more bonds to the rest of the world."
~ Ray Dalio, Bridgewater Associates
hedge fund wisdom
p.99 Advantage Solutions (ADV)
Next Page: Consensus Buy/Sell Lists
p.86 Duquesne Family Office

2 Q4 2020 www.hedgefundwisdom.com
Hedge Fund Consensus Buy List
Consensus Increase List
Consensus New Buys DoorDash (DASH): The food delivery giant went public during the quarter and hedge funds that show a stake in the name include Maverick Capital, Third Point, Viking Global, Tiger Global, Lone Pine Capital, and Coatue Management. However, many of these funds owned stakes prior to DASH trading in the market. While the company is most known for food delivery, its main goal is to be the ‘FedEx of local’ and to focus on on-demand local delivery of really anything. They took a different approach to enter the food delivery market by starting in the suburbs first and focusing on the restaurants as the customer. Dragoneer Growth Opportunities (DGNS): Given the SPAC (special purpose acquisition company) craze, it should come as no surprise that hedge funds have selectively gotten in on the action as well. The rest of the tickers on this list are all SPACs. Funds that acquired new stakes in DGNS include Hound Partners, Third Point, Appaloosa, Baupost Group, and Maverick. This is Dragoneer Investment Group’s SPAC, a growth investor. Given that the SPAC has not announced an acquisition/merger target yet, anyone buying shares is basically betting on the management team of the SPAC to find a solid company to bring public. Ajax I (AJAX.U): The second SPAC on this list was bought by Hound, Tiger Global, Baupost, and Maverick. This particular SPAC was brought to market by hedge fund managers Daniel Och of Och-Ziff Capital Management and Glenn Fuhrman of MSD Capital. They’re targeting companies in the internet, software, fintech, and consumer industries. Their board also consists of Instagram co-founder Kevin Systrom, 23andme co-founder Anne Wojcicki, as well as Square co-founder Jim McKelvey and Chipotle founder Steve Ells. Needless to say, they’ve assembled quite a list of names and $750 million to acquire a company. Avanti Acquisition Corp (AVAN.U): Rounding out the list of SPACs, managers including Hound, Bridger, Third Point, and Baupost all initiated new positions in AVAN.U. This SPAC was created by NNS Group, the family office of Nassef Sawiris, as well as Sienna Capital, the alternative investment platform of Groupe Bruxelles Lambert (GBL). They will target businesses in Europe that have international reach.

3 Q4 2020 www.hedgefundwisdom.com
Hedge Fund Consensus Increase List
Consensus Sell List
Consensus Increased Positions Microsoft (MSFT): This is the third consecutive quarter that hedge funds were adding to their existing MSFT stakes. While shares have obviously performed quite well over the years, they largely stalled and traded sideways during the quarter, providing an opportunity for funds to increase their allocation. Tiger Management, Appaloosa, Third Point, Maverick, Farallon, Viking, and Tiger Global all were out buying more shares. Uber Technologies (UBER): The ridehailing and food delivery company graces this list for the second quarter in a row. Funds that show bigger positions include Tiger Management, Duquesne Family Office, Bridger Management, Coatue, and Tiger Global. It’s worth pointing out that some of this activity might not be because of open market buying, but perhaps because of corporate transactions. For instance, Tiger Global had a stake in Postmates, which Uber acquired during the quarter. Boston Scientific (BSX): Maverick, Glenview, Farallon, and Viking all boosted exposure to this industry giant. During the fourth quarter, shares fell from $42 down to $33 and it looks like funds took advantage of the sell-off. T-Mobile (TMUS): This is yet another stock that has seen accumulation multiple quarters in a row now. Shares of the wireless operator were purchased by Duquesne Family Office, Farallon Capital, Berkshire Hathaway, and Viking Global. The company completed its merger with Sprint and now rounds out the ‘big three’ in wireless, along with AT&T (T) and Verizon (VZ). And while these funds were buying TMUS, it should be noted that Warren Buffett just built a new stake in VZ.
4 Q4 2020 www.hedgefundwisdom.com
Hedge Fund Consensus Sell List
Consensus Decrease List
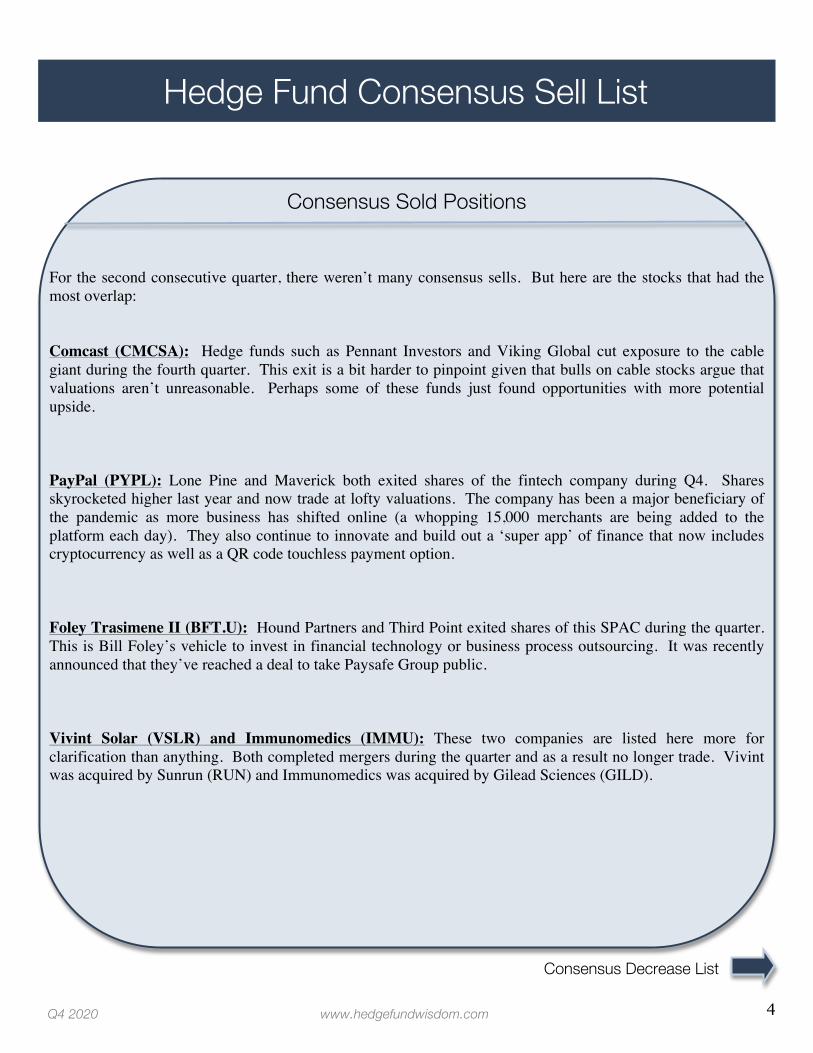
Consensus Sold Positions For the second consecutive quarter, there weren’t many consensus sells. But here are the stocks that had the most overlap: Comcast (CMCSA): Hedge funds such as Pennant Investors and Viking Global cut exposure to the cable giant during the fourth quarter. This exit is a bit harder to pinpoint given that bulls on cable stocks argue that valuations aren’t unreasonable. Perhaps some of these funds just found opportunities with more potential upside. PayPal (PYPL): Lone Pine and Maverick both exited shares of the fintech company during Q4. Shares skyrocketed higher last year and now trade at lofty valuations. The company has been a major beneficiary of the pandemic as more business has shifted online (a whopping 15,000 merchants are being added to the platform each day). They also continue to innovate and build out a ‘super app’ of finance that now includes cryptocurrency as well as a QR code touchless payment option. Foley Trasimene II (BFT.U): Hound Partners and Third Point exited shares of this SPAC during the quarter. This is Bill Foley’s vehicle to invest in financial technology or business process outsourcing. It was recently announced that they’ve reached a deal to take Paysafe Group public. Vivint Solar (VSLR) and Immunomedics (IMMU): These two companies are listed here more for clarification than anything. Both completed mergers during the quarter and as a result no longer trade. Vivint was acquired by Sunrun (RUN) and Immunomedics was acquired by Gilead Sciences (GILD).

5 Q4 2020 www.hedgefundwisdom.com
Hedge Fund Consensus Decrease List
Next: Hedge Fund Portfolios (Baupost Group)
Consensus Decreased Positions Amazon (AMZN): This is the third quarter in a row that hedge funds have trimmed AMZN exposure. And, like last quarter, it might simply be a case of taking some profits and reducing position sizes that have swelled. After all, AMZN was up over 70% last year. Funds that reduced exposure include Ruane Cunniff, Tiger, Maverick, Duquesne, Third Point, Viking, and Lone Pine. The company has benefited from the pandemic as more people are staying at home and utilizing e-commerce instead of visiting traditional brick and mortar retail. Not to mention, the company’s cloud computing division (AWS) has benefited from the work-from-home trend. In news since quarter-end, it was recently announced that founder Jeff Bezos would be stepping down from the CEO role and will transition to Chairman. Alphabet (GOOG): This is now the fourth consecutive quarter this stock lands on the decrease list. Funds that reduced exposure this time around include Hound, Baupost, Ruane Cunniff, Appaloosa, and Farallon. The Justice Department recently sued Google for abusing its dominance in online search and advertising. That said, the bull counterargument to this development is that any regulation could actually have the opposite intended effect: it could just entrench incumbents further and make it more expensive and harder for upstarts to compete. GOOG shares have continued to rally since news of the suit. Facebook (FB): Obviously the theme for this list is big tech. Shares of the social media giant were trimmed by the likes of Brave Warrior, Hound, Third Point, Farallon, Coatue, Ruane Cunniff, Lone Pine, and Tiger Global. The company, even at its behemoth scale, is still growing revenue year-over-year around 31%. They’ve recently been focused on turning their Instagram property into more of an e-commerce platform and are also investing in virtual reality and augmented reality. Fidelity National Information Services (FIS): Hound, Ruane Cunniff, Third Point, and Farallon all sold some shares of FIS during the fourth quarter. Wells Fargo (WFC): Berkshire Hathaway, Tiger, Maverick, and Appaloosa all reduced exposure to this huge moneycenter bank. Berkshire Hathaway is the most notable seller here as Warren Buffett drastically reduced his exposure.

6 Q4 2020 www.hedgefundwisdom.com
Per the Financial Times, Seth Klarman’s recent market commentary has mainly been centered on one entity: the Federal Reserve. He notes that, “[The Fed’s policies] have directly contributed to exceptionally benign market conditions where nearly everything is bid up while downside volatility is truncated. They have also kindled two dangerous ideas: that fiscal deficits don’t matter, and that no matter how much debt is outstanding, we can effortlessly, safely, and reliable pile on more. The market’s usual role in price discovery has effectively been suspended. When it comes to the value of cash flows, the vast and limitless future, yet to unfold, has gained considerable ground on the more firmly anchored present.”
He then succinctly summarizes: “With so much stimulus being deployed, trying to figure out if the economy is in recession is like trying to assess if you had a fever after you just took a large dose of aspirin. But as with frogs in water that is slowly being heated to a boil, investors are being conditioned not to recognize the danger.”
Turning to recent portfolio activity, Baupost
Group made a handful of new buys to round out the year. The most notable of these was Intel (INTC), as they accumulated shares in size and it’s now their third largest holding.
The company has seemingly fallen behind chip rivals in recent years, prompting activist investors to get involved. Dan Loeb’s Third Point took a stake and sent a letter to INTC’s board. The hedge fund mainly called for the company to explore strategic alternatives and to also re-examine its focus on producing chips in-house.
Many other companies like AMD and Apple outsource production of their chips to Taiwan Semiconductor (TSM), now the undisputed leader in process technology. Intel, on the other hand, had problems moving from a 14-nanometer chip to a 10-nanometer version and has since seen delays in its 7-nanometer chips. All the while, TSM is already producing 5-nm chips and recently announced huge capex investments to further advance its lead.
Intel just announced that Pet Gelsinger will be taking over as CEO, in what is being hailed by the tech industry as a savvy hire. Prior to joining Intel as CEO, Gelsinger was head of VMWare (VMW) and in the past was Intel’s chief technology officer. Given Baupost’s value orientation, this potential turnaround fits the bill. But to be clear, the company has a tall task ahead so execution will be incredibly important.
Baupost Group’s portfolio also shows a smattering of smaller positions in SPACs (special purpose acquisition companies), which have been all the rage as of late.
Lastly, keep in mind that Baupost also operates in distressed markets and other asset classes like private real estate.
Seth Klarman Graduated from Harvard Business School &
regarded as one of the best investors of all time
Focuses on distressed assets and value investing
View Seth Klarman’s Recommended Reading List
View Baupost Group’s Updated Portfolio on the Next Page
Key Takeaways New Posit ions: Intel (INTC) Marathon Petroleum (MPC) Advantage Solutions (ADV) Fidelity National Financial (FNF) Sold Out: HP Inc (HPQ) McKesson (MCK) HD Supply (HDS) Howmet Aerospace (HWM) Applied Materials (AMAT) RedBall Acquisition (RBAC.U)
Baupost Group

7
Baupost Group Fourth Quarter 2020 Portfolio:
Q4 2020 www.hedgefundwisdom.com
Rank Company Name Ticker Put/Call % of Portfolio Activity Value # of Shares
1 eBay Inc. EBAY 14.43% +3% $1,563,540,000 31,115,223 2 Liberty Global plc Class C LBTYK 11.91% Unchanged $1,290,235,000 54,555,407 3 Intel Corp. INTC 8.36% New $906,005,000 18,185,569 4 Qorvo Inc QRVO 6.81% +50% $738,255,000 4,440,095 5 Fox Corp Class A FOXA 5.96% -18% $646,084,000 22,186,950 6 Viasat Inc. VSAT 4.91% Unchanged $531,834,000 16,288,959 7 Micron Technology, Inc. MU 3.62% Unchanged $392,590,000 5,222,000 8 PG&E Corp PCG 3.53% Unchanged $381,993,000 30,657,601 9 Pershing Square Tontine PSTH 3.25% -27% $352,264,000 12,707,924
10 Translate Bio Inc TBIO 3.01% Unchanged $326,236,000 18,044,239 11 Marathon Petroleum Corp MPC 2.94% New $318,088,000 7,690,721 12 Liberty Sirius XM Group LSXMK 2.60% +12% $282,157,000 6,484,867 13 Facebook Inc FB 2.32% +63% $251,307,000 920,000 14 SS&C Technologies SSNC 2.22% +9% $240,496,000 3,305,784 15 Nexstar Media Group Inc NXST 2.10% Unchanged $227,661,000 2,085,000 16 Liberty Global plc Class A LBTYA 1.71% Unchanged $185,458,000 7,657,205 17 Atara Biotherapeutics Inc ATRA 1.65% -8% $178,809,000 9,108,988 18 ViacomCBS Inc. Class B VIAC 1.62% -75% $175,122,000 4,700,000 19 Fox Corp FOX 1.51% Unchanged $164,047,000 5,680,307 20 Advantage Solutions Inc. ADV 1.49% New $161,216,000 12,500,000 21 Theravance Biopharma Inc TBPH 1.43% Unchanged $155,224,000 8,735,168 22 Verint Systems Inc VRNT 1.42% -49% $153,842,000 4,495,270 23 Liberty Sirius XM Group LSXMA 1.40% +20% $151,165,000 3,500,000 24 Fidelity National Financial FNF 1.37% New $148,542,000 3,800,000 25 Alphabet Inc. Class C GOOG 1.29% -49% $139,415,000 79,580 26 Healthpeak Properties Inc PEAK 1.12% Unchanged $120,926,000 4,000,200 27 Colony Capital Inc CLNY 1.07% +7% $116,464,000 24,212,959 28 Veritiv Corp VRTV 0.68% Unchanged $74,105,000 3,564,439 29 Ajax I AJAX.U 0.57% New $62,050,000 5,000,000 30 RedBall Acquisition Corp. RBAC 0.50% New $53,906,000 4,950,000 31 Vesper Healthcare Acq VSPR 0.41% New $44,788,000 3,960,000 32 Avanti Acquisition Corp. AVAN.U 0.40% New $43,360,000 4,000,000 33 Reinvent Technology RTP.U 0.40% Unchanged $42,875,000 3,500,000 34 Horizon Acquisition Corp II HZON.U 0.35% New $37,590,000 3,500,000 35 Broadstone Acquisition BSN.U 0.29% Unchanged $31,155,000 2,970,000 36 TheravanceBiopharmaNotes TBPH 0.26% Unchanged $28,396,000 30,000,000 37 Trilogy Metals TMQ 0.22% Unchanged $24,365,000 12,182,568 38 Investindustrial Acquisition IIAC.U 0.20% New $21,588,000 2,100,000 39 RadiusGlobalInfrastructure RADI 0.18% New $19,292,000 1,501,342 40 PershingSqTontine Warrant PSTH/WS 0.17% Unchanged $18,667,000 1,944,444 41 Dragoneer Growth Opp DGNS 0.11% New $11,420,000 1,000,000 42 Reinvent Technology RTPZ.U 0.11% New $11,380,000 1,000,000 43 Vista Oil & Gas SAB de CV VIST 0.05% -56% $4,995,000 1,951,132 44 RedBallAcquisitionWarrant RBAC.WS 0.03% New $3,696,000 1,650,000 45 Vesper Healthcare Acq VSPRW 0.03% New $3,491,000 1,320,000
HP Inc HPQ Sold RedBall Acquisition Corp. RBAC.U Sold Howmet Aerospace Inc HWM Sold Applied Materials Inc. AMAT Sold Vesper Healthcare Acq VSPRU Sold McKesson Corp. MCK Sold HD Supply Holdings Inc HDS Sold

8 Q4 2020 www.hedgefundwisdom.com
After requesting confidential treatment from the SEC last quarter regarding a new stake he was building, Warren Buffett has revealed not one but two gigantic positions: Verizon (VZ) and Chevron (CVX). His VZ stake is now his sixth largest holding worth $8.6 billion while CVX is his ninth largest holding worth over $4 billion. Confidential treatment is when a manager privately discloses the holding to the regulator but does not publicly reveal the name of the company as they were still building a large position.
It’s unclear if both of these names were acquired in Q3 or Q4. Regardless, during the window where Buffett could have been buying, VZ was trading between $53 and $60 in Q3 and between $58 and $61 in Q4. However, VZ has currently been trading back down around the lower levels of the range thus far in 2021. So it will be interesting to see if Buffett boosts his allocation here even further in Q1 given where it’s trading.
So why did he buy it? Perhaps it’s just as simple as Berkshire has a lot of cash to park and he was looking for a stable place to put it with a solid dividend yield (around 4.5%) and a reasonable valuation (~11x consensus 2021 earnings estimates).
Maybe he views VZ as a utility, given the proliferation of smartphones (part of his Apple thesis) and increasing data consumption trends.
The wireless industry has consolidated to ‘the big three’ of VZ, AT&T (T) and T-Mobile (TMUS ~ which recently merged with Sprint). However, there is rampant competition for market share which primarily entices customers to switch via subsidized smartphone offers or lower monthly pricing. The downside is that switching costs are quite low for consumers, who can simply pop in a new SIM card into their smartphone, provided they aren’t in a contract with a provider already. That said, many providers often offer contract buyouts.
Competition has the potential to increase too, as Dish Network (DISH) builds out an offering and many cable companies are now offering wireless service also. Verizon sold access to its network to the likes of Spectrum Mobile (Charter Communications) and Xfinity Mobile (Comcast). This is potentially a double-edged sword, as it provides VZ with incremental revenue but also gives competitors footing.
Turning to CVX, it traded from $85 down to $67 during Q3 and between $63 and $94 in Q4, a much wider range. Today, CVX shares still trade at the high end of this range.
This move is also interesting considering Buffett hasn’t had exposure to oil & gas equities in a big way in a while. While oil’s future looks less certain longer-term with the proliferation and adoption of electric vehicles, Buffett’s big bet seems to indicate he doesn’t think an industry behemoth is going anywhere anytime soon. Additionally, the WSJ reported last month that ExxonMobil (XOM) and CVX held potential merger talks back at the onset of the pandemic.
Warren Buffett
Mentored by Benjamin Graham in the ways of value investing & one of the greatest
investors of all time
View Buffett’s Recommended Reading List
Berkshire Hathaway
View Berkshire Hathaway’s Updated Portfolio on the Next Page
Key Takeaways New Posit ions: Verizon (VZ) Chevron (CVX) Marsh & McLennan (MMC) EW Scripps (SSP) Sold Out: Pfizer (PFE) M&T Bank (MTB) Barrick Gold (GOLD) PNC Financial (PNC) JPMorgan Chase (JPM)
9
Berkshire Hathaway Fourth Quarter 2020 Portfolio:
Q4 2020 www.hedgefundwisdom.com
Rank Company Name Ticker Put/Call % of Portfolio Activity Value # of Shares
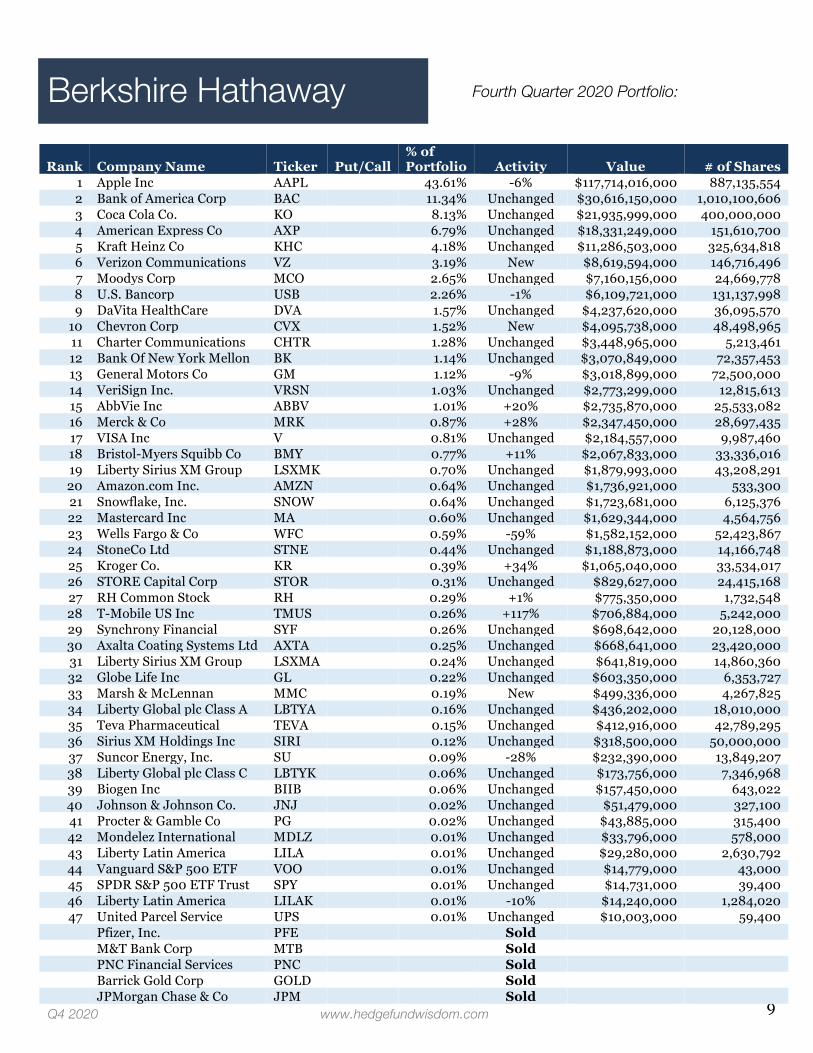
1 Apple Inc AAPL 43.61% -6% $117,714,016,000 887,135,554 2 Bank of America Corp BAC 11.34% Unchanged $30,616,150,000 1,010,100,606 3 Coca Cola Co. KO 8.13% Unchanged $21,935,999,000 400,000,000 4 American Express Co AXP 6.79% Unchanged $18,331,249,000 151,610,700 5 Kraft Heinz Co KHC 4.18% Unchanged $11,286,503,000 325,634,818 6 Verizon Communications VZ 3.19% New $8,619,594,000 146,716,496 7 Moodys Corp MCO 2.65% Unchanged $7,160,156,000 24,669,778 8 U.S. Bancorp USB 2.26% -1% $6,109,721,000 131,137,998 9 DaVita HealthCare DVA 1.57% Unchanged $4,237,620,000 36,095,570
10 Chevron Corp CVX 1.52% New $4,095,738,000 48,498,965 11 Charter Communications CHTR 1.28% Unchanged $3,448,965,000 5,213,461 12 Bank Of New York Mellon BK 1.14% Unchanged $3,070,849,000 72,357,453 13 General Motors Co GM 1.12% -9% $3,018,899,000 72,500,000 14 VeriSign Inc. VRSN 1.03% Unchanged $2,773,299,000 12,815,613 15 AbbVie Inc ABBV 1.01% +20% $2,735,870,000 25,533,082 16 Merck & Co MRK 0.87% +28% $2,347,450,000 28,697,435 17 VISA Inc V 0.81% Unchanged $2,184,557,000 9,987,460 18 Bristol-Myers Squibb Co BMY 0.77% +11% $2,067,833,000 33,336,016 19 Liberty Sirius XM Group LSXMK 0.70% Unchanged $1,879,993,000 43,208,291 20 Amazon.com Inc. AMZN 0.64% Unchanged $1,736,921,000 533,300 21 Snowflake, Inc. SNOW 0.64% Unchanged $1,723,681,000 6,125,376 22 Mastercard Inc MA 0.60% Unchanged $1,629,344,000 4,564,756 23 Wells Fargo & Co WFC 0.59% -59% $1,582,152,000 52,423,867 24 StoneCo Ltd STNE 0.44% Unchanged $1,188,873,000 14,166,748 25 Kroger Co. KR 0.39% +34% $1,065,040,000 33,534,017 26 STORE Capital Corp STOR 0.31% Unchanged $829,627,000 24,415,168 27 RH Common Stock RH 0.29% +1% $775,350,000 1,732,548 28 T-Mobile US Inc TMUS 0.26% +117% $706,884,000 5,242,000 29 Synchrony Financial SYF 0.26% Unchanged $698,642,000 20,128,000 30 Axalta Coating Systems Ltd AXTA 0.25% Unchanged $668,641,000 23,420,000 31 Liberty Sirius XM Group LSXMA 0.24% Unchanged $641,819,000 14,860,360 32 Globe Life Inc GL 0.22% Unchanged $603,350,000 6,353,727 33 Marsh & McLennan MMC 0.19% New $499,336,000 4,267,825 34 Liberty Global plc Class A LBTYA 0.16% Unchanged $436,202,000 18,010,000 35 Teva Pharmaceutical TEVA 0.15% Unchanged $412,916,000 42,789,295 36 Sirius XM Holdings Inc SIRI 0.12% Unchanged $318,500,000 50,000,000 37 Suncor Energy, Inc. SU 0.09% -28% $232,390,000 13,849,207 38 Liberty Global plc Class C LBTYK 0.06% Unchanged $173,756,000 7,346,968 39 Biogen Inc BIIB 0.06% Unchanged $157,450,000 643,022 40 Johnson & Johnson Co. JNJ 0.02% Unchanged $51,479,000 327,100 41 Procter & Gamble Co PG 0.02% Unchanged $43,885,000 315,400 42 Mondelez International MDLZ 0.01% Unchanged $33,796,000 578,000 43 Liberty Latin America LILA 0.01% Unchanged $29,280,000 2,630,792 44 Vanguard S&P 500 ETF VOO 0.01% Unchanged $14,779,000 43,000 45 SPDR S&P 500 ETF Trust SPY 0.01% Unchanged $14,731,000 39,400 46 Liberty Latin America LILAK 0.01% -10% $14,240,000 1,284,020 47 United Parcel Service UPS 0.01% Unchanged $10,003,000 59,400
Pfizer, Inc. PFE Sold M&T Bank Corp MTB Sold PNC Financial Services PNC Sold Barrick Gold Corp GOLD Sold JPMorgan Chase & Co JPM Sold

10 Q4 2020 www.hedgefundwisdom.com
Greenlight Capital returned 25% in the fourth quarter, bringing their 2020 year-end return to 5.2% with average exposure of 134% long and 70% short. They’ve returned 12.4% annualized, per their Q4 letter. They note that they’re “positioned for higher inflation, a strong housing market and rising interest rates.”
During the quarter, David Einhorn increased his position in Resideo Technologies (REZI) and wrote about their thesis: “REZI is a residential HVAC and security business that was spun out of Honeywell in 2018. REZI enjoys strong recurring revenues generated through replacement sales into a base of 150 million homes. However, execution errors and overspending following the spinout caused REZI’s margins to plummet. By the time the pandemic struck, REZI was already in the process of implementing a turnaround plan.” They see the company growing earnings from $2 per share to $3 in the coming years.
Two of Greenlight’s private investments also came public during the quarter: FuboTV (FUBO) and Danimer Scientific (DNMR). FUBO is a skinny
bundle streaming service focused on sports. It looks to primarily generate revenue via advertising and sports wagering. Short-sellers have recently placed the company under the microscope, claiming that the sports betting market is too small and they won’t be able to compete with more established players. Greenlight disagrees and sees the interactive nature of being able to constantly interact and wager on the sports content people are viewing leading to higher engagement, which in turns would lead to higher ad revenues.
Greenlight’s other previous private holding, DNMR, is a producer of Nodax, a biodegradable replacement for plastic that they think has a huge market opportunity.
Einhorn also notes in his letter that he’s covered his tech ‘bubble basket’ of short positions, taking a moderate loss.
The hedge fund also shows a new position in one of Chamath Palihapitiya’s Social Capital SPACs: IPOC. This entity has since announced a merger with Clover Health to take that entity public via ticker symbol CLOV.
There has also been some controversy surrounding the name. A short-seller report alleged that the company failed to disclose a Justice Department investigation when it went public examining its business practices. The report also claimed the company’s sales are being propelled by misleading marketing practices. It also suggests that Clover’s assistant software “deceives the healthcare system” as well as “poses a significant regulatory risk.” And since then, the company is now under investigation by the U.S. Securities and Exchange Commission.
David Einhorn Has returned 12.4% annualized or 1,683% cumulatively
since inception in 1996
Predicted & profited from the demise of Lehman Brothers
Author of Fooling Some of the People All of the Time
Greenlight Capital
Key Takeaways New Posit ions: Danimer Scientific (DNMR) FuboTV (FUBO) Concentrix (CNXC) CONSOL Energy (CEIX) ADT (ADT) Social Capital Hedosophia (IPOC) ~ now trades as Clover Health (CLOV) Sold Out: Intel (INTC) CONSOL Coal Resources (CCR) Ingredion (INGR)
View Greenlight Capital’s Updated Portfolio on the Next Page

11
Next Page: Lone Pine Capital
Greenlight Capital Fourth Quarter 2020 Portfolio:
Q4 2020 www.hedgefundwisdom.com
Rank Company Name Ticker Put/Call % of Portfolio Activity Value # of Shares
1 Green Brick Partners Inc GRBK 33.30% Unchanged $553,765,000 24,118,668 2 Brighthouse Financial Inc BHF 7.93% Unchanged $131,798,000 3,640,332 3 Aercap Holdings N.V. AER 6.37% -23% $105,877,000 2,322,890 4 Atlas Air Worldwide AAWW 5.67% +15% $94,250,000 1,728,102 5 Change Healthcare Inc CHNG 5.43% -9% $90,322,000 4,843,005 6 SPDR Gold Trust GLD 3.95% -3% $65,609,000 367,850 7 Chemours Co CC 3.87% -15% $64,385,000 2,597,249 8 Teck Resources Ltd TECK 3.40% +38% $56,615,000 3,119,330 9 Resideo Technologies Inc REZI 3.32% +20% $55,283,000 2,600,300
10 Danimer Scientific DNMR 2.44% New $40,566,000 1,725,500 11 NCR Corp. NCR 2.32% -27% $38,552,000 1,026,147 12 Gold Miners ETF GDX 2.10% Unchanged $34,907,000 969,100 13 CNX Resources CNX 2.08% +14% $34,664,000 3,209,685 14 FuboTV FUBO 2.05% New $34,101,000 1,217,872 15 Concentrix Corp. CNXC 1.99% New $33,052,000 334,882 16 CONSOL Energy Inc CEIX 1.74% New $28,887,000 4,006,560 17 Twitter Inc TWTR 1.59% Unchanged $26,398,000 487,500 18 Tesla Inc TSLA PUT 1.38% Unchanged $22,934,000 32,500 19 Crown Holdings Inc CCK 1.27% -1% $21,181,000 211,390 20 Synnex Corp SNX 0.98% -70% $16,268,000 199,753 21 Dillards Inc. DDS 0.87% +15% $14,510,000 230,134 22 ADT Inc ADT 0.85% New $14,183,000 1,806,800 23 Neubase Therapeutics NBSE 0.85% Unchanged $14,169,000 2,027,027 24 SocialCapitalHedosophiaIII IPOC 0.71% New $11,739,000 700,000 25 APi Group Corp APG 0.70% Unchanged $11,635,000 641,070 26 Jack In The Box, Inc JACK 0.68% -40% $11,229,000 121,000 27 EchoStar Corp. SATS 0.64% New $10,597,000 500,040 28 Sonos Inc SONO 0.51% New $8,514,000 364,000 29 AMERCO Inc UHAL 0.39% Unchanged $6,555,000 14,439 30 Nuvation Bio Inc NUVB 0.21% Unchanged $3,510,000 300,000 31 Intercept Pharmaceuticals ICPT 0.12% -18% $2,022,000 81,856 32 Aequi Acquisition Corp. ARBGU 0.12% New $2,020,000 200,000 33 Medicinova Inc MNOV 0.06% Unchanged $974,000 185,000 34 NewProvidence Acquisition NPA 0.06% New $950,000 70,000 35 Reinvent Technology RTP.U 0.04% Unchanged $612,000 50,000 36 Nuvation Bio Inc NUVB.WS 0.02% Unchanged $320,000 100,000
Intel Corp. INTC Sold Vapotherm Inc VAPO Sold PVH Corp PVH Sold Ingredion Inc. INGR Sold Graham Holdings, Inc. GHC Sold CryoLife, Inc. CRY Sold Amarin Corp. ADR AMRN Sold Kennedy-Wilson Holdings KW Sold Gulfport Energy Corp GPOR Sold CONSOL CoalResources LP CCR Sold

12 Q4 2020 www.hedgefundwisdom.com
Lone Pine Capital’s long-only fund was up 46% for 2020 and its long-short fund was up 30%, per Institutional Investor. Founder Steve Mandel made a very rare appearance recently with Family Centers as part of their Titan series to assist those most affected by COVID-19. In the fireside chat, he said that “We’re in a very unusual time in many respects. We’re in an extremely low interest rate environment, which creates a lot of economic distortion frankly. And it is beneficial to people like us and often hurts people who do not have capital to deploy. The level of innovation and the level of progress coming from new technology is just like we’ve never seen in the history of the world. The areas that we find the most interesting I would say
digital payments but this is accelerating rapidly and is both moving across the world and from consumer payments to business-to-business payments.” He also cited other trends like the unbanked entering the economy via Square’s Cash App (SQ is one of Lone Pine’s top 15 holdings).
Another area he said they’re focusing on is software: “You had a movement from physical software to SaaS models and that has changed not only the economics of that business but the ability to innovate faster. Software is infusing every aspect of society.” The third area of focus for Lone Pine is digital consumer. By this he means e-commerce broadly but also how we communicate, gaming, consumption of video, etc.
The fourth area Mandel touched on was biotech via targeted therapies and personalized medicine. He feels the latter will become standard: everybody will have a genetic profile that will determine pre-disposition to certain diseases. A handful of their new positions listed on the left are biotech plays and this is really the first time they’ve meaningfully built out positions in this sector.
He also touched on areas he’s not so fond of: “I would not want to own a mall. I would not want to be a cable channel without a lot of original content that people want to watch. Cord-cutting is not putting you in a good place. That doesn’t mean they can’t be reasonable investments, but they need to have a large margin of safety or a catalyst. Because many businesses that are unloved are unloved for a reason.”
Mandel also noted that he’s placed more and more emphasis on the quality of management over time. He said Lone Pine uses ex-journalists who ask tons of questions to former employees and partners to build a profile of what management is like. He really admires the founders of Walmart and Costco.
Stephen Mandel Seeks to identify companies with good
management teams that are trading below intrinsic value
Has returned 14.4% net of fees since inception
in 1998
Lone Pine Capital
Key Takeaways New Posit ions: Snap Inc (SNAP) Carvana (CVNA) Bilibili (BILI) Farfetch (FTCH) Fidelity National Info (FIS) Doordash (DASH) ~ IPO mongoDB (MDB) Blueprint Medicines (BPMC) Argenx (ARGX) Amicus Therapeutics (FOLD) Ascendis Pharma (ASND) Fate Therapeutics (FATE) Zymeworks (ZYME) Forma Therapeutics (FMTX) Sold Out: PayPal (PYPL) CapitalOne (COF) Transdigm Group (TDG) Booking Holdings (BKNG)
View Lone Pine Capital’s Updated Portfolio on the Next Page

13
Lone Pine Capital Fourth Quarter 2020 Portfolio:
Next Page: Appaloosa Management
Q4 2020 www.hedgefundwisdom.com
Rank Company Name Ticker Put/Call % of Portfolio Activity Value # of Shares
1 Shopify Inc SHOP 7.39% +4% $2,032,179,000 1,795,290 2 Coupa Software Inc COUP 5.20% -3% $1,430,439,000 4,220,706 3 Microsoft Corp. MSFT 5.10% -2% $1,404,025,000 6,312,495 4 Global Payments Inc. GPN 4.96% -1% $1,363,828,000 6,331,020 5 Netflix Inc NFLX 4.82% +9% $1,325,935,000 2,452,120 6 UnitedHealth Group Inc. UNH 4.05% -19% $1,115,169,000 3,180,020 7 Adobe Systems, Inc. ADBE 3.67% +20% $1,010,611,000 2,020,738 8 MercadoLibre Inc MELI 3.64% +180% $1,000,292,000 597,111 9 Snap Inc Class A SNAP 3.55% New $976,895,000 19,510,587
10 L Brands Inc LB 3.55% Unchanged $976,799,000 26,265,094 11 Facebook Inc FB 3.55% -39% $976,696,000 3,575,546 12 Mastercard Inc MA 3.53% +54% $970,662,000 2,719,397 13 Square Inc SQ 3.32% -22% $913,963,000 4,199,424 14 DocuSign Inc DOCU 3.28% -2% $901,665,000 4,056,072 15 DexCom Inc DXCM 3.05% +390% $838,454,000 2,267,809 16 Amazon.com Inc. AMZN 3.04% -24% $837,441,000 257,126 17 Atlassian Corp Plc TEAM 2.91% +4% $800,565,000 3,423,119 18 Match Group Inc. MTCH 2.89% -33% $796,330,000 5,267,083 19 Datadog Inc DDOG 2.54% +8% $697,950,000 7,090,101 20 Autodesk, Inc. ADSK 2.46% -24% $675,559,000 2,212,480 21 ServiceNow Inc NOW 2.42% -32% $666,343,000 1,210,586 22 Humana, Inc. HUM 2.25% -31% $618,809,000 1,508,296 23 Carvana Co CVNA 2.13% New $586,457,000 2,448,265 24 StoneCo Ltd STNE 1.94% -23% $534,441,000 6,368,457 25 Bilibili Inc BILI 1.87% New $514,674,000 6,004,127 26 Farfetch Ltd FTCH 1.87% New $514,600,000 8,064,560 27 Nuance Communications NUAN 1.44% +6% $397,242,000 9,009,792 28 Fidelity National Info FIS 1.44% New $396,075,000 2,799,907 29 Bill.com Holdings, Inc. BILL 1.37% +25% $377,929,000 2,768,707 30 DoorDash, Inc. DASH 1.17% New $322,177,000 2,256,931 31 MongoDB Inc MDB 1.15% New $315,895,000 879,832 32 Blueprint Medicines Corp BPMC 1.10% New $303,830,000 2,709,138 33 Howmet Aerospace Inc HWM 0.78% -5% $214,838,000 7,527,593 34 Argenx SE ADS ADR ARGX 0.57% New $157,708,000 536,259 35 Amicus Therapeutics Inc FOLD 0.56% New $154,213,000 6,678,788 36 Ascendis Pharma A/S ADR ASND 0.54% New $149,190,000 894,533 37 Snowflake, Inc. SNOW 0.31% -70% $85,000,000 302,060 38 Fate Therapeutics Inc FATE 0.29% New $80,352,000 883,666 39 Zymeworks Inc ZYME 0.17% New $46,160,000 976,735 40 Forma Therapeutics FMTX 0.10% New $27,920,000 800,000 41 XP Inc. XP 0.01% New $3,196,000 80,569
KE Holdings Inc. BEKE Sold Capital One Financial Corp COF Sold Booking Holdings Inc BKNG Sold PayPal Holdings Inc PYPL Sold TransDigm Group Inc TDG Sold Insulet Corp PODD Sold

14
Key Takeaways
New Posit ions: Occidental Petroleum (OXY) Energy Sector ETF (XLE) Qualcomm (QCOM) Macys (M) Carmax (KMX) Kohl’s (KSS) Enterprise Products Partners (EPD) Oil & Gas Exploration ETF (XOP) Sold Out: Altria (MO) Boston Scientific (BSX) AT&T (T)
Last month CNBC relayed comments from David Tepper, who warned investors to be cautious as signs of speculation abound. He said, “It was partyon.com in 1999 that screwed the shorts, and now it’s gang up Inc. It didn’t end well in 1999 when the dot-com bubble popped. Been there, done that; old scars.”
It seems as though Tepper is referring to the recent craze among retail investors that have plowed into highly shorted stocks such as Gamestop (GME), AMC (AMC), Blackberry (BB), and Nokia (NOK). His warning, of course, was prescient as GME has all but plummeted since its rocketship rise a month ago.
Tepper’s message is one of caution given that valuations are high and trading activity is frenzied. His main warning is that when things turn, they often do so very quickly.
In a separate conversation earlier in January, CNBC’s Jim Cramer noted that Tepper was ‘constructive’ on the market at the time because of the success of the COVID vaccines and ongoing
David Tepper
Has compounded 25% for investors over
17 years
Profiled in the book: The Alpha Masters
Q4 2020 www.hedgefundwisdom.com
support from the Federal Reserve. Cramer’s other takeaway from talking with Tepper was that as long as the Fed is sloshing liquidity around, it’s also hard to bet against the market overall.
So parsing his words between the two nuggets, it seems that Tepper is concerned about the signs of froth in certain areas of the market, while the argument can be made that things underlying the market like the economy and pandemic are slowly improving.
One of the pockets he seems to have found value in is energy. During the fourth quarter, he initiated stakes in Occidental Petroleum (OXY) as well as in exchange traded funds XLE and XOP. Tepper accumulated a sizable amount of OXY, as it’s now his 12th largest position.
Separately, there is also evidence that Tepper has been allocating capital to ‘re-opening’ plays, supporting his COVID vaccine optimism. He acquired shares of retailers such as Macy’s (M) and Kohl’s (KSS), as well as used automotive giant Carmax (KMX).
The thesis with these types of names is pretty straightforward: after vaccination, people won’t be cooped up in their homes as much in sweatpants and will want to dress to impress and socialize, so they’ll go out and buy new clothes, eat out more, travel, etc.
And while COVID has magnified inequities in society, overall savings rates have risen in the US as stimulus checks have been doled out and many people are spending less money on experiences than usual. So a reversion to the mean is likely and some analysts have postulated it could go a step further and become a ‘roaring 20s’ scenario given all the pent-up demand.
Appaloosa Management
View Appaloosa Management’s Updated Portfolio on the Next Page
15 Q4 2020 www.hedgefundwisdom.com
Appaloosa Management Fourth Quarter 2020 Portfolio:
Rank Company Name Ticker Put/Call % of Portfolio Activity Value # of Shares
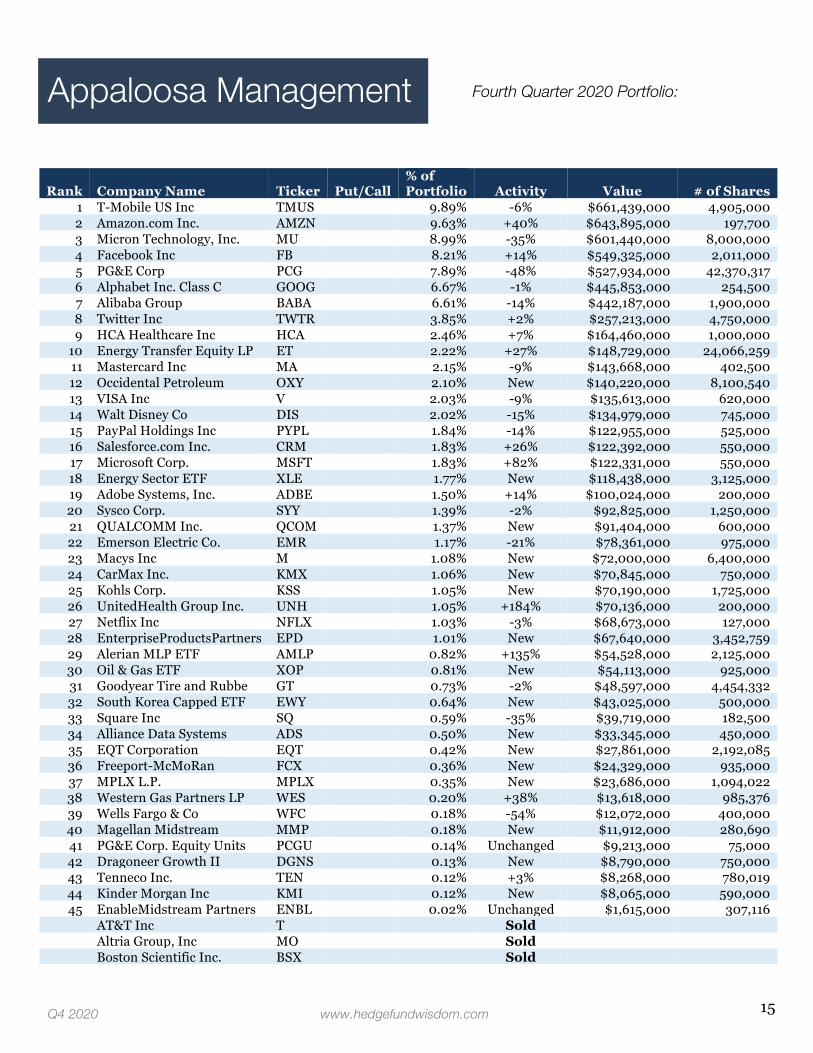
1 T-Mobile US Inc TMUS 9.89% -6% $661,439,000 4,905,000 2 Amazon.com Inc. AMZN 9.63% +40% $643,895,000 197,700 3 Micron Technology, Inc. MU 8.99% -35% $601,440,000 8,000,000 4 Facebook Inc FB 8.21% +14% $549,325,000 2,011,000 5 PG&E Corp PCG 7.89% -48% $527,934,000 42,370,317 6 Alphabet Inc. Class C GOOG 6.67% -1% $445,853,000 254,500 7 Alibaba Group BABA 6.61% -14% $442,187,000 1,900,000 8 Twitter Inc TWTR 3.85% +2% $257,213,000 4,750,000 9 HCA Healthcare Inc HCA 2.46% +7% $164,460,000 1,000,000
10 Energy Transfer Equity LP ET 2.22% +27% $148,729,000 24,066,259 11 Mastercard Inc MA 2.15% -9% $143,668,000 402,500 12 Occidental Petroleum OXY 2.10% New $140,220,000 8,100,540 13 VISA Inc V 2.03% -9% $135,613,000 620,000 14 Walt Disney Co DIS 2.02% -15% $134,979,000 745,000 15 PayPal Holdings Inc PYPL 1.84% -14% $122,955,000 525,000 16 Salesforce.com Inc. CRM 1.83% +26% $122,392,000 550,000 17 Microsoft Corp. MSFT 1.83% +82% $122,331,000 550,000 18 Energy Sector ETF XLE 1.77% New $118,438,000 3,125,000 19 Adobe Systems, Inc. ADBE 1.50% +14% $100,024,000 200,000 20 Sysco Corp. SYY 1.39% -2% $92,825,000 1,250,000 21 QUALCOMM Inc. QCOM 1.37% New $91,404,000 600,000 22 Emerson Electric Co. EMR 1.17% -21% $78,361,000 975,000 23 Macys Inc M 1.08% New $72,000,000 6,400,000 24 CarMax Inc. KMX 1.06% New $70,845,000 750,000 25 Kohls Corp. KSS 1.05% New $70,190,000 1,725,000 26 UnitedHealth Group Inc. UNH 1.05% +184% $70,136,000 200,000 27 Netflix Inc NFLX 1.03% -3% $68,673,000 127,000 28 EnterpriseProductsPartners EPD 1.01% New $67,640,000 3,452,759 29 Alerian MLP ETF AMLP 0.82% +135% $54,528,000 2,125,000 30 Oil & Gas ETF XOP 0.81% New $54,113,000 925,000 31 Goodyear Tire and Rubbe GT 0.73% -2% $48,597,000 4,454,332 32 South Korea Capped ETF EWY 0.64% New $43,025,000 500,000 33 Square Inc SQ 0.59% -35% $39,719,000 182,500 34 Alliance Data Systems ADS 0.50% New $33,345,000 450,000 35 EQT Corporation EQT 0.42% New $27,861,000 2,192,085 36 Freeport-McMoRan FCX 0.36% New $24,329,000 935,000 37 MPLX L.P. MPLX 0.35% New $23,686,000 1,094,022 38 Western Gas Partners LP WES 0.20% +38% $13,618,000 985,376 39 Wells Fargo & Co WFC 0.18% -54% $12,072,000 400,000 40 Magellan Midstream MMP 0.18% New $11,912,000 280,690 41 PG&E Corp. Equity Units PCGU 0.14% Unchanged $9,213,000 75,000 42 Dragoneer Growth II DGNS 0.13% New $8,790,000 750,000 43 Tenneco Inc. TEN 0.12% +3% $8,268,000 780,019 44 Kinder Morgan Inc KMI 0.12% New $8,065,000 590,000 45 EnableMidstream Partners ENBL 0.02% Unchanged $1,615,000 307,116
AT&T Inc T Sold Altria Group, Inc MO Sold Boston Scientific Inc. BSX Sold

16
View Pershing Square’s Updated Portfolio on the Next Page
Key Takeaways New Posit ions: None Sold Out: None
Pershing Square finished 2020 up 70.2% net of fees. This performance can be attributed to two savvy maneuvers: instead of selling his portfolio at the onset of the pandemic, Bill Ackman purchased cheap hedges that paid off big as volatility spiked, and then he stepped in to buy shares of solid companies as the carnage continued. During the fourth quarter to round out the year, Ackman largely left his portfolio unchanged.
In activity since the end of 2020, Ackman boosted his exposure to real estate play Howard Hughes (HHC). Increasing his stake by 23% and now holding over $1 billion worth of shares, Ackman is the largest investor in the company with a 24.5% ownership stake and is Chairman of the board. His recent buys total over 2.5 million shares, with around 75% of those shares being purchased on the open market, with the other 25% coming as a result of options being exercised.
This latest investment comes basically a year after Ackman stepped in to buy 10 million shares of HHC at the beginning of the pandemic when the market plunged and shares traded around $50 (compared to around $99 now). So even after seeing his investment from 2020 double, he is still allocating more capital to the company. But despite this being a sizable investment, this is still Ackman’s smallest US equity holding.
Howard Hughes develops master planned communities and has announced various real estate developments in areas with prime locations or in places that are benefiting from increased migration.
If you want a deeper look at the company, HHC was featured in the investment thesis summary section of the Q1 2020 issue of HFW.
Recall as well that everyone is still waiting to see what happens with Ackman’s new SPAC: Pershing Square Tontine Holdings (PSTH). It has yet to announce a merger with another entity to bring a company public. As such, rumors abound as to which ‘unicorn’ company he is targeting.
Regardless, many investors have placed faith in Ackman despite the fact that the investment hasn’t even been selected. Last issue noted how Seth Klarman’s Baupost Group is one such investor.
Shares of the SPAC have already risen from $22 to around $33, all on the hopes that Ackman will select a highly desireable and successful company that could propel shares even higher.
Pershing’s annual investor update also touched on their thesis on Hilton (HLT): “Hilton is in the early stages of a multi-year recovery which we believe will deliver long-term earnings meaningfully greater than pre-2020 levels.” The company of course been battered by the pandemic and lack of travel, but HLT fortified its balance sheet and only saw modest cash burn. Pershing sees market share increasing as independent hotels seek to partner with global brands and thinks HLT can increase margins and generate solid cashflow that can be returned to shareholders.
Lastly, keep in mind that Pershing also owns preferred securities in Fannie Mae and Freddie Mac that they aren’t required to disclose in filings. Pershing’s update notes, “We continue to view Fannie and Freddie as valuable perpetual options on their eventual exit from conservatorship due to their widely acknowledged irreplaceable role in U.S. housing finance.”
Check out Ackman’s recommended
reading list
Has generated a compound annual return of 14.3% versus 9.1% for the S&P over the
same timeframe
Bill Ackman
Q4 2020 www.hedgefundwisdom.com
Pershing Square Capital

17
Pershing Square
Next Page: Maverick Capital
Fourth Quarter 2020 Portfolio:
Q4 2020 www.hedgefundwisdom.com
Rank Company Name Ticker Put/Call % of Portfolio Activity Value # of Shares
1 Lowes Companies, Inc. LOW 19.88% < -1% $1,988,332,000 12,387,587 2 Chipotle Mexican Grill, Inc. CMG 16.10% Unchanged $1,610,292,000 1,161,232 3 Restaurant Brands QSR 15.30% < -1% $1,530,104,000 25,038,527 4 Hilton Worldwide HLT 14.85% < -1% $1,485,344,000 13,350,206 5 Agilent Technologies Inc A 14.49% < -1% $1,449,856,000 12,236,107 6 Starbucks Corp. SBUX 10.77% < -1% $1,077,293,000 10,070,042 7 Howard Hughes Corp HHC 8.62% Unchanged $861,758,000 10,918,008

18
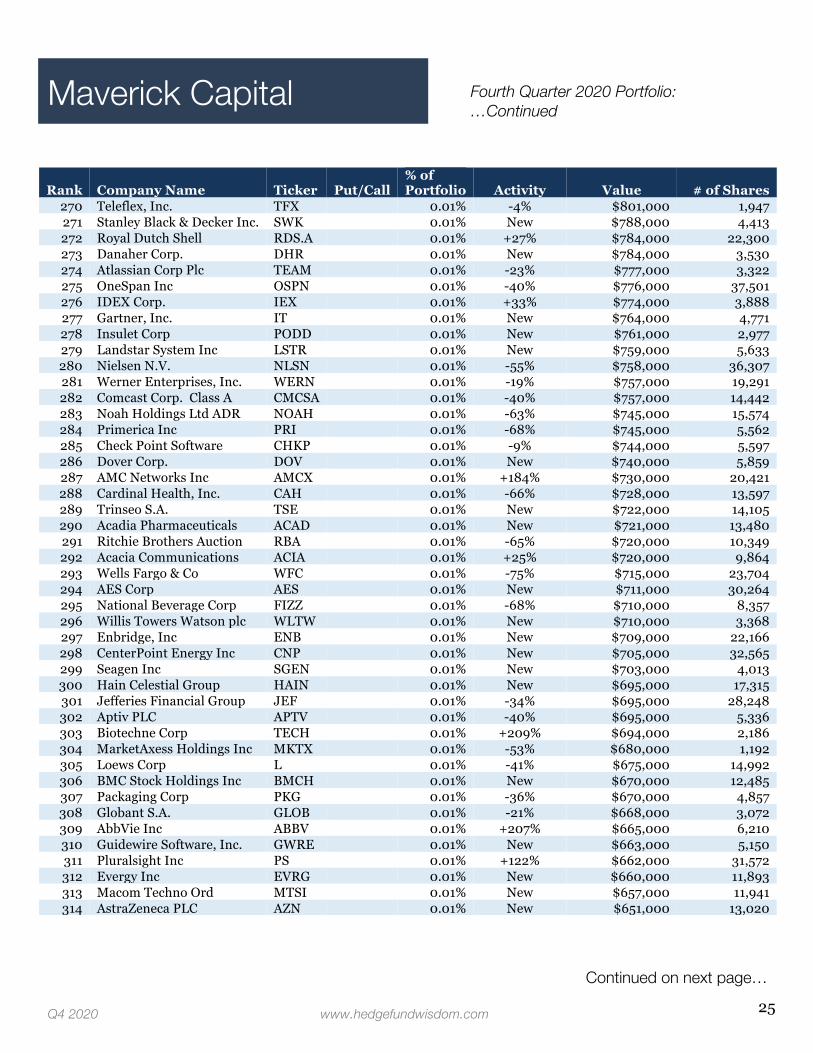
Maverick Capital shows a ‘new’ stake in Seer (SEER), which recently came public, but in reality they invested back when the company was still private via Maverick Ventures. This is now Maverick’s fourth largest position. The company is focused on “translating proteome insights to advance human health.”
This transaction in general is representative of two trends among hedge funds in recent years: 1) Funds increasingly starting venture capital arms to get in growth companies at an earlier stage to capture more of the return, and 2) An increasing focus on biotech as a sector. And if you think about it, both venture capital and biotech have some similarities in regards to risk/reward and how capital is allocated: bet sizes are often smaller given higher risk of failure, but the payoffs from winners are potentially much, much larger. As highlighted a few pages prior, Lone Pine Capital has been expanding its biotech investments as well.
Maverick’s venture fund is an evergreen fund, i.e. it doesn’t have a finite life and invests with
Key Takeaways
New Posit ions: Seer Inc (SEER) ~ IPO MGM Resorts (MGM) Ajax (AJAX.U) ProLogis (PLD) Chart Industries (GTLS) Wynn Resorts (WYNN) JAWS Spitfire Acquisition (SPFR.U) Installed Building Products (IBP) Sold Out: Dollar Tree (DLTR) Global Payments (GPN) T-Mobile US (TMUS)
an infinite time horizon, which is pretty rare. In the healthcare arena, they’re looking at investments which can do one of three things: 1) improve quality of life or satisfaction of care, 2) reduce cost, or 3) raise the health of overall populations.
Maverick’s top holding is now Facebook (FB) after they boosted exposure by 20% in the quarter. The social media giant’s ad business has been performing well as the company grew revenue 31% year-over-year.
They’ve also been adding more e-commerce features to their Instagram platform. There is a lot of potential here to capture more ad dollars to drive commerce or to slice a further piece of revenue from facilitating payments. It looks like Instagram’s take rate will be around 5% when a buyer checks out directly on the platform instead of clicking a link to checkout elsewhere. This is about half of what comparable players like eBay and Etsy charge sellers to utilize their platforms. Instagram is waiving this fee until July due to the pandemic, so look for more clarity on uptake/adoption later in the year once the fee is live.
On the negative side, there’s uncertainty around how much Apple’s privacy focused IDFA changes will impact targeted advertising on Facebook’s apps. Other concerns include potential regulation as well as loss of monthly active users and engagement to other platforms like TikTok and whatever else may emerge in the future.
In short selling activity, Maverick was short 0.91% of Klepierre in France as of February 1st.
Lastly, keep in mind that Maverick now runs quantitative strategies as well, which explains all of the tiny positions over the next few pages. Their main funds are comprised of the larger holdings.
View Maverick Capital’s Updated Portfolio on the Next Page
Lee Ainslie
Q4 2020 www.hedgefundwisdom.com
Maverick Capital
14.0% annualized returns since inception in 1995
Likes to compare a company’s enterprise
value to sustainable free cash flow

19
Maverick Capital Fourth Quarter 2020 Portfolio:
Continued on next page…
Q4 2020 www.hedgefundwisdom.com
Rank Company Name Ticker Put/Call % of Portfolio Activity Value # of Shares
1 Facebook Inc FB 7.09% +19% $442,777,000 1,620,942 2 DowDuPont Inc DD 5.54% -20% $346,036,000 4,866,206 3 Microsoft Corp. MSFT 5.13% +19% $320,131,000 1,439,309 4 Seer, Inc. SEER 4.47% New $279,201,000 5,425,513 5 Applied Materials Inc. AMAT 4.30% +248% $268,853,000 3,115,330 6 Lam Research Corp. LRCX 4.29% -23% $267,800,000 567,048 7 FleetCor Technologies Inc FLT 4.28% +78% $267,247,000 979,538 8 Alphabet Inc. Class C GOOG 4.04% +7% $252,332,000 144,035 9 Alibaba Group BABA 3.46% +15% $216,219,000 929,056
10 Amazon.com Inc. AMZN 2.70% -28% $168,911,000 51,862 11 TG Therapeutics Inc TGTX 2.67% -27% $166,571,000 3,202,061 12 1Life Healthcare Inc. ONEM 2.56% -7% $159,812,000 3,661,204 13 MGM Resorts MGM 2.53% New $158,106,000 5,017,643 14 Netflix Inc NFLX 2.51% -2% $156,598,000 289,604 15 Crown Holdings CCK 2.44% -31% $152,139,000 1,518,357 16 Atara Biotherapeutics Inc ATRA 2.30% +9% $143,781,000 7,324,539 17 Adobe Systems, Inc. ADBE 2.16% +348% $134,963,000 269,861 18 Alnylam Pharmaceuticals ALNY 2.05% +2% $127,956,000 984,502 19 American Express Co AXP 2.00% -3% $125,189,000 1,035,389 20 Humana, Inc. HUM 1.88% -57% $117,469,000 286,322 21 Nektar Therapeutics, Inc. NKTR 1.81% +17% $113,146,000 6,655,625 22 LivaNova PLC LIVN 1.77% -10% $110,499,000 1,668,922 23 Perspecta Inc PRSP 1.76% Unchanged $109,890,000 4,563,535 24 Blackstone Group Inc BX 1.49% -12% $92,897,000 1,433,368 25 Gamestop Corp., Class A GME 1.41% +164% $87,768,000 4,658,607 26 NIKE Inc. NKE 1.32% -12% $82,624,000 584,036 27 XP Inc. XP 1.22% Unchanged $76,008,000 1,916,006 28 Frontdoor Inc FTDR 1.19% -7% $74,448,000 1,482,730 29 Ajax I AJAX.U 1.01% New $62,774,000 5,058,302 30 ProLogis, Inc. PLD 0.83% New $51,589,000 517,654 31 Logitech International LOGI 0.77% -62% $48,238,000 496,583 32 Beacon Roofing Supply Inc BECN 0.76% -2% $47,369,000 1,178,618 33 GoPro Inc GPRO 0.63% -36% $39,585,000 4,780,808 34 Dragoneer Growth DGNR.U 0.60% Unchanged $37,329,000 2,668,256 35 Chart Industries Inc GTLS 0.55% New $34,175,000 290,133 36 Wynn Resorts Ltd WYNN 0.55% New $34,049,000 301,777 37 JAWS Spitfire Acquisition SPFR.U 0.53% New $33,150,000 3,000,000 38 Installed Building Products IBP 0.52% New $32,375,000 317,618 39 DXC Technology Company DXC 0.48% -63% $30,123,000 1,169,826 40 SQZ Biotechnologies Co SQZ 0.43% New $27,124,000 935,971 41 Uber Technologies Inc UBER 0.43% -32% $26,958,000 528,579 42 Avantor Inc AVTR 0.42% -37% $26,019,000 924,298 43 Oak Street Health, Inc. OSH 0.39% Unchanged $24,464,000 400,000 44 DoorDash, Inc. DASH 0.28% New $17,665,000 135,655 45 KKR & Co Inc KKR 0.25% -84% $15,788,000 389,930

20
Maverick Capital
Continued on next page…
Q4 2020 www.hedgefundwisdom.com
Fourth Quarter 2020 Portfolio: …Continued
Rank Company Name Ticker Put/Call % of Portfolio Activity Value # of Shares
46 Dragoneer GrowthII DGNS 0.23% New $14,238,000 1,246,750 47 Population Health PHICU 0.20% New $12,502,000 1,196,400 48 Target Corp. TGT 0.11% -10% $7,134,000 40,411 49 Abbott Laboratories ABT 0.11% +199% $6,760,000 61,743 50 Campbell Soup Co. CPB 0.11% Unchanged $6,624,000 137,003 51 Crocs Inc CROX 0.11% New $6,618,000 105,614 52 e.l.f. Beauty Inc ELF 0.11% -20% $6,609,000 262,363 53 Honeywell International HON 0.10% -19% $6,463,000 30,384 54 Jack In The Box, Inc JACK 0.10% +637% $6,239,000 67,231 55 Fortinet Inc FTNT 0.10% +45% $6,203,000 41,760 56 V.F. Corp VFC 0.09% +11% $5,898,000 69,059 57 Galecto, Inc. GLTO 0.09% New $5,846,000 490,452 58 Diageo Plc ADR DEO 0.09% +10% $5,742,000 36,158 59 McDonalds Corp. MCD 0.09% -51% $5,714,000 26,627 60 CM Life Sciences, Inc. CMLF 0.09% New $5,392,000 488,389 61 Nordstrom Inc. JWN 0.09% New $5,363,000 171,835 62 Brown-Forman Corp BF.B 0.09% -33% $5,323,000 67,018 63 Tapestry Inc TPR 0.08% New $5,232,000 168,329 64 Ubiquiti Inc UI 0.08% -39% $5,125,000 18,402 65 HP Inc HPQ 0.08% -31% $4,971,000 202,149 66 Merck & Co MRK 0.08% +162% $4,846,000 59,243 67 Signet Jewelers Ltd SIG 0.07% -14% $4,622,000 169,493 68 Micron Technology, Inc. MU 0.07% +52% $4,568,000 60,766 69 Ashland Inc. ASH 0.07% +4445% $4,532,000 57,221 70 Etsy Inc ETSY 0.07% +41589% $4,524,000 25,430 71 Zebra Technologies Corp ZBRA 0.07% +80% $4,445,000 11,565 72 Guess Inc GES 0.07% -25% $4,421,000 195,450 73 McCormick & Co MKC 0.07% -43% $4,064,000 42,510 74 Starbucks Corp. SBUX 0.06% +161% $4,046,000 37,819 75 Darling Ingredients Inc DAR 0.06% -37% $4,010,000 69,526 76 Broadcom Ltd AVGO 0.06% -51% $3,830,000 8,748 77 Ralph Lauren Corp RL 0.06% +278% $3,668,000 35,360 78 Urban Outfitters Inc. URBN 0.06% +939% $3,639,000 142,135 79 J & J Snack Foods Corp. JJSF 0.06% -20% $3,635,000 23,396 80 Leggett & Platt Inc. LEG 0.06% +25% $3,496,000 78,916 81 Shake Shack Inc SHAK 0.06% +118% $3,492,000 41,191 82 Capri Holdings CPRI 0.05% +346% $3,374,000 80,323 83 Raytheon Technologies RTX 0.05% New $3,364,000 47,047 84 Energizer Holdings Inc ENR 0.05% +2% $3,353,000 79,498 85 Five Below Inc FIVE 0.05% +5% $3,310,000 18,917 86 Xilinx, Inc XLNX 0.05% New $3,131,000 22,084 87 Cal-Maine Foods Inc CALM 0.05% -9% $3,117,000 83,033 88 Monster Beverage Corp. MNST 0.05% New $3,105,000 33,579 89 Jack Henry & Associates JKHY 0.05% +23% $3,102,000 19,150 90 Netgear, Inc. NTGR 0.05% -16% $3,058,000 75,260

21
Maverick Capital
Continued on next page…
Q4 2020 www.hedgefundwisdom.com
Fourth Quarter 2020 Portfolio: …Continued
Rank Company Name Ticker Put/Call % of Portfolio Activity Value # of Shares
91 Sysco Corp. SYY 0.05% -20% $2,993,000 40,309 92 NVIDIA Corp. NVDA 0.05% +1468% $2,990,000 5,725 93 Parker-Hannifin Corp. PH 0.05% -55% $2,964,000 10,879 94 Lululemon Athletica inc. LULU 0.05% +101% $2,921,000 8,392 95 Pultegroup Inc PHM 0.05% +2% $2,902,000 67,305 96 Dominion Energy Inc D 0.05% +76% $2,896,000 38,513 97 Tractor Supply Company TSCO 0.05% New $2,884,000 20,512 98 United Rentals, Inc. URI 0.05% -16% $2,873,000 12,389 99 Steel Dynamics, Inc. STLD 0.05% +4% $2,833,000 76,829
100 ConAgra Brands Inc CAG 0.04% +206% $2,793,000 77,037 101 Boston Beer Inc Class A SAM 0.04% -48% $2,778,000 2,794 102 Lear Corp LEA 0.04% +2% $2,768,000 17,405 103 Fastenal Co. FAST 0.04% +84% $2,727,000 55,851 104 Skyworks Solutions, Inc. SWKS 0.04% -54% $2,695,000 17,625 105 HCA Healthcare Inc HCA 0.04% -54% $2,684,000 16,322 106 Caleres Inc CAL 0.04% -30% $2,683,000 171,408 107 Super Micro Computer Inc SMCI 0.04% Unchanged $2,599,000 82,089 108 Container Store TCS 0.04% +803% $2,537,000 265,975 109 Boston Scientific Inc. BSX 0.04% +9% $2,518,000 70,041 110 Dollar General Corp. DG 0.04% New $2,516,000 11,964 111 General Motors Co GM 0.04% New $2,474,000 59,416 112 Castlight Health inc. CSLT 0.04% Unchanged $2,446,000 1,881,640 113 Petmed Express Inc PETS 0.04% New $2,446,000 76,310 114 SeaWorld Entertainment SEAS 0.04% -46% $2,444,000 77,351 115 Walmart Inc WMT 0.04% New $2,426,000 16,829 116 Hanesbrands, Inc. HBI 0.04% +1364% $2,412,000 165,466 117 ArmstrongWorldIndustries AWI 0.04% +32% $2,411,000 32,405 118 Monro Muffler Brake, Inc. MNRO 0.04% New $2,393,000 44,890 119 CACI International Inc CACI 0.04% +32% $2,364,000 9,482 120 Best Buy Co., Inc. BBY 0.04% +22% $2,330,000 23,348 121 Synchrony Financial SYF 0.04% -38% $2,296,000 66,151 122 Alcoa Corp AA 0.04% +23% $2,279,000 98,870 123 Illinois Tool Works Inc ITW 0.04% +247% $2,266,000 11,114 124 Ethan Allen Interiors, Inc. ETH 0.04% New $2,246,000 111,123 125 Intuit, Inc. INTU 0.04% +392% $2,236,000 5,886 126 Fossil Group Inc. FOSL 0.04% -18% $2,232,000 257,400 127 Nucor Corp NUE 0.04% New $2,211,000 41,569 128 Axalta Coating Systems Ltd AXTA 0.03% +43% $2,165,000 75,847 129 BlackRock Inc. Class A BLK 0.03% +2258% $2,127,000 2,948 130 Scotts Miracle-Gro Co SMG 0.03% -15% $2,061,000 10,349 131 Brunswick Corp. BC 0.03% -46% $2,005,000 26,294 132 3M Co MMM 0.03% New $1,983,000 11,346 133 Zynga, Inc. ZNGA 0.03% -94% $1,979,000 200,468 134 Abiomed Inc ABMD 0.03% +137% $1,961,000 6,048

22
Maverick Capital
Continued on next page…
Q4 2020 www.hedgefundwisdom.com
Fourth Quarter 2020 Portfolio: …Continued
Rank Company Name Ticker Put/Call % of Portfolio Activity Value # of Shares
135 Eaton Corp ETN 0.03% -55% $1,896,000 15,780 136 Newell Brands Inc NWL 0.03% -72% $1,896,000 89,318 137 FMC Corp FMC 0.03% New $1,896,000 16,493 138 Red Robin Gourmet RRGB 0.03% -12% $1,883,000 97,941 139 Arista Networks Inc ANET 0.03% -22% $1,854,000 6,381 140 Graco Inc. GGG 0.03% +22% $1,854,000 25,622 141 Medtronic Plc MDT 0.03% New $1,853,000 15,816 142 General Electric Co GE 0.03% -67% $1,837,000 170,097 143 Goldman Sachs Group Inc GS 0.03% -38% $1,832,000 6,946 144 ExxonMobil Corp XOM 0.03% New $1,827,000 44,333 145 Whirlpool Corp WHR 0.03% +19% $1,826,000 10,115 146 Ollies Bargain Outlet OLLI 0.03% New $1,812,000 22,157 147 DaVita HealthCare DVA 0.03% -44% $1,803,000 15,357 148 Cracker Barrel Old Country CBRL 0.03% -38% $1,779,000 13,482 149 Garmin Ltd GRMN 0.03% New $1,767,000 14,767 150 FLIR Systems Inc FLIR 0.03% +302% $1,761,000 40,185 151 Sunrun Inc RUN 0.03% New $1,758,000 25,332 152 Cintas Corporation CTAS 0.03% -41% $1,746,000 4,939 153 American Eagle Outfitters AEO 0.03% -16% $1,713,000 85,340 154 AIG AIG 0.03% +549% $1,689,000 44,613 155 Synopsys Inc. SNPS 0.03% +101% $1,686,000 6,503 156 Williams-Sonoma Inc. WSM 0.03% +660% $1,672,000 16,422 157 PVH Corp PVH 0.03% -14% $1,669,000 17,778 158 Builders FirstSource Inc BLDR 0.03% +6% $1,658,000 40,625 159 Burlington Stores Inc BURL 0.03% New $1,650,000 6,310 160 Autoliv Inc ALV 0.03% New $1,632,000 17,718 161 Taylor Morrison Home TMHC 0.03% -20% $1,624,000 63,314 162 Avanos Medical Inc AVNS 0.03% New $1,623,000 35,372 163 Euronet Worldwide Inc. EEFT 0.03% New $1,621,000 11,184 164 Viatris Inc VTRS 0.03% -36% $1,607,000 85,771 165 DocuSign Inc DOCU 0.03% New $1,591,000 7,158 166 Flowers Foods FLO 0.03% -32% $1,565,000 69,143 167 Maxim Integrated MXIM 0.03% -71% $1,564,000 17,646 168 Pentair Plc PNR 0.02% -7% $1,555,000 29,299 169 Square Inc SQ 0.02% New $1,548,000 7,111 170 Ecolab Inc. ECL 0.02% -55% $1,538,000 7,110 171 Pioneer Natural Resources PXD 0.02% +624% $1,523,000 13,374 172 Borg Warner Inc BWA 0.02% -64% $1,499,000 38,787 173 Delta Air Lines Inc. DAL 0.02% New $1,495,000 37,183 174 Jazz Pharmaceuticals plc JAZZ 0.02% New $1,494,000 9,049 175 Simpson Manufacturing Co SSD 0.02% +35% $1,473,000 15,761 176 Rockwell Automation, Inc. ROK 0.02% New $1,450,000 5,783 177 Church & Dwight Co., Inc. CHD 0.02% -67% $1,446,000 16,579 178 Childrens Place Inc PLCE 0.02% New $1,433,000 28,607 179 EOG Resources Inc EOG 0.02% -30% $1,430,000 28,681

23
Maverick Capital
Q4 2020 www.hedgefundwisdom.com
Fourth Quarter 2020 Portfolio: …Continued
Continued on next page…
Rank Company Name Ticker Put/Call % of Portfolio Activity Value # of Shares
180 Crowdstrike Holdings Inc CRWD 0.02% New $1,427,000 6,737 181 First American Corp FAF 0.02% -25% $1,424,000 27,573 182 F5 Networks Inc FFIV 0.02% +241% $1,415,000 8,043 183 Centene Corp CNC 0.02% -90% $1,404,000 23,381 184 Bristol-Myers Squibb Co BMY 0.02% +215% $1,399,000 22,549 185 Ally Financial Inc ALLY 0.02% -1% $1,395,000 39,112 186 Sealed Air Corp. SEE 0.02% -50% $1,394,000 30,433 187 VISA Inc V 0.02% -8% $1,360,000 6,216 188 Ryder System Inc. R 0.02% +18% $1,358,000 21,985 189 Twilio Inc TWLO 0.02% +31% $1,352,000 3,995 190 Bank of America Corp BAC 0.02% +10% $1,331,000 43,904 191 Medifast Inc MED 0.02% -22% $1,330,000 6,776 192 Ross Stores Inc ROST 0.02% New $1,320,000 10,748 193 Five9 Inc FIVN 0.02% -39% $1,317,000 7,553 194 General Mills Co. GIS 0.02% New $1,314,000 22,344 195 Synaptics Inc SYNA 0.02% -57% $1,311,000 13,601 196 Kadmon Holdings Inc KDMN 0.02% New $1,298,000 312,877 197 Helen Of Troy Ltd. HELE 0.02% New $1,289,000 5,802 198 LGI Homes Inc LGIH 0.02% +8% $1,279,000 12,083 199 Air Products & Chemicals APD 0.02% -96% $1,261,000 4,614 200 Toro Co TTC 0.02% New $1,260,000 13,284 201 Cigna Holding Co CI 0.02% +80% $1,260,000 6,054 202 Envestnet Inc ENV 0.02% -10% $1,245,000 15,131 203 Old Dominion Freight Line ODFL 0.02% -38% $1,222,000 6,262 204 Ulta Beauty Inc ULTA 0.02% +4411% $1,205,000 4,195 205 Okta Inc OKTA 0.02% New $1,202,000 4,726 206 Truist Financial Corp TFC 0.02% New $1,200,000 25,046 207 Pool Corp POOL 0.02% New $1,189,000 3,191 208 U.S. Bancorp USB 0.02% +82% $1,187,000 25,484 209 Western Union Co WU 0.02% -16% $1,187,000 54,122 210 Merit Medical Systems Inc. MMSI 0.02% New $1,180,000 21,250 211 Booz Allen Hamilton BAH 0.02% -30% $1,177,000 13,504 212 UnitedHealth Group Inc. UNH 0.02% -1% $1,174,000 3,347 213 CF Industries Holdings Inc CF 0.02% New $1,164,000 30,074 214 Anheuser-Busch Inbev BUD 0.02% +12% $1,162,000 16,627 215 Karyopharm Therapeutics KPTI 0.02% New $1,161,000 74,989 216 Caseys General Stores, Inc. CASY 0.02% -8% $1,140,000 6,380 217 Southern Co. SO 0.02% New $1,133,000 18,436 218 RPM International Inc. RPM 0.02% New $1,125,000 12,392 219 CarMax Inc. KMX 0.02% -8% $1,088,000 11,517 220 A.O. Smith AOS 0.02% -20% $1,056,000 19,264 221 Herbalife Nutrition Ltd HLF 0.02% -24% $1,056,000 21,976 222 Teradyne Inc TER 0.02% +24% $1,049,000 8,746 223 Blue Apron Holdings Inc APRN 0.02% -15% $1,045,000 186,868 224 Jabil Inc JBL 0.02% New $1,038,000 24,410
24
Maverick Capital
Q4 2020 www.hedgefundwisdom.com
Fourth Quarter 2020 Portfolio: …Continued
Continued on next page…
Rank Company Name Ticker Put/Call % of Portfolio Activity Value # of Shares
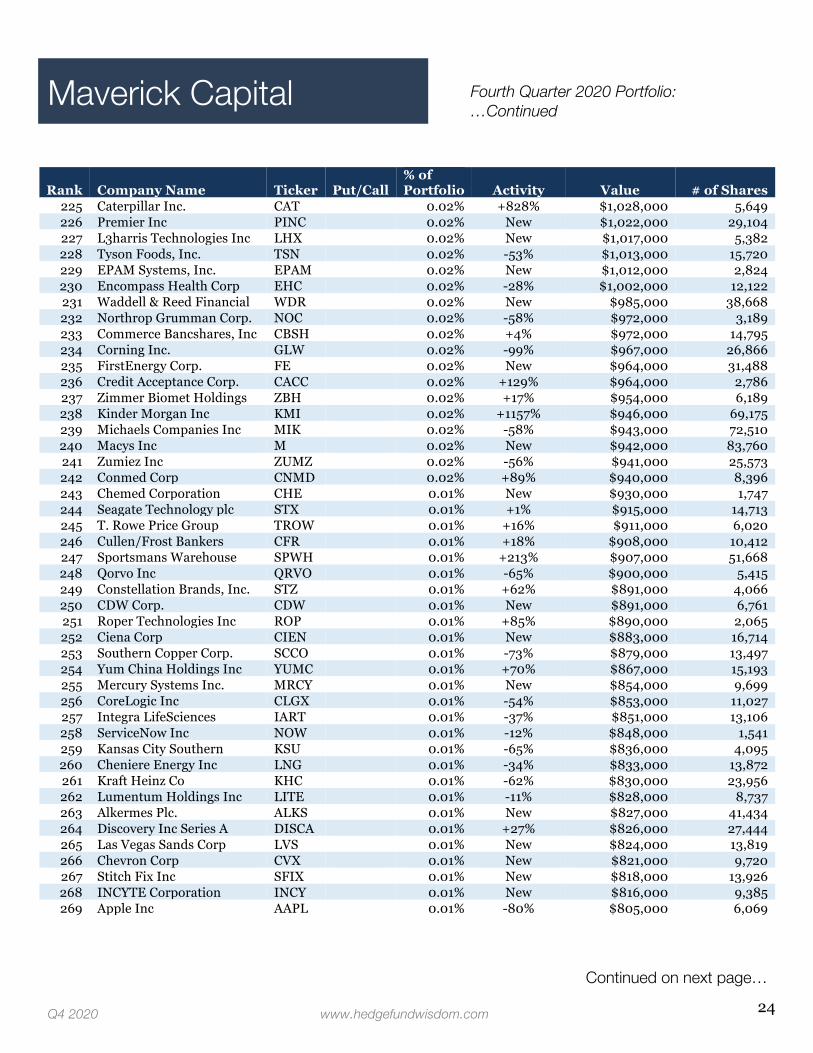
225 Caterpillar Inc. CAT 0.02% +828% $1,028,000 5,649 226 Premier Inc PINC 0.02% New $1,022,000 29,104 227 L3harris Technologies Inc LHX 0.02% New $1,017,000 5,382 228 Tyson Foods, Inc. TSN 0.02% -53% $1,013,000 15,720 229 EPAM Systems, Inc. EPAM 0.02% New $1,012,000 2,824 230 Encompass Health Corp EHC 0.02% -28% $1,002,000 12,122 231 Waddell & Reed Financial WDR 0.02% New $985,000 38,668 232 Northrop Grumman Corp. NOC 0.02% -58% $972,000 3,189 233 Commerce Bancshares, Inc CBSH 0.02% +4% $972,000 14,795 234 Corning Inc. GLW 0.02% -99% $967,000 26,866 235 FirstEnergy Corp. FE 0.02% New $964,000 31,488 236 Credit Acceptance Corp. CACC 0.02% +129% $964,000 2,786 237 Zimmer Biomet Holdings ZBH 0.02% +17% $954,000 6,189 238 Kinder Morgan Inc KMI 0.02% +1157% $946,000 69,175 239 Michaels Companies Inc MIK 0.02% -58% $943,000 72,510 240 Macys Inc M 0.02% New $942,000 83,760 241 Zumiez Inc ZUMZ 0.02% -56% $941,000 25,573 242 Conmed Corp CNMD 0.02% +89% $940,000 8,396 243 Chemed Corporation CHE 0.01% New $930,000 1,747 244 Seagate Technology plc STX 0.01% +1% $915,000 14,713 245 T. Rowe Price Group TROW 0.01% +16% $911,000 6,020 246 Cullen/Frost Bankers CFR 0.01% +18% $908,000 10,412 247 Sportsmans Warehouse SPWH 0.01% +213% $907,000 51,668 248 Qorvo Inc QRVO 0.01% -65% $900,000 5,415 249 Constellation Brands, Inc. STZ 0.01% +62% $891,000 4,066 250 CDW Corp. CDW 0.01% New $891,000 6,761 251 Roper Technologies Inc ROP 0.01% +85% $890,000 2,065 252 Ciena Corp CIEN 0.01% New $883,000 16,714 253 Southern Copper Corp. SCCO 0.01% -73% $879,000 13,497 254 Yum China Holdings Inc YUMC 0.01% +70% $867,000 15,193 255 Mercury Systems Inc. MRCY 0.01% New $854,000 9,699 256 CoreLogic Inc CLGX 0.01% -54% $853,000 11,027 257 Integra LifeSciences IART 0.01% -37% $851,000 13,106 258 ServiceNow Inc NOW 0.01% -12% $848,000 1,541 259 Kansas City Southern KSU 0.01% -65% $836,000 4,095 260 Cheniere Energy Inc LNG 0.01% -34% $833,000 13,872 261 Kraft Heinz Co KHC 0.01% -62% $830,000 23,956 262 Lumentum Holdings Inc LITE 0.01% -11% $828,000 8,737 263 Alkermes Plc. ALKS 0.01% New $827,000 41,434 264 Discovery Inc Series A DISCA 0.01% +27% $826,000 27,444 265 Las Vegas Sands Corp LVS 0.01% New $824,000 13,819 266 Chevron Corp CVX 0.01% New $821,000 9,720 267 Stitch Fix Inc SFIX 0.01% New $818,000 13,926 268 INCYTE Corporation INCY 0.01% New $816,000 9,385 269 Apple Inc AAPL 0.01% -80% $805,000 6,069
25
Maverick Capital
Q4 2020 www.hedgefundwisdom.com
Fourth Quarter 2020 Portfolio: …Continued
Continued on next page…
Rank Company Name Ticker Put/Call % of Portfolio Activity Value # of Shares
270 Teleflex, Inc. TFX 0.01% -4% $801,000 1,947 271 Stanley Black & Decker Inc. SWK 0.01% New $788,000 4,413 272 Royal Dutch Shell RDS.A 0.01% +27% $784,000 22,300 273 Danaher Corp. DHR 0.01% New $784,000 3,530 274 Atlassian Corp Plc TEAM 0.01% -23% $777,000 3,322 275 OneSpan Inc OSPN 0.01% -40% $776,000 37,501 276 IDEX Corp. IEX 0.01% +33% $774,000 3,888 277 Gartner, Inc. IT 0.01% New $764,000 4,771 278 Insulet Corp PODD 0.01% New $761,000 2,977 279 Landstar System Inc LSTR 0.01% New $759,000 5,633 280 Nielsen N.V. NLSN 0.01% -55% $758,000 36,307 281 Werner Enterprises, Inc. WERN 0.01% -19% $757,000 19,291 282 Comcast Corp. Class A CMCSA 0.01% -40% $757,000 14,442 283 Noah Holdings Ltd ADR NOAH 0.01% -63% $745,000 15,574 284 Primerica Inc PRI 0.01% -68% $745,000 5,562 285 Check Point Software CHKP 0.01% -9% $744,000 5,597 286 Dover Corp. DOV 0.01% New $740,000 5,859 287 AMC Networks Inc AMCX 0.01% +184% $730,000 20,421 288 Cardinal Health, Inc. CAH 0.01% -66% $728,000 13,597 289 Trinseo S.A. TSE 0.01% New $722,000 14,105 290 Acadia Pharmaceuticals ACAD 0.01% New $721,000 13,480 291 Ritchie Brothers Auction RBA 0.01% -65% $720,000 10,349 292 Acacia Communications ACIA 0.01% +25% $720,000 9,864 293 Wells Fargo & Co WFC 0.01% -75% $715,000 23,704 294 AES Corp AES 0.01% New $711,000 30,264 295 National Beverage Corp FIZZ 0.01% -68% $710,000 8,357 296 Willis Towers Watson plc WLTW 0.01% New $710,000 3,368 297 Enbridge, Inc ENB 0.01% New $709,000 22,166 298 CenterPoint Energy Inc CNP 0.01% New $705,000 32,565 299 Seagen Inc SGEN 0.01% New $703,000 4,013 300 Hain Celestial Group HAIN 0.01% New $695,000 17,315 301 Jefferies Financial Group JEF 0.01% -34% $695,000 28,248 302 Aptiv PLC APTV 0.01% -40% $695,000 5,336 303 Biotechne Corp TECH 0.01% +209% $694,000 2,186 304 MarketAxess Holdings Inc MKTX 0.01% -53% $680,000 1,192 305 Loews Corp L 0.01% -41% $675,000 14,992 306 BMC Stock Holdings Inc BMCH 0.01% New $670,000 12,485 307 Packaging Corp PKG 0.01% -36% $670,000 4,857 308 Globant S.A. GLOB 0.01% -21% $668,000 3,072 309 AbbVie Inc ABBV 0.01% +207% $665,000 6,210 310 Guidewire Software, Inc. GWRE 0.01% New $663,000 5,150 311 Pluralsight Inc PS 0.01% +122% $662,000 31,572 312 Evergy Inc EVRG 0.01% New $660,000 11,893 313 Macom Techno Ord MTSI 0.01% New $657,000 11,941 314 AstraZeneca PLC AZN 0.01% New $651,000 13,020

26
Maverick Capital
Q4 2020 www.hedgefundwisdom.com
Fourth Quarter 2020 Portfolio: …Continued
Continued on next page…
Rank Company Name Ticker Put/Call % of Portfolio Activity Value # of Shares
315 Vipshop Holdings Ltd ADR VIPS 0.01% -47% $649,000 23,095 316 Halozyme Therapeutics Inc HALO 0.01% New $648,000 15,164 317 PDC Energy Corp. PDCE 0.01% +13% $647,000 31,519 318 Nasdaq Inc NDAQ 0.01% New $641,000 4,828 319 AmerisourceBergen Corp ABC 0.01% -68% $633,000 6,473 320 TransDigm Group Inc TDG 0.01% New $632,000 1,021 321 II-VI Inc. IIVI 0.01% New $630,000 8,293 322 Heico Corp. HEI 0.01% +101% $626,000 4,731 323 BrightSphere Investment OMAM 0.01% -62% $626,000 32,463 324 Republic Services Inc. RSG 0.01% -26% $625,000 6,492 325 Omnicom Group Inc. OMC 0.01% -40% $623,000 9,987 326 Masco Corp. MAS 0.01% New $617,000 11,233 327 Macquarie Infrastructure MIC 0.01% +593% $615,000 16,368 328 SVB Financial Group SIVB 0.01% -32% $607,000 1,565 329 Deere & Co. DE 0.01% New $605,000 2,247 330 BlackLine Inc BL 0.01% -24% $604,000 4,528 331 Gilead Sciences Inc. GILD 0.01% -77% $604,000 10,370 332 Skechers USA, Inc. Class A SKX 0.01% +10821% $601,000 16,709 333 Dolby Laboratories DLB 0.01% -59% $593,000 6,104 334 Liberty Broadband LBRDK 0.01% New $589,000 3,721 335 Corteva Inc CTVA 0.01% -62% $588,000 15,190 336 Apache Corp APA 0.01% New $588,000 41,460 337 Cognex Corp CGNX 0.01% -55% $586,000 7,293 338 Carnival Corp. CCL 0.01% +117% $580,000 26,773 339 Shopify Inc SHOP 0.01% New $572,000 505 340 Edison International EIX 0.01% New $572,000 9,106 341 Capital One Financial COF 0.01% New $572,000 5,788 342 Fidelity National Info FIS 0.01% New $565,000 3,997 343 GoDaddy Inc GDDY 0.01% -68% $561,000 6,763 344 VEON Ltd ADR VEON 0.01% -58% $552,000 365,800 345 Shockwave Medical Inc SWAV 0.01% +324% $543,000 5,239 346 LPL Financial Holdings Inc LPLA 0.01% -69% $539,000 5,172 347 Tiffany & Co TIF 0.01% New $537,000 4,082 348 360 DigiTech Inc QFIN 0.01% -55% $534,000 45,257 349 MSC Industrial Direct, Inc. MSM 0.01% -47% $531,000 6,291 350 TreeHouse Foods Inc THS 0.01% +214% $523,000 12,317 351 ANGI Homeservices Inc ANGI 0.01% -59% $521,000 39,520 352 Mueller Industries Inc MLI 0.01% -66% $518,000 14,763 353 MetLife Inc. MET 0.01% -45% $517,000 11,015 354 Accenture Plc ACN 0.01% New $512,000 1,961 355 Thermo Fisher Scientific TMO 0.01% New $511,000 1,098 356 RealPage Inc RP 0.01% New $510,000 5,848 357 Dropbox Inc DBX 0.01% New $507,000 22,866 358 Momo Inc ADR MOMO 0.01% -59% $502,000 35,964 359 Workday Inc WDAY 0.01% -78% $501,000 2,090

27
Maverick Capital
Q4 2020 www.hedgefundwisdom.com
Fourth Quarter 2020 Portfolio: …Continued
Continued on next page…
Rank Company Name Ticker Put/Call % of Portfolio Activity Value # of Shares
360 Sempra Energy, Inc. SRE 0.01% New $500,000 3,921 361 Ametek Inc. AME 0.01% New $499,000 4,128 362 Clean Harbors Inc. CLH 0.01% -83% $497,000 6,526 363 Office Depot Inc ODP 0.01% New $497,000 16,965 364 iRobot Corp IRBT 0.01% New $496,000 6,175 365 Freeport-McMoRan FCX 0.01% New $489,000 18,785 366 Spirit Airlines Inc SAVE 0.01% New $488,000 19,968 367 National General Holdings NGHC 0.01% +6% $485,000 14,185 368 Entergy Corp. ETR 0.01% New $472,000 4,729 369 Unum Group, Inc. UNM 0.01% New $471,000 20,540 370 Louisiana Pacific Corp. LPX 0.01% -63% $471,000 12,684 371 Vishay Intertechnology VSH 0.01% New $466,000 22,516 372 CGI Inc GIB 0.01% -70% $466,000 5,870 373 Cardiovascular Systems CSII 0.01% New $465,000 10,633 374 Ingles Markets, Inc Class A IMKTA 0.01% New $462,000 10,824 375 Virgin Galactic Holdings SPCE 0.01% New $460,000 19,376 376 Mimecast Ltd MIME 0.01% -66% $459,000 8,067 377 ONEOK Inc OKE 0.01% New $456,000 11,888 378 CM Life Sciences, Inc. CMLFU 0.01% -93% $456,000 39,302 379 Diamondback Energy Inc FANG 0.01% New $451,000 9,323 380 Asbury Automotive Group ABG 0.01% -69% $451,000 3,096 381 Concho Resources Inc CXO 0.01% -59% $450,000 7,714 382 SVMK Inc SVMK 0.01% New $445,000 17,409 383 Melco Resorts MLCO 0.01% -40% $444,000 23,925 384 CM Life Sciences Warrant CMLFW 0.01% New $444,000 162,796 385 Pure Storage Inc PSTG 0.01% +205% $438,000 19,385 386 Teva Pharmaceutical TEVA 0.01% -64% $431,000 44,674 387 Staar Surgical Co. STAA 0.01% +9% $430,000 5,432 388 Pegasystems Inc. PEGA 0.01% +74% $427,000 3,204 389 Vista Outdoor Inc VSTO 0.01% -47% $425,000 17,874 390 ICU Medical Inc ICUI 0.01% New $420,000 1,957 391 Affiliated Managers AMG 0.01% -76% $418,000 4,109 392 Verint Systems Inc VRNT 0.01% New $414,000 12,088 393 Alteryx Inc AYX 0.01% New $413,000 3,395 394 SailPoint Technologies SAIL 0.01% -74% $411,000 7,728 395 Mednax Inc MD 0.01% -86% $411,000 16,742 396 Six Flags Entertainment SIX 0.01% New $410,000 12,014 397 WEX, Inc. WEX 0.01% -62% $407,000 2,002 398 DTE Energy Co DTE 0.01% New $404,000 3,325 399 2U, Inc TWOU 0.01% New $404,000 10,091 400 Intercept Pharmaceuticals ICPT 0.01% New $401,000 16,242 401 New Relic Inc NEWR 0.01% -84% $396,000 6,061 402 Eversource Energy ES 0.01% New $395,000 4,568 403 Travelers Companies TRV 0.01% -61% $394,000 2,807 404 Meridian Bioscience Inc VIVO 0.01% New $393,000 21,039 405 Sensata Technologies ST 0.01% -74% $392,000 7,442

28
Maverick Capital
Q4 2020 www.hedgefundwisdom.com
Fourth Quarter 2020 Portfolio: …Continued
Continued on next page…
Rank Company Name Ticker Put/Call % of Portfolio Activity Value # of Shares
406 ACI Worldwide Inc ACIW 0.01% New $391,000 10,181 407 Fair Isaac Corp FICO 0.01% -58% $387,000 758 408 Liberty Global plc Class C LBTYK 0.01% -69% $387,000 16,344 409 PPL Corp PPL 0.01% New $387,000 13,722 410 Adapthealth Corp AHCO 0.01% New $386,000 10,281 411 Reliance Steel & Aluminum RS 0.01% New $384,000 3,208 412 Darden Restaurants Inc DRI 0.01% New $382,000 3,203 413 SS&C Technologies SSNC 0.01% -72% $380,000 5,225 414 Workhorse Group Inc WKHS 0.01% +51% $379,000 19,170 415 TriNet Group Inc TNET 0.01% -73% $377,000 4,676 416 Navient Corp NAVI 0.01% New $375,000 38,198 417 Molina Healthcare Inc MOH 0.01% -76% $374,000 1,760 418 Rapid7 Inc RPD 0.01% New $374,000 4,146 419 Knight Transportation Inc. KNX 0.01% New $374,000 8,935 420 Ball Corp. BLL 0.01% -66% $373,000 4,007 421 ADT Inc ADT 0.01% New $369,000 46,990 422 Baker Hughes Company BKR 0.01% -81% $369,000 17,704 423 Pretium Resources Inc PVG 0.01% -66% $369,000 32,126 424 Cimarex Energy Co. XEC 0.01% -72% $368,000 9,819 425 Kirkland Lake Gold Ltd KL 0.01% New $365,000 8,833 426 Consolidated Edison ED 0.01% New $365,000 5,049 427 KAR Auction Services Inc KAR 0.01% -70% $364,000 19,562 428 Block (H&R) Inc. HRB 0.01% New $363,000 22,901 429 New York Times Co NYT 0.01% New $362,000 6,987 430 Cornerstone OnDemand CSOD 0.01% New $362,000 8,226 431 CarGurus Inc CARG 0.01% -79% $361,000 11,374 432 LKQ Corp LKQ 0.01% -85% $356,000 10,090 433 ABM Industries Inc ABM 0.01% -70% $354,000 9,362 434 Gap (The) GPS 0.01% -95% $354,000 17,530 435 Robert Half International RHI 0.01% New $352,000 5,629 436 Ameren Corporation AEE 0.01% New $352,000 4,504 437 Huntington Bancshares HBAN 0.01% -70% $351,000 27,757 438 VeriSign Inc. VRSN 0.01% -31% $348,000 1,610 439 Xylem Inc XYL 0.01% -91% $344,000 3,384 440 Owens Corning Inc OC 0.01% -87% $338,000 4,461 441 Fortive Corp FTV 0.01% New $337,000 4,757 442 Avalara Inc AVLR 0.01% New $337,000 2,041 443 Slack Technologies Inc WORK 0.01% New $334,000 7,904 444 Akamai Technologies Inc. AKAM 0.01% -18% $327,000 3,114 445 PennyMac Financial PFSI 0.01% New $324,000 4,938 446 Range Resources Corp. RRC 0.01% New $323,000 48,252 447 Central Garden & Pet Co CENTA 0.01% New $322,000 8,871 448 Xcel Energy Inc XEL 0.01% New $320,000 4,807 449 Elanco Animal Health Inc ELAN 0.01% New $314,000 10,240 450 Booking Holdings Inc BKNG 0.01% -79% $314,000 141

29
Maverick Capital
Q4 2020 www.hedgefundwisdom.com
Fourth Quarter 2020 Portfolio: …Continued
Continued on next page…
Rank Company Name Ticker Put/Call % of Portfolio Activity Value # of Shares
451 American Water Works AWK 0.01% New $311,000 2,024 452 Hilton Worldwide HLT 0.01% -52% $301,000 2,704 453 Eastman Chemical Co. EMN 0.01% -73% $297,000 2,964 454 Shutterstock Inc SSTK 0.01% -65% $297,000 4,138 455 Atlas Air Worldwide AAWW 0.01% -67% $296,000 5,426 456 XPO Logistics Inc XPO 0.01% New $295,000 2,472 457 WEC Energy Group WEC 0.01% New $292,000 3,172 458 Ingevity Corp NGVT 0.01% New $291,000 3,847 459 B&G Foods, Inc. BGS 0.01% -79% $288,000 10,384 460 Alcon Inc ALC 0.01% New $288,000 4,327 461 Vail Resorts Inc MTN 0.01% New $287,000 1,028 462 AutoNation, Inc AN 0.01% -78% $287,000 4,117 463 Devon Energy Corp. DVN 0.01% New $287,000 18,176 464 Microchip Technology MCHP 0.01% New $286,000 2,072 465 AMERCO Inc UHAL 0.01% New $286,000 629 466 Altice USA Inc ATUS 0.01% New $285,000 7,534 467 Evertec, Inc. EVTC 0.01% -73% $282,000 7,161 468 Sina Corp SINA 0.01% -48% $281,000 6,638 469 AGCO Corp AGCO 0.01% New $278,000 2,700 470 Liberty Latin America LILAK 0.01% New $277,000 24,997 471 Meritage Homes Corp. MTH 0.01% +95% $273,000 3,300 472 Magna International MGA 0.01% New $272,000 3,836 473 Bunge Ltd. ADR BG 0.01% -74% $271,000 4,125 474 TeraData Corp. TDC 0.01% New $271,000 12,044 475 Big Lots Inc BIG 0.01% New $270,000 6,297 476 NCR Corp. NCR 0.01% -87% $269,000 7,152 477 Public Service Enterprise PEG 0.01% New $268,000 4,599 478 Waste Management, Inc. WM 0.01% -81% $265,000 2,243 479 Nexstar Media Group Inc NXST 0.01% -89% $265,000 2,430 480 Yamana Gold Inc. AUY 0.01% -55% $264,000 46,205 481 Virtu Financial Inc VIRT 0.01% New $263,000 10,462 482 Allegiant Travel Co ALGT 0.01% -27% $262,000 1,384 483 CRH Plc ADR CRH 0.01% New $261,000 6,120 484 B2Gold Corp BTG 0.01% -48% $253,000 45,174 485 Sherwin-Williams Co. SHW 0.01% -93% $251,000 342 486 Polaris Inc PII 0.01% -87% $249,000 2,614 487 Aon PLC AON 0.01% New $249,000 1,178 488 Anglogold Ashanti Ltd ADS AU 0.01% -46% $248,000 10,967 489 Pinterest Inc PINS 0.01% New $247,000 3,753 490 Belden Inc BDC 0.01% New $246,000 5,868 491 EQT Corporation EQT 0.01% New $244,000 19,235 492 TransUnion TRU 0.01% -3% $243,000 2,452 493 Murphy USA Inc MUSA 0.01% -75% $243,000 1,854 494 Bio-Rad Laboratories BIO 0.01% New $243,000 416 495 Albany International AIN 0.01% New $242,000 3,295

30
Maverick Capital
Q4 2020 www.hedgefundwisdom.com
Fourth Quarter 2020 Portfolio: …Continued
Continued on next page…
Rank Company Name Ticker Put/Call % of Portfolio Activity Value # of Shares
496 Coca-Cola European CCEP 0.01% New $242,000 4,850 497 Laureate Education Inc LAUR 0.01% New $241,000 16,551 498 Sinclair Broadcast Group SBGI 0.01% -87% $241,000 7,572 499 Encore Capital Group Inc ECPG 0.01% -65% $239,000 6,140 500 Santander Consumer SC 0.01% New $239,000 10,857 501 Paychex Inc. PAYX 0.01% New $238,000 2,551 502 Moderna Inc MRNA 0.01% New $238,000 2,277 503 Arrow Electronics Corp. ARW 0.01% New $235,000 2,411 504 GenMark Diagnostics Inc GNMK 0.01% New $234,000 16,015 505 BRP Inc DOOO 0.01% -73% $233,000 3,529 506 ElectraMeccanica SOLO 0.01% New $232,000 37,560 507 M/I Homes Inc MHO 0.01% New $228,000 5,159 508 Popular Inc (Puerto Rico) BPOP 0.01% New $224,000 3,984 509 Citigroup, Inc. C 0.01% -95% $224,000 3,632 510 Aerie Pharmaceuticals Inc AERI 0.01% New $224,000 16,580 511 Rogers Communications RCI 0.01% New $224,000 4,804 512 Watsco Inc. WSO 0.01% New $223,000 983 513 Cirrus Logic Inc CRUS 0.01% -61% $223,000 2,709 514 Marsh & McLennan MMC 0.01% New $222,000 1,901 515 Canadian National Railway CNI 0.01% -71% $220,000 2,006 516 Bausch Health Companies BHC 0.01% -92% $220,000 10,600 517 Green Dot Corp GDOT 0.01% -59% $218,000 3,909 518 Antero Midstream Corp AM 0.01% New $214,000 27,714 519 Radian Group Inc. RDN 0.01% New $213,000 10,519 520 Emergent BioSolutions Inc EBS 0.01% New $212,000 2,364 521 NortonLifeLock Inc NLOK 0.01% -68% $209,000 10,062 522 ACM Research Inc ACMR 0.01% +29% $207,000 2,545 523 Guardant Health Inc GH 0.01% New $206,000 1,599 524 MSCI Inc MSCI 0.01% -90% $206,000 462 525 PG&E Corp PCG 0.01% New $206,000 16,531 526 STERIS Corp. STE 0.01% New $203,000 1,071 527 Manhattan Associates, Inc. MANH 0.01% New $201,000 1,911 528 Valero Energy Corp. VLO 0.01% New $197,000 3,482 529 10X Genomics Inc TXG 0.01% New $195,000 1,379 530 Big 5 Sporting Goods Corp BGFV 0.01% -66% $194,000 18,987 531 Hubspot Inc HUBS 0.01% -84% $193,000 486 532 Henry Schein Inc. HSIC 0.01% New $193,000 2,880 533 Aerojet Rocketdyne AJRD 0.01% New $192,000 3,625 534 Universal Health Services UHS 0.01% -77% $190,000 1,385 535 Matson Inc MATX 0.01% New $186,000 3,261 536 Novo-Nordisk A/S ADS NVO 0.01% -70% $186,000 2,658 537 Trip.com Group Ltd TCOM 0.01% -69% $185,000 5,496 538 Harley Davidson Inc HOG 0.01% -78% $179,000 4,871 539 Agnico-Eagle Mines, Ltd AEM 0.01% -65% $175,000 2,476
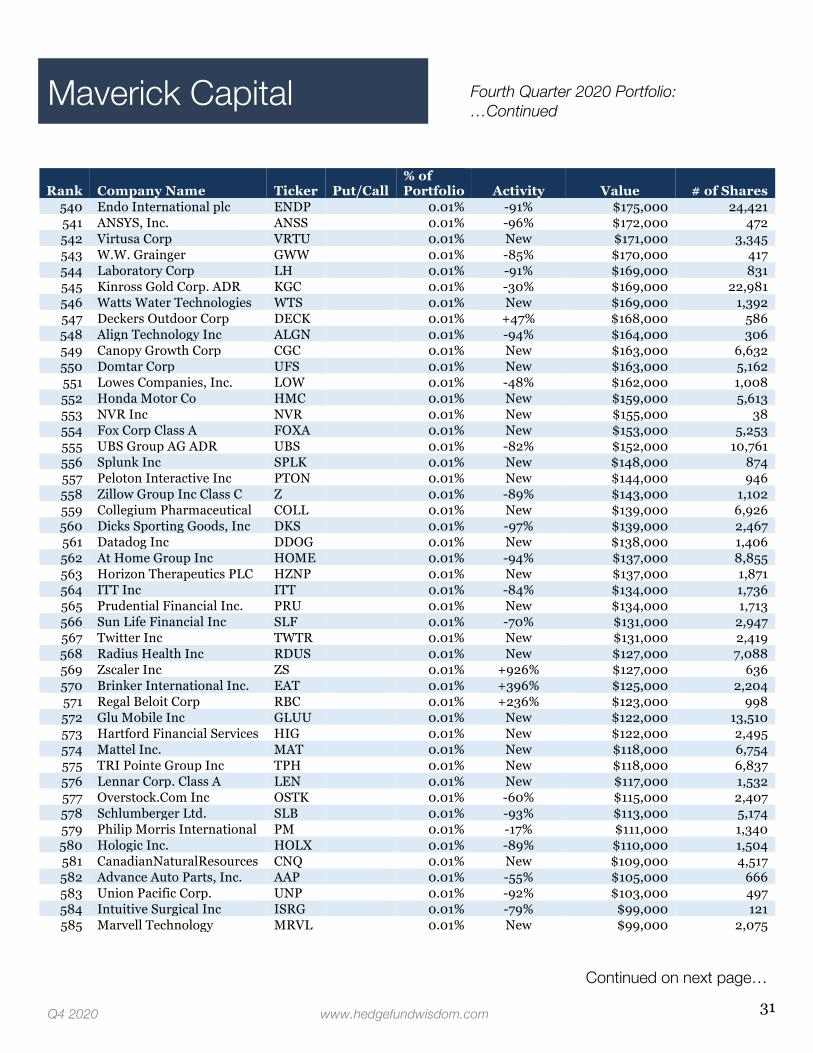
31
Maverick Capital
Q4 2020 www.hedgefundwisdom.com
Fourth Quarter 2020 Portfolio: …Continued
Continued on next page…
Rank Company Name Ticker Put/Call % of Portfolio Activity Value # of Shares
540 Endo International plc ENDP 0.01% -91% $175,000 24,421 541 ANSYS, Inc. ANSS 0.01% -96% $172,000 472 542 Virtusa Corp VRTU 0.01% New $171,000 3,345 543 W.W. Grainger GWW 0.01% -85% $170,000 417 544 Laboratory Corp LH 0.01% -91% $169,000 831 545 Kinross Gold Corp. ADR KGC 0.01% -30% $169,000 22,981 546 Watts Water Technologies WTS 0.01% New $169,000 1,392 547 Deckers Outdoor Corp DECK 0.01% +47% $168,000 586 548 Align Technology Inc ALGN 0.01% -94% $164,000 306 549 Canopy Growth Corp CGC 0.01% New $163,000 6,632 550 Domtar Corp UFS 0.01% New $163,000 5,162 551 Lowes Companies, Inc. LOW 0.01% -48% $162,000 1,008 552 Honda Motor Co HMC 0.01% New $159,000 5,613 553 NVR Inc NVR 0.01% New $155,000 38 554 Fox Corp Class A FOXA 0.01% New $153,000 5,253 555 UBS Group AG ADR UBS 0.01% -82% $152,000 10,761 556 Splunk Inc SPLK 0.01% New $148,000 874 557 Peloton Interactive Inc PTON 0.01% New $144,000 946 558 Zillow Group Inc Class C Z 0.01% -89% $143,000 1,102 559 Collegium Pharmaceutical COLL 0.01% New $139,000 6,926 560 Dicks Sporting Goods, Inc DKS 0.01% -97% $139,000 2,467 561 Datadog Inc DDOG 0.01% New $138,000 1,406 562 At Home Group Inc HOME 0.01% -94% $137,000 8,855 563 Horizon Therapeutics PLC HZNP 0.01% New $137,000 1,871 564 ITT Inc ITT 0.01% -84% $134,000 1,736 565 Prudential Financial Inc. PRU 0.01% New $134,000 1,713 566 Sun Life Financial Inc SLF 0.01% -70% $131,000 2,947 567 Twitter Inc TWTR 0.01% New $131,000 2,419 568 Radius Health Inc RDUS 0.01% New $127,000 7,088 569 Zscaler Inc ZS 0.01% +926% $127,000 636 570 Brinker International Inc. EAT 0.01% +396% $125,000 2,204 571 Regal Beloit Corp RBC 0.01% +236% $123,000 998 572 Glu Mobile Inc GLUU 0.01% New $122,000 13,510 573 Hartford Financial Services HIG 0.01% New $122,000 2,495 574 Mattel Inc. MAT 0.01% New $118,000 6,754 575 TRI Pointe Group Inc TPH 0.01% New $118,000 6,837 576 Lennar Corp. Class A LEN 0.01% New $117,000 1,532 577 Overstock.Com Inc OSTK 0.01% -60% $115,000 2,407 578 Schlumberger Ltd. SLB 0.01% -93% $113,000 5,174 579 Philip Morris International PM 0.01% -17% $111,000 1,340 580 Hologic Inc. HOLX 0.01% -89% $110,000 1,504 581 CanadianNaturalResources CNQ 0.01% New $109,000 4,517 582 Advance Auto Parts, Inc. AAP 0.01% -55% $105,000 666 583 Union Pacific Corp. UNP 0.01% -92% $103,000 497 584 Intuitive Surgical Inc ISRG 0.01% -79% $99,000 121 585 Marvell Technology MRVL 0.01% New $99,000 2,075

32
Maverick Capital
Q4 2020 www.hedgefundwisdom.com
Fourth Quarter 2020 Portfolio: …Continued
Continued on next page…
Rank Company Name Ticker Put/Call % of Portfolio Activity Value # of Shares
586 Home Depot, Inc HD 0.01% -87% $99,000 372 587 AutoZone Inc. AZO 0.01% -39% $98,000 83 588 OReilly Automotive Inc. ORLY 0.01% -98% $98,000 216 589 Blackberry Ltd BB 0.01% New $97,000 14,599 590 DexCom Inc DXCM 0.01% -28% $97,000 262 591 Dow Inc DOW 0.01% -95% $95,000 1,709 592 NXP Semiconductors N.V. NXPI 0.01% New $94,000 592 593 Carrier Global Corp. CARR 0.01% New $90,000 2,397 594 Procter & Gamble PG 0.01% -98% $89,000 641 595 Catalent Inc CTLT 0.01% New $89,000 854 596 OneMain Holdings Inc OMF 0.01% -84% $88,000 1,819 597 C.H. Robinson CHRW 0.01% New $86,000 918 598 JPMorgan Chase & Co JPM 0.01% -55% $84,000 658 599 HewlettPackard Enterprise HPE 0.01% New $83,000 6,984 600 Sirius XM Holdings Inc SIRI 0.01% -91% $81,000 12,677 601 Celanese Corp CE 0.01% New $75,000 577 602 Kroger Co. KR 0.01% -93% $75,000 2,347 603 Quest Diagnostics, Inc. DGX 0.01% New $75,000 628 604 Sally Beauty Holdings Inc SBH 0.01% -94% $73,000 5,600 605 Dycom Industries Inc DY 0.01% New $73,000 970 606 TAL Education Group TAL 0.01% -71% $73,000 1,017 607 Proto Labs Inc PRLB 0.01% New $70,000 458 608 Cinemark Holdings Inc CNK 0.01% New $69,000 3,978 609 Dillards Inc. DDS 0.01% New $67,000 1,061 610 World Wrestling Ent WWE 0.01% New $67,000 1,390 611 National Vision Holdings EYE 0.01% -89% $66,000 1,466 612 International Paper Co. IP 0.01% New $62,000 1,247 613 Vulcan Materials Company VMC 0.01% New $56,000 379 614 IDEXX Laboratories Inc. IDXX 0.01% -96% $56,000 112 615 Baidu Inc ADR BIDU 0.01% New $56,000 258 616 Express Inc EXPR 0.01% New $55,000 60,117 617 Tenet Healthcare Corp. THC 0.01% -36% $55,000 1,378 618 AT&T Inc T 0.01% -97% $55,000 1,920 619 Bill.com Holdings, Inc. BILL 0.01% New $53,000 386 620 Illumina Inc ILMN 0.01% New $52,000 141 621 Teladoc Health Inc TDOC 0.01% New $52,000 260 622 Mastercard Inc MA 0.01% -96% $51,000 144 623 DraftKings Inc Cl A DKNG 0.01% New $49,000 1,049 624 Puma Biotechnology Inc PBYI 0.01% New $48,000 4,720 625 NetApp Inc. NTAP 0.01% New $44,000 662 626 Zoom Video Comm ZM 0.01% New $44,000 130 627 Supernus Pharmaceuticals SUPN 0.01% -97% $43,000 1,711
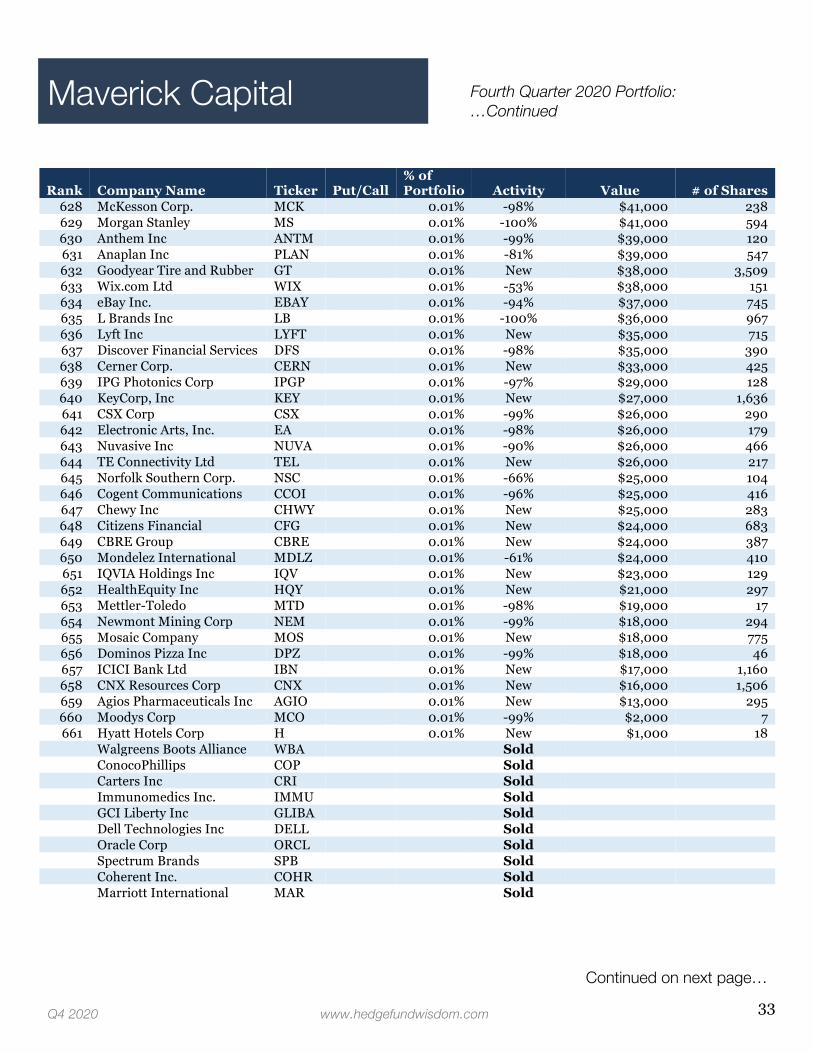
33
Maverick Capital
Q4 2020 www.hedgefundwisdom.com
Fourth Quarter 2020 Portfolio: …Continued
Continued on next page…
Rank Company Name Ticker Put/Call % of Portfolio Activity Value # of Shares
628 McKesson Corp. MCK 0.01% -98% $41,000 238 629 Morgan Stanley MS 0.01% -100% $41,000 594 630 Anthem Inc ANTM 0.01% -99% $39,000 120 631 Anaplan Inc PLAN 0.01% -81% $39,000 547 632 Goodyear Tire and Rubber GT 0.01% New $38,000 3,509 633 Wix.com Ltd WIX 0.01% -53% $38,000 151 634 eBay Inc. EBAY 0.01% -94% $37,000 745 635 L Brands Inc LB 0.01% -100% $36,000 967 636 Lyft Inc LYFT 0.01% New $35,000 715 637 Discover Financial Services DFS 0.01% -98% $35,000 390 638 Cerner Corp. CERN 0.01% New $33,000 425 639 IPG Photonics Corp IPGP 0.01% -97% $29,000 128 640 KeyCorp, Inc KEY 0.01% New $27,000 1,636 641 CSX Corp CSX 0.01% -99% $26,000 290 642 Electronic Arts, Inc. EA 0.01% -98% $26,000 179 643 Nuvasive Inc NUVA 0.01% -90% $26,000 466 644 TE Connectivity Ltd TEL 0.01% New $26,000 217 645 Norfolk Southern Corp. NSC 0.01% -66% $25,000 104 646 Cogent Communications CCOI 0.01% -96% $25,000 416 647 Chewy Inc CHWY 0.01% New $25,000 283 648 Citizens Financial CFG 0.01% New $24,000 683 649 CBRE Group CBRE 0.01% New $24,000 387 650 Mondelez International MDLZ 0.01% -61% $24,000 410 651 IQVIA Holdings Inc IQV 0.01% New $23,000 129 652 HealthEquity Inc HQY 0.01% New $21,000 297 653 Mettler-Toledo MTD 0.01% -98% $19,000 17 654 Newmont Mining Corp NEM 0.01% -99% $18,000 294 655 Mosaic Company MOS 0.01% New $18,000 775 656 Dominos Pizza Inc DPZ 0.01% -99% $18,000 46 657 ICICI Bank Ltd IBN 0.01% New $17,000 1,160 658 CNX Resources Corp CNX 0.01% New $16,000 1,506 659 Agios Pharmaceuticals Inc AGIO 0.01% New $13,000 295 660 Moodys Corp MCO 0.01% -99% $2,000 7 661 Hyatt Hotels Corp H 0.01% New $1,000 18
Walgreens Boots Alliance WBA Sold ConocoPhillips COP Sold Carters Inc CRI Sold Immunomedics Inc. IMMU Sold GCI Liberty Inc GLIBA Sold Dell Technologies Inc DELL Sold Oracle Corp ORCL Sold Spectrum Brands SPB Sold Coherent Inc. COHR Sold Marriott International MAR Sold

34
Maverick Capital
Q4 2020 www.hedgefundwisdom.com
Fourth Quarter 2020 Portfolio: …Continued
Continued on next page…
Rank Company Name Ticker Put/Call % of Portfolio Activity Value # of Shares
Air Lease Corp AL Sold Vivint Solar Inc VSLR Sold Tyler Technologies Inc TYL Sold PBF Energy Inc PBF Sold Gentex Corp. GNTX Sold Patterson Companies, Inc. PDCO Sold Becton, Dickinson and Co. BDX Sold Axon Enterprise Inc. AXON Sold Artisan Partners Asset APAM Sold Marriot Vacations VAC Sold PPG Industries, Inc PPG Sold Hibbett Sports, Inc. HIBB Sold Corcept Therapeutics Inc CORT Sold Voya Financial Inc VOYA Sold AptarGroup, Inc. ATR Sold Activision Blizzard Inc ATVI Sold Sabre Corp SABR Sold Expedia Group Inc EXPE Sold Keurig Dr Pepper Inc KDP Sold Lithia Motors Inc, Class A LAD Sold Berkshire Hathaway BRK.B Sold Zendesk Inc ZEN Sold Duke Energy Corp. DUK Sold South State Corp SSB Sold TechnipFMC FTI Sold E*Trade Financial Corp. ETFC Sold Global Payments Inc. GPN Sold Masonite International DOOR Sold Smith & Wesson Brands SWBI Sold Digital Turbine Inc APPS Sold Bloom Energy Corp BE Sold Tenable Holdings Inc TENB Sold Baxter International Inc. BAX Sold Bitauto Holdings Ltd BITA Sold Edgewell Personal Care EPC Sold Kohls Corp. KSS Sold PACCAR Inc. PCAR Sold FireEye Inc FEYE Sold Iridium Communications IRDM Sold PayPal Holdings Inc PYPL Sold Qurate Retail Group QRTEA Sold Tempur Sealy TPX Sold Peabody Energy Corp BTU Sold Allegion plc ALLE Sold
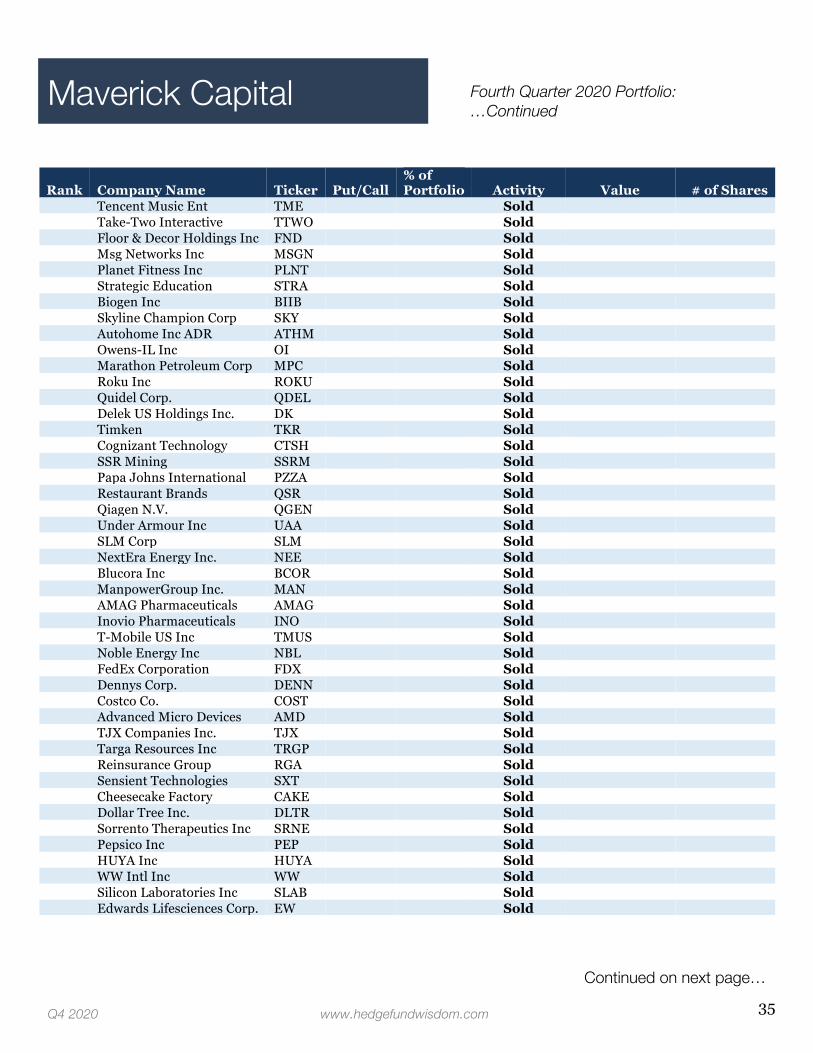
35
Maverick Capital
Q4 2020 www.hedgefundwisdom.com
Fourth Quarter 2020 Portfolio: …Continued
Rank Company Name Ticker Put/Call % of Portfolio Activity Value # of Shares
Tencent Music Ent TME Sold Take-Two Interactive TTWO Sold Floor & Decor Holdings Inc FND Sold Msg Networks Inc MSGN Sold Planet Fitness Inc PLNT Sold Strategic Education STRA Sold Biogen Inc BIIB Sold Skyline Champion Corp SKY Sold Autohome Inc ADR ATHM Sold Owens-IL Inc OI Sold Marathon Petroleum Corp MPC Sold Roku Inc ROKU Sold Quidel Corp. QDEL Sold Delek US Holdings Inc. DK Sold Timken TKR Sold Cognizant Technology CTSH Sold SSR Mining SSRM Sold Papa Johns International PZZA Sold Restaurant Brands QSR Sold Qiagen N.V. QGEN Sold Under Armour Inc UAA Sold SLM Corp SLM Sold NextEra Energy Inc. NEE Sold Blucora Inc BCOR Sold ManpowerGroup Inc. MAN Sold AMAG Pharmaceuticals AMAG Sold Inovio Pharmaceuticals INO Sold T-Mobile US Inc TMUS Sold Noble Energy Inc NBL Sold FedEx Corporation FDX Sold Dennys Corp. DENN Sold Costco Co. COST Sold Advanced Micro Devices AMD Sold TJX Companies Inc. TJX Sold Targa Resources Inc TRGP Sold Reinsurance Group RGA Sold Sensient Technologies SXT Sold Cheesecake Factory CAKE Sold Dollar Tree Inc. DLTR Sold Sorrento Therapeutics Inc SRNE Sold Pepsico Inc PEP Sold HUYA Inc HUYA Sold WW Intl Inc WW Sold Silicon Laboratories Inc SLAB Sold Edwards Lifesciences Corp. EW Sold
Continued on next page…
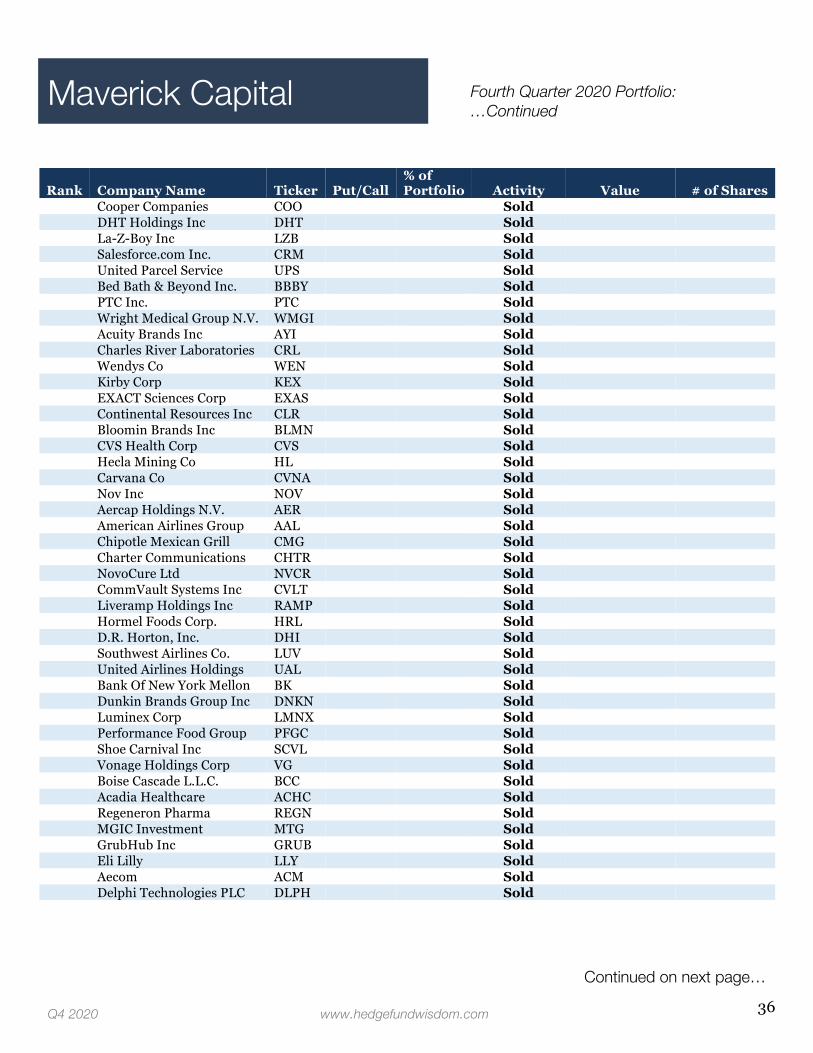
36
Maverick Capital
Q4 2020 www.hedgefundwisdom.com
Fourth Quarter 2020 Portfolio: …Continued
Rank Company Name Ticker Put/Call % of Portfolio Activity Value # of Shares
Cooper Companies COO Sold DHT Holdings Inc DHT Sold La-Z-Boy Inc LZB Sold Salesforce.com Inc. CRM Sold United Parcel Service UPS Sold Bed Bath & Beyond Inc. BBBY Sold PTC Inc. PTC Sold Wright Medical Group N.V. WMGI Sold Acuity Brands Inc AYI Sold Charles River Laboratories CRL Sold Wendys Co WEN Sold Kirby Corp KEX Sold EXACT Sciences Corp EXAS Sold Continental Resources Inc CLR Sold Bloomin Brands Inc BLMN Sold CVS Health Corp CVS Sold Hecla Mining Co HL Sold Carvana Co CVNA Sold Nov Inc NOV Sold Aercap Holdings N.V. AER Sold American Airlines Group AAL Sold Chipotle Mexican Grill CMG Sold Charter Communications CHTR Sold NovoCure Ltd NVCR Sold CommVault Systems Inc CVLT Sold Liveramp Holdings Inc RAMP Sold Hormel Foods Corp. HRL Sold D.R. Horton, Inc. DHI Sold Southwest Airlines Co. LUV Sold United Airlines Holdings UAL Sold Bank Of New York Mellon BK Sold Dunkin Brands Group Inc DNKN Sold Luminex Corp LMNX Sold Performance Food Group PFGC Sold Shoe Carnival Inc SCVL Sold Vonage Holdings Corp VG Sold Boise Cascade L.L.C. BCC Sold Acadia Healthcare ACHC Sold Regeneron Pharma REGN Sold MGIC Investment MTG Sold GrubHub Inc GRUB Sold Eli Lilly LLY Sold Aecom ACM Sold Delphi Technologies PLC DLPH Sold
Continued on next page…

37
Maverick Capital
Q4 2020 www.hedgefundwisdom.com
Fourth Quarter 2020 Portfolio: …Continued
Next Page: Third Point
Rank Company Name Ticker Put/Call % of Portfolio Activity Value # of Shares
Hostess Brands Inc Class A TWNK Sold Alexion Pharmaceuticals ALXN Sold National Instruments Corp NATI Sold Hudbay Minerals Inc HBM Sold Box Inc BOX Sold Hubbell Inc Class B HUBB Sold Amkor Technology Inc. AMKR Sold Liberty Sirius XM Group LSXMK Sold Hill-Rom Holdings HRC Sold TD Ameritrade Holding AMTD Sold Weibo Corp ADR WB Sold Walt Disney Co DIS Sold Renewable Energy REGI Sold Ryanair Holdings ADR RYAAY Sold Royal Gold Inc RGLD Sold New York Community NYCB Sold Helmerich & Payne, Inc. HP Sold Exelon Corp EXC Sold Pfizer, Inc. PFE Sold Genworth Financial Inc GNW Sold NIO Inc NIO Sold Monolithic Power Systems MPWR Sold Zions Bancorp ZION Sold First Horizon FHN Sold Estee Lauder Companies EL Sold Eastman Kodak Co KODK Sold Farfetch Ltd FTCH Sold Aspen Technology Inc AZPN Sold

38
Third Point gained 16.1% in the fourth quarter and returned 20.5% for 2020. One of their big winners here was Upstart Holdings (UPST) which completed its initial public offering (IPO) and it’s now their fifth largest US equity holding. They originally invested back in 2015 when the company was still private.
While Third Point’s new Intel (INTC) stake looks tiny on the next page, note that they’ve since ramped up exposure and Reuters reports the stake is near $1 billion, which would make it one of their top-3 holdings. Loeb sent a letter to the company pushing for change, noting that they’ve fallen behind competition in manufacturing.
Dan Loeb’s Q4 letter touched on the short squeeze frenzy that recently took over the market: “We have always felt more comfortable with higher net and lower gross exposure. It is tempting to think
Key Takeaways
New Posit ions: Intel (INTC) Upstart Holdings (UPST) ~ IPO Alphabet (GOOGL) Aptiv (APTV) Stanley Black & Decker (SWK) Nike (NKE) Catalent (CTLT) Leslies (LESL) Carmax (KMX) RH (RH) United Healthcare (UNH) Jaws Acquisition (JWS) Sold Out: Square (SQ) Fortive (FTV) Caesars Entertainment (CZR)
that lower nets imply lower risk, but recent events are a stark reminder that leverage, in all its forms, is a double-edged sword … we have mostly avoided taking short stakes in companies with modest liquidity and large short interests.”
Third Point is constructive based on Fed liquidity, tons of stimulus and fiscal support, and an improving economy as the vaccine rolls out. That said, they’re concerned about inflation and are keeping their eye on interest rates.
Loeb writes, “We are looking to identify a rapid rise in rates or a de-coupling of real rates and inflation (where the former rises and the latter falls). This scenario would be bad for risk assets broadly and impact long duration assets more harshly as the discount rate inflects higher.”
Keep in mind that some of Third Point’s largest holdings have been international stakes and as such haven’t been listed on their 13F filings. One example is Prudential Plc, which they own in size.
In short selling in international markets, Third Point has disclosed it was short 0.67% of J Sainsbury Plc in the UK as of January 1st, 2021. This is down from 0.89% back in September.
Lastly, Dan Loeb recently joined Twitter (@DanielSLoeb1) as the trend of more hedge fund managers being active on the platform continues. A tweet from him on January 1st noted that, “It’s difficult to compete as an investor now if you don’t expand your investable universe into private securities. First, you miss the best entry points; second you will not be tuned into the new innovators that maybe about to disrupt your public cos.”
And with this, it should come as no surprise that Loeb has launched Third Point Ventures to invest in private companies.
View Third Point’s Updated Portfolio on the Next Page
Dan Loeb
Q4 2020 www.hedgefundwisdom.com
Third Point Has generated annualized returns of 14.7% over the past 20 years
Focuses on event-driven and distressed plays
View his recommended reading list

39
Third Point Fourth Quarter 2020 Portfolio:
Q4 2020 www.hedgefundwisdom.com
Continued on next page …
Rank Company Name Ticker Put/Call % of Portfolio Activity Value # of Shares
1 PG&E Corp PCG 8.16% Unchanged $1,058,293,000 84,935,257 2 Walt Disney Co DIS 6.70% -9% $869,664,000 4,800,000 3 Danaher Corp. DHR 5.14% Unchanged $666,420,000 3,000,000 4 IAA Inc IAA 4.96% -6% $643,302,000 9,900,000 5 Upstart Holdings, Inc. UPST 4.01% New $520,444,000 13,381,222 6 Charter Communications CHTR 3.83% Unchanged $496,162,000 750,000 7 Amazon.com Inc. AMZN 3.64% -29% $472,255,000 145,000 8 Alphabet Inc. Class A GOOGL 3.51% New $455,686,000 260,000 9 Burlington Stores Inc BURL 3.37% Unchanged $436,788,000 1,670,000
10 Intuit, Inc. INTU 2.93% +233% $379,850,000 1,000,000 11 VISA Inc V 2.61% Unchanged $339,032,000 1,550,000 12 Alibaba Group BABA 2.51% -45% $325,822,000 1,400,000 13 IQVIA Holdings Inc IQV 2.50% Unchanged $324,369,000 1,810,400 14 Avantor Inc AVTR 2.39% +120% $309,650,000 11,000,000 15 Fidelity National Info FIS 2.33% -33% $302,218,000 2,136,422 16 Facebook Inc FB 2.32% -2% $300,476,000 1,100,000 17 TransDigm Group Inc TDG 2.31% +11% $300,142,000 485,000 18 JD.com Inc ADR JD 2.30% -24% $298,860,000 3,400,000 19 S&P Global Inc SPGI 2.28% +16% $295,857,000 900,000 20 Microsoft Corp. MSFT 2.23% +18% $289,146,000 1,300,000 21 Ferrari N.V. RACE 1.92% Unchanged $249,029,000 1,085,000 22 Adobe Systems, Inc. ADBE 1.75% -29% $227,555,000 455,000 23 Salesforce.com Inc. CRM 1.54% -37% $200,277,000 900,000 24 Aptiv PLC APTV 1.51% New $195,435,000 1,500,000 25 TE Connectivity Ltd TEL 1.45% Unchanged $187,658,000 1,550,000 26 Planet Fitness Inc PLNT 1.38% +199% $179,007,000 2,305,900 27 Expedia Group Inc EXPE 1.22% -26% $158,880,000 1,200,000 28 Black Knight Inc BKI 1.19% Unchanged $154,612,000 1,750,000 29 Stanley Black & Decker SWK 1.13% New $146,034,000 817,841 30 NIKE Inc. NKE 1.09% New $141,470,000 1,000,000 31 Catalent Inc CTLT 0.98% New $127,486,000 1,225,000 32 Leslies, Inc. LESL 0.96% New $124,875,000 4,500,000 33 CarMax Inc. KMX 0.93% New $120,436,000 1,275,000 34 Global Blue Group GB 0.92% -12% $118,685,000 9,129,625 35 RH Common Stock RH 0.89% New $115,662,000 258,452 36 UnitedHealth Group Inc. UNH 0.87% New $112,218,000 320,000 37 Equitrans Midstream Corp ETRN 0.81% Unchanged $104,520,000 13,000,000 38 PG&E Corp. Equity Units PCGU 0.76% Unchanged $98,272,000 800,000 39 Jaws Acquisition Corp. JWS 0.59% New $77,108,000 5,750,000 40 Foley Trasimene Acq II BFT 0.58% New $75,500,000 5,000,000 41 Zillow Group Inc Class C Z 0.55% New $71,961,000 554,400 42 ContextLogic Inc WISH 0.52% New $67,078,000 3,853,050 43 Pinterest Inc PINS 0.51% -72% $65,900,000 1,000,000 44 Radius Global RADI 0.45% New $57,825,000 4,500,000 45 Palantir Technologies Inc. PLTR 0.42% Unchanged $54,135,000 2,356,991

40
Third Point Fourth Quarter 2020 Portfolio:
Q4 2020 www.hedgefundwisdom.com
Next Page: Sequoia Fund
Rank Company Name Ticker Put/Call % of Portfolio Activity Value # of Shares
46 Estee Lauder Companies EL 0.41% New $53,238,000 200,000 47 Intel Corp. INTC 0.38% New $49,820,000 1,000,000 48 Vontier Corp. VNT 0.31% New $40,128,000 1,201,439 49 Reinvent Technology RTP.U 0.28% Unchanged $36,750,000 3,000,000 50 SocialCapHedosophiaVI IPOF.U 0.27% New $35,502,000 2,750,000 51 JAWS Spitfire Acquisition SPFR.U 0.26% New $33,150,000 3,000,000 52 Avanti Acquisition Corp. AVAN.U 0.25% New $32,520,000 3,000,000 53 GO Acquisition Corp. GOAC.U 0.25% Unchanged $31,890,000 3,000,000 54 Kadmon Holdings Inc KDMN 0.24% Unchanged $31,545,000 7,601,115 55 DoorDash, Inc. DASH 0.22% New $28,550,000 200,000 56 Cohn Robbins Holdings CRHC.U 0.21% Unchanged $26,875,000 2,500,000 57 SocialCapHedosophiaV IPOE.U 0.20% New $26,360,000 2,000,000 58 Dish Network DISH 0.18% New $23,036,000 712,300 59 Bluescape Opportunities BOAC.U 0.17% New $22,320,000 2,000,000 60 Far Peak Acquisition Corp. FPAC/U 0.16% New $20,700,000 2,000,000 61 Bright Horizons Family BFAM 0.15% New $19,890,000 114,975 62 Altimeter Growth Corp. AGCUU 0.15% New $19,500,000 1,500,000 63 FirstMark Horizon Acq FMAC.U 0.13% New $17,100,000 1,500,000 64 SocialCapHedosophiaIV IPOD.U 0.13% New $16,824,000 1,150,000 65 Marquee Raine Acq MRACU 0.12% New $15,162,000 1,400,000 66 Reinvent Technology RTPZ.U 0.11% New $13,656,000 1,200,000 67 Star Peak Energy STPK 0.09% New $11,560,000 565,000 68 Rice Acquisition Corp. RICE.U 0.09% New $11,310,000 1,000,000 69 HumanCo Acquisition HMCOU 0.09% New $11,020,000 1,000,000 70 Dragoneer Growth II DGNS 0.06% New $7,994,000 700,000 71 FoleyTrasimeneIIWarrants BFT.WS 0.06% New $7,650,000 1,666,666 72 Treasury Bond ETF SHY 0.04% +15% $4,756,000 55,060 73 BristolMyersSquibb Rights BMY/R 0.03% Unchanged $4,141,000 6,000,000 74 Global Blue Warrants GB.WS 0.02% Unchanged $2,187,000 1,333,333
Square Inc SQ Sold 10X Genomics Inc TXG Sold Pactiv Evergreen Inc. PTVE Sold Chindata Group CD Sold Fortive Corp FTV Sold Caesars Entertainment CZR Sold Replay Acquisition RPLA/U Sold Foley Trasimene Acq II BFT.U Sold Dish Network Notes DISH Sold GoodRx Holdings, Inc. GDRX Sold

41
Sequoia Fund was up 14.68% in the fourth quarter and returned 23.33% for the year in 2020.
During the quarter, Sequoia initiated a new stake in Netflix (NFLX) and made it a core position. The fund likes that NFLX and Walt Disney (DIS ~ their 7th largest holding) are bets on the global secular trend toward subscription-based streaming. They argue this model really favors first movers who then create a virtuous cycle: a vast and compelling content library attracts new subscribers, which then gives them more revenue to re-invest in the content selection, which furthers even more subscriber growth.
In their Q4 letter they write, “Netflix and Disney are investing heavily to drive this virtuous cycle, which is depressing their current profits, but people can only watch so much TV and wrap their arms around so much selection, which means that the growth of programming spend will eventually have to slow. If the world’s two most compelling collections of streamed video content continue to attract incremental subscribers amidst a moderating pace of investment, then content costs per subscriber will begin to fall, widening competitive gaps that are already very substantialby layering a cost advantage on top of a product quality advantage. As a result of this dynamic—which we think competitors will struggle to replicate—we believe that the leaders of the video entertainment industry’s streaming era will be far larger and more profitable than those of the cable era. While this possibility is by no means lost on the stock market, we invested in Disney and
Key Takeaways
New Posit ions: Netflix (NFLX) Sold Out: None
Long-term investors with lower turnover
Returned 13.77% annualized since inception
Ruane, Cunniff & Goldfarb
Netflix because we believed their prices still failed to discount the degree to which we expect a small handful of victors to take most of the streaming era’s significantly greater spoils.”
Sequoia’s top holding is now Taiwan Semiconductor (TSM) mainly due to share price appreciation. The company manufactures semiconductor chips that many chip designers (like AMD and Apple) outsource production to them. The company recently took the technology process lead away from Intel and this lead only looks to grow as TSM announced massive capex.
Sequoia touches on TSM in its letter: “TSM is able to earn gigantic profit margins and returns on investment producing what is arguably the most important manufactured component in the modern economy. Thanks to a raft of powerful technological trends, including 5G communications, artificial intelligence and cloud computing, we expect the company to grow its profits well in excess of global GDP while distributing most of them each year as dividends. Though the stock has more than doubled from our cost, we consider the current valuation of the business reasonable in light of its unique advantages and growth prospects.”
Sequoia also continued to trim exposure to Wayfair (W) during the quarter. The stock appreciated very significantly in the past year and caused their position size to balloon. As such, they’ve been reducing down their position size. Sequoia’s letter also notes they have since liquidated the last remainder of their Amazon (AMZN) position due to valuation, as shares also surged.
Lastly, keep in mind Sequoia has two international top-10 holdings: Eurofins Scientific is actually their 8th largest holding and Constellation Software is now their 9th largest holding.
View Sequoia Fund’s Updated Portfolio on the Next Page
Q4 2020 www.hedgefundwisdom.com
Sequoia Fund
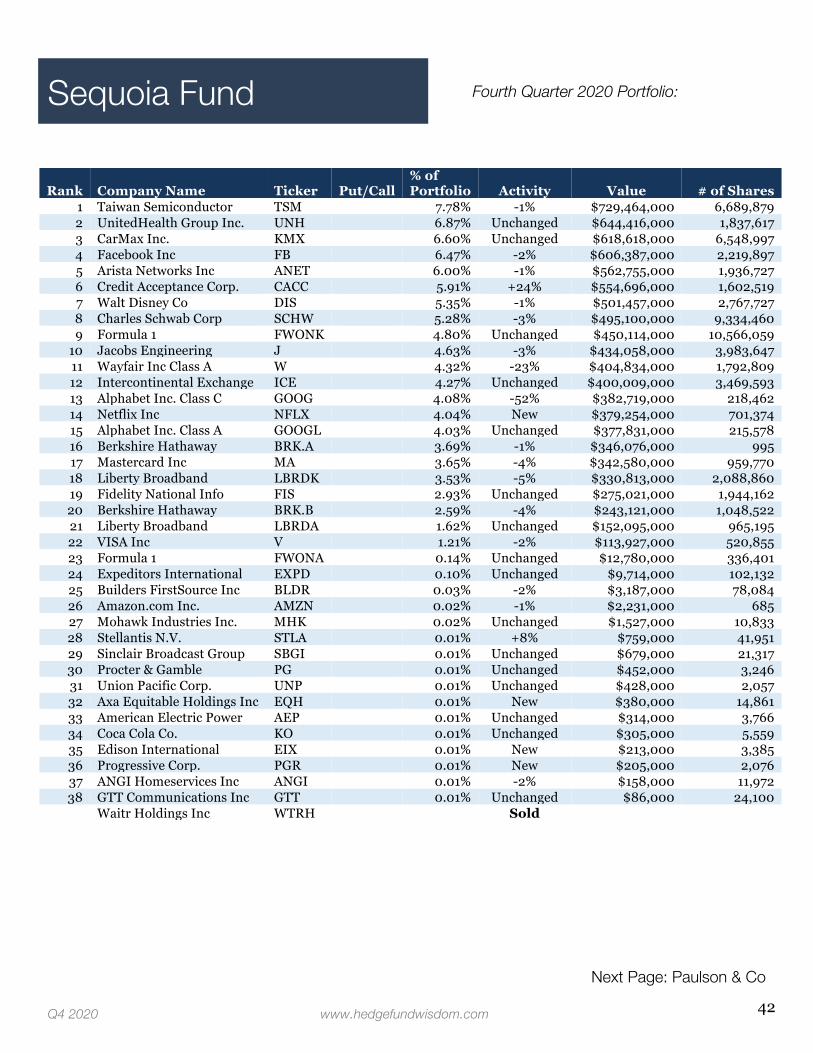
42
Sequoia Fund Fourth Quarter 2020 Portfolio:
Q4 2020 www.hedgefundwisdom.com
Next Page: Paulson & Co
Rank Company Name Ticker Put/Call % of Portfolio Activity Value # of Shares
1 Taiwan Semiconductor TSM 7.78% -1% $729,464,000 6,689,879 2 UnitedHealth Group Inc. UNH 6.87% Unchanged $644,416,000 1,837,617 3 CarMax Inc. KMX 6.60% Unchanged $618,618,000 6,548,997 4 Facebook Inc FB 6.47% -2% $606,387,000 2,219,897 5 Arista Networks Inc ANET 6.00% -1% $562,755,000 1,936,727 6 Credit Acceptance Corp. CACC 5.91% +24% $554,696,000 1,602,519 7 Walt Disney Co DIS 5.35% -1% $501,457,000 2,767,727 8 Charles Schwab Corp SCHW 5.28% -3% $495,100,000 9,334,460 9 Formula 1 FWONK 4.80% Unchanged $450,114,000 10,566,059
10 Jacobs Engineering J 4.63% -3% $434,058,000 3,983,647 11 Wayfair Inc Class A W 4.32% -23% $404,834,000 1,792,809 12 Intercontinental Exchange ICE 4.27% Unchanged $400,009,000 3,469,593 13 Alphabet Inc. Class C GOOG 4.08% -52% $382,719,000 218,462 14 Netflix Inc NFLX 4.04% New $379,254,000 701,374 15 Alphabet Inc. Class A GOOGL 4.03% Unchanged $377,831,000 215,578 16 Berkshire Hathaway BRK.A 3.69% -1% $346,076,000 995 17 Mastercard Inc MA 3.65% -4% $342,580,000 959,770 18 Liberty Broadband LBRDK 3.53% -5% $330,813,000 2,088,860 19 Fidelity National Info FIS 2.93% Unchanged $275,021,000 1,944,162 20 Berkshire Hathaway BRK.B 2.59% -4% $243,121,000 1,048,522 21 Liberty Broadband LBRDA 1.62% Unchanged $152,095,000 965,195 22 VISA Inc V 1.21% -2% $113,927,000 520,855 23 Formula 1 FWONA 0.14% Unchanged $12,780,000 336,401 24 Expeditors International EXPD 0.10% Unchanged $9,714,000 102,132 25 Builders FirstSource Inc BLDR 0.03% -2% $3,187,000 78,084 26 Amazon.com Inc. AMZN 0.02% -1% $2,231,000 685 27 Mohawk Industries Inc. MHK 0.02% Unchanged $1,527,000 10,833 28 Stellantis N.V. STLA 0.01% +8% $759,000 41,951 29 Sinclair Broadcast Group SBGI 0.01% Unchanged $679,000 21,317 30 Procter & Gamble PG 0.01% Unchanged $452,000 3,246 31 Union Pacific Corp. UNP 0.01% Unchanged $428,000 2,057 32 Axa Equitable Holdings Inc EQH 0.01% New $380,000 14,861 33 American Electric Power AEP 0.01% Unchanged $314,000 3,766 34 Coca Cola Co. KO 0.01% Unchanged $305,000 5,559 35 Edison International EIX 0.01% New $213,000 3,385 36 Progressive Corp. PGR 0.01% New $205,000 2,076 37 ANGI Homeservices Inc ANGI 0.01% -2% $158,000 11,972 38 GTT Communications Inc GTT 0.01% Unchanged $86,000 24,100
Waitr Holdings Inc WTRH Sold

43
Paulson & Co is now a family office that pursues its roots of event-driven and risk arbitrage investing.
Paulson shows a ‘new’ stake in Viatris (VTRS), but in reality this is merely a result of a corporate transaction completing. Paulson’s former holding Mylan (MYL) merged with Upjohn, Pfizer’s (PFE) generics business during the quarter. Shareholders of MYL received 1 share of VTRS for each MYL share held, while PFE shareholders received 0.12 VTRS for each PFE share held.
This means Paulson did not adjust his holdings after the transaction given his share count was unchanged. It remains to be seen though if he was merely playing the event-driven angle here or if he is compelled to hold onto the newly formed business longer as it extracts synergies.
After all, it’s now the largest generics business in the world with a market cap of over $22 billion. Viatris now houses products such as Viagra, Lipitor and EpiPen under one roof.
John Paulson’s top holding continues to be Horizon Therapeutics (HZNP) for the second consecutive quarter. Prior to that, it was a top-5
Key Takeaways
New Posit ions: Viatris (VTRS) ~ Mylan merger Thryv (THRY) Alexion Pharmaceutical (ALXN) RealPage (RP) American Equity Investment (AEL) Sold Out: Taubman (TCO) ~ merger w/ SPG Tiffany (TIF) ~ merger w/ LVMH
holding for around a year. During the fourth quarter, Paulson boosted
his stake in HZNP a further 20%. And now in the first quarter, the company has announced it will acquire Viela Bio to enhance its development pipeline as well as grow its portfolio of medicines focused on rare diseases.
Paulson’s second largest position is Bausch Health (BHC) and his stake remains unchanged. Activist investor Carl Icahn recently got involved and disclosed a 27.8 million share stake, making him the largest shareholder. He said he plans to push for changes at the company and may seek seats on the board.
Bausch replied by issuing a boilerplate statement that they welcome open communication and are always looking to enhance shareholder value. They also point out that they’ve recently outperformed the high-end of guidance and generated over $2.2 billion of revenue with solid cash flow.
In the UK, Paulson also filed that they owned 8.76% of voting rights of Premier Foods Plc as of December 15th, 2020. The company owns brands such as Mr Kipling, Batchelors, Ambrosia, Bird’s Custard, Sharwood’s and more.
The company installed new management over the past few years and they’ve cut the debt load, reducing leverage from 3.2x down to 2.3x with the goal of getting down to 1.5x in the medium term. Premier Foods has also shed some brands over the years, though its recent attempt to offload its Ambrosia custard brand was unsuccessful, as it couldn’t whip up a satisfactory bid. The CFO has said that they’ll look to reduce debt, invest back into their businesses, and perhaps consider bolt-on M&A.
View Paulson & Co’s Updated Portfolio on the Next Page
Q4 2020 www.hedgefundwisdom.com
Paulson & Co John Paulson
Predicted & profited from the subprime crisis
Runs multiple funds; legacy fund strategy is risk arbitrage
Featured in the books The Greatest Trade Ever and the newly released Merger Masters: Tales of Arbitrage

44
Paulson & Co Fourth Quarter 2020 Portfolio:
Next Page: Tiger Management
Q4 2020 www.hedgefundwisdom.com
Rank Company Name Ticker Put/Call % of Portfolio Activity Value # of Shares
1 Horizon Therapeutics PLC HZNP 15.17% +19% $584,574,000 7,991,440 2 Bausch Health Companies BHC 13.95% Unchanged $537,452,000 25,839,035 3 BrightSphere Investment OMAM 10.01% Unchanged $385,611,000 20,000,552 4 SPDR Gold Trust GLD 8.77% Unchanged $337,859,000 1,894,252 5 Viatris Inc VTRS 5.58% Unchanged $215,103,000 11,478,260 6 NovaGold Resources Inc NG 5.58% Unchanged $214,928,000 22,226,300 7 Takeda Pharmaceutical TAK 5.34% Unchanged $205,584,000 11,295,846 8 Discovery Inc Series C DISCK 4.69% Unchanged $180,784,000 6,902,805 9 Anglogold Ashanti Ltd AU 3.51% -14% $135,139,000 5,974,331
10 Endo International plc ENDP 3.42% +26% $131,588,000 18,327,012 11 Dish Network Corp DISH 3.04% Unchanged $117,095,000 3,620,750 12 International Tower Hill THM 2.22% Unchanged $85,464,000 61,930,724 13 Pacira BioSciences Inc PCRX 2.20% +13% $84,605,000 1,413,854 14 Barrick Gold Corp GOLD 2.10% +129% $80,795,000 3,546,772 15 Kirkland Lake Gold Ltd KL 2.05% Unchanged $79,050,000 1,502,853 16 ViacomCBS Inc. Class B VIAC 1.52% Unchanged $58,495,000 1,569,920 17 Thryv Holdings Inc THRY 1.13% New $43,422,000 3,216,437 18 Alexion Pharmaceuticals ALXN 1.01% New $39,060,000 250,000 19 RealPage Inc RP 0.91% New $34,896,000 400,000 20 Seabridge Gold Inc SA 0.86% +124% $33,080,000 1,570,000 21 Trilogy Metals TMQ 0.74% Unchanged $28,654,000 14,326,996 22 American Equity Inv AEL 0.72% New $27,660,000 1,000,000 23 Pretium Resources Inc PVG 0.72% Unchanged $27,552,000 2,400,000 24 SSR Mining SSRM 0.68% Unchanged $26,349,000 1,310,242 25 Equinox Gold Corp EQX 0.67% Unchanged $25,850,000 2,500,000 26 ExxonMobil Corp XOM 0.60% New $23,289,000 565,000 27 Energy Sector ETF XLE 0.59% New $22,551,000 595,000 28 Occidental Petroleum OXY 0.53% New $20,512,000 1,185,000 29 Newmark Group Inc NMRK 0.45% +54% $17,372,000 2,383,054 30 TIM S.p.A TIIAY 0.36% New $13,937,000 1,001,205 31 Overseas Shipholding OSG 0.35% Unchanged $13,482,000 6,300,000 32 EQT Corporation EQT 0.23% New $8,706,000 685,000 33 Iamgold Corp IAG 0.18% Unchanged $6,790,000 1,850,000 34 SPDR Gold Trust GLD CALL 0.08% New $3,210,000 18,000 35 SandRidge Energy Inc SD 0.05% Unchanged $2,066,000 666,535 36 Hycroft Mining Warrants HYMCZ 0.01% Unchanged $55,000 151,507
Tiffany & Co TIF Sold Lear Corp LEA Sold Qiagen N.V. QGEN Sold Taubman Centers, Inc. TCO Sold TIM S.A. TSU Sold
45
For the second consecutive quarter, the top quartile of Tiger Management’s portfolio remained largely unchanged.
Looking a bit further down the portfolio sheet, Julian Robertson’s firm shows an increased stake in Uber Technologies (UBER) during the fourth quarter. As you’ll see throughout the issue, Uber has garnered more attention from some hedge funds as of late.
Tiger also shows a brand new stake in 21Vianet (VNET), a Chinese data center provider that operates a carrier-neutral and cloud-neutral platform. This is now Tiger’s 20th largest position. When they would have been buying, VNET traded between $22 and $34 and currently trades around $40.
In the first quarter, VNET recently offered $525 million of convertible senior notes due 2026 and plans to use the proceeds to expand its data center infrastructure and repay some of their previous notes that are due in 2021.
The other major datacenter play in China is GDS Holdings (GDS), which other hedge funds are also involved in. In fact, other managers with ties to
Key Takeaways
New Posit ions: 21Vianet (VNET) Booking Holdings (BKNG) Fiserv (FISV) Sold Out: Salesforce (CRM) Union Pacific (UNP) Cloudflare (NET) Expedia (EXPE) Ping Identity (PING)
Robertson, such as Tiger Global and Tiger Pacific, hold shares of GDS. Hillhouse Capital, a prominent investor in China, also took a stake in GDS and became one of their largest shareholders in June 2020.
Another Chinese datacenter play just went public in the fourth quarter as well: hyperscale operator Chindata (CD). CD gained attention as being the datacenter behind China’s popular company ByteDance (parent of TikTok). A whopping 81.6% of CD’s revenue comes from ByteDance. Chindata was backed by Bain Capital.
Over the years, many funds invested in datacenters via exposure to Equinix (EQIX), which some Chinese counterparts might try to emulate.
While datacenters themselves are a commodity (anyone can get a warehouse and fill it with servers and power it), the real key to EQIX’s success has been co-location and interconnection. After all, speed is everything on the internet and one of the easiest ways to get somewhere faster is to shorten the distance.
As more companies co-locate servers in a particular datacenter, the easier it is to interconnect traffic. And there’s network effects at play here, as the more tenants a datacenter houses, it incentivizes others to join, which further benefits all players. Think of them as digital highways that are in prime locations that provide easy access to the most popular attractions with plenty of on and off ramps for traffic to get exactly where it needs to go quickly. The interconnection and co-location aspects are the key to making tenants sticky.
View Tiger Management’s Updated Portfolio on the Next Page
Q4 2020 www.hedgefundwisdom.com
Tiger Management Julian Robertson
Mentored the ‘Tiger Cub’ hedge funds & seeded other talented up & coming managers
Featured in the book A Tiger in the Land of
Bulls and Bears

46
Tiger Management Fourth Quarter 2020 Portfolio:
Q4 2020 www.hedgefundwisdom.com
Rank Company Name Ticker Put/Call % of Portfolio Activity Value # of Shares
1 Adaptive Biotechnologies ADPT 14.96% Unchanged $65,954,000 1,115,411 2 Aercap Holdings N.V. AER 14.61% Unchanged $64,420,000 1,413,334 3 Facebook Inc FB 9.31% +4% $41,029,000 150,200 4 Blackstone Group Inc BX 8.70% Unchanged $38,335,000 591,500 5 Microsoft Corp. MSFT 8.21% +1% $36,210,000 162,800 6 Micron Technology, Inc. MU 7.61% -2% $33,553,000 446,300 7 SLM Corp SLM 5.79% Unchanged $25,519,000 2,059,655 8 QUALCOMM Inc. QCOM 5.65% Unchanged $24,908,000 163,500 9 Alphabet Inc. Class C GOOG 5.48% +1% $24,158,000 13,790
10 Controladora Vuela Co VLRS 2.79% Unchanged $12,298,000 990,161 11 Ooma Inc OOMA 2.42% Unchanged $10,668,000 740,854 12 Ryanair Holdings ADR RYAAY 2.04% Unchanged $9,010,000 81,927 13 Apollo Global APO 1.74% Unchanged $7,670,000 156,602 14 SVMK Inc SVMK 1.38% Unchanged $6,102,000 238,837 15 Workday Inc WDAY 0.81% +26% $3,570,000 14,900 16 Uber Technologies Inc UBER 0.71% +50% $3,121,000 61,200 17 Elastic NV ESTC 0.69% +56% $3,054,000 20,900 18 Spotify Technology SA SPOT 0.63% Unchanged $2,794,000 8,879 19 Amazon.com Inc. AMZN 0.57% -7% $2,508,000 770 20 21Vianet Group Inc ADR VNET 0.53% New $2,338,000 67,400 21 Sea Ltd ADR SE 0.52% Unchanged $2,289,000 11,500 22 Alliance Data Systems Corp ADS 0.46% +148% $2,023,000 27,300 23 Crowdstrike Holdings Inc CRWD 0.45% -18% $1,991,000 9,400 24 Booking Holdings Inc BKNG 0.43% New $1,893,000 850 25 FIserv Inc. FISV 0.41% New $1,788,000 15,700 26 Alpine Immune Sciences ALPN 0.39% Unchanged $1,735,000 137,728 27 Ally Financial Inc ALLY 0.36% -50% $1,587,000 44,500 28 Hubspot Inc HUBS 0.36% New $1,586,000 4,000 29 DocuSign Inc DOCU 0.28% New $1,245,000 5,600 30 US Foods Holding Corp USFD 0.27% New $1,192,000 35,800 31 Lyft Inc LYFT 0.26% -48% $1,125,000 22,900 32 Walt Disney Co DIS 0.23% New $996,000 5,500 33 Bank of NT Butterfield NTB 0.20% Unchanged $897,000 28,800 34 StoneCo Ltd STNE 0.18% Unchanged $814,000 9,700 35 Wells Fargo & Co WFC 0.15% -60% $664,000 22,000 36 Linx SA LINX 0.10% +92% $422,000 59,500 37 Momo Inc ADR MOMO 0.08% Unchanged $370,000 26,500 38 Asana, Inc. ASAN 0.08% New $370,000 12,520 39 Staar Surgical Co. STAA 0.07% New $325,000 4,100 40 Synchrony Financial SYF 0.07% -88% $299,000 8,600
MongoDB Inc MDB Sold Ping Identity Holding Corp PING Sold Salesforce.com Inc. CRM Sold Shopify Inc SHOP Sold Square Inc SQ Sold The Trade Desk Inc Class A TTD Sold Union Pacific Corp. UNP Sold Expedia Group Inc EXPE Sold Cloudflare Inc NET Sold

47
As previously highlighted, Jeff Ubben has left ValueAct and now runs Inclusive Capital, focused on ESG investing (environmental, social, and governance) and Mason Morfit continues to run the show at ValueAct.
During the fourth quarter, ValueAct initiated a brand new stake in Fiserv (FISV). This is a smaller position for them for now, so we’ll have to wait and see if they size it up to a core stake. The company is a financial services technology provider. It offers debit and credit card processing, person-to-person payments, internet and mobile banking software, ACH and treasury management solutions and much more.
Over time, the company has used cashflow to buyback stock and make accretive acquisitions. The most recent example of the latter is FISV’s merger with First Data. And on the buyback side, the company has authorized a repurchase plan of up to 10% of shares outstanding.
Fiserv has three main segments. 1) Merchant Acquirer: this is where they go out and try to become a merchant’s payment processor. It represents almost 40% of revenue and they’re the biggest player in this space. And here’s an eye-opening statistic: they process 40% of all in-person purchases in the US. They also own two solid franchises:
Key Takeaways
New Posit ions: Fiserv (FISV) Sold Out: A.O. Smith (AOS) Armstrong Flooring (AFI)
Clover and Carat. The former competes with Square (SQ) and has been a big winner in the space and the latter is FISV’s omnichannel payments solution. However, there’s fierce competition in the merchant acquirer space.
2) Payments & Network: this segment is comprised of issuer solutions, card services, and digital/other payments. This overall group represents around 40% of company revenue. It is the top player in issuer processing and also runs the third largest debit network behind Visa (V) and Mastercard (MA) due to Fiserv’s Accel combining with First Data’s Star after the merger.
3) Fintech is around 20% of revenue and houses things like account processing as well as digital banking. This is the legacy segment of the company and it powers around 40% of US banks’ processing such as opening accounts, online and/or mobile banking, and more. This segment is an oligopoly and they compete with Fidelity National Information Services (FIS) and Jack Henry & Associates (JKHY).
ValueAct may have been attracted by FISV’s valuation, as it’s trading around a forward P/E of 22-23x, which some analysts argue isn’t that expensive for a company that can compound free cashflow per share at 10-15% or potentially higher. And while most argue the networks themselves (V/MA) are better businesses, FISV is perhaps a way to play some similar trends cheaper on a relative basis.
Turning to the selling side of ValueAct’s portfolio, the firm trimmed its stake in Morgan Stanley (MS) for the second consecutive quarter.
Lastly, remember that ValueAct’s main activist fund also holds positions in Japan, such as Nintendo and Olympus.
View ValueAct Capital’s Updated Portfolio on the Next Page
Q4 2020 www.hedgefundwisdom.com
ValueAct Capital Mason Morfit
Activist investor that runs a concentrated $15 billion portfolio
Long-term focused, often holding positions for
many years

48
ValueAct Capital Fourth Quarter 2020 Portfolio:
Q4 2020 www.hedgefundwisdom.com
Next Page: Bridger Capital
Rank Company Name Ticker Put/Call % of Portfolio Activity Value # of Shares
1 Seagate Technology plc STX 21.74% -4% $1,873,917,000 30,146,673 2 Citigroup, Inc. C 19.33% Unchanged $1,666,392,000 27,025,500 3 KKR & Co Inc KKR 17.87% -15% $1,540,645,000 38,050,000 4 LKQ Corp LKQ 8.81% Unchanged $759,343,000 21,547,746 5 Trinity Industries Inc TRN 8.27% Unchanged $712,685,000 27,005,855 6 CBRE Group CBRE 7.44% Unchanged $641,614,000 10,229,820 7 Morgan Stanley MS 6.58% -28% $567,683,000 8,283,722 8 SLM Corp SLM 4.64% Unchanged $400,126,000 32,294,254 9 Bausch Health Companies BHC 4.33% Unchanged $373,185,000 17,941,603
10 CDW Corp. CDW 0.56% +54% $48,514,000 368,116 11 FIserv Inc. FISV 0.43% New $37,378,000 328,281
A.O. Smith AOS Sold Armstrong Flooring Inc AFI Sold

49
After initiating a position in Merck (MRK) last quarter, Bridger Capital continued to buy in Q4, boosting its allocation a further 26%. This comes as Warren Buffett’s Berkshire Hathaway was also a buyer of MRK shares.
During the quarter when both firms were buying, MRK traded from $84 down to a low of around $73. And interestingly enough, thus far in the first quarter, MRK started trading around those highs but has re-traced back down and is trading at around the lowest point they could have been buying.
While the company was working on COVID-19 vaccines, they discontinued development and instead will continue to focus on therapies instead. They’ve also been in talks to manufacture other companies’ vaccines.
One other stock Bridger was actively buying during the quarter was Uber (UBER). They ratcheted up exposure by 27% and it’s now their tenth largest holding. As highlighted earlier, numerous hedge funds show increased stakes in the
Key Takeaways
New Posit ions: SQZ Biotechnologies (SQZ) LivaNova (LIVN) First Citizens Bank (FCNCA) Avanti Acquisition (AVAN.U) Acies Acquisition (ACACU) Sold Out: MGM Resorts (MGM) Centene (CNC) Dicerna Pharma (DRNA) Inspire Medical (INSP) Bristol Myers Squibb Rights (BMY/R)
rideshare and food delivery giant. While the former portion of their business had been negatively affected by the pandemic, the latter has been a beneficiary as people have spent more time at home and less time eating out.
Interestingly though, Uber’s Rides business has actually returned close to pre-pandemic levels in many geographies in categories such as social and workday/commute. The only category that remains depressed is airport rides given the lack of travel. And on the Uber Eats platform, the company has started to expand into advertising by offering sponsored listings.
Roberto Mignone’s fund only shows one ‘new’ position of any real size, but even then it barely lands in his top 25 holdings: SQZ Biotechnologies (SQZ). And there’s also a caveat here, as Bridger actually invested in the company back when it was still private. The company completed its IPO during the quarter and is a biotech firm that develops transformative cell therapies for cancer patients.
On the selling side of Bridger’s book, they cut exposure to Natera (NTRA) almost in half. Perhaps this is merely a risk management maneuver given that NTRA shares surged from $20 to over $100 throughout the course of 2020, though that’s just speculation. Despite the reduction, they still maintain a notable position size, as it’s their fourth largest holding.
View Bridger Capital’s Updated Portfolio on the Next Page
Q4 2020 www.hedgefundwisdom.com
Bridger Capital Roberto Mignone Typically focuses on the healthcare sector
Known for his sleuthing abilities on the
short side

50
Bridger Capital Fourth Quarter 2020 Portfolio:
Q4 2020 www.hedgefundwisdom.com
Next Page: Omega Advisors
Rank Company Name Ticker Put/Call % of Portfolio Activity Value # of Shares
1 American Well Corp. AMWL 8.95% Unchanged $117,347,000 4,632,740 2 Caesars Entertainment CZR 6.29% -18% $82,455,000 1,110,206 3 GoDaddy Inc GDDY 6.01% -2% $78,816,000 950,160 4 Natera Inc NTRA 5.34% -47% $70,067,000 704,050 5 Alexion Pharmaceuticals ALXN 5.03% +12% $65,973,000 422,254 6 Post Holdings Inc POST 4.22% Unchanged $55,274,000 547,211 7 Ross Stores Inc ROST 4.21% +33% $55,238,000 449,783 8 Charter Communications CHTR 4.15% -4% $54,457,000 82,317 9 Alcon Inc ALC 4.14% -18% $54,267,000 822,471
10 Uber Technologies Inc UBER 3.96% +27% $51,944,000 1,018,500 11 Merck & Co MRK 3.68% +26% $48,218,000 589,461 12 Morgan Stanley MS 3.42% -20% $44,786,000 653,530 13 GDS Holdings Ltd ADR GDS 3.28% Unchanged $43,065,000 459,904 14 Alnylam Pharmaceuticals ALNY 3.11% -13% $40,763,000 313,632 15 LKQ Corp LKQ 3.02% -12% $39,651,000 1,125,180 16 VeriSign Inc. VRSN 2.85% Unchanged $37,352,000 172,604 17 HCA Healthcare Inc HCA 2.74% -39% $35,927,000 218,454 18 INCYTE Corporation INCY 2.68% +18% $35,196,000 404,650 19 Etsy Inc ETSY 2.52% Unchanged $33,038,000 185,703 20 Atara Biotherapeutics Inc ATRA 2.28% -4% $29,931,000 1,524,760 21 Ironwood Pharma IRWD 2.14% -11% $28,099,000 2,466,972 22 Frontdoor Inc FTDR 1.82% +111% $23,850,000 475,000 23 SQZ Biotechnologies Co SQZ 1.79% New $23,411,000 807,827 24 Pretium Resources Inc PVG 1.23% Unchanged $16,146,000 1,406,412 25 Teva Pharmaceutical TEVA 1.10% Unchanged $14,475,000 1,500,000 26 LivaNova PLC LIVN 1.09% New $14,335,000 216,515 27 Liberty Broadband LBRDA 1.06% Unchanged $13,841,000 87,833 28 Zimmer Biomet ZBH 1.05% New $13,725,000 89,070 29 TG Therapeutics Inc TGTX 1.02% Unchanged $13,364,000 256,897 30 First Citizens FCNCA 0.88% New $11,485,000 20,000 31 Avanti Acquisition Corp. AVAN.U 0.83% New $10,840,000 1,000,000 32 DexCom Inc DXCM 0.74% -16% $9,659,000 26,124 33 Acies Acquisition Corp. ACACU 0.74% New $9,648,000 900,000 34 Consonance-HFW Acq CHFW.U 0.56% New $7,329,000 700,000 35 Quanterix Corp QTRX 0.48% -35% $6,309,000 135,685 36 Laboratory Corp LH 0.48% -64% $6,239,000 30,650 37 Dermtech DMTK 0.45% New $5,849,000 180,304 38 Arena Pharmaceuticals Inc ARNA 0.40% -81% $5,283,000 68,764 39 Alector Inc ALEC 0.26% Unchanged $3,467,000 229,117
MGM Resorts MGM Sold Inspire Medical Systems INSP Sold BristolMyersSquibb Rights BMY/R Sold Centene Corp CNC Sold Dicerna Pharmaceuticals DRNA Sold

51
Lee Cooperman appeared on CNBC last month and noted that, “There’s a meaningful chunk of the market today that’s in euphoria.” That said, he feels that it’s hard to fight the market in the near-term due to all the monetary and fiscal policies. He still feels that longer-term we’re borrowing from the future.
Cooperman also added that, “At the end of the day, the stock market reflects economic progress or the lack thereof … water seeks its own level.”
He indicated he’s finding pockets of value and there’s evidence of that in his portfolio on the next page. However, he still cautioned that, “Everybody is moving out on the risk curve, and one of these days – not today, not tomorrow – but one of these days people are going to come in on the risk curve, and I think we’ll have lots of issues to deal with.”
He continued to also sound alarm about interest rates and taxes, noting that rates can’t stay low forever and taxes will have to go higher to cover the national debt.
During the fourth quarter, Cooperman aggressively added to his MP Materials (MP) stake, increasing his position size by 304% and making it his sixth largest holding. Prior to this, Cooperman
Key Takeaways
New Posit ions: General Motors (GM) Barings (BBDC) WillScot (WSC) Comcast (CMCSA) Sold Out: MVC Capital (MVC) Lee Enterprises (LEE)
Leon Cooperman
View Omega Advisors’ Updated Portfolio on the Next Page
Has generated annualized returns of 12.4% since
inception; recently converted into a family office
Prior to founding Omega, he spent 25 years at Goldman Sachs in their Asset Management division
had invested in Fortress Acquisition’s SPAC which merged with MP to take them public.
MP Materials is a mining company but is basically a play on electric vehicles. In Southern California they mine rare earth minerals that are then used for magnets in electric motors. The thesis is that as electric vehicle penetration increases, they will go along for the ride as a beneficiary. Across the world, around 2 million electric cars were sold in 2019 and some analysts estimate as many as 30 million vehicles will be sold by 2030.
Another part of the story here is vertical integration. Right now, MP merely mines the concentrates and then others refine it. Some of the SPAC money will be used to build out refineries in North America so the company can then sell finished products.
MP is expecting profit to rise from around $30 million to around $250 million over the next two to three years. During the quarter when Cooperman was acquiring more MP shares, they traded between $15 and $40 and currently trade around $41.
Sticking with the electric vehicle theme, Cooperman also shows a new stake in General Motors (GM), now his 27th largest holding. While the company primarily makes internal combustion engine (ICE) vehicles presently, they recently announced that by 2035 they will exclusively offer electric vehicles.
Lastly, in the aforementioned interview Cooperman noted that Alphabet (GOOGL) is now his family office’s largest position. That wasn’t the case in Q4, so it’s unclear if he’s sized up this position or reduced others (GOOGL was his 3rd largest stake at the end of the year).
Q4 2020 www.hedgefundwisdom.com
Omega Advisors

52
Omega Advisors Fourth Quarter 2020 Portfolio:
Q4 2020 www.hedgefundwisdom.com
Next Page: Coatue Management
Rank Company Name Ticker Put/Call % of Portfolio Activity Value # of Shares
1 Mr Cooper Group Inc COOP 11.17% +7% $155,114,000 4,998,831 2 FIserv Inc. FISV 8.45% Unchanged $117,344,000 1,030,600 3 Alphabet Inc. Class A GOOGL 7.58% Unchanged $105,158,000 60,000 4 Cigna Holding Co CI 6.37% Unchanged $88,477,000 425,000 5 Trinity Industries Inc TRN 5.74% Unchanged $79,698,000 3,020,000 6 Mp Materials Corp FVACU 5.62% +304% $78,044,000 2,426,000 7 Ashland Inc. ASH 4.58% Unchanged $63,516,000 801,965 8 Microsoft Corp. MSFT 3.94% Unchanged $54,650,000 245,705 9 WPX Energy Inc WPX 3.63% -4% $50,416,000 6,186,000
10 Ferro Corp. FOE 3.50% Unchanged $48,584,000 3,320,869 11 Athene Holding Ltd Class A ATH 3.42% +12% $47,454,000 1,100,000 12 Energy Transfer Equity LP ET 2.87% +28% $39,861,000 6,450,000 13 Amazon.com Inc. AMZN 2.70% Unchanged $37,455,000 11,500 14 Chimera Investment Corp CIM 2.51% Unchanged $34,824,000 3,397,500 15 Arbor Realty Trust ABR 2.38% Unchanged $33,026,000 2,329,082 16 Navient Corp NAVI 2.34% +4% $32,455,000 3,305,000 17 New Senior Investment SNR 1.87% Unchanged $25,917,000 5,003,200 18 Ocwen Financial Corp OCN 1.83% Unchanged $25,413,000 879,037 19 Vertiv Holdings VRT 1.75% +18% $24,271,000 1,300,000 20 Pioneer PE Holding PE 1.74% -11% $24,140,000 1,700,000 21 Citigroup, Inc. C 1.64% Unchanged $22,814,000 370,000 22 SunOpta Inc. STKL 1.35% +2% $18,672,000 1,600,000 23 AMC Networks Inc AMCX 1.29% -36% $17,885,000 500,000 24 Motorola Solutions Inc MSI 1.23% Unchanged $17,006,000 100,000 25 Magnolia Oil & Gas Corp MGY 1.22% -9% $16,908,000 2,394,950 26 General Motors Co GM 1.12% New $15,615,000 375,000 27 Barings BDC BBDC 1.10% New $15,285,000 1,661,461 28 WillScot Corp WSC 1.09% New $15,062,000 650,085 29 Ellington Financial EFC 0.81% Unchanged $11,278,000 760,000 30 Aspen Group Inc ASPU 0.80% Unchanged $11,130,000 1,000,000 31 First Eagle Alternative FCRD 0.76% +1% $10,575,000 2,897,220 32 Enterprise Products EPD 0.71% Unchanged $9,795,000 500,000 33 Comcast Corp. Class A CMCSA 0.57% New $7,860,000 150,000 34 Facebook Inc FB 0.53% Unchanged $7,375,000 27,000 35 Gannett Co Inc GCI 0.37% +46% $5,191,000 1,545,062 36 Brigham Minerals Inc MNRL 0.31% Unchanged $4,258,000 387,429 37 Surgalign Holdings Inc SRGA 0.30% -3% $4,181,000 1,909,049 38 Sierra Metals Inc SMTS 0.27% +41% $3,771,000 1,135,858 39 Falcon Minerals Corp FLMN 0.26% +22% $3,637,000 1,154,672 40 B&G Foods, Inc. BGS 0.10% New $1,387,000 50,000 41 Owl Rock Capital Corp ORCC 0.09% New $1,266,000 100,000 42 Nabors Industries Ltd. NBR 0.04% Unchanged $582,000 10,000 43 DiaMedica Therapeutics DMAC 0.02% New $304,000 30,000 44 Associated Capital Group AC 0.02% Unchanged $302,000 8,600 45 GAMCO Investors Inc GBL 0.01% Unchanged $153,000 8,600 46 AES Corp AES 0.01% Unchanged $21,000 900
Lee Enterprises, Inc. LEE Sold MVC Capital Corp. MVC Sold

53
Per the Financial Times, Coatue Management was up 52% for 2020 around December, so their final performance number shouldn’t have been too far off.
Continuing the interesting trend of hedge fund managers becoming more active on Twitter, Philippe Laffont is now tweeting as well (@plaffont).
He’s already put out interesting content, such as a thread on how he thinks about investing: “To be a good public investor, you don’t need to be a genius or own a crystal ball but you do have to make a few big calls … The art of growth investing is realizing a stock that appears expensive today can be dirt cheap 5 – 7 years later. Multi baggers are the source of most outperformance and hide many mistakes … What has worked for me is focusing on TAM (market size), earnings, growth and the corresponding P/E multiple 5-7 years out.”
Coatue also invests in both private and public markets and Laffont talked about some of the benefits of doing both.
He writes that, “In the private markets, the focus -FIRST- is TAM (size of market), then second everything else. And the stock price is static unless there is a new round. So you have time to develop your thesis.”
Laffont adds, “In the public markets, lots of
Key Takeaways
New Posit ions: Doordash (DASH) ~ IPO Xpeng (XPEV) Alteryx (AYX) Sold Out: Vivint Solar (VSLR) ~ merger w/ RUN Smartsheet (SMAR)
things can affect the stock price over the short run, and one can make mistakes by overestimating data about temporary problems. Patience, and confidence in the 7-10 year story will drive the stock so much higher than one can process during painful stock fluctuations. Private investing is about imagining the future as there is less data to analyze than as a public company, and that foresight usually compounds the variant perception with time.”
He then concludes that, “Imagination is the skill. Uncertainty is the opportunity. Data is important but so is the story. Patience is way underrated.”
Three questions that the Coatue founder is thinking about for 2021 are: 1) Will bitcoin decouple from the Nasdaq? 2) What happens to secular growth post vaccine when cyclical growth kicks in? What has changed for good and what reverts? 3) Is “ESG” the next internet / SaaS?
The second question in particular is probably the most important in the near-term, especially for tech-focused investors like Laffont. You can assume he’s taken it a step further and applied it to Coatue’s investments that have benefited from the pandemic.
For instance: Will Zoom meetings take priority over in-person business travel? Will people still use Uber Eats or Doordash as much once everyone starts eating out again more? Will people flock to more in-person shopping or is the e-commerce trend unstoppable regardless? Will people still want to subscribe to and watch as much streaming content from Disney and Netflix once other forms of entertainment and leisure are readily available?
Lastly, in international markets Coatue reported a 0.9% short in Wirecard as of January 4th.
View Coatue Management’s Portfolio on the Next Page
Q4 2020 www.hedgefundwisdom.com
Coatue Management Philippe Laffont
Net annualized return of 14.1% since inception in 1999
Manages a long/short fund & a long-only fund focused on technology, media, & telecom
Coatue also has a separate venture capital arm

54
Coatue Management Fourth Quarter 2020 Portfolio:
Q4 2020 www.hedgefundwisdom.com
Continued on next page…
Rank Company Name Ticker Put/Call % of Portfolio Activity Value # of Shares
1 Walt Disney Co DIS 7.49% +17% $2,003,174,000 11,056,268 2 PayPal Holdings Inc PYPL 6.00% +1% $1,603,453,000 6,846,512 3 Tesla Inc TSLA 5.68% -31% $1,517,606,000 2,150,589 4 Square Inc SQ 4.99% +11% $1,335,230,000 6,135,041 5 Sunrun Inc RUN 4.85% +126% $1,296,918,000 18,692,965 6 DoorDash, Inc. DASH 4.67% New $1,249,163,000 8,750,705 7 Snowflake, Inc. SNOW 4.28% +1% $1,144,710,000 4,067,911 8 Uber Technologies Inc UBER 4.04% +79% $1,079,469,000 21,166,062 9 Zoom Video Comm ZM 3.17% +2% $848,506,000 2,515,435
10 Crowdstrike Holdings Inc CRWD 3.14% -5% $839,716,000 3,964,289 11 Netflix Inc NFLX 2.90% +1% $776,049,000 1,435,187 12 Peloton Interactive Inc PTON 2.90% -1% $775,141,000 5,109,019 13 Global Payments Inc. GPN 2.75% -10% $734,430,000 3,409,289 14 Nuance Communications NUAN 2.74% +83% $732,550,000 16,614,864 15 Zillow Group Inc Class C Z 2.64% +77% $705,046,000 5,431,792 16 Amazon.com Inc. AMZN 2.55% Unchanged $681,135,000 209,134 17 Sea Ltd ADR SE 2.34% +1% $625,980,000 3,144,837 18 Anaplan Inc PLAN 2.27% -30% $607,204,000 8,450,990 19 Facebook Inc FB 2.21% -7% $591,446,000 2,165,203 20 Shopify Inc SHOP 1.85% Unchanged $495,527,000 437,764 21 Lam Research Corp. LRCX 1.68% Unchanged $449,692,000 952,193 22 Insulet Corp PODD 1.68% +20% $448,438,000 1,754,246 23 XPeng Inc. XPEV 1.66% New $444,551,000 10,379,425 24 JD.com Inc ADR JD 1.50% Unchanged $401,084,000 4,562,952 25 Agora, Inc. ADS API 1.49% New $398,370,000 10,070,026 26 Alteryx Inc AYX 1.41% New $377,814,000 3,102,175 27 NVIDIA Corp. NVDA 1.22% Unchanged $326,843,000 625,897 28 Pinterest Inc PINS 1.05% +586% $280,354,000 4,254,228 29 Dynatrace Inc DT 1.05% -2% $279,826,000 6,466,973 30 Alibaba Group BABA 1.02% Unchanged $271,597,000 1,167,006 31 DocuSign Inc DOCU 1.01% -7% $271,199,000 1,219,968 32 L Brands Inc LB 0.88% -6% $235,417,000 6,330,104 33 Zillow Group Inc ZG 0.86% +70% $230,837,000 1,698,086 34 Cree Inc. CREE 0.76% -15% $204,254,000 1,928,743 35 Expedia Group Inc EXPE 0.73% +242% $195,611,000 1,477,423 36 Broadcom Ltd AVGO 0.62% +19% $164,863,000 376,528 37 Gap GPS 0.56% +45% $149,277,000 7,393,612 38 Guardant Health Inc GH 0.54% Unchanged $144,158,000 1,118,537 39 Micron Technology, Inc. MU 0.51% Unchanged $137,574,000 1,829,932 40 Datadog Inc DDOG 0.49% -2% $131,279,000 1,333,596 41 Best Buy Co., Inc. BBY 0.46% +3949% $123,993,000 1,242,544 42 Wynn Resorts Ltd WYNN 0.45% +24% $120,805,000 1,070,682 43 Live Nation Entertainment LYV 0.41% +61% $109,809,000 1,494,413 44 Stitch Fix Inc SFIX 0.38% New $102,145,000 1,739,529 45 Microsoft Corp. MSFT 0.38% Unchanged $101,765,000 457,536

55
Coatue Management Fourth Quarter 2020 Portfolio:
Q4 2020 www.hedgefundwisdom.com
Continued on next page…
Rank Company Name Ticker Put/Call % of Portfolio Activity Value # of Shares
46 Deckers Outdoor Corp DECK 0.38% +32% $101,291,000 353,201 47 Root, Inc. ROOT 0.27% New $71,450,000 4,548,046 48 Under Armour Inc UAA 0.25% +17% $66,701,000 3,884,714 49 TJX Companies Inc. TJX 0.25% +123% $65,849,000 964,250 50 Lyft Inc LYFT 0.19% New $51,193,000 1,041,995 51 Roku Inc ROKU 0.18% New $48,526,000 146,153 52 Okta Inc OKTA 0.18% Unchanged $47,455,000 186,639 53 Align Technology Inc ALGN 0.18% Unchanged $46,959,000 87,875 54 Boeing Company BA 0.17% New $44,815,000 209,359 55 Under Armour Inc Cl C UA 0.16% +16% $43,534,000 2,925,676 56 Li Auto Inc. ADS LI 0.16% +174% $42,525,000 1,475,012 57 Green Dot Corp GDOT 0.15% -43% $39,676,000 711,040 58 Formula 1 FWONK 0.13% -6% $35,458,000 832,358 59 American Eagle Outfitters AEO 0.13% -55% $34,326,000 1,710,320 60 Inovio Pharmaceuticals Inc INO 0.12% Unchanged $31,656,000 3,576,923 61 Ribbit LEAP, Ltd. LEAP.U 0.10% Unchanged $27,395,000 1,830,000 62 Urban Outfitters Inc. URBN 0.10% -55% $25,752,000 1,005,942 63 KE Holdings Inc. BEKE 0.09% -19% $25,018,000 406,538 64 Nikola Corp NKLA 0.07% -67% $18,366,000 1,203,517 65 Lightspeed POS Inc. LSPD 0.07% New $17,468,000 248,162 66 Snap Inc Class A SNAP 0.06% New $17,174,000 343,000 67 MercadoLibre Inc MELI 0.06% New $16,975,000 10,133 68 StoneCo Ltd STNE 0.06% New $16,654,000 198,455 69 Coupa Software Inc COUP 0.06% +10% $15,930,000 47,005 70 Eastman Kodak Co KODK 0.03% -10% $9,158,000 1,125,000 71 ZoomInfo Technologies ZI 0.03% New $9,122,000 189,144 72 Opendoor Technologies OPEN 0.03% New $7,677,000 337,760 73 Sorrento Therapeutics Inc SRNE 0.02% Unchanged $5,119,000 750,000 74 DexCom Inc DXCM 0.01% -74% $3,517,000 9,513 75 Velodyne Lidar Inc. VLDR 0.01% New $1,712,000 75,000 76 Atlassian Corp Plc TEAM 0.01% New $208,000 891
3D Systems Corp. DDD Sold Liberty Broadband LBRDK Sold Nordic American Tanker NAT Sold Teekay Tankers Ltd TNK Sold GrafTech International Ltd EAF Sold Hertz Global Hld HTZGQ Sold Macerich Company MAC Sold Stratasys Ltd SSYS Sold Smartsheet Inc SMAR Sold DHT Holdings Inc DHT Sold Vivint Solar Inc VSLR Sold SmileDirectClub Inc SDC Sold Fitbit Inc FIT Sold Centurylink Inc LUMN Sold

56
Coatue Management Fourth Quarter 2020 Portfolio:
Q4 2020 www.hedgefundwisdom.com
Next Page: Fairholme Capital
Rank Company Name Ticker Put/Call % of Portfolio Activity Value # of Shares
Texas Roadhouse Inc TXRH Sold Tractor Supply Company TSCO Sold Howmet Aerospace Inc HWM Sold Skechers USA, Inc. Class A SKX Sold FedEx Corporation FDX Sold RealReal Inc REAL Sold Tanger Factory Outlet SKT Sold At Home Group Inc HOME Sold JetBlue Airways Corp JBLU Sold Floor & Decor Holdings Inc FND Sold Zynga, Inc. ZNGA Sold AutoZone Inc. AZO Sold Chuys Holdings Inc CHUY Sold TransDigm Group Inc TDG Sold RH Common Stock RH Sold CVS Health Corp CVS Sold Lands End Inc LE Sold World Wrestling Ent WWE Sold Target Corp. TGT Sold Coca Cola Co. KO Sold Cato Corp. CATO Sold Vera Bradley Inc VRA Sold Tillys Inc TLYS Sold

57
Fairholme Capital returned 46.9% for 2020. Their top holding, St. Joe (JOE), generated the vast majority of this as it was up 120%.
Bruce Berkowitz gave an update on the position in his annual letter: “The company is uniquely positioned for decades of profitable growth along Northwest Florida’s Emerald Coast. Residential, commercial, and hospitality segments are breaking records. Pricing is robust. Homes sell before completion. Apartments are fully occupied. Clubs by JOE expands. Hotels are in construction … St. Joe is only scratching the surface. (The Company’s) entitled lands in Walton, Bay, and Gulf Counties may be worth exponentially more than implied by the company’s market value.”
Bruce Berkowitz started many smaller positions for the second consecutive quarter. Some of them include Cincinnati Financial, Enbridge, CVS Caremark, and Old Republic.
However, these stakes won’t necessarily make a massive difference to the portfolio given they’re sized so small. After all, the overwhelming majority of Fairholme’s returns will be driven by JOE since it represents 65.6% of assets after you account for their cash position (Fairholme Fund had 21.8% of its portfolio in cash at the end of 2020.)
Keep in mind that Fairholme also owns a
Key Takeaways
New Posit ions: Cincinnati Financial (CINF) Enbridge (ENB) CVS Caremark (CVS) Old Republic (ORI) Sold Out: Kraft Heinz (KHC) Simon Property Group (SPG)
5.5% position in Freddie Mac and a 5.2% in Fannie Mae both via preferred securities.
Berkowitz outlined his thinking on the entities in his letter: “Fannie Mae and Freddie Mac insure the availability of 30-year fixed-rate mortgages. Home ownership has never been more affordable or sustainable during crises with Fannie and Freddie guarantees. The enterprises have been under federal control since 2008. The U.S. Treasury only recently agreed to their retaining the earnings necessary for capital safety and soundness. Treasury still has not agreed that $191 billion of ‘loans and fees’ have been repaid – even after receiving over $300 billion of reimbursements and controlling 80% stakes. I expect The Supreme Court will recognize the rights of private enterprise and remedy this gating issue to Fannie’s and Freddie’s exit from conservatorship.”
Fairholme also owns a 1.9% position in Imperial Metals and their thesis is as follows: “Copper prices increase with global growth and innovation. Gold rises with monetary expansion and cheapens paper money. Imperial Metals’ investment in Red Chris has world-class potential. Huckleberry and Mt. Polley may restart production with higher prices. King Copper drilled 20 grams of gold per ton over 3 meters. There are 20 other investments buried across British Columbia. Imperial has great expectations.”
On the selling side of Berkowitz’s book, he dumped over 80% of his Berkshire Hathaway (BRK.B) shares.
View Fairholme Capital’s Updated Portfolio on the Next Page
Q4 2020 www.hedgefundwisdom.com
Fairholme Capital Bruce Berkowitz Previously named Morningstar’s Fund Manager of
the Decade
A long-term investor who runs a highly concentrated portfolio
View his checklist for investing

58
Fairholme Capital Fourth Quarter 2020 Portfolio:
Q4 2020 www.hedgefundwisdom.com
Next Page: Tiger Global
Rank Company Name Ticker Put/Call % of Portfolio Activity Value # of Shares
1 St. Joe Corp JOE 90.79% < -1% $1,121,969,000 26,430,357 2 Bank of America Corp BAC 1.19% +43% $14,655,000 483,500 3 Berkshire Hathaway BRK.B 1.12% -81% $13,785,000 59,450 4 CanadianNaturalResources CNQ 0.93% +64% $11,431,000 475,300 5 AT&T Inc T 0.90% +69% $11,179,000 388,700 6 Kinder Morgan Inc KMI 0.70% +221% $8,639,000 632,000 7 Cincinnati Financial Corp CINF 0.68% New $8,449,000 96,700 8 Enbridge, Inc ENB 0.67% New $8,218,000 256,900 9 Western Gas Partners LP WES 0.62% +3% $7,692,000 556,600
10 CVS Health Corp CVS 0.61% New $7,588,000 111,100 11 Old Republic International ORI 0.60% New $7,472,000 379,100 12 Energy Transfer Equity LP ET 0.39% +203% $4,841,000 783,300 13 Altria Group, Inc MO 0.18% New $2,222,000 54,200 14 EnterpriseProductsPartners EPD 0.15% New $1,861,000 95,000 15 PlainsAllAmericanPipeline PAA 0.14% New $1,755,000 213,000 16 Magellan Midstream MMP 0.14% New $1,736,000 40,900 17 Philip Morris International PM 0.09% New $1,167,000 14,100 18 Apple Inc AAPL 0.05% Unchanged $565,000 4,260 19 Berkshire Hathaway BRK.A 0.03% Unchanged $348,000 1 20 OccidentalPetroWarrants OXYWS.WI 0.02% Unchanged $198,000 29,102
Simon Property Group, Inc. SPG Sold Kraft Heinz Co KHC Sold

59
Tiger Global’s long-short fund returned 48.4% in 2020 and its long-only fund returned 65.1%, according to Institutional Investor.
In the fourth quarter, the hedge fund showed a 40% increase in their bet on data warehouse and analytics company Snowflake (SNOW) and it’s now their 23rd largest holding
Chase Coleman’s firm also drastically ramped up exposure to Docusign (DOCU) during Q4. While it’s now only their 28th largest holding, the 491% increase in position size is quite notable. During the quarter when they would have been buying, DOCU shares traded between $200 and $250 and currently trade at the top-end of that range.
The company provides contract management services and its most recognizable feature will be e-signatures on contracts and other documents. They are basically digitizing various elements of business that have historically been done with pen and paper or in-person. For instance, they’re also expanding into notary services, etc.
One caveat this quarter with Tiger Global’s portfolio is that some of the activity can potentially
Key Takeaways
New Posit ions: Doordash (DASH) ~ IPO Coupa Software (COUP) 1Life Healthcare (ONEM) C3ai (AI) Airbnb (ABNB) ~ IPO Square (SQ) Intuit (INTU) Sold Out: Alphabet (GOOGL) Tencent Music & Entertainment (TME)
Chase Coleman
View Tiger Global’s Updated Portfolio on the Next Page
CAGR since inception: 18.3% net of all fees
Descendant of Peter Stuyvesant, the man who built
the ‘wall’ in Wall St
Tiger Global also runs a separate venture capital arm
be explained by corporate transactions rather than open market buying.
For example, Tiger Global now shows a ‘new’ stake in Intuit (INTU), but during the quarter the company closed its acquisition of Credit Karma, which Tiger was invested in. The deal included cash and stock.
Additionally, Tiger Global shows an increase in its Uber (UBER) stake, but at the end of the year the company completed its acquisition of Postmates, which Tiger was also invested in. This was an all-stock deal.
In the UK, Tiger Global no longer shows a stake in Supply@ME Capital PLC after previously owning 5.92% of voting rights back on July 24th, 2020. Also worth highlighting is the fact that they sold a third of their Netflix (NFLX) position, a name they’ve owned since 2017.
For the second consecutive quarter, the hedge fund was also out trimming exposure to Sunrun (RUN) again. This time around they cut their position by 72%. The company recently merged with Vivint Solar.
And in international short selling activity, Tiger Global reported it was short 1.61% of Alstom in France as of February 12th. This is up from their previous 0.82% position back in December.
Additionally, the hedge fund was short 2.58% of HelloFresh SE in Germany as of December 11th and short 0.57% of H&M Hennes & Mauritz AB in Sweden as of December 11th.
Tiger Global’s venture capital arm is also launching its thirteenth fund and will have around $3.75 billion in commitments. Previous funds have seen a gross internal rate of return (IRR) of 32% and net IRR of around 24%, per Techcrunch.
Q4 2020 www.hedgefundwisdom.com
Tiger Global

60
Tiger Global Fourth Quarter 2020 Portfolio:
Q4 2020 www.hedgefundwisdom.com
Continued on next page…
Rank Company Name Ticker Put/Call % of Portfolio Activity Value # of Shares
1 JD.com Inc ADR JD 11.63% Unchanged $4,540,067,000 51,650,366 2 Microsoft Corp. MSFT 6.78% +4% $2,644,959,000 11,891,734 3 Pinduoduo Inc PDD 6.40% -1% $2,496,808,000 14,053,066 4 Amazon.com Inc. AMZN 5.12% +1% $1,996,808,000 613,095 5 Sea Ltd ADR SE 4.71% +10% $1,836,535,000 9,226,500 6 Facebook Inc FB 4.43% -28% $1,728,229,000 6,326,800 7 Apollo Global APO 4.26% Unchanged $1,661,083,000 33,913,500 8 Crowdstrike Holdings Inc CRWD 4.09% Unchanged $1,596,487,000 7,537,000 9 Carvana Co CVNA 3.69% Unchanged $1,440,332,000 6,012,907
10 Uber Technologies Inc UBER 3.62% +78% $1,411,751,000 27,681,399 11 Ringcentral Inc RNG 3.23% Unchanged $1,260,594,000 3,326,370 12 Peloton Interactive Inc PTON 3.05% +1% $1,192,179,000 7,857,758 13 TransDigm Group Inc TDG 2.79% Unchanged $1,087,471,000 1,757,245 14 Alibaba Group BABA 2.67% Unchanged $1,042,179,000 4,478,062 15 Spotify Technology SA SPOT 2.57% Unchanged $1,001,882,000 3,184,013 16 Workday Inc WDAY 2.53% +11% $988,978,000 4,127,450 17 ServiceNow Inc NOW 2.32% +10% $904,356,000 1,643,000 18 Elastic NV ESTC 1.51% Unchanged $587,420,000 4,019,843 19 Atlassian Corp Plc TEAM 1.48% -11% $576,583,000 2,465,400 20 Netflix Inc NFLX 1.46% -32% $571,168,000 1,056,290 21 Sunrun Inc RUN 1.44% -73% $560,123,000 8,073,257 22 Salesforce.com Inc. CRM 1.30% Unchanged $509,304,000 2,288,700 23 Snowflake, Inc. SNOW 1.26% +40% $493,462,000 1,753,597 24 Zoom Video Comm ZM 1.25% -21% $487,418,000 1,444,973 25 Datadog Inc DDOG 1.20% Unchanged $468,279,000 4,757,000 26 TAL Education Group TAL 1.06% Unchanged $412,103,000 5,762,873 27 GDS Holdings Ltd ADR GDS 1.05% -24% $408,319,000 4,360,516 28 DocuSign Inc DOCU 1.01% +491% $394,138,000 1,773,000 29 New Oriental Education EDU 0.88% -14% $342,541,000 1,843,500 30 8x8 Inc EGHT 0.79% +82% $310,230,000 9,000,000 31 Mastercard Inc MA 0.66% Unchanged $258,425,000 724,000 32 DoorDash, Inc. DASH 0.58% New $227,829,000 1,596,000 33 Coupa Software Inc COUP 0.58% New $225,375,000 665,000 34 Shopify Inc SHOP 0.56% +122% $219,390,000 193,816 35 PayPal Holdings Inc PYPL 0.54% -58% $209,843,000 896,001 36 FleetCor Technologies Inc FLT 0.45% -50% $176,702,000 647,662 37 1Life Healthcare Inc. ONEM 0.44% New $171,545,000 3,930,000 38 GSX Techedu Inc GSX 0.40% Unchanged $156,204,000 3,020,769 39 Sumo Logic, Inc. SUMO 0.39% Unchanged $154,080,000 5,391,187 40 KE Holdings Inc. BEKE 0.39% Unchanged $153,850,000 2,500,000 41 C3ai, Inc. AI 0.36% New $138,750,000 1,000,000 42 Despegar.com Corp DESP 0.30% Unchanged $118,576,000 9,256,550 43 Phoenix Tree Holdings DNK 0.27% Unchanged $106,029,000 36,436,075 44 Zendesk Inc ZEN 0.26% Unchanged $102,188,000 714,000 45 Yatsen Holding Ltd ADS YSG 0.25% New $97,138,000 5,714,000

61
Tiger Global Fourth Quarter 2020 Portfolio:
Q4 2020 www.hedgefundwisdom.com
Rank Company Name Ticker Put/Call % of Portfolio Activity Value # of Shares
46 Airbnb, Inc. ABNB 0.24% New $95,420,000 650,000 47 Anaplan Inc PLAN 0.24% -81% $92,030,000 1,280,867 48 Square Inc SQ 0.23% New $88,906,000 408,500 49 BigCommerce Holdings BIGC 0.22% Unchanged $86,603,000 1,350,000 50 GoodRx Holdings, Inc. GDRX 0.22% +53% $86,529,000 2,145,000 51 Intuit, Inc. INTU 0.22% New $84,056,000 221,287 52 Adobe Systems, Inc. ADBE 0.21% -1% $83,770,000 167,500 53 Jamf Holding Corp. JAMF 0.21% Unchanged $83,141,000 2,778,778 54 Asana, Inc. ASAN 0.18% +161% $71,495,000 2,419,454 55 Agora, Inc. ADS API 0.18% +2366% $68,285,000 1,726,123 56 StoneCo Ltd STNE 0.16% Unchanged $64,265,000 765,783 57 JFrog Ltd. FROG 0.16% Unchanged $62,830,000 1,000,000 58 Chindata Group Holdings CD 0.11% Unchanged $44,326,000 1,850,000 59 Datto Holding Corp. MSP 0.10% New $40,500,000 1,500,000 60 Academy Sports ASO 0.09% New $36,278,000 1,750,000 61 VISA Inc V 0.09% Unchanged $35,653,000 163,000 62 Ozon Holdings PLC OZON 0.08% New $31,058,000 750,000 63 MongoDB Inc MDB 0.08% -96% $29,441,000 82,000 64 XPeng Inc. XPEV 0.07% Unchanged $27,840,000 650,000 65 Twilio Inc TWLO 0.06% -96% $25,286,000 74,701 66 Smartsheet Inc SMAR 0.06% -91% $24,944,000 360,000 67 Ajax I AJAX.U 0.06% New $24,820,000 2,000,000 68 Reinvent Technology RTP.U 0.06% Unchanged $24,500,000 2,000,000 69 Linx SA LINX 0.06% Unchanged $23,785,000 3,350,000 70 Altimeter Growth Corp. AGCUU 0.06% New $23,400,000 1,800,000 71 Dynatrace Inc DT 0.06% Unchanged $21,635,000 500,000 72 nCino, Inc. NCNO 0.05% Unchanged $19,913,000 275,000 73 SVMK Inc SVMK 0.05% -1% $17,856,000 698,871 74 Avalara Inc AVLR 0.04% Unchanged $16,489,000 100,000 75 Duck Creek Tech DCT 0.04% Unchanged $15,155,000 350,000 76 Cloudflare Inc NET 0.03% Unchanged $13,298,000 175,000 77 Vertex, Inc. VERX 0.03% Unchanged $11,326,000 325,000 78 American Well Corp. AMWL 0.03% Unchanged $10,132,000 400,000 79 Li Auto Inc. ADS LI 0.03% Unchanged $10,091,000 350,000 80 XP Inc. XP 0.02% Unchanged $7,934,000 200,000 81 ZoomInfo Tech ZI 0.02% Unchanged $7,235,000 150,000 82 HUYA Inc HUYA 0.02% Unchanged $7,215,000 362,000 83 Pagerduty Inc PD 0.02% Unchanged $6,255,000 150,000 84 17 Education & Technology YQ 0.02% New $6,149,000 480,000 85 Yalla Group Ltd ADS YALA 0.01% Unchanged $5,016,000 350,000 86 Dropbox Inc DBX 0.01% Unchanged $4,438,000 200,000 87 DouYu International DOYU 0.01% Unchanged $4,424,000 400,000 88 Outset Medical, Inc. OM 0.01% Unchanged $3,126,000 55,000 89 SolarWinds Corp SWI 0.01% Unchanged $2,990,000 200,000 90 Redfin Corp RDFN 0.01% Unchanged $2,751,000 40,087 91 Health Catalyst Inc HCAT 0.01% Unchanged $2,177,000 50,000 92 Dada Nexus Ltd. ADS DADA 0.01% Unchanged $1,825,000 50,000 93 Medallia Inc MDLA 0.01% Unchanged $1,661,000 50,000 94 Oak Street Health, Inc. OSH 0.01% Unchanged $1,529,000 25,000 95 OneSmart International ONE 0.01% Unchanged $1,216,000 320,000 96 Kingsoft Cloud KC 0.01% Unchanged $436,000 10,000 97 Farmland Partners Inc FPI 0.01% Unchanged $387,000 44,502

62
Tiger Global Fourth Quarter 2020 Portfolio:
Q4 2020 www.hedgefundwisdom.com
Next Page: Hound Partners
Rank Company Name Ticker Put/Call % of Portfolio Activity Value # of Shares
Bilibili Inc BILI Sold Alphabet Inc. Class A GOOGL Sold Tenable Holdings Inc TENB Sold Cardlytics Inc CDLX Sold Ceridian HCM Holding Inc CDAY Sold Farfetch Ltd FTCH Sold Tencent Music Ent TME Sold

63
During Q4, Hound Partners started a new position in Wix (WIX), buying in size and making it their seventh largest holding. The company operates a cloud platform that gives anyone the ability to create a website via an easy drag-and-drop editor and then upsells premium add-ons and features.
The company has benefited as more businesses needed an online presence due to the pandemic. WIX just had its best year ever with over 31 million new users and the CEO continues to be bullish, with his belief that “in the next 5-7 years, 50% of anything new built on the internet will be done with Wix.” WIX has more than doubled subscribers over the past four years and revenue per month per subscriber has risen from $11.79 to $17.44.
However, the downside here is as they’ve scaled, their subscriber acquisition cost has been increasing. Regardless, revenue was still up 38% year-over-year.
Jonathan Auerbach’s firm also started a large new position in Altice USA (ATUS) during Q4 and it’s now their 9th largest holding. It’s a US cable
Key Takeaways
New Posit ions: Wix (WIX) Altice USA (ATUS) Vapotherm (VAPO) Alibaba (BABA) Nebula Caravel Acquisition (NEBCU) Sold Out: National Instruments (NATI) Palo Alto Networks (PANW) Carvana (CVNA) Aercap (AER) Jumia (JMIA) Puts
Jonathan Auerbach
View Hound Partners’ Updated Portfolio on the Next Page
Runs a concentrated, long-term oriented portfolio;
Generated a cumulative return (compounded geometrically) of 426% since 2005
Originally seeded by Julian Robertson; operates a long/short
hedge fund and a long-only vehicle
operator where the thesis is basically that broadband internet is a necessity in today’s interconnected world. Not to mention, these operators essentially have monopolies or oligopolies in certain markets and often have much faster speeds over legacy players like DSL operators.
This dominant position and competitive advantage gives them pricing power. Not to mention, many of these companies are rolling out wireless service to complement their other products, creating another ‘bundle’ offering that helps reduce churn.
While many hedge funds favor Charter Communications (CHTR) in the sector, Hound chose ATUS instead, presumably due to valuation. While CHTR trades at an EV/EBITDA multiple of just under 12x, ATUS trades slightly over 9x. CHTR bulls will argue that its premium relative valuation is warranted given its greater scale, solid capital allocation and management team.
ATUS bulls will counter with the fact that the company bought back a whopping 25% of its shares last year whereas CHTR only repurchased around 7% (but they’re both executing the levered buyback playbook). ATUS could also look to make some acquisitions if valuations are palatable and could potentially be a takeover target themselves.
Bears on ATUS point to the company’s more aggressive leverage profile, question the company’s growth trajectory, and worry about competition in some of their footprint. Hound might feel the valuation compensates for these risks.
Lastly, in short selling activity in the UK, Hound disclosed they were short 0.67% of Hargreaves Lansdown Plc as of January 25th, down slightly from their 0.74% short back in November.
Q4 2020 www.hedgefundwisdom.com
Hound Partners
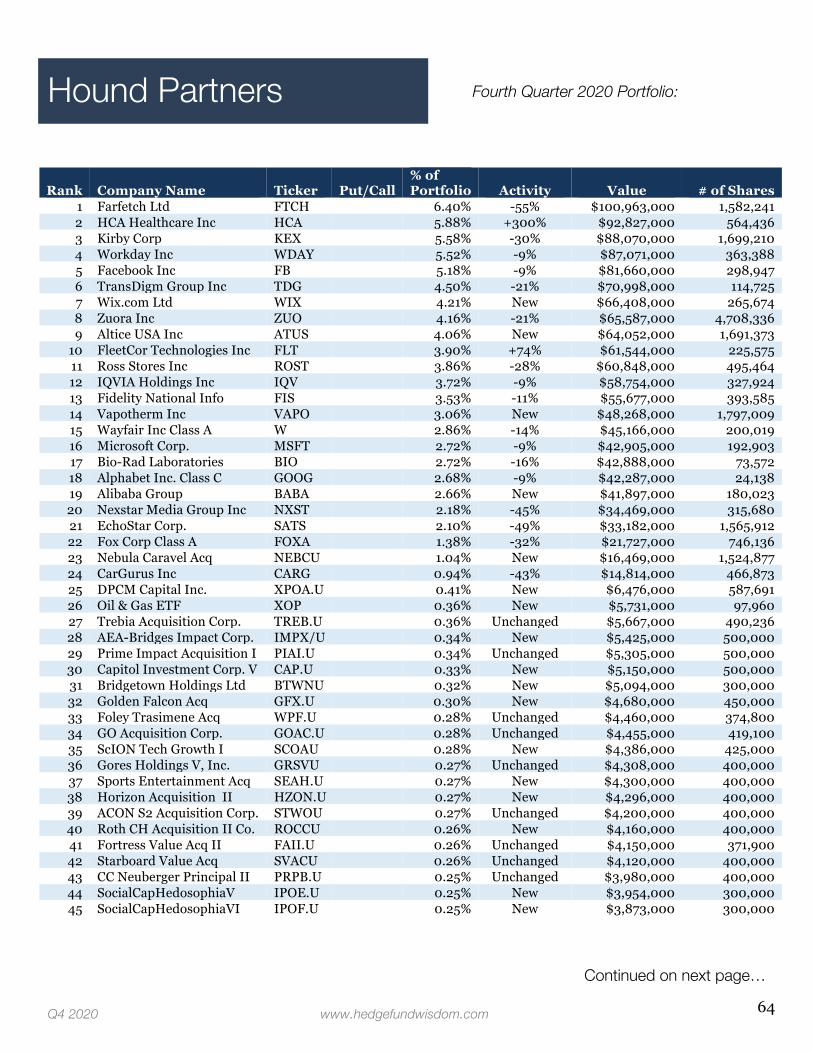
64
Hound Partners Fourth Quarter 2020 Portfolio:
Q4 2020 www.hedgefundwisdom.com
Continued on next page…
Rank Company Name Ticker Put/Call % of Portfolio Activity Value # of Shares
1 Farfetch Ltd FTCH 6.40% -55% $100,963,000 1,582,241 2 HCA Healthcare Inc HCA 5.88% +300% $92,827,000 564,436 3 Kirby Corp KEX 5.58% -30% $88,070,000 1,699,210 4 Workday Inc WDAY 5.52% -9% $87,071,000 363,388 5 Facebook Inc FB 5.18% -9% $81,660,000 298,947 6 TransDigm Group Inc TDG 4.50% -21% $70,998,000 114,725 7 Wix.com Ltd WIX 4.21% New $66,408,000 265,674 8 Zuora Inc ZUO 4.16% -21% $65,587,000 4,708,336 9 Altice USA Inc ATUS 4.06% New $64,052,000 1,691,373
10 FleetCor Technologies Inc FLT 3.90% +74% $61,544,000 225,575 11 Ross Stores Inc ROST 3.86% -28% $60,848,000 495,464 12 IQVIA Holdings Inc IQV 3.72% -9% $58,754,000 327,924 13 Fidelity National Info FIS 3.53% -11% $55,677,000 393,585 14 Vapotherm Inc VAPO 3.06% New $48,268,000 1,797,009 15 Wayfair Inc Class A W 2.86% -14% $45,166,000 200,019 16 Microsoft Corp. MSFT 2.72% -9% $42,905,000 192,903 17 Bio-Rad Laboratories BIO 2.72% -16% $42,888,000 73,572 18 Alphabet Inc. Class C GOOG 2.68% -9% $42,287,000 24,138 19 Alibaba Group BABA 2.66% New $41,897,000 180,023 20 Nexstar Media Group Inc NXST 2.18% -45% $34,469,000 315,680 21 EchoStar Corp. SATS 2.10% -49% $33,182,000 1,565,912 22 Fox Corp Class A FOXA 1.38% -32% $21,727,000 746,136 23 Nebula Caravel Acq NEBCU 1.04% New $16,469,000 1,524,877 24 CarGurus Inc CARG 0.94% -43% $14,814,000 466,873 25 DPCM Capital Inc. XPOA.U 0.41% New $6,476,000 587,691 26 Oil & Gas ETF XOP 0.36% New $5,731,000 97,960 27 Trebia Acquisition Corp. TREB.U 0.36% Unchanged $5,667,000 490,236 28 AEA-Bridges Impact Corp. IMPX/U 0.34% New $5,425,000 500,000 29 Prime Impact Acquisition I PIAI.U 0.34% Unchanged $5,305,000 500,000 30 Capitol Investment Corp. V CAP.U 0.33% New $5,150,000 500,000 31 Bridgetown Holdings Ltd BTWNU 0.32% New $5,094,000 300,000 32 Golden Falcon Acq GFX.U 0.30% New $4,680,000 450,000 33 Foley Trasimene Acq WPF.U 0.28% Unchanged $4,460,000 374,800 34 GO Acquisition Corp. GOAC.U 0.28% Unchanged $4,455,000 419,100 35 ScION Tech Growth I SCOAU 0.28% New $4,386,000 425,000 36 Gores Holdings V, Inc. GRSVU 0.27% Unchanged $4,308,000 400,000 37 Sports Entertainment Acq SEAH.U 0.27% New $4,300,000 400,000 38 Horizon Acquisition II HZON.U 0.27% New $4,296,000 400,000 39 ACON S2 Acquisition Corp. STWOU 0.27% Unchanged $4,200,000 400,000 40 Roth CH Acquisition II Co. ROCCU 0.26% New $4,160,000 400,000 41 Fortress Value Acq II FAII.U 0.26% Unchanged $4,150,000 371,900 42 Starboard Value Acq SVACU 0.26% Unchanged $4,120,000 400,000 43 CC Neuberger Principal II PRPB.U 0.25% Unchanged $3,980,000 400,000 44 SocialCapHedosophiaV IPOE.U 0.25% New $3,954,000 300,000 45 SocialCapHedosophiaVI IPOF.U 0.25% New $3,873,000 300,000

65
Hound Partners Fourth Quarter 2020 Portfolio:
Q4 2020 www.hedgefundwisdom.com
Continued on next page…
Rank Company Name Ticker Put/Call % of Portfolio Activity Value # of Shares
46 Holicity Inc. HOLUU 0.23% Unchanged $3,636,000 350,000 47 Vasta Platform Ltd. VSTA 0.23% -21% $3,579,000 246,833 48 Artius Acquisition Units AACQU 0.23% Unchanged $3,558,000 316,536 49 Supernova Partners Acq SPNV.U 0.22% New $3,483,000 300,000 50 Qell Acquisition Corp. QELL 0.21% New $3,380,000 275,000 51 Lefteris Acquisition Corp. LFTRU 0.21% New $3,252,000 300,000 52 Empower Ltd EMPW.U 0.20% New $3,120,000 300,000 53 Ajax I AJAX.U 0.20% New $3,103,000 250,000 54 PMV Consumer Acq PMVC.U 0.20% Unchanged $3,090,000 300,000 55 Decarbonization Plus Acq DCRBU 0.18% New $2,873,000 250,000 56 QuantumScape Warrants QS.WS 0.18% New $2,850,000 75,000 57 Reinvent Tech Partners RTPZ.U 0.18% New $2,845,000 250,000 58 ARYA Sciences Acq III ARYA 0.17% Unchanged $2,713,000 250,000 59 Tailwind Acquisition Corp. TWND.U 0.17% Unchanged $2,695,000 250,000 60 Vector Acquisition Corp. VACQU 0.17% Unchanged $2,688,000 250,000 61 North Mountain Merger NMMCU 0.17% Unchanged $2,685,000 250,000 62 Cerberus Telecom Acq CTAC.U 0.17% New $2,665,000 250,000 63 SocialCapHedosophiaIV IPOD.U 0.17% New $2,633,000 180,000 64 CONX Corp. CONXU 0.17% New $2,613,000 250,000 65 H.I.G. Acquisition Corp HIGA.U 0.17% New $2,608,000 250,000 66 Churchill Cap Corp IV CCIV.U 0.16% Unchanged $2,575,000 250,000 67 Investindustrial Acq IIAC.U 0.16% New $2,570,000 250,000 68 dMY Technology Group III DMYI.U 0.14% New $2,280,000 200,000 69 GS Acquisition Holdings II GSAH.U 0.14% Unchanged $2,280,000 200,000 70 TPG Pace Tech Opp PACE.U 0.14% New $2,272,000 200,000 71 Peridot Acquisition Corp. PDAC.U 0.14% Unchanged $2,250,000 200,000 72 Capstar Acquisition CPSR.U 0.14% Unchanged $2,170,000 200,000 73 Oaktree Acquisition II OACB.U 0.14% Unchanged $2,142,000 200,000 74 10X Capital Venture Acq VCVCU 0.14% New $2,130,000 200,000 75 Software Acquisition II SAIIU 0.14% Unchanged $2,130,000 200,000 76 Horizon Acquisition HZAC.U 0.13% Unchanged $2,112,000 200,000 77 Motive Capital Corp. MOTV.U 0.13% New $2,108,000 200,000 78 Ascendant Digital Acq ACND.U 0.13% Unchanged $2,100,000 200,000 79 Far Peak Acquisition FPAC/U 0.13% New $2,070,000 200,000 80 Sandbridge Acquisition SBG.U 0.13% Unchanged $2,060,000 200,000 81 NextGen Acquisition NGACU 0.13% New $2,058,000 200,000 82 Waitr Holdings Inc WTRH 0.13% -2% $1,982,000 712,875 83 Eucrates Biomedical Acq EUCRU 0.12% New $1,866,000 175,000 84 BowX Acquisition BOWXU 0.11% Unchanged $1,725,000 161,200 85 HumanCo Acquisition HMCOU 0.10% New $1,653,000 150,000 86 Avanti Acquisition AVAN.U 0.10% New $1,626,000 150,000 87 Vy Global Growth VYGG.U 0.10% New $1,614,000 150,000 88 Gores Holdings VI, Inc. GHVIU 0.10% New $1,590,000 150,000 89 HighlandTranscendPartners HTPA.U 0.10% New $1,575,000 150,000 90 Fortress Value Acq II FAII 0.10% New $1,555,000 144,922

66
Hound Partners Fourth Quarter 2020 Portfolio:
Q4 2020 www.hedgefundwisdom.com
Continued on next page…
Rank Company Name Ticker Put/Call % of Portfolio Activity Value # of Shares
91 CF Acquisition Corp IV CFIVU 0.10% New $1,544,000 150,000 92 Carney Technology Acq II CTAQU 0.10% New $1,539,000 150,000 93 Healthcare Services Acq HCARU 0.10% New $1,533,000 150,000 94 Ribbit LEAP, Ltd. LEAP.U 0.09% Unchanged $1,497,000 100,000 95 RevolutionAccelerationAcq RAACU 0.08% New $1,301,000 125,000 96 RedBall Acquisition Corp. RBAC.U 0.07% Unchanged $1,156,000 100,000 97 RedBall Acquisition Corp. RBAC 0.07% New $1,089,000 100,000 98 D8 Holdings Corp. Units DEH.U 0.07% Unchanged $1,069,000 100,000 99 Falcon Capital Acq FCACU 0.07% Unchanged $1,068,000 100,000
100 Equity Distribution Acq EQD.U 0.07% Unchanged $1,065,000 100,000 101 HPX Corp. HPX.U 0.07% Unchanged $1,055,000 100,000 102 Broadstone Acquisition BSN.U 0.07% Unchanged $1,049,000 100,000 103 Population Health PHICU 0.07% New $1,045,000 100,000 104 CBRE Acquisition CBAH.U 0.07% New $1,045,000 100,000 105 Trepont Acquisition I TACA.U 0.07% New $1,037,000 100,000 106 KINS Technology Group KINZU 0.07% New $1,029,000 100,000 107 Turmeric Acquisition Corp. TMPMU 0.07% New $1,027,000 100,000 108 ChurchillCapitalCorpUnits CCV.U 0.05% New $840,000 80,000 109 TWC Tech Holdings II TWCTU 0.05% Unchanged $806,000 75,000 110 Spring Valley Acq SVSVU 0.05% New $791,000 75,000 111 EdtechX Holdings Acq EDTXU 0.05% New $774,000 75,000 112 JAWS Spitfire Acq SPFR.U 0.05% New $774,000 70,000 113 MP Materials Warrants MP.WS 0.05% New $769,000 50,000 114 Marquee Raine Acquisition MRACU 0.04% New $650,000 60,000 115 Deerfield Healthcare DFHTU 0.04% Unchanged $600,000 40,000 116 Apollo Strategic Growth APSG.U 0.03% New $547,000 50,000 117 Live Oak Acquisition II LOKB.U 0.03% New $543,000 50,000 118 Tiga Acquisition Corp. TINV.U 0.03% New $529,000 50,000 119 7GC & Holdings Co Inc VIIAU 0.03% New $528,000 50,000 120 NewHold Investment Corp. NHICU 0.03% -75% $522,000 50,000 121 Seven Oaks Acq SVOKU 0.03% New $518,000 50,000 122 Dragoneer Growth II DGNS 0.02% New $343,000 30,000 123 MedTech Acquisition Corp. MTACU 0.02% New $315,000 30,000 124 Qell Acquisition Warrants QELLW 0.02% New $312,000 100,000

67
Hound Partners Fourth Quarter 2020 Portfolio:
Q4 2020 www.hedgefundwisdom.com
Next Page: Glenview Capital
Rank Company Name Ticker Put/Call % of Portfolio Activity Value # of Shares
VIA optronics AG ADS VIAO Sold Energy Sector ETF XLE Sold Gores Holdings IV Units GHIVU Sold National Instruments Corp NATI Sold Foley Trasimene Acq II BFT.U Sold CC Neuberger Principal PCPLU Sold SocialCapHedosophiaII IPOB.U Sold Palo Alto Networks Inc PANW Sold Kensington Cap Acq KCAC.U Sold Carvana Co CVNA Sold Quanterix Corp QTRX Sold Vesper Healthcare Acq VSPRU Sold Jumia Technologies AG JMIA PUT Sold StarPeakEnergy Transition STPK.U Sold Flying Eagle Acq Units FEAC/U Sold First Solar Inc FSLR Sold Tesla Inc TSLA CALL Sold SocialCapHedosophiaIII IPOC/U Sold Crexendo Inc CXDO Sold Rocket Companies, Inc. RKT PUT Sold Kingsoft Cloud Holdings KC Sold Theravance Biopharma TBPH Sold StepStone Group Inc. STEP Sold Evofem Biosciences Inc EVFM Sold Vitru Ltd. VTRU Sold GoodRx Holdings, Inc. GDRX Sold Orphazyme A/S ADS ORPH Sold Freeline Therapeutics FRLN Sold Qell Acquisition Corp. QELLU Sold dMY Technology Group II DMYD.U Sold BioNTech SE ADR BNTX PUT Sold Aercap Holdings N.V. AER Sold Forum Merger III Corp. FIIIU Sold dMY Technology Group DMYT.UN Sold CM Life Sciences, Inc. CMLFU Sold Mp Materials Corp FVACU Sold Jaws Acquisition Corp. JWS.U Sold NOW Inc DNOW Sold Syneos Health Inc Class A SYNH Sold JFrog Ltd. FROG Sold WAVE Life Sciences Ltd WVE Sold

68
After a rough start to the year where they were down double digits, Glenview Capital climbed back and finished 2020 up 9.5% and then started the new year up 6.4% in January, according to Bloomberg.
During the fourth quarter, Glenview ramped up its stake in ridesharing platform Lyft (LYFT) to the tune of 204% and made it their ninth largest holding.
When they would have been buying, LYFT traded from $21 up to $50. Given the wide range, it’s hard to pinpoint exactly where they built their stake. In trading activity since quarter-end, LYFT now trades even higher, around $58 per share.
The company recently reported earnings and revenue came in higher than expected and the overall loss per share was less than expected. Revenue per active rider came in at $45.40, higher than expected as well. As the economy opens back up further later in the year, analysts are looking for the company to see leverage and scale lead to a clear path to profitability.
While their main rival Uber (UBER) has
Key Takeaways
New Posit ions: Anthem (ANTM) Cigna (CI) Calls McKesson (MCK) Calls Norfolk Southern (NSC) DuPont (DD) Aptiv (APTV) Union Pacific (UNP) Insperity (NSP) Global Payments (GPN) Sold Out: eBay (EBAY) Biohaven Pharmaceutical (BHVN)
been a hedge fund favorite, Glenview elected to ride with Lyft. The main difference between the two is that Uber has a more global presence and also offers Uber Eats food delivery in addition to ridesharing, while Lyft primarily operates rides.
That said, Lyft has also discussed delivery in some capacity. But they signaled that they’re not interested in creating a demand aggregation consumer platform like Uber Eats, citing pain from restaurants, who already operating with thin margins, then have to give some of their revenue to Uber Eats. And even though Uber Eats has effectively been in its best-case environment for delivery with everyone at home more due to the pandemic, the segment is still unprofitable.
Lyft sounds like it will take more of a business-to-business approach, as they’re not interested in stepping between a restaurant and their customer. Back in October they announced a partnership with Grubhub where Lyft Pink members get unlimited free delivery with Grubhub+.
The rideshare giants also saw shares spike in the quarter on news that California passed its gig-worker ballot measure (Prop 22). This was a win for the companies and allows them to continue to classify their drivers as independent contractors rather than employees, meaning they can avoid paying healthcare and various benefits to those contractors, thus removing a big overhang on shares.
During Q4, Larry Robbins’ firm also boosted its Boston Scientific (BSX) stake by 158%, making it their 11th largest holding.
Lastly, Robbins also got in on the SPAC frenzy, as his Longview Acquisition merged with Butterfly Network, a company that created the world’s first handheld single probe ultrasound system for the entire body.
View Glenview Capital’s Updated Portfolio on the Next Page
Q4 2020 www.hedgefundwisdom.com
Glenview Capital Larry Robbins
Known for taking concentrated positions in large caps
Previously a trader at Leon Cooperman’s
Omega Advisors

69
Continued on next page…
Glenview Capital Fourth Quarter 2020 Portfolio:
Q4 2020 www.hedgefundwisdom.com
Rank Company Name Ticker Put/Call % of Portfolio Activity Value # of Shares
1 Tenet Healthcare Corp. THC 16.72% -8% $729,074,000 18,258,810 2 Bausch Health Companies BHC 7.84% +10% $341,828,000 16,434,019 3 Takeda Pharmaceutical TAK 6.37% -9% $277,741,000 15,260,512 4 DXC Technology Company DXC 5.99% -1% $261,338,000 10,149,059 5 Cigna Holding Co CI 5.99% -4% $261,270,000 1,255,021 6 HCA Healthcare Inc HCA 4.90% -21% $213,828,000 1,300,181 7 McKesson Corp. MCK 4.66% -8% $203,084,000 1,167,689 8 Laboratory Corp LH 2.58% -21% $112,398,000 552,187 9 Lyft Inc LYFT 2.33% +204% $101,413,000 2,064,179
10 Nuance Communications NUAN 2.26% -7% $98,690,000 2,238,367 11 Boston Scientific Inc. BSX 2.23% +159% $97,169,000 2,702,881 12 Universal Health Services UHS 1.97% +8% $85,821,000 624,152 13 AmerisourceBergen ABC 1.96% +7% $85,583,000 875,442 14 FMC Corp FMC 1.88% +2% $81,807,000 711,796 15 Brookdale Senior Living BKD 1.83% +43% $79,766,000 18,005,910 16 Meritor Inc MTOR 1.76% -29% $76,957,000 2,757,332 17 Myriad Genetics Inc MYGN 1.67% +34% $72,825,000 3,682,691 18 Element Solutions Inc ESI 1.57% +56% $68,557,000 3,866,712 19 Humana, Inc. HUM 1.50% +92% $65,430,000 159,480 20 Avis Budget Group Inc CAR 1.47% +31% $64,321,000 1,724,413 21 IQVIA Holdings Inc IQV 1.40% -19% $60,856,000 339,657 22 Anthem Inc ANTM 1.36% New $59,229,000 184,461 23 Hologic Inc. HOLX 1.34% -45% $58,588,000 804,442 24 Expedia Group Inc EXPE 1.30% +24% $56,786,000 428,895 25 FIserv Inc. FISV 1.26% +149% $55,077,000 483,726 26 Endo International plc ENDP 1.23% -14% $53,777,000 7,489,768 27 ViacomCBS Inc. Class B VIAC 1.15% -61% $49,985,000 1,341,520 28 Corteva Inc CTVA 1.14% -23% $49,926,000 1,289,420 29 Alphabet Inc. Class A GOOGL 1.14% +639% $49,791,000 28,409 30 Baxter International Inc. BAX 1.03% +321% $44,841,000 558,832 31 Cigna Holding Co CI CALL 0.95% New $41,636,000 200,000 32 Molina Healthcare Inc MOH 0.90% -11% $39,286,000 184,720 33 McKesson Corp. MCK CALL 0.80% New $34,784,000 200,000 34 Amgen, Inc. AMGN 0.75% +212% $32,528,000 141,474 35 Healthpeak Properties Inc PEAK 0.72% +156% $31,519,000 1,042,641 36 Marriott International MAR 0.69% -48% $30,159,000 228,619 37 Michaels Companies MIK 0.60% -11% $25,969,000 1,996,084 38 Norfolk Southern Corp. NSC 0.52% New $22,557,000 94,933 39 Welltower Inc WELL 0.45% +146% $19,756,000 305,732 40 DowDuPont Inc DD 0.42% New $18,347,000 258,003 41 DaVita HealthCare DVA 0.38% -27% $16,508,000 140,613 42 Aptiv PLC APTV 0.33% New $14,366,000 110,263 43 Medtronic Plc MDT 0.31% Unchanged $13,340,000 113,882 44 Union Pacific Corp. UNP 0.30% New $13,270,000 63,731 45 Insperity Inc. NSP 0.30% New $13,026,000 159,983

70
Next Page: Viking Global
Glenview Capital Fourth Quarter 2020 Portfolio:
Q4 2020 www.hedgefundwisdom.com
Rank Company Name Ticker Put/Call % of Portfolio Activity Value # of Shares
46 Global Payments Inc. GPN 0.30% New $12,956,000 60,143 47 Quest Diagnostics, Inc. DGX 0.27% -37% $11,985,000 100,567 48 PRA Health Sciences Inc PRAH 0.27% Unchanged $11,782,000 93,925 49 Viad Corp VVI 0.21% +392% $9,078,000 250,995 50 Aramark ARMK 0.16% New $7,175,000 186,457 51 Microsoft Corp. MSFT 0.13% -54% $5,504,000 24,748 52 Dun & Bradstreet DNB 0.11% New $4,984,000 200,147 53 Fluidigm Corp FLDM 0.11% Unchanged $4,856,000 809,369 54 United Rentals, Inc. URI 0.07% -84% $2,969,000 12,804 55 Facebook Inc FB 0.06% New $2,619,000 9,586 56 Amazon.com Inc. AMZN 0.06% New $2,534,000 778
eBay Inc. EBAY Sold Biohaven Pharmaceutical BHVN Sold

71
Andreas Halvorsen’s firm had a good year, with one of their hedge funds up 51.6% for 2020 and their long-only fund up 33.1%, per Institutional Investor.
During the fourth quarter, Viking Global boosted its Alphabet (GOOGL) exposure by a significant 222% and made it their sixth largest holding. The company’s Google search business continues to dominate its segment and saw 17% year-over-year revenue growth recently. Additionally, its YouTube segment saw faster revenue growth of 52% as they’ve benefited from the pandemic. This has long been an asset hiding in
Key Takeaways
New Posit ions: Unitedhealth (UNH) AbCellera Biologics (ABCL) Walt Disney (DIS) Palo Alto Networks (PANW) ServiceNow (NOW) Hartford Financial (HIG) General Electric (GE) HCA (HCA) Facebook (FB) Air Products (APD) 4D Molecular Therapeutics (FDMT) Sold Out: Analog Devices (ADI) CME Group (CME) Raytheon (RTX) Comcast (CMCSA) Bill.com (BILL) Atlassian (TEAM) Exact Sciences (EXAS) Ceridian (CDAY) Anthem (ANTM)
plain sight and they continue to ramp up monetization. This compares to rival Facebook’s (FB) 31% year-over-year growth. GOOGL also continues to have ‘call options’ embedded within the company, such as its Waymo self-driving car segment.
During Q4 Halvorsen also purchased almost $1 billion worth of the US’s largest health insurer, Unitedhealth (UNH). Recently, it was announced that the Haven joint venture between Amazon, Berkshire Hathaway, and JPMorgan was shutting down. This was initially formed in order to utilize the scale of the combined companies to overhaul employee healthcare and lower costs.
When it was originally announced, shares of healthcare companies fell on fears they might succeed. But this shutdown shows just how difficult it is to change the system and in a sense could have been a test of Unitedhealth’s moat and showcased their entrenched position. While some of these companies could still come up with solutions on their own and utilize their individual scale, UNH remains kings of the hill.
Viking has also reported various short positions in Europe. In Sweden, they were short 0.81% of Telia Company AB as of February 9th and short 0.56% of H&M Hennes & Mauritz AB as of January 29th. In Italy, Viking was short 0.63% of Diasorin SPA as of December 16th. And in the UK, they were short 0.6% of Hargreaves Lansdown Plc as of December 29th.
Lastly, in Germany, Viking has been short airline Deutsche Lufthansa Aktiengesellschaft in varying levels throughout the past year. Their last report indicated a 1.83% short as of January 29th, an increase over recent months, but off the highs of their 2.44% short back in June of last year.
Andreas Halvorsen Viking Global
View Viking Global’s Updated Portfolio on the Next Page
Returned an average of 13% annually over the past decade
Has been directing more capital to Viking’s ‘best ideas’ & is taking a more concentrated portfolio
approach than in the past
Q4 2020 www.hedgefundwisdom.com

72
Fourth Quarter 2020 Portfolio: Viking Global
Q4 2020 www.hedgefundwisdom.com
Continued on next page…
Rank Company Name Ticker Put/Call % of Portfolio Activity Value # of Shares
1 Microsoft Corp. MSFT 7.24% +43% $2,633,028,000 11,838,092 2 BridgeBio Pharma Inc BBIO 5.21% Unchanged $1,893,019,000 26,620,991 3 Adaptive Biotechnologies ADPT 4.88% -10% $1,773,528,000 29,993,708 4 Fidelity National Info FIS 4.60% +33% $1,674,237,000 11,835,412 5 T-Mobile US Inc TMUS 3.23% +8% $1,173,934,000 8,705,481 6 Alphabet Inc. Class A GOOGL 2.99% +223% $1,086,270,000 619,791 7 Boston Scientific Inc. BSX 2.96% +59% $1,078,173,000 29,990,892 8 JPMorgan Chase & Co JPM 2.96% -10% $1,074,895,000 8,459,075 9 UnitedHealth Group Inc. UNH 2.69% New $979,682,000 2,793,665
10 VISA Inc V 2.46% +1170% $893,630,000 4,085,538 11 Centene Corp CNC 2.16% -25% $785,652,000 13,087,649 12 AbCellera Biologics Inc. ABCL 2.13% New $775,978,000 19,283,744 13 Walt Disney Co DIS 2.13% New $773,911,000 4,271,505 14 Nuance Communications NUAN 1.99% -4% $722,312,000 16,382,663 15 MercadoLibre Inc MELI 1.90% -13% $690,047,000 411,914 16 Palo Alto Networks Inc PANW 1.84% New $670,667,000 1,887,130 17 Amazon.com Inc. AMZN 1.80% -26% $652,920,000 200,471 18 American Express Co AXP 1.74% -52% $631,662,000 5,224,231 19 FleetCor Technologies Inc FLT 1.70% +383% $619,255,000 2,269,747 20 Taiwan Semiconductor TSM 1.68% -9% $610,765,000 5,601,289 21 APi Group Corp APG 1.66% Unchanged $605,000,000 33,333,333 22 Zimmer Biomet ZBH 1.64% +129% $595,877,000 3,867,074 23 Fortive Corp FTV 1.55% -2% $564,006,000 7,963,937 24 Aon PLC AON 1.49% -15% $543,095,000 2,570,620 25 Hilton Worldwide HLT 1.44% -47% $525,136,000 4,719,901 26 Moodys Corp MCO 1.31% +27% $477,567,000 1,645,420 27 Parker-Hannifin Corp. PH 1.26% -33% $458,473,000 1,683,025 28 Guardant Health Inc GH 1.25% -8% $455,570,000 3,534,842 29 ServiceNow Inc NOW 1.16% New $422,789,000 768,107 30 Booking Holdings BKNG 1.15% -46% $419,353,000 188,281 31 Chubb Limited CB 1.15% -21% $416,525,000 2,706,111 32 Cigna Holding Co CI 1.12% +35% $406,756,000 1,953,869 33 Hartford Financial HIG 1.09% New $395,322,000 8,071,081 34 Sea Ltd ADR SE 1.04% +132% $379,191,000 1,905,002 35 Avantor Inc AVTR 1.03% +63% $376,048,000 13,358,729 36 Assurant Inc. AIZ 1.03% Unchanged $375,776,000 2,758,595 37 Advanced Micro Devices AMD 1.01% -11% $368,216,000 4,015,000 38 Otis Worldwide Corp OTIS 1.00% +80% $364,612,000 5,397,663 39 VeriSign Inc. VRSN 0.87% +125% $317,394,000 1,466,699 40 General Electric Co GE 0.87% New $315,360,000 29,199,997 41 HCA Healthcare Inc HCA 0.79% New $287,508,000 1,748,194 42 Align Technology Inc ALGN 0.79% -10% $285,863,000 534,944 43 Facebook Inc FB 0.78% New $281,881,000 1,031,928 44 Ingersoll Rand Inc IR 0.77% -27% $279,975,000 6,145,201 45 Horizon Therapeutics HZNP 0.74% +212% $267,939,000 3,662,876

73
Viking Global
Q4 2020 www.hedgefundwisdom.com
Fourth Quarter 2020 Portfolio: … Continued
Rank Company Name Ticker Put/Call % of Portfolio Activity Value # of Shares
46 Encompass Health Corp EHC 0.60% -20% $218,572,000 2,643,276 47 Molina Healthcare Inc MOH 0.60% -16% $217,516,000 1,022,739 48 Unity Software Inc. U 0.60% Unchanged $216,390,000 1,409,981 49 Micron Technology, Inc. MU 0.57% -12% $206,903,000 2,752,100 50 AvalonBay Communities AVB 0.53% -53% $194,103,000 1,209,895 51 Snowflake, Inc. SNOW 0.49% -2% $176,482,000 627,157 52 Inhibrx, Inc. INBX 0.48% Unchanged $174,934,000 5,305,866 53 Air Products & Chemicals APD 0.48% New $173,932,000 636,600 54 Workday Inc WDAY 0.47% -37% $169,603,000 707,831 55 Las Vegas Sands Corp LVS 0.46% -67% $168,463,000 2,826,560 56 4D Molecular Therapeutics FDMT 0.45% New $163,227,000 3,937,914 57 MetLife Inc. MET 0.43% New $156,836,000 3,340,480 58 Zentalis Pharmaceuticals ZNTL 0.43% -32% $156,406,000 3,011,284 59 Bristol-Myers Squibb Co BMY 0.43% -21% $155,496,000 2,506,793 60 Marsh & McLennan MMC 0.42% New $154,507,000 1,320,572 61 PMV Pharmaceuticals, Inc. PMVP 0.40% -11% $145,413,000 2,364,062 62 Match Group Inc. MTCH 0.38% New $138,291,000 914,686 63 Becton, Dickinson and Co. BDX 0.35% New $128,009,000 511,584 64 Darden Restaurants Inc DRI 0.35% -25% $127,502,000 1,070,370 65 Catalent Inc CTLT 0.34% +2% $125,263,000 1,203,641 66 Insulet Corp PODD 0.34% +126% $123,605,000 483,529 67 Royalty Pharma PLC RPRX 0.31% +17% $114,464,000 2,287,000 68 Bilibili Inc BILI 0.31% New $112,386,000 1,311,083 69 Axa Equitable Holdings EQH 0.27% New $99,138,000 3,874,110 70 Progressive Corp. PGR 0.24% New $88,510,000 895,126 71 McAfee Corp. MCFE 0.24% New $87,646,000 5,251,436 72 DoorDash, Inc. DASH 0.24% New $87,159,000 610,573 73 PVH Corp PVH 0.21% -53% $77,731,000 827,892 74 CarMax Inc. KMX 0.21% New $75,024,000 794,240 75 Kinnate Biopharma Inc. KNTE 0.20% New $74,469,000 1,872,023 76 Athira Pharma, Inc. ATHA 0.20% Unchanged $72,632,000 2,120,653 77 Vertex, Inc. VERX 0.19% Unchanged $70,803,000 2,031,639 78 CoStar Group Inc CSGP 0.18% -76% $65,577,000 70,949 79 Cooper Companies COO 0.15% -58% $54,135,000 149,000 80 Everest Re Group Ltd. RE 0.13% -70% $46,702,000 199,505 81 Pacific Biosciences PACB 0.11% -65% $40,542,000 1,562,915 82 Thermo Fisher Scientific TMO 0.10% -94% $36,246,000 77,817 83 GoHealth, Inc. GOCO 0.10% -45% $35,528,000 2,600,905 84 Karuna Therapeutics Inc KRTX 0.09% -49% $34,358,000 338,200 85 Arena Pharmaceuticals Inc ARNA 0.09% New $32,826,000 427,256 86 Blueprint Medicines Corp BPMC 0.08% -81% $30,581,000 272,681 87 Viela Bio, Inc. VIE 0.07% -17% $25,302,000 703,424 88 Laboratory Corp LH 0.05% -78% $19,235,000 94,500 89 Jamf Holding Corp. JAMF 0.05% Unchanged $18,126,000 605,828 90 Chindata Group CD 0.05% -50% $17,726,000 739,798 91 Acadia Healthcare ACHC 0.05% New $17,179,000 341,799 92 Agora, Inc. ADS API 0.04% Unchanged $15,824,000 400,000 93 Genmab A/S GMAB 0.04% Unchanged $15,352,000 377,562 94 Seer, Inc. SEER 0.04% New $15,171,000 270,232 95 JFrog Ltd. FROG 0.03% Unchanged $10,646,000 169,441 96 BristolMyersSquibb Rights BMY/R 0.02% -52% $6,091,000 8,825,899

74
Viking Global
Q4 2020 www.hedgefundwisdom.com
Fourth Quarter 2020 Portfolio: … Continued
Next Page: Farallon Capital
Rank Company Name Ticker Put/Call % of Portfolio Activity Value # of Shares
Ceridian HCM Holding Inc CDAY Sold Raytheon Technologies RTX Sold CME Group Inc CME Sold Formula 1 FWONK Sold Atlassian Corp Plc TEAM Sold Nikola Corp NKLA Sold Allstate Corp ALL Sold EXACT Sciences EXAS Sold Anthem Inc ANTM Sold Bill.com Holdings BILL Sold Li Auto Inc. ADS LI Sold Analog Devices Inc ADI Sold Comcast Corp. Class A CMCSA Sold VBI Vaccines Inc VBIV Sold aTyr Pharma Inc LIFE Sold

75
Farallon Capital was buying shares of Willis Towers Watson (WLTW) in size during the fourth quarter. Boosting their stake by 1,825% off a smaller base, WLTW is now their fourth largest holding.
The company is set to merge with Aon (AON) in a combination that will create a behemoth in the insurance broker industry, as they are the second and third largest players.
The deal is set to close in the first half of this year and WLTW shareholders will receive 1.08 AON shares for each WLTW share held. The deal spread currently has each WLTW shareholder receiving around $246.60 per share, compared to WLTW’s trading price of $224.98, or around an 8.75% discount.
The European Commission had been doing its antitrust review of the deal but stopped the clock
Key Takeaways
New Posit ions: S&P 500 (SPY) Puts Aramark (ARMK) Raytheon (RTX) Tiffany (TIF) ~ merged with LVMH Broadcom (AVGO) Qiagen (QGEN) Lufax Holding (LU) Sold Out: Immunomedics (IMMU) Emerging market bond ETF (EMB) Put General Dynamics (GD) Wright Medical Group (WMGI) IHS Markit (INFO) MyoKardia (MYOK) Palo Alto Networks (PANW) Equinix (EQIX)
on its investigation recently. This is typically done when they’re waiting to receive more documentation they’ve requested from the companies. The overall analysis was originally supposed to be completed by May 10th. WLTW’s CEO recently said that they still expect to close the deal in the first half of 2021.
Farallon has also re-entered shares of Qiagen (QGEN). They had previously been a shareholder but exited in Q3. In this timeframe it was announced that the company’s shareholders voted against being acquired by Thermo Fisher Scientific (TMO), citing too low of a bid.
Fast-forward to the fourth quarter and Farallon has jumped back in. The company could still potentially be a takeout target and Bloomberg recently reported that Quidel Corp (QDEL) is looking to make an offer.
During the quarter, Farallon also exited their stake in IHS Markit (INFO). The company is being acquired by S&P Global (SPGI), pending approval.
It’s hard to pinpoint exactly why they exited given many analysts don’t feel this will face any significant approval hurdles. Perhaps the spread wasn’t compelling enough or they found other opportunities.
But it’s a name worth highlighting because some non-arbitrage focused firms have been buying INFO as a way to get a cheaper entry into shares of SPGI, which they view as a very solid business. This is because INFO shareholders will receive 0.2838 SPGI shares for each INFO share held.
Lastly, Farallon has also been active in international markets. In the UK, the hedge fund has disclosed that they own 18.97% of voting rights of Pantheon Resources as of February 10th.
Andrew Spokes Farallon Capital
View Farallon Capital’s Updated Portfolio on the Next Page
Typically focuses on risk arbitrage strategies
Founder Tom Steyer stepped down and
key-man Andrew Spokes runs the firm now
Q4 2020 www.hedgefundwisdom.com

76
Fourth Quarter 2020 Portfolio: Farallon Capital
Q4 2020 www.hedgefundwisdom.com
Continued on next page…
Rank Company Name Ticker Put/Call % of Portfolio Activity Value # of Shares
1 IQVIA Holdings Inc IQV 4.71% +15% $724,475,000 4,043,506 2 Alphabet Inc. Class C GOOG 4.12% Unchanged $632,593,000 361,094 3 T-Mobile US Inc TMUS 3.46% +9% $532,547,000 3,949,181 4 Thermo Fisher Scientific TMO 3.38% +2% $518,994,000 1,114,248 5 SPDR S&P 500 ETF Trust SPY PUT 3.32% New $510,346,000 1,365,000 6 VISA Inc V 3.17% +30% $487,353,000 2,228,104 7 Aon PLC AON 3.12% +29% $479,903,000 2,271,514 8 Boston Scientific Inc. BSX 3.10% +60% $475,918,000 13,238,319 9 Fidelity National Info FIS 2.90% Unchanged $445,474,000 3,149,118
10 Aramark ARMK 2.76% New $424,202,000 11,023,949 11 Centene Corp CNC 2.68% -3% $411,206,000 6,850,000 12 Anthem Inc ANTM 2.66% Unchanged $409,390,000 1,275,000 13 Microsoft Corp. MSFT 2.54% +14% $391,052,000 1,758,168 14 Westinghouse Air Brake WAB 2.38% -8% $365,808,000 4,997,371 15 Charter Communications CHTR 2.35% -25% $361,822,000 546,931 16 New York Times NYT 2.20% -8% $338,852,000 6,545,329 17 Acceleron Pharma Inc XLRN 2.16% Unchanged $332,644,000 2,600,000 18 Raytheon Technologies RTX 2.11% New $324,820,000 4,542,306 19 Facebook Inc FB 2.05% -25% $315,228,000 1,154,005 20 Salesforce.com Inc. CRM 2.04% +102% $313,555,000 1,409,045 21 Tiffany & Co TIF 1.96% New $300,626,000 2,287,000 22 Sherwin-Williams Co. SHW 1.86% -4% $286,149,000 389,366 23 Iovance Biotherapeutics IOVA 1.81% +1% $278,400,000 6,000,000 24 Fate Therapeutics Inc FATE 1.77% -4% $272,790,000 3,000,000 25 Broadcom Ltd AVGO 1.77% New $272,778,000 622,995 26 Blackstone Group Inc BX 1.64% +2% $252,233,000 3,891,886 27 Exelixis Inc EXEL 1.44% +2% $220,770,000 11,000,000 28 New Oriental Education EDU 1.40% -16% $214,480,000 1,154,300 29 Willis Towers Watson plc WLTW 1.32% +1825% $202,780,000 962,500 30 Alibaba Group BABA 1.29% +39% $198,589,000 853,300 31 Mirati Therapeutics Inc MRTX 1.25% Unchanged $192,185,000 875,000 32 Hilton Worldwide HLT 1.19% +6% $182,515,000 1,640,437 33 Qiagen N.V. QGEN 1.12% New $172,120,000 3,256,771 34 TransUnion TRU 1.12% -4% $172,056,000 1,734,082 35 Ascendis Pharma A/S ADR ASND 1.09% -20% $166,780,000 1,000,000 36 Howmet Aerospace Inc HWM 0.91% -32% $139,603,000 4,891,479 37 Apellis Pharmaceuticals APLS 0.85% Unchanged $130,130,000 2,275,000 38 AbbVie Inc ABBV 0.80% -73% $123,223,000 1,150,000 39 Amyris Inc. AMRS 0.70% +25% $108,063,000 17,500,000 40 Sarepta Therapeutics Inc SRPT 0.67% Unchanged $102,294,000 600,000 41 Momo Inc ADR Notes MOMO 0.61% +6% $93,459,000 110,077,000 42 PG&E Corp PCG 0.59% Unchanged $90,859,000 7,292,042 43 Sage Therapeutics Inc SAGE 0.59% Unchanged $90,836,000 1,050,000 44 Playa Hotels & Resorts NV PLYA 0.58% -51% $89,219,000 14,994,867 45 Lufax Holding Ltd ADS LU 0.50% New $76,080,000 5,357,750

77
Fourth Quarter 2020 Portfolio: … Continued
Farallon Capital
Q4 2020 www.hedgefundwisdom.com
Continued on next page…
Rank Company Name Ticker Put/Call % of Portfolio Activity Value # of Shares
46 Enanta Pharmaceuticals ENTA 0.49% Unchanged $74,728,000 1,775,000 47 Broadmark Realty BRMK 0.48% Unchanged $73,136,000 7,170,213 48 Kansas City Southern KSU 0.47% -10% $72,344,000 354,400 49 iQiyi Notes DEBT-IQIY 0.47% +32% $71,760,000 81,762,000 50 Equifax Inc. EFX 0.47% -7% $71,483,000 370,684 51 Karuna Therapeutics Inc KRTX 0.46% Unchanged $71,113,000 700,000 52 FibroGen Inc FGEN 0.46% +3% $70,471,000 1,900,000 53 BioAtla, Inc. BCAB 0.44% New $66,900,000 1,967,060 54 Generation Bio Co. GBIO 0.42% +7% $64,321,000 2,268,819 55 Arena Pharmaceuticals Inc ARNA 0.37% +19% $57,623,000 750,000 56 Pacific Biosciences PACB 0.35% -48% $54,474,000 2,100,000 57 TheravanceBiopharmNotes TBPH 0.35% Unchanged $53,806,000 56,695,000 58 iQiyi Notes IQ 0.32% +67% $49,894,000 49,689,000 59 Cytokinetics Inc CYTK 0.32% +12% $49,872,000 2,400,000 60 Protagonist Therapeutics PTGX 0.32% -12% $48,888,000 2,425,000 61 Alnylam Pharmaceuticals ALNY 0.30% -71% $45,490,000 350,000 62 Zogenix Inc ZGNX 0.29% Unchanged $44,978,000 2,250,000 63 CoreLogic Inc CLGX 0.29% +66% $44,384,000 574,028 64 KaryopharmThera Notes KPTI 0.28% -9% $43,527,000 35,000,000 65 Agios Pharmaceuticals Inc AGIO 0.28% -8% $43,330,000 1,000,000 66 Ionis Phrmacutls IONS 0.28% New $42,405,000 750,000 67 Annexon, Inc. ANNX 0.25% -6% $38,978,000 1,557,261 68 Radius Health Inc RDUS 0.24% Unchanged $37,638,000 2,107,400 69 Cara Therapeutics Inc CARA 0.24% +10% $37,295,000 2,465,000 70 Insmed Notes INSM 0.24% New $36,552,000 32,500,000 71 Clovis Oncology Notes CLVS 0.23% Unchanged $36,077,000 51,910,000 72 Lantheus Holdings Inc LNTH 0.23% Unchanged $35,749,000 2,650,000 73 Zymeworks Inc ZYME 0.23% -12% $35,445,000 750,000 74 Krystal Biotech Inc KRYS 0.20% +11% $31,500,000 525,000 75 Novavax Inc NVAX 0.20% New $30,665,000 275,000 76 Nuvation Bio Inc NUVB 0.19% New $29,250,000 2,500,000 77 Amicus Therapeutics Inc FOLD 0.19% New $28,863,000 1,250,000 78 Clever Leaves Holdings CLVR 0.19% New $28,730,000 2,478,079 79 Dermtech DMTK 0.18% -29% $27,934,000 861,090 80 Biogen Inc BIIB 0.16% New $25,221,000 103,000 81 Constellation Pharma CNST 0.14% New $21,600,000 750,000 82 KE Holdings Inc. BEKE 0.14% +2% $21,108,000 343,000 83 Grifols S.A. ADR GRFS 0.13% -64% $20,561,000 1,115,000 84 Zealand Pharma A/S ADR ZEAL 0.12% +1% $18,329,000 510,000 85 Atento SA ATTO 0.12% Unchanged $18,227,000 2,230,357 86 Pliant Therapeutics, Inc. PLRX 0.11% Unchanged $17,364,000 764,262 87 Deciphera Pharma DCPH 0.11% -9% $17,121,000 300,000 88 Inhibrx, Inc. INBX 0.11% +29% $16,815,000 510,000 89 Ready Capital Corp RC 0.11% Unchanged $16,810,000 1,350,226 90 Avalanche Biotechnologies ADVM 0.11% Unchanged $16,260,000 1,500,000

78
Fourth Quarter 2020 Portfolio: … Continued
Farallon Capital
Q4 2020 www.hedgefundwisdom.com
Continued on next page…
Rank Company Name Ticker Put/Call % of Portfolio Activity Value # of Shares
91 Bristol-Myers Squibb Co BMY 0.10% -93% $15,508,000 250,000 92 BristolMyersSquibbRights BMY/R 0.10% -51% $14,768,000 21,400,000 93 Praxis Precision Medicines PRAX 0.09% New $13,755,000 250,000 94 XPO Logistics Inc XPO 0.09% New $13,112,000 110,000 95 Nuance Comm Notes NUAN 0.08% New $13,052,000 7,000,000 96 Intellia Therapeutics Inc NTLA 0.08% New $12,240,000 225,000 97 Tiga Acquisition Corp. TINV.U 0.07% New $11,426,000 1,080,000 98 Avrobio Inc AVRO 0.07% -24% $11,082,000 795,000 99 Rocket Pharmaceuticals RCKT 0.07% New $10,968,000 200,000
100 uniQure N.V. QURE 0.07% -33% $10,839,000 300,000 101 Cascade Acquisition Corp. CAS.U 0.07% New $10,346,000 990,000 102 Kinnate Biopharma Inc. KNTE 0.06% New $9,945,000 250,000 103 Albireo Pharma Inc ALBO 0.06% +25% $9,378,000 250,000 104 Surface Oncology Inc SURF 0.06% New $9,240,000 1,000,000 105 Gossamer Bio Notes DEBT-GOSS 0.06% New $9,032,000 10,000,000 106 Acacia Communications ACIA 0.05% New $7,296,000 100,000 107 Five Prime Therapeutics FPRX 0.04% New $6,804,000 400,000 108 Cogent Biosciences Inc COGT 0.04% New $6,738,000 600,000 109 ImmunoGen Inc. IMGN 0.04% New $6,450,000 1,000,000 110 Radius Health Notes RDUS 0.04% Unchanged $5,995,000 6,783,000 111 Marvell Technology Group MRVL CALL 0.04% New $5,943,000 125,000 112 Curis Inc CRIS 0.04% New $5,938,000 725,000 113 Apellis Pharma Notes DEBT-APEL 0.04% Unchanged $5,930,000 3,522,000 114 Shattuck Labs, Inc. STTK 0.03% New $5,241,000 100,000 115 IVERIC bio Inc ISEE 0.03% Unchanged $5,215,000 754,740 116 TG Therapeutics Inc TGTX 0.03% New $5,202,000 100,000 117 Arrowhea Pharmaceuticals ARWR 0.03% -84% $5,187,000 67,600 118 Savara Inc SVRA 0.03% Unchanged $5,120,000 4,452,086 119 HumanCo Acquisition HMCOU 0.03% New $4,408,000 400,000 120 908 Devices Inc. MASS 0.03% New $4,271,000 75,000 121 4D Molecular Therapeutics FDMT 0.03% New $4,145,000 100,000 122 Kura Oncology Inc KURA 0.03% New $4,083,000 125,000 123 Equillium Inc EQ 0.02% Unchanged $3,745,000 700,000 124 Ionis Pharma Notes IONS 0.02% New $2,733,000 2,500,000 125 Alpine Immune Sciences ALPN 0.02% -73% $2,520,000 200,000 126 Inventiva S.A. ADR IVA 0.02% -70% $2,320,000 160,000 127 Silverback Therapeutics SBTX 0.01% New $2,207,000 47,620 128 Broadmark Realty Cap BRMK 0.01% Unchanged $1,937,000 7,174,613 129 Gol Linhas Aereas GOL 0.01% Unchanged $843,000 85,838 130 Cerevel Thera Warrant CEREW 0.01% New $758,000 134,175

79
Fourth Quarter 2020 Portfolio: … Continued
Farallon Capital
Q4 2020 www.hedgefundwisdom.com
Next Page: Icahn Capital
Rank Company Name Ticker Put/Call % of Portfolio Activity Value # of Shares
AdaptimmuneTherapeutics ADAP Sold Fusion Pharmaceuticals FUSN Sold Global Blood Therapeutics GBT Sold MyoKardia Inc MYOK Sold Aurinia Pharmaceuticals AUPH Sold American Well Corp. AMWL Sold Navistar International NAV Sold Quotient Ltd QTNT Sold Horizon Therapeutics HZNP Sold Broadmark Realty BRMK CALL Sold General Dynamics Corp GD Sold ARYA Sciences Acq II ARYBU Sold Pandion Therapeutics PAND Sold EmergingMarketsBondETF EMB PUT Sold Compass Pathways CMPS Sold Equinix Inc EQIX Sold Arcus Biosciences Inc RCUS Sold Wright Medical Group N.V. WMGI Sold Liquidia Technologies Inc LQDA Sold Livongo Health Inc LVGO Sold Palo Alto Networks Inc PANW Sold Invitae Corp NVTA Sold Zentalis Pharma ZNTL Sold Immunomedics Inc. IMMU Sold NovoCure Ltd NVCR Sold Cigna Holding Co CI Sold Dyne Therapeutics, Inc. DYN Sold IHS Markit Ltd INFO Sold Protara Therapeutics, Inc. TARA Sold Cardiff Oncology Inc TROV Sold

80
Carl Icahn shows a brand new position in Bausch Health (BHC), the company that was formerly known as Valeant Pharmaceuticals. Some hedge funds were ensared in the fraud of this previous iteration, but the company has a revamped management team and has been focused on a turnaround. It recently announced it would spin-off its notable Bausch + Lomb segment into a separate public company in order to enhance shareholder value.
Some hedge funds have continued to hold through the turnaround, including ValueAct Capital and Paulson & Co.
And while Icahn started a tiny BHC position in the fourth quarter, he has since boosted his allocation significantly and in reality it’s now his 8th largest holding worth over $718 million. Icahn now owns 7.8% of the company and in his filing said he feels shares are “undervalued” and might seek board seats.
In response, Bausch responded with a boilerplate statement that they welcome open communication and are always looking to enhance shareholder value.
Recently, FirstEnergy (FE) noted in its 10K filing that Carl Icahn intends to acquire a position in the company.
They note: “FirstEnergy received a letter dated February 16, 2021, from Icahn Capital LP
Key Takeaways
New Posit ions: Bausch Health (BHC) Dana Incorporated (DAN) Sold Out: None
informing FirstEnergy that Carl Icahn is making a filing with the Federal Trade Commission and the Department of Justice pursuant to the Hart-Scott-Rodino Antitrust Improvements Act of 1976 and has a present good faith intention to acquire voting securities of the Corporation in an amount exceeding $184 million but less than $919.9 million of the voting securities of the issuer.”
The company says they don’t know whether Icahn has acquired common stock and/or derivatives, but eventually the extent of his stake will be revealed.
Carl Icahn also showed a new stake in Dana Incorporated (DAN) in the fourth quarter and since then has over doubled his share count and now holds around $224 million worth. With his latest round of buying, he currently owns 7.45% of the company.
Lastly, during the quarter, Icahn also cut his exposure to Herbalife (HLF) significantly. He sold 12.5 million shares back to the company and gave up five board seats.
View Icahn Capital’s Updated Portfolio on the Next Page
Q4 2020 www.hedgefundwisdom.com
Icahn Capital Carl Icahn
Activist investor / “corporate raider”
Known for taking large stakes in companies and pushing for change

81
Fourth Quarter 2020 Portfolio: Icahn Capital
Q4 2020 www.hedgefundwisdom.com
Next Page: Brave Warrior Advisors
Rank Company Name Ticker Put/Call % of Portfolio Activity Value # of Shares
1 Icahn Enterprises LP IEP 56.01% +4% $11,235,946,000 221,749,462 2 Occidental Petroleum OXY 7.65% Unchanged $1,534,138,000 88,627,271 3 CVR Energy Inc CVI 5.29% Unchanged $1,060,861,000 71,198,718 4 Herbalife Nutrition Ltd HLF 4.91% Unchanged $985,307,000 20,505,879 5 Cheniere Energy Inc LNG 4.84% -20% $970,601,000 16,168,606 6 Newell Brands Inc NWL 4.63% Unchanged $927,849,000 43,704,616 7 Navistar International NAV 3.67% Unchanged $735,449,000 16,729,960 8 Cloudera Inc CLDR 3.63% Unchanged $727,874,000 52,327,391 9 Xerox Corp XRX 3.33% +1% $667,159,000 27,769,235
10 Herc Holdings Inc HRI 1.49% Unchanged $298,499,000 4,494,789 11 Conduent Inc CNDT 0.91% Unchanged $183,117,000 38,149,336 12 Delek US Holdings Inc. DK 0.84% Unchanged $169,376,000 10,539,880 13 Welbilt Inc WBT 0.79% Unchanged $157,638,000 11,942,238 14 Occidental Petro Warrants OXYWS.WI 0.66% Unchanged $131,466,000 19,304,913 15 Bausch Health Companies BHC 0.52% New $104,689,000 5,033,147 16 Dana Incorporated DAN 0.39% New $77,803,000 3,985,820 17 Tenneco Inc. TEN 0.39% -20% $77,228,000 7,285,683 18 SandRidge Energy Inc SD 0.07% Unchanged $14,938,000 4,818,832

82
Last quarter’s issue highlighted how Brave Warrior accumulated shares in insurance broker Aon (AON) and they continued to buy in the fourth quarter too. Boosting their stake by a further 13%, it’s now their second largest holding.
As detailed in Farallon Capital’s section, Aon is merging with Willis Towers Watson (WLTW) and Farallon owns the latter. In the deal, WLTW shareholders will receive 1.08 AON shares for every WLTW share owned. So Farallon is playing the arbitrage aspect of the deal, given that WLTW trades at around a 9% discount to the takeover offer. The deal is expected to close in the second half of the year.
Given that Brave Warrior owns the other company in the deal (AON), rather than playing the deal spread as an arbitrage trade, perhaps they’re using the event-driven angle to bet on the transformive nature of the merger for the combined entity. After all, this will combine the second and third largest players in the brokerage space, forming a sizable competitor to market leader Marsh & McLennan (MMC). (Also worth noting: during Q4, one of Berkshire Hathaway’s portfolio managers built a stake in MMC.)
The other major change in Glenn Greenberg’s portfolio from the fourth quarter was the fact that he sized up his stake in Credit Acceptance (CACC) by 221% and made it his ninth largest holding. This comes after he initiated a new
Brave Warrior Advisors
Key Takeaways
New Posit ions: None Sold Out: CDK Global (CDK)
View Brave Warrior’s Updated Portfolio on the Next Page
stake in the company just a quarter prior. Credit Acceptance is an auto loan servicer
that deals in lower credit quality loans. Dealerships will often originate a loan and then sell it to CACC, who makes an upfront payment to the dealer (around 40-65% of the payments due in advance) and then aims to collect the remaining balance. CACC tries to collect between 65-75% of the remainder and then splits around 80% of that with the dealership. CACC holds on to the dealer’s share until it has recouped the advance payment it gave the dealer.
Shares sold off during the third and fourth quarters on news that the company received subpoenas from various state Attorneys General. When Greenberg was building his stake CACC fell from $540 to a low of $267. For the most part though, CACC has traded in a range between $300 and $360, and it trades around the latter currently.
Bears have targeted the stock in the past due to its subprime exposure. Given that subprime played such a large role in the financial crisis, the natural inclination was to posture that subprime auto loans could perhaps be the next shoe to drop. While auto loan delinquencies have steadily risen over the past decade, it doesn’t seem to be a systemic issue (at least not yet). And it’s worth pointing out that during the financial crisis, CACC actually benefited as competitors were impacted worse, lost market share, and some were wiped out.
Bulls point to the fact that CACC can compound earnings and book value north of 20% while generating returns on equity of around 30%. CACC is featured later in this issue in the investment thesis summary section.
Glenn Greenberg
Q4 2020 www.hedgefundwisdom.com
Runs a concentrated portfolio focused on free
cash flow generation and growth
Previously the co-founder of Chieftain Capital from 1984-2009 before founding Brave Warrior

83
Next Page: Pennant Investors
Fourth Quarter 2020 Portfolio: Brave Warrior Advisors
Q4 2020 www.hedgefundwisdom.com
Rank Company Name Ticker Put/Call % of Portfolio Activity Value # of Shares
1 Berkshire Hathaway BRK.B 11.90% -4% $323,583,000 1,395,538 2 Aon PLC AON 11.64% +13% $316,405,000 1,497,634 3 JPMorgan Chase & Co JPM 10.41% -1% $283,179,000 2,228,522 4 HCA Healthcare Inc HCA 9.81% -1% $266,783,000 1,622,176 5 Anthem Inc ANTM 9.11% +1% $247,603,000 771,135 6 Primerica Inc PRI 8.23% Unchanged $223,664,000 1,670,010 7 Raymond James Financial RJF 7.25% -2% $197,051,000 2,059,701 8 Progressive Corp. PGR 6.00% Unchanged $163,152,000 1,650,000 9 Credit Acceptance Corp. CACC 5.80% +221% $157,619,000 455,362
10 Charles Schwab Corp SCHW 4.52% -9% $122,999,000 2,318,997 11 Alphabet Inc. Class A GOOGL 4.29% -15% $116,631,000 66,546 12 Dollar Tree Inc. DLTR 3.87% -3% $105,341,000 975,021 13 Facebook Inc FB 2.55% -2% $69,280,000 253,625 14 UnitedHealth Group Inc. UNH 2.10% +2% $57,201,000 163,114 15 Antero Midstream Corp AM 1.53% -36% $41,621,000 5,398,393 16 Ryanair Holdings ADR RYAAY 0.83% -10% $22,543,000 204,975 17 Comcast Corp. Class A CMCSA 0.06% Unchanged $1,629,000 31,094 18 Moodys Corp MCO 0.04% +5% $952,000 3,279 19 Alphabet Inc. Class C GOOG 0.03% Unchanged $918,000 524 20 Bank of America Corp BAC 0.02% Unchanged $440,000 14,532 21 Marriott International MAR 0.01% Unchanged $382,000 2,897 22 Amazon.com Inc. AMZN 0.01% Unchanged $225,000 69
CDK Global Inc CDK Sold

84
Pennant Investors made a very notable buy during the fourth quarter: they increased their allocation to Micron Technology (MU) by 49% and made it their top holding.
Micron makes memory chips like DRAM and NAND, with 75% of revenue coming from the former. DRAM is the type of memory needed for algorithm code and processes, while NAND is used to store data like files, pictures, etc.
The industry has a long history of high competition and irrational behavior, but has finally consolidated down to basically three players who act rationally (MU, Samsung, SK Hynix).
While semiconductors have gone through negative demand shocks in the past, it seems to currently be in a positive one. Part of the bull thesis is that it’s shifting from a cyclical story to a secular one as many technology trends, especially AI, benefit the industry and could even lead to a supercycle. While AI is often reliant on GPUs (graphics processing units), it also relies on utilizing much more memory. MU’s CEO said that AI servers will require six times as much DRAM compared to standard servers.
MU recently noted that electric vehicles will be another large area of opportunity for them too: “As more EVs rollout, they have dramatically higher semiconductor content, including memory and
Key Takeaways
New Posit ions: Altimeter Growth Corp (ACGUU) Sold Out: Comcast (CMCSA) Blackstone Group (BX) Albertsons Companies (ACI) Energy Transfer (ET)
storage, compared to traditional cars … So I think that trend is going to last a good part of the decade, if not more.” Gartner has estimated that driverless cars will contain around 80GB of DRAM compared to 5.5GB found in PCs today. And don’t forget the ongoing cloud-computing trend with the proliferation of datacenters, especially hyperscale players, which also require tons of memory.
During the quarter when Pennant would have been buying, MU traded around 7x normalized earnings. And some analysts believe gross margins could hit a new high of 65% over the previous cycle high of around 59.6%. Last month, many sellside firms raised price targets on the company, with some noting that the DRAM downturn is over and that DRAM pricing could improve.
In terms of risks, one of the main things to keep an eye on is supply, as China has been investing billions of dollars to bring on mainland chip development.
Turning to the selling side of Pennant’s book, there are a few transactions worth highlighting. After building a stake in gold via exchange traded fund GLD a quarter ago, this time around Pennant reduced exposure to the precious metal by around 57%. Despite this sizable reduction, it’s still their 7th largest position due to the fact that it was previously their top holding.
Another notable sale from Pennant’s portfolio this quarter was Comcast (CMCSA), as the firm liquidated its stake in the cable giant entirely.
View Pennant Investors’s Updated Portfolio on the Next Page
Q4 2020 www.hedgefundwisdom.com
Pennant Investors Alan Fournier
Pursues a long/short equity strategy, recently
converted into a Family Office
Before founding Pennant in 2001, he was responsible for the global equity portfolio for
David Tepper’s Appaloosa Management

85
Fourth Quarter 2020 Portfolio: Pennant Investors
Q4 2020 www.hedgefundwisdom.com
Next Page: Duquesne Family Office
Rank Company Name Ticker Put/Call % of Portfolio Activity Value # of Shares
1 Micron Technology MU 14.65% +49% $45,559,000 606,000 2 Dish Network Corp DISH 13.52% +9% $42,042,000 1,300,000 3 General Motors Co GM 9.41% +167% $29,273,000 703,000 4 Charter Communications CHTR 7.98% Unchanged $24,808,000 37,500 5 Walt Disney Co DIS 7.87% -19% $24,459,000 135,000 6 T-Mobile US Inc TMUS 7.20% Unchanged $22,385,000 166,000 7 SPDR Gold Trust GLD 5.79% -58% $18,014,000 101,000 8 TransDigm Group Inc TDG 5.59% -22% $17,386,000 28,094 9 Amazon.com Inc. AMZN 5.13% Unchanged $15,959,000 4,900
10 Alphabet Inc. Class A GOOGL 4.34% Unchanged $13,495,000 7,700 11 Aramark ARMK 4.21% -21% $13,083,000 340,000 12 Antero Resources Corp AR 3.77% -27% $11,718,000 2,150,000 13 Microsoft Corp. MSFT 2.75% Unchanged $8,563,000 38,500 14 Bruker Corp BRKR 2.55% Unchanged $7,917,000 146,250 15 Antero Midstream Corp AM 2.44% -30% $7,581,000 983,292 16 Altimeter Growth Corp. AGCUU 1.67% New $5,200,000 400,000 17 Ryanair Holdings ADR RYAAY 1.13% -11% $3,519,000 32,000
Energy Transfer Equity LP ET Sold Blackstone Group Inc BX Sold Comcast Corp. Class A CMCSA Sold Albertsons Companies, Inc. ACI Sold

86
Stan Druckenmiller recently had a chat with Goldman Sachs and offered his take on markets. He noted, “Buckle up. I’ve been doing this since 1978 and this is about the wildest cocktail I’ve ever seen in terms of trying to figure out a roadmap.”
He points out that all the liquidity and stimulus has flowed into assets after a historic sharp decline at the onset of the pandemic was met with an equally historic monetary and fiscal response.
As to how he’s positioned currently, he notes: “My overriding theme is inflation relative to what the policymakers think. I have a short treasury position, primarily at the long-end, because the Fed can drive me crazy … I also have a large position in
Key Takeaways
New Posit ions: Cummins (CMI) Sunrun (RUN) Linde (LIN) China A-Shares Fund (ASHR) Semiconductor ETF (SMH) NYTimes (NYT) AbCellera Biologics (ABCL) Alcoa (AA) First Solar (FSLR) Array Technologies (ARRY) Formula 1 (FWONK) Sold Out: Netflix (NFLX) Alibaba (BABA) Facebook (FB) Wendys (WEN) Fidelity National Info (FIS) Gold Miners ETF (GDX) Alnylam Pharma (ALNY) Industrial Sector ETF (XLI)
commodities. The longer the Fed tries to keep rates suppressed, the more I win on commodities … And then because of the juxtaposition with our policy response versus Asia (to the crisis), I have a very, very short (U.S.) dollar position.”
As far as equities go, he said “I do think the combination of valuation and challenged bond markets could certainly make growth stocks in a very, very challenged environment the next five years, certainly to where they’ve been.” But referring specifically to cloud computing, he thinks we’re in the third or fourth inning, with COVID speeding things along as many companies must evolve or die.
On big tech, he notes Microsoft (MSFT) and Amazon (AMZN) have actually been underperformers the past two or three months. “It’s like the market has rotated into 40x sales tech companies or into radioactive ‘re-opening’ stocks. And if you actually look at the Amazons, Microsofts, Googles of the world, they’re not overvalued. They’re GARP (growth at a reasonable price) names and they’re currently unfavored. And if the Fed continues to push the evelope in terms of friendliness, I’m not really too worried about those stocks. If anything, I’d think they could keep going somewhat.”
Internationally, Druckenmiller also thinks Asia is looking better than the US given how they’ve handled the virus without mortgaging their future like the US has. He said he’s “quite constructive” on a number of names in Taiwan, Korea, and China. He also quipped that “like the rest of the world, we own Sea Limited (SE),” the Southeast Asian gaming and e-commerce giant, joking that it’s a consensus hedge fund favorite.
Compounded at 30% per annum
Prior to converting to a family office,
Druckenmiller ran Duquesne Capital and previously worked with George Soros
Stan Druckenmiller
View Duquesne’s Updated Portfolio on the Next Page
Duquesne Family Office
Q4 2020 www.hedgefundwisdom.com

87
Duquesne Family Office Fourth Quarter 2020 Portfolio:
Q4 2020 www.hedgefundwisdom.com
Continued on next page…
Rank Company Name Ticker Put/Call % of Portfolio Activity Value # of Shares
1 Microsoft Corp. MSFT 15.80% < -1% $586,760,000 2,638,074 2 T-Mobile US Inc TMUS 8.49% +17% $315,358,000 2,338,580 3 Amazon.com Inc. AMZN 7.26% -5% $269,521,000 82,753 4 Starbucks Corp. SBUX 5.70% +35% $211,510,000 1,977,100 5 Freeport-McMoRan FCX 4.40% -1% $163,520,000 6,284,379 6 Palo Alto Networks Inc PANW 4.39% +458% $163,145,000 459,060 7 Sea Ltd ADR SE 4.10% -22% $152,216,000 764,714 8 Penn National Gaming Inc. PENN 3.53% -20% $131,067,000 1,517,501 9 Nuance Communications NUAN 3.46% Unchanged $128,369,000 2,911,525
10 Walt Disney Co DIS 3.34% +378% $123,988,000 684,335 11 Carvana Co CVNA 3.14% +429% $116,412,000 485,981 12 MercadoLibre Inc MELI 2.86% -11% $106,003,000 63,277 13 Reata Pharmaceuticals Inc RETA 2.50% +38% $92,702,000 749,897 14 Barrick Gold Corp GOLD 2.21% -26% $82,164,000 3,606,850 15 NextEra Energy Inc. NEE 1.62% -10% $60,162,000 779,800 16 Cloudflare Inc NET 1.62% +208% $60,097,000 790,848 17 Teck Resources Ltd TECK 1.60% +395% $59,448,000 3,275,350 18 Carnival Corp. CCL 1.54% +32% $57,278,000 2,644,400 19 Cummins Inc CMI 1.34% New $49,808,000 219,320 20 General Electric Co GE 1.27% Unchanged $47,258,000 4,375,778 21 Sunrun Inc RUN 1.24% New $45,897,000 661,535 22 Linde PLC LIN 1.03% New $38,123,000 144,675 23 China A-Shares Fund ASHR 0.99% New $36,691,000 915,910 24 IQVIA Holdings Inc IQV 0.97% +182% $36,188,000 201,977 25 Expedia Group Inc EXPE 0.96% -15% $35,788,000 270,299 26 Alphabet Inc. Class A GOOGL 0.90% -54% $33,342,000 19,024 27 Analog Devices Inc ADI 0.85% +67% $31,515,000 213,328 28 Flextronics International FLEX 0.84% +144% $31,167,000 1,733,430 29 Workday Inc WDAY 0.77% -50% $28,533,000 119,082 30 Smartsheet Inc SMAR 0.75% -62% $27,880,000 402,361 31 Semiconductor ETF SMH 0.73% New $27,062,000 123,900 32 New York Times Co NYT 0.72% New $26,566,000 513,150 33 AbCellera Biologics Inc. ABCL 0.72% New $26,548,000 659,750 34 Alcoa Corp AA 0.68% New $25,401,000 1,102,000 35 First Solar Inc FSLR 0.62% New $22,851,000 231,000 36 Array Technologies, Inc. ARRY 0.60% New $22,357,000 518,250 37 Formula 1 FWONK 0.56% New $20,695,000 485,800 38 Elanco Animal Health Inc ELAN 0.52% New $19,137,000 623,975 39 JD.com Inc ADR JD 0.49% -87% $18,047,000 205,313 40 BioMarin Pharmaceutical BMRN 0.46% Unchanged $16,898,000 192,700 41 Crowdstrike Holdings Inc CRWD 0.45% New $16,586,000 78,304 42 Uber Technologies Inc UBER 0.44% +19% $16,405,000 321,675 43 Live Nation Entertainment LYV 0.42% -56% $15,750,000 214,350 44 PayPal Holdings Inc PYPL 0.42% -52% $15,735,000 67,188 45 Fastly Inc FSLY 0.37% -13% $13,724,000 157,078

88
Duquesne Family Office Fourth Quarter 2020 Portfolio:
Q4 2020 www.hedgefundwisdom.com
Next: Investment Thesis Summaries
Rank Company Name Ticker Put/Call % of Portfolio Activity Value # of Shares
46 CyberArk Software Ltd CYBR 0.37% New $13,568,000 83,965 47 Dish Network Corp DISH CALL 0.33% New $12,147,000 375,600 48 Companhia Vale de Rio VALE 0.31% New $11,581,000 691,012 49 CanadianNaturalResources CNQ 0.27% New $9,897,000 411,525 50 Hess Corp HES 0.24% New $8,805,000 166,800 51 Arco Platform Ltd ARCE 0.23% +179% $8,392,000 236,460 52 Option Care Health OPCH 0.16% New $6,083,000 388,915 53 US Foods Holding Corp USFD 0.14% New $5,236,000 157,200 54 SailPoint Technologies SAIL 0.13% New $4,685,000 88,005 55 General Electric Co GE CALL 0.12% Unchanged $4,544,000 420,700 56 Vapotherm Inc VAPO 0.06% Unchanged $2,086,000 77,660
Lennar Corp. Class A LEN Sold Gold Miners ETF GDX Sold Carnival Corp. CCL CALL Sold Facebook Inc FB Sold Sony Corp SNE Sold Zai Lab Ltd ZLAB Sold Alnylam Pharmaceuticals ALNY Sold QUALCOMM Inc. QCOM Sold Walt Disney Co DIS CALL Sold U.S. Bancorp USB Sold RegeneronPharmaceuticals REGN Sold TAL Education Group TAL Sold Synchrony Financial SYF Sold Las Vegas Sands Corp LVS Sold SPDR S&P Industrial ETF XLI Sold BeiGene Ltd ADR BGNE Sold D.R. Horton, Inc. DHI Sold JPMorgan Chase & Co JPM Sold Dish Network Corp DISH Sold Verizon Communications VZ Sold Wendys Co WEN Sold Yum! Brands YUM Sold Netflix Inc NFLX Sold Fidelity National Info FIS Sold Alibaba Group BABA Sold Booking Holdings BKNG Sold

89 Q4 2020 www.hedgefundwisdom.com
Investment Thesis Summaries
Overview
These summaries examine what a hedge fund’s potential investment thesis could be. This section focuses on stocks that saw notable hedge fund activity during the quarter.
When presenting an investment idea to a fund manager, an analyst outlines numerous aspects of a thesis.
This section aims to briefly summarize the following bullet points: - Company background - The business model & current situation - The bull case versus the bear case - Market valuation - Potential catalysts - Hedge fund activity in the stock
- Credit Acceptance Corp (CACC): Dominant subprime auto lender with unique business model because of its loan structuring, could benefit from the current environment as weaker competitors fold. On the other hand, investors are wary of consumer-protection lawsuits against the Company related to underwriting and collection practices. - Advantage Solutions (ADV): Given SPACs are all the rage, here’s a glance at one some hedge funds have dipped their toes in. ADV is a consumer packaged goods (CPG) sales & marketing agency that went public through a SPAC merger at a $5.2 billion enterprise value at 10x 2021 adjusted EBITDA. Private equity sponsors bought the company back in 2014 for $4.2 billion. The SPAC and company sponsors re-upped on the deal and the price is still trading at the same $10 level per share.
Featured In This Issue
Next: Credit Acceptance Corp (CACC)

90
Q4 2020 www.hedgefundwisdom.com
Investment Thesis Summary Credit Acceptance (CACC)
In the fourth quarter, Glenn Greenberg’s Brave Warrior Advisors ramped up its exposure to Credit
Acceptance Corp (CACC) by 221% to a 6% portfolio position worth $160 million. Ruane, Cunniff & Goldfarb (Sequoia Fund) also bought a little over 300,000 shares making it a 6% portfolio position worth $550 million.
Conversely, Steve Eisman (who previously successfully bet against subprime mortgages and was
featured in The Big Short) last month on Bloomberg said CACC was his biggest short position and he thinks they’ll see a regulatory crackdown, citing the complaint by the Massachusetts Attorney General.
Hedge Fund Activity
Company Background
CACC is an auto lender that enables deep subprime borrowers to buy cars from used-car dealerships. It was founded in 1972 by Donald Foss, who was one of the largest used-car dealers of the time, and IPO’d in 1992. ‘Deep subprime’ refers to borrowers with credit score below 580 and accounts for ~4% of the total market of car loans. Specialty finance companies like CACC and “buy-here, pay-here” dealers (those extending their own credit) are often the only available options for this market segment. Since financing is a commodity product, the winners are the companies that can forecast delinquencies (thus pricing their loans more accurately) and companies with cheaper access to capital (so scale plays a role). Regarding the former, many companies have historically been attracted to subprime lending due to the high rates, but being aggressive and mispricing their loans translated into rapid growth and eventual bankruptcies. The Company distributes its financing programs through a national network of auto dealer-partners. The big value proposition to these auto dealers is that with CACC they can sell cars to customers who have no other financing options. So with CACC, they don’t lose the sale due to a customer’s poor or non-existent credit score. Following its IPO, the Company grew very aggressively, adding lots of dealers to its programs, and underwriting big loan volumes. Towards the end of the 1990s though, management, auditors, regulators, and investors realized that CACC was operating with an unsustainable business model.
Background (Continued)

91
Especially after 1995, it appeared that its loans were largely unprofitable so it spent years cleaning up its books and paring down its dealer relationships going from >5,000 dealers down to almost 1,000. The Company faced very high competition from other subprime auto lenders who in the late 90s went bankrupt themselves, but CACC was one of the industry survivors. In the early 2000s, the Company dealt with repeated restatements and audit issues, culminating in the stock’s delisting in 2004 as it was unable to file with the SEC in time, and was relisted on the Nasdaq in 2006. Then during the financial crisis, the Company struggled to finance and securitize its loan programs as it faced downgrades and banks pulled the warehouse lines. As a result of the crisis and financing issues, loan volumes went down while losses grew. However, eventually the government stepped in with the TALF program that stabilized the situation. In 2010, realizing its vulnerability and need to access capital more readily, CACC started becoming more investor friendly and held its first quarterly earnings call.
‘Last Ditch Solution’ Anecdotally, many dealers consider CACC as the ‘last ditch solution’ and mainly use its programs if there’s no alternative to making the sale. Since CACC’s programs still give them a small profit on day 1 of the sale, it’s better than nothing. Nevertheless, CACC’s programs are fairly complicated and many dealers don’t understand them very well, which may be one reason why the average volume per dealer has been trending downwards, as dealers get access to more straightforward and competitive programs. A unique characteristic of CACC as an auto lender is its Portfolio program, which accounts for ⅔ of its loan book. The Portfolio loan program is a great way for the Company to mitigate the risk of loss on subprime auto loans, align the interest of the auto dealer to that of the Company, and alleviate regulatory concerns around predatory lending practices (i.e. giving loans to borrowers who can’t afford them, similar to what happened during the financial crisis with mortgages).
Company Background (Continued)
Investment Thesis Summary Credit Acceptance (CACC)
Q4 2020 www.hedgefundwisdom.com
Business Model / How It Works
92
How It Works
Once a dealer closes a sale, the customer puts down a deposit (typically around 20%), and CACC sends an advance to the dealer (somewhere around ½ to ⅔ of the loan principal). The deposit+advance are enough for the dealer to make a small profit on the sale on day 1, but is smaller than with traditional outright loans. CACC then services the loan. And CACC can help mitigate its risk by changing the advance rate it pays dealers depending how risky the borrower is. When a customer makes a loan payment, CACC keeps approximately 20% of the payment as a servicing fee, then uses the remaining payment to pay down its own advance to the dealer. Once the advance has been repaid, any further cashflows - net of servicing fees and other costs - go to the dealer. So effectively CACC gives a loan to the Dealer (the advance) in exchange for servicing that loan. The advance is also collateralized not by a single car but rather it goes into a pool of at least 50 other such car loans and is cross-collateralized.
Benefit to CACC
With this program, CACC is effectively lending money to the dealer in order to close more sales, and the dealer is more directly aligned with CACC. Unlike a typical loan where the dealer would be incentivized to go for volume since there’s no repercussion based on the performance of the loan, in this case there is. The dealer is exchanging upfront profits for future profits, assuming they made a good sale. That means smaller risk exposure and lower losses for CACC, and better underwriting so regulators are satisfied that customers aren’t taken advantage of with loose lending practices. The unit economics - especially in conjunction with the lower losses - are compelling for CACC. This is considered a very defensible competitive advantage that’s built into the Company’s business model. Competitors and new entrants have tried to replicate the model but haven’t succeeded, in large part because dealers need to really trust their financing partner in order to execute such a strategy. CACC has the network, history, and capital to deliver such a program successfully.
Business Model / How It Works
Investment Thesis Summary Credit Acceptance (CACC)
Q4 2020 www.hedgefundwisdom.com
Questionable Tactics / Criticism

93
Companies dealing with deep subprime borrowers are notorious for their predatory and misleading practices. For example, an auto lender can push a borrower who clearly can’t afford a car to buy the car, inflate the car’s price and hide finance fees in the purchase price, and then garnish their wages and tax refunds if they stop paying. The business model can quickly devolve into one where a company uses vehicles with 100,000 miles on them and very little value as a way to extract much more cash from buyers. Some bearish investors have highlighted that CACC is repossessing the vehicles attached to more than ⅓ of its loans and is using very aggressive - and, they argue, potentially illegal - practices in order to boost profits. There are many tactics dealers and lenders have used in the past to take advantage of borrowers. CACC and others in the industry have come under scrutiny due to practices such as:
1. Advising dealers to advertise the downpayment on the car, obscuring the true price of the car. For example, a car that would be listed for $15,000 might be advertised for $3,000 (just the downpayment) to entice borrowers.
2. Some dealers have been known to change the retail price of the car depending on the borrower and the financing available. This is a way for them to hide finance charges. However, under the Truth in Lending Act, lenders can change the interest rate on a loan to account for the borrower’s credit risk but are not allowed to adjust the price.
3. Also, due to the poor condition of the used cars, borrowers are often strongly encouraged to purchase Vehicle Service Contracts (VSC) to protect them from their car breaking down. However, these contracts are very profitable for both the dealer and CACC so they’re often seen as a veiled price increase. What’s worse, many of these VSCs have been reported to be very difficult to use and can go un-honored for a variety of reasons ranging from deceptive practices to criminal 3rd party insurance underwriters.
CACC’s mantra is to give borrowers a second chance (for example, by helping people who otherwise can’t afford a car but need one in order to get to a job). Many critics have taken issue with the Company’s “mission” because of the high rates it charges, often up to 24% where allowed.
Unintended Consequences CACC rates dealers on a rating from 1 to 6. The better-rated dealers will get a higher advance on their
loans, so they’re incentivized to underwrite good loans. One of the factors that determines their rating is the payout of a VSC contract. High payouts would indicate that the dealer is underwriting loans on bad vehicles that break down easily. So in order to protect their rating, an unintended consequence is that they do everything possible to deny claims. Even though CACC itself doesn’t do anything to make it impossible for car owners to get their cars fixed (despite having a VSC), it indirectly incentivizes others to do so.
Questionable Tactics / Criticism
Investment Thesis Summary Credit Acceptance (CACC)
Q4 2020 www.hedgefundwisdom.com
CECL Accounting

94
In August 2018, the Financial Accounting Standards Board (FASB) announced a change in the accounting for loan loss provisions. Under the new standard, CACC has to provision for a loan’s entire expected loss upon putting the loan on its books. The result is that provisions are frontloaded instead of getting realized over time. This new model - called the current expected credit loss (“CECL”) model - went in effect on January 1, 2020. Even though the accounting change doesn’t have a fundamental impact over the long-term economics of a business, it accentuates CACC’s seasonality because Q1 is strongest for new loans, which means that there will be much higher provisions and a negative impact on earnings. Another way to think about it is this: the typical full-loan balance (including stated interest payments) is for $24,000 (against which CACC would advance $10,000 to the dealer under the Portfolio program). The Company estimates to collect ⅔ of that amount over the life of the loan (including all finance charges), or about $16,000. As a result of CECL, CACC needs to recognize the $8,000 difference as a loss as soon as it books the loan. Overall, there’s no impact on profitability over the life of the loan, i.e. nothing changes fundamentally. But it does introduce noise to the income statement and translates into higher capital ratios, effectively increasing the cost to finance these loans. The rationale behind CECL is that it increases the capital requirements for finance companies so there won’t be a situation similar to the Financial Crisis where many companies were deemed under-capitalized. Under the old rules, finance companies had to take provisions only after a threshold of probable losses was passed, and they would provision for losses anticipated in the next 12 months. Whereas now there’s no longer a threshold and the losses are calculated on the life of the loan. That means, provisions jumped in 2020 over prior years. Specifically for CACC, the impact of CECL was that provision for loan losses increased from $76 million in 2019 to $557 million in 2020.
CECL Accounting
Investment Thesis Summary Credit Acceptance (CACC)
Q4 2020 www.hedgefundwisdom.com
Subpoenas & COVID

95
April 23, 2019: The Attorney General of Mississippi filed a complaint alleging that the Company engaged in unfair and deceptive trade practices in subprime auto lending, loan servicing, vehicle repossession and debt collection. May 7, 2019: Received a subpoena from the Consumer Frauds and Protection Bureau (“CFPB”) of the Office of the New York State Attorney General, relating to the Company’s origination and collection policies and procedures in the state of New York. From April 22 to late May, the stock lost almost 10% of its value. COVID-19 Impact: As expected, many dealerships shut down for a couple of months and loan volume was down more than 20% year-over-year for both March and April. But as dealerships started re-opening, volumes jumped by 20% year-over-year the following 2 months, so the volume was simply delayed by a couple of months and there was no material impact. In fact, CACC’s loan growth resumed a more normal trajectory by mid-year. The big fear was that a) loan volume would dry up due to dealership shutdowns, b) borrowers would stop paying triggered by a sharp rise in unemployment, and c) repossession liquidations would yield ever lower recoveries due to a shutdown at auctions and over-supply of repossessed vehicles. But none of these concerns came true and CACC weathered the storm relatively unscathed, likely thanks in large part to stimulus checks and unemployment benefits kicking in. April 3, 2020: Received a subpoena from the Attorney General of the State of Maryland relating to the Company’s origination and collection policies and procedures in the state of Maryland. August 11, 2020: Received a subpoena from the Attorney General of the State of Maryland relating to the Company’s origination and collection policies and procedures, expanding the inquiry to include 40 other states. August 30, 2020: Served with a complaint filed by the Massachusetts Attorney General alleging that the Company engaged in unfair and deceptive trade practices in subprime auto lending, debt collection and asset-backed securitizations - the stock dropped 15%. This is the specific complaint Steve Eisman cited in an interview as providing “a litany of predatory lending practices – the only way to describe it is disgusting.” Before the Pandemic, CACC was trading at $435 in early March 2020. In early April, it hit an intra-day low of $199 but quickly rebounded to $490 by June. Between early August and late September, the stock dropped 40% from $500 to $300. It has since been trading sideways and is currently in the mid-$300s range.
Subpoenas & COVID
Investment Thesis Summary Credit Acceptance (CACC)
Q4 2020 www.hedgefundwisdom.com
Bull Thesis

96
CACC has figured out an ingenious way to offload the majority of the credit risk of lending to deep subprime borrowers back to dealers. CACC’s advance and holdback model could be a competitive advantage, as peers have been unable to replicate this model. That means CACC can withstand economic pressures and mispricing by aggressive lenders who can’t withstand the test of time. And if aggressive competition exits or meets its demise, CACC can gain market share. CACC has demonstrated historically robust loan performance, as well as EPS and share price growth. Management is seen as particularly competent and very good capital allocators. Even though regulatory and political risks are seen as a huge headache, throughout the Company’s history it’s been dealing with these issues without any material impact to the business. Fines and settlements have generally amounted to <1% of revenue industry-wide with very few exceptions, but even in those cases the payments haven’t derailed companies. So bulls argue the issue seems to be more of a headache that creates potential buying opportunities in order to benefit from the cashflows that CACC consistently generates (which could lead to higher prices through EPS increases and share buybacks).
Bull Thesis
Investment Thesis Summary Credit Acceptance (CACC)
Q4 2020 www.hedgefundwisdom.com
Bear Thesis
CACC’s return on capital has steadily decreased over the past ten years after somewhat of a boom (though it has ticked up a bit the past 3-4 years). Not to mention, some other competitors in the field (Consumer Portfolio Services (CPSS), Nicholas Financial (NICK), Santander Consumer (SC)) have seen net charge off ratios almost double over the past 7-8 years. If competition intensifies, this could potentially lead to CACC having to pay higher dealer advances or cede market share if it doesn’t want to be as aggressive. Also noteworthy is the fact that auto loan delinquencies have also been steadily rising over the past decade. Bearish investors view CACC as an immoral company abusing the law system in order to garnish wages from workers, who’ve been manipulated into buying cars they can’t afford, overpaid as finance charges get hidden into inflated car prices, and whose warranties aren’t honored. Then, they’re subjected to aggressive debt collection / robocall and repossession practices if they don’t pay. This has resulted in state and CFPB complaints that are piling up and bears argue that at some point the law and regulators will catch up to CACC’s shady practices. But even if there aren’t extreme outcomes, it seems plausible they’ll see increased regulatory costs. Steve Eisman (whose biggest short position is CACC) recently said on Bloomberg that, “This is not a short thinking that the company is going to suffer credit losses. It has nothing to do with it. This is a pure regulatory story … There is a potential here for this company to be regulated to a much, much lower level of profitability at the very least.”
Summary

97
A big concern is the economic downturn that has disproportionately impacted lower income households and its potential impact to the subprime market. If deep subprime borrowers don’t have a job and are forced to stop payments, CACC will repossess the vehicles but the value of a used car at auction doesn’t cover but a fraction of its exposure. Some investors frame CACC’s operations as essentially a debt collection agency with lawyers who try to garnish wages. A prolonged economic downturn could make CACC’s collection practices more challenging. However, the government seems determined to support the economy via both monetary and fiscal policy, so betting against CACC in a way would be equivalent to fighting the Fed. In fact, the negative economic conditions in the short term could prove to be a long-term benefit for CACC if it means that weaker competitors might be forced to throw in the towel. The biggest near-term issue seems to be regulatory and political, though it’s hard to say that regulations will aim to materially curb lending to the deep subprime market. CACC is seen as the lender of last resort and challenging its operations would leave a lot of borrowers without any financing alternatives. So funds like Brave Warrior and Sequoia utilized the subpoena-related share weakness to boost their positions.
Summary
Investment Thesis Summary Credit Acceptance (CACC)
Q4 2020 www.hedgefundwisdom.com
Next: Advantage Solutions (ADV)

98
Q4 2020 www.hedgefundwisdom.com
Investment Thesis Summary Advantage Solutions (ADV)
LA-based private equity firm Leonard Green & Partners reported a 3% portfolio position worth $200
million that makes it a 5% owner. Baupost Group started a $160 million position that makes it a 4% owner. Prentice Capital started a 13% portfolio position worth $50 million, Senator Investment Group started a 1.2% position, while Bain Capital registered a 1.4% portfolio position. Alyeska Investment Group and Scoggin Management also show increased stakes. Leonard Green and Bain Capital were original sponsors of Advantage Solutions whereas new institutional investors likely came in through the PIPE (private investment in public equity) related to the SPAC (special purpose acquisition company) merger that took Advantage Solutions public.
Hedge Fund Activity
ADV is an agency with $3.5 billion in sales that works with >3,500 consumer product manufacturers, who outsource some of their sales and marketing functions to the company. In effect, the Company functions as an intermediary between brands and retailers. In 2014, ADV was bought by Leonard Green & Partners and CVC Capital Partners for $4.2 billion. The Company actually filed for an IPO in May 2017 when it had $2.1 billion in sales and $31 million in net income, but the filing never became effective. ADV helps consumer brands pitch and sell to retailers, manage relationships with retailers’ headquarters, monitor in-store promotions, implement in-store sampling at-scale, and leverage analytics to influence consumer buying decisions. The Sales segment accounts for approximately half of total revenue, though in 2020 COVID-19 impacted the Marketing segment’s revenue much more. In some quarters, Marketing revenue (in large part in-store sampling and other experiences) dropped by almost half as a result of retail location closures.
Company Background
Business Profile

99
Business Profile
Value Proposition
By centralizing sales and marketing operations across many clients, ADV delivers cost efficiencies to its clients. For example, every month its associates call on 900 retailer HQs and visit 50,000 retail locations to present new products, negotiate placement, shelf-space and promotions, and monitor the execution of promotional plans, etc. ADV’s competitive advantage lies with its long-term relationships with both brands’ and retailers’ key decision makers, and scale efficiencies. (Both of which smaller agencies cannot deliver to their clients.)
Roll-up Strategy
The Company has been growing in large part through the roll-up of smaller regional agencies and scaling up their capabilities nationwide, or even internationally. ADV has the required business relationships, access, scale, and resources to take these agencies to the next level. For example, in 2019 ADV completed 4 acquisitions, in 2018 it did 9 acquisitions, and in 2017 it did 13 acquisitions - all of which were accounted for in portion of the period’s financials. Since 2014, ADV has acquired 63 companies.
Profitability
Excluding a $1.2 billion goodwill impairment in 2018, ADV had approximately $200 million in operating income between 2017 and 2019 that was offset by a similar amount in interest expense, so the operation is fluctuating close to break-even. ADV’s low single-digit profit margin is explained by the low 20% gross margin. The cost of generating sales relates to hiring, training, and compensating the talent that delivers those services. That talent costs 80% of revenue. Then, 10% goes to SG&A and depreciation & amortization. And the remaining 10% covers interest expense. Even though profitability is anemic, the Company is generating cashflow since a big chunk of revenue is eaten up by D&A. On an adjusted basis to exclude impairments, acquisition and other costs that aren’t part of normal operations, ADV generates approximately $500 million in annual EBITDA.
Investment Thesis Summary Advantage Solutions (ADV)
Q4 2020 www.hedgefundwisdom.com
SPAC Merger
100
SPAC Merger
SPAC Merger
Conyers Park (“Conyers”) was a publicly-traded SPAC (a.k.a. blank-check company) that was founded by consumer and finance executives and went public in July 2019 by raising $450 million. On September 8, 2020, it announced the reverse merger of Irvine, CA-based Advantage Solutions, a sales & marketing service provider to consumer goods brands and retailers, at a valuation of $5.2 billion. The deal involved an $855 million private placement @ $10 per share, which included $200 million from existing Advantage Solutions partners like CVC and Bain Capital. The deal closed on October 28, 2020. The enterprise value of $5.2 billion implies a 10x 2021 multiple on adjusted estimated EBITDA of $515 million. Since listing, the Conyers SPAC traded in the range of $10-12 per share, depending on speculation around doing a deal. Right after the deal closed, it dipped to a low of $8 on November 1st. But within a couple of months, it reached a high of $13.50 and currently it trades back down around $10.
Expensive Financing
On October 23, 2020, a Bank of America led group of banks priced a 7-year term loan for Advantage Solutions. The loan was downsized from $1.6 billion to $1.35 billion and the terms were adjusted from Libor + 450 bps with an original issue discount (OID) of 98 to L+525 with a Libor floor of 0.75% and OID of 98. The expected yield to maturity is 6.5%. S&P gave a CCC+ corporate credit rating with positive outlook and is likely to be raised to B.
Investment Thesis Summary Advantage Solutions (ADV)
Q4 2020 www.hedgefundwisdom.com
Bull Thesis
101
Bull Thesis
As the dominant sales & marketing agency for consumer products, bridging brands with retailers, ADV can continue to grow by a) rolling up smaller agencies with unique capabilities that can’t reach scale effectively, thus arbitraging its larger public markets valuation, and b) taking market share from smaller agencies that either can’t deliver the same reach and cost efficiencies or are forced to close due to a COVID-19 related impact on their clients and business. During economic downturns, the dominant players in an industry can win market share and take over sticky clients. Given the type of long-term relationships that ADV has with big brands, these are effectively recurring and predictable revenues. The Company has a solid value proposition for both large and small brands that really need the cost efficiencies in order to remain competitive. The 10x EBITDA multiple sounds expensive but could be justified by the long-term recurring nature of its relationships and the accretive growth from multiple and debt financing arbitrage. As the impact from COVID-19 subsides, demand for ADV’s services will rebound. Also, the whole retail industry has been going through a rapid shift to eCommerce, which needs more technological and analytical capabilities. Larger players like ADV have the resources to either acquire capabilities in that space or develop proprietary solutions and address their clients’ omnichannel needs. With omnichannel becoming more prevalent every day, smaller agencies are unable to compete and will be forced to cede clients to the likes of ADV.
Investment Thesis Summary Advantage Solutions (ADV)
Q4 2020 www.hedgefundwisdom.com
Bear Thesis & Summary

102
Bear Thesis
Consumer goods consolidation and retail industry consolidation can put pressure on ADV’s growth and margins as larger companies have buying power and often decide to insource agency capabilities once their scale makes economic sense. Also, the retail industry is evolving rapidly away from in-store sales and experience to online, where ADV isn’t a big player. This may lead to compressed margins as ADV will have to invest more heavily in technology and could see organic revenue growth slow as it loses ground to upstarts with specialty eCommerce offerings.
Investment Thesis Summary Advantage Solutions (ADV)
Q4 2020 www.hedgefundwisdom.com
Summary
At 10x EBITDA it seems expensive but has upside from industry consolidation at lower multiples and by using cheaper debt. The Company’s scale translates to a stronger value proposition and more adaptable capabilities. ADV is a well-positioned industry consolidator but is in a space that’s undergoing a rapid shift to online solutions. The investors who recently got involved in ADV are getting in at practically the same price as insiders who have deep consumer goods and retail industry experience. But some of the main questions are how much runway is left on the roll-up front? And can ADV acquire or build out eCommerce offerings quicker than their eCommerce competitors can get scale?

103
Q4 2020 www.hedgefundwisdom.com February 21, 2021
Terms of Use & Publication Information
Copyright © 2021 Hedge Fund Wisdom LLC. All Rights Reserved. The U.S. Copyright Act imposes liability of up to $150,000 for each act of willful infringement of a copyright. All material is copyrighted by Hedge Fund Wisdom LLC, except for some material that is copyrighted by others and cited accordingly. Copyrighted material may not be copied, reproduced or otherwise used for commercial purposes without the written permission of the copyright holder. This site also contains some trademarks, which may not be appropriated by persons other than the trademark owner and may not be used contrary to trademark law. The information, opinions, and material displayed and presented on HedgeFundWisdom.com and in the Hedge Fund Wisdom newsletter (collectively referred to herein as “HFW”) are provided for informational purposes only and are not to be used as or considered an offer or a solicitation to sell or buy securities, investment products, or other financial instruments, nor to constitute any advice or recommendation with respect to such securities, investment products, or other financial instruments. The information, opinions, and material displayed and presented by HFW are prepared for subscription without regard to the specific investment objectives, financial situation, and particular needs of any individual person or corporate entity who may receive or view this information. Before making any investments or entering into any transaction in relation to any securities mentioned or referenced by HFW, you agree to independently evaluate an investment and/or consult an independent financial adviser who is licensed and registered in both the jurisdiction where you reside and the jurisdiction in which said securities are being offered. Failure to do so is in violation of the Terms of Use of HFW and thereby releases HFW from any and all liability. In preparation of the materials and newsletters offered by HFW, every effort has been made to offer the most current, correct, and clearly expressed information possible. However, inadvertent errors in information may occur and information may become outdated. These errors may include but are not limited to typographical errors and accuracy or timeliness of the information that may be contained on the pages. HFW also reserves the right to make changes at any time without notice. HFW reserves the right to cancel subscriptions at any time at its sole discretion. Members whose subscriptions are canceled will be refunded the pro-rated remainder of their subscription payment. The employees, members, principals, and contractors of HFW invest in a variety of securities including but not limited to common stock and other equity, bonds, limited partnerships, derivatives, options, and hedge funds. HFW’s employees, members, principals, and contractors may be long or short a security at any time, and said positions change frequently without notice. By using HFW’s website or newsletter, you agree to make your own independent financial decisions based on your opinion and/or the opinion of your financial advisor(s) notwithstanding the personal investment positions of any employees, members, principals, and contractors of HFW. The information and data included in HFW have been compiled from a variety of sources and are subject to change without notice. HFW makes no warranties or representations whatsoever regarding the quality, content, completeness, or adequacy of such information and data. If misleading, inaccurate or otherwise inappropriate information is brought to our attention, a reasonable effort will be made to fix or remove it. Please contact us at [email protected] with any concerns. Documents and materials on HFW’s website and this publication may provide access to the World Wide Web. Because HFW connects to the Internet, once you leave the site, we cannot control the information you access. HFW links to external websites in the hope that users will find reference material on related subjects. HFW does not control those sites and is not responsible for the content included in them, including but not limited to any subsequent links contained within a linked site, or any changes or updates to a linked site. Each individual site has its own set of policies about what information is appropriate for public access. HFW is not responsible for any information or material located at any site other than www.hedgefundwisdom.com. HFW makes no representations or warranties regarding the condition or functionality of the website, its suitability for use, or that this web service will be uninterrupted or error-free. By using HFW, you assume all risks associated with the use of this site and publication including any risk to your computer, software or data being damaged by any virus, software, or any other file that might be transmitted or activated via an HFW web page or your access to it. HFW shall not be liable for any damages of any kind (general, special, incidental or consequential damages, including but in no way limited to lost revenues or lost profits) resulting from the use or misuse of the information contained in HFW’s web pages and publication. Reference herein to any specific commercial product, process, or service by trade name, trademark, manufacturer, or otherwise, does not necessarily constitute or imply endorsement, recommendation, or favoring by HFW. The views and opinions of authors expressed herein do not necessarily state or reflect those of HFW, and shall not be used for advertising or product endorsement purposes.