hedge fund capital group - trend following
TRANSCRIPT

Hed
ge F
und
Cap
ital G
roup
Glo
bal M
arke
ts
July 2005
Global Markets
2005 Alternative Investment Survey
Deutsche Bank’s 2005 Alternative Investment Survey is the largest comprehensive hedge fund investor survey in the industry. This year we polled over 1000 representatives from 650 different investment firms. These 650 investors represent $645 billion dollars in direct hedge fund assets which we estimate is nearly two-thirds of the trillion dollars invested in the hedge fund industry.
John Dyment Jon Olstein Annalisa Jones (1) 212 250 3130 (1) 212 250 0683 (1) 212 250 [email protected] [email protected] [email protected]
This report was prepared by Deutsche Bank’s Hedge Fund Capital Group.For addtional copies of this survey, please send a request to:
Hedge Fund Capital Group
© Copyright Deutsche Bank 2005
Contents
Investor Characteristics . . . . . . . . . . . . . . . . . . . . . . . . 1
Allocations . . . . . . . . . . . . . . . . . . . . . . . . . . . . . . . . 11
Conclusions . . . . . . . . . . . . . . . . . . . . . . . . . . . . . . . 29
Investor Characteristics
Page 1
July 2005

Page 2
Global Markets July 2005
Over 1,000 representatives from 650 firms completed the 2005 Deutsche Bank Alternative Investment Survey. These 650 investors represent $645 billion dollars in direct hedge fund assets, which we estimate is nearly two-thirds of all assets in the hedge fund industry.
We asked each respondent to categorize themselves as a fund of funds, bank, corporation, consultant, insurance company, pension, endowment, foundation, family office or high net worth individual. We received responses from all these investor types, with a particularly strong showing from pensions, endowments and foundations, comprising 18% of respondents. Family offices and high net worth individuals are also well represented, at 15%. Funds of funds represent the largest group, with 43% of all responses [see Chart 1].
We polled investors from all over the world, with roughly half from the United States and more than a third from Europe [not shown in chart].
Introduction
Endowments,
Foundations
7%
Consultants
2%
Funds of funds
43%Banks
9%
Corporations
4%
Other
6%
Pensions
11%
Insurance
Companies
3%
Family
Offices/High Net
Worth Individuals
15%
Chart 1. Respondents by Type
0 to 5 Years
43%
More than 10
Years
28%
6 to 10 Years
29%
Chart 2. Years In Hedge Fund Investing 2005Experience
Most of our respondents have signifi cant experience investing in hedge funds. Over the last two surveys close to 60% of our re-spondents reported having over 5 years of experience [Chart 2].
Source: 2005 Deutsche Bank Alternative Investment Survey
Source: 2005 Deutsche Bank Alternative Investment Survey

Page 3
July 2005
0%
5%
10%
15%
20%
25%
Less than $25
Million
$25-100 Million $101-200 Million $201-500 Million $501-999 Million $1-5 Billion More than $5
Billion
0 to 5 Years 6 to 10 Years More than 10 Years
Chart 4. Investor Assets Arrayed by Years of Experience in Hedge Fund Investing
Most Experienced
The most experienced investor fi rms tend to be funds of funds and fi rms with more assets under management [as shown in Charts 3 and 4].
Fund of Funds
56%
Bank,
Consultant,
Corporation,
Insurance
13%Pension,
Endowment,
Foundation
6%
Family
Office/High Net
Worth Individual
25%
Chart 3. Where Are the Most Experienced Hedge Fund Investors? (more than 10 years in HF investing)
We also collected responses from firms who do not currently invest in hedge funds. Our non-hedge fund investors include pensions, endowments, foundations, corporations, insurance companies, banks and consultants. Respondents indicate that lack of personnel, knowledge and experience in hedge fund strategies are their primary reasons for avoiding hedge funds as opposed to perceived risk [not shown in chart].
Source: 2005 Deutsche Bank Alternative Investment Survey
Source: 2005 Deutsche Bank Alternative Investment Survey
Page 4
Global Markets July 2005
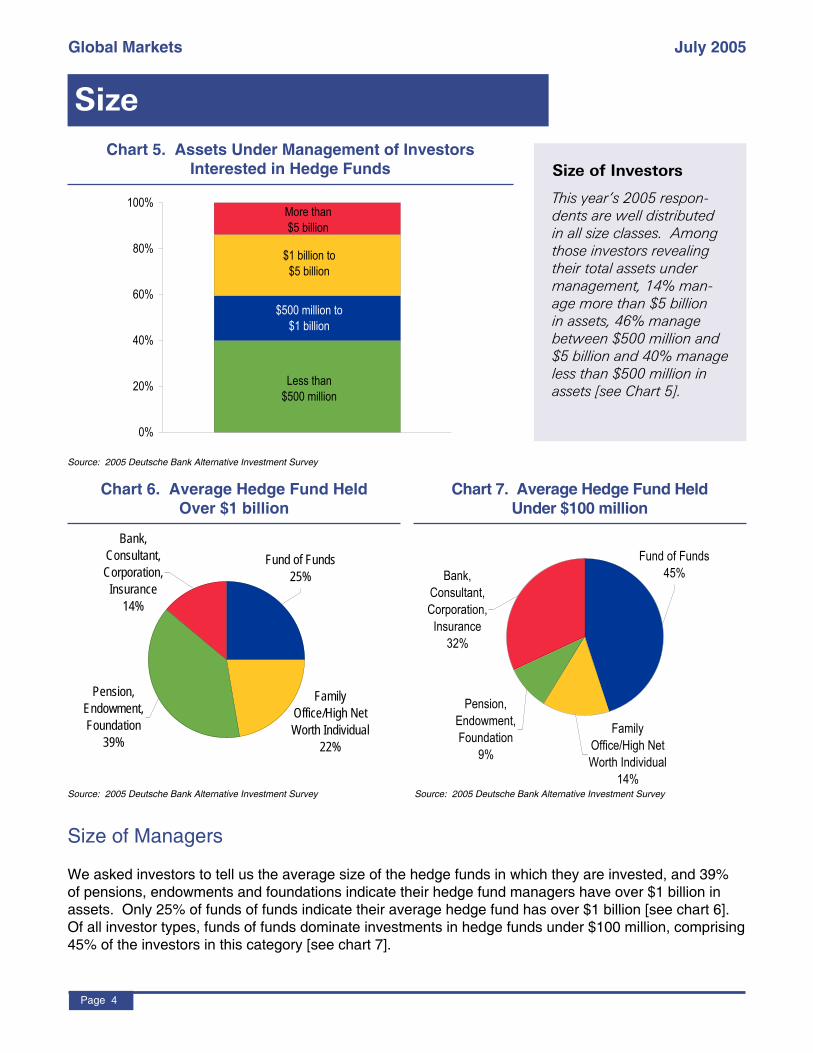
Size of Managers
We asked investors to tell us the average size of the hedge funds in which they are invested, and 39% of pensions, endowments and foundations indicate their hedge fund managers have over $1 billion in assets. Only 25% of funds of funds indicate their average hedge fund has over $1 billion [see chart 6]. Of all investor types, funds of funds dominate investments in hedge funds under $100 million, comprising 45% of the investors in this category [see chart 7].
Size
0%
20%
40%
60%
80%
100%More than
$5 billion
$500 million to
$1 billion
Less than
$500 million
$1 billion to
$5 billion
Chart 5. Assets Under Management of Investors Interested in Hedge Funds Size of Investors
This year’s 2005 respon-dents are well distributed in all size classes. Among those investors revealing their total assets under management, 14% man-age more than $5 billion in assets, 46% manage between $500 million and $5 billion and 40% manage less than $500 million in assets [see Chart 5].
Chart 6. Average Hedge Fund Held Over $1 billion
Fund of Funds
25%
Bank,
Consultant,
Corporation,
Insurance
14%
Pension,
Endowment,
Foundation
39%
Family
Office/High Net
Worth Individual
22%
Chart 7. Average Hedge Fund HeldUnder $100 million
Bank,
Consultant,
Corporation,
Insurance
32%
Fund of Funds
45%
Pension,
Endowment,
Foundation
9%
Family
Office/High Net
Worth Individual
14%
Source: 2005 Deutsche Bank Alternative Investment Survey
Source: 2005 Deutsche Bank Alternative Investment Survey Source: 2005 Deutsche Bank Alternative Investment Survey

Page 5
July 2005
Number and Size of Investments
The largest size investments come from banks, insurance companies, corporations and consultants [see Table 1]. An increasing number of corporations are making significant hedge fund investments as part of their treasury management operations.
The average size investment made directly into hedge fund managers is $19 million [not shown in chart], continuing a trend of year-over-year increases. Banks, consultants, corporations and insurance companies make the largest allocations, averaging more than $26 million per manager. Family offices and high net worth individuals make the smallest allocations, averaging just $11 million per manager [see Table 1].
Pensions, endowments and foundations make fewer allocations annually than other investor types and have fewer hedge funds in their portfolio [see Table 2]. As more hedge fund managers turn toward pensions, endowments and foundations, the competition for these selected few allocations will become more demanding.
Investor Type
Average Size of Allocations in Millions of $
Bank, Consultant, Corporation, Insurance $26
Pension, Endowment, Foundation $25
Fund of Funds $19
Family Office/High Net Worth Individual $11
Investor Type
MedianNumber of
AnnualAllocations
Fund of Funds 15
Bank, Consultant, Corporation, Insurance 12
Family Office/High Net Worth Individual 10
Pension, Endowment, Foundation 4
Table 2. Number of Annual Allocations
Table 1. Average Allocation Size
Page 6
Global Markets July 2005
0%
10%
20%
30%
40%
Less than 5 5-10 allocations 11-20 allocations More than 20
allocations
North America Europe
Chart 8. Number of Annual Allocations(Investor Location)
Source: 2005 Deutsche Bank Alternative Investment Survey
0%
10%
20%
30%
40%
50%
$5 Million or Less $6-10 Million $11-25 Million $26 Million or
More
North America Europe
Chart 9. Average Size of Allocations(Investor Location)
Source: 2005 Deutsche Bank Alternative Investment Survey
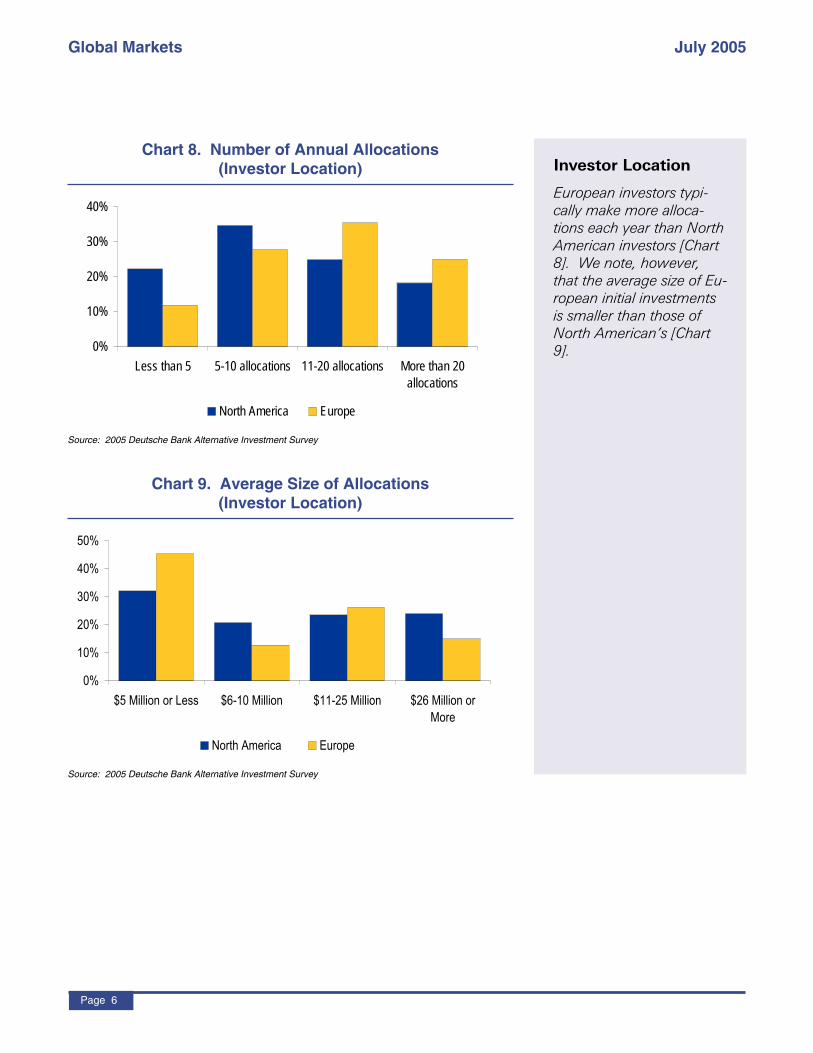
Investor Location
European investors typi-cally make more alloca-tions each year than North American investors [Chart 8]. We note, however, that the average size of Eu-ropean initial investments is smaller than those of North American’s [Chart 9].

Page 7
July 2005
Funds of funds hold the largest number of investments, with 80% invested in more than twenty hedge funds. Pensions, endowments and foundations generally hold the least number of investments, with almost half (46%) invested in five or fewer funds [see Table 3].
Due Diligence Period
The majority of investors report they take less than 6 months to make an investment decision. Even among pensions, which have a reputation for being slower than other investors, 78% claim that after an
initial meeting with a manager, they can make an investment in less than 12 months [Chart 10].
Manager Selection Criteria
For the fourth year, the three “P’s” remain the leading selection criteria for hedge fund managers: Performance, Pedigree, and Philosophy. An emerging criterion for 2005 is Risk Management, with 20% of investors listing this criterion as their second or third selection. Investors indicate Fund Registration is the least important criterion [not shown in chart].
Investor Type
Less than 6 Hedge Funds
6 to 20 HedgeFunds
21 to 100 HedgeFunds
More than 100 Hedge
Funds
Fund of Funds 6% 15% 69% 11%
Family Office/High Net Worth Individual 14% 34% 49% 2%
Pension, Endowment, Foundation 46% 33% 21% 0%
Bank, Consultant, Corporation, Insurance 26% 24% 34% 15%
Table 3. Investment Holdings: Number of Direct Hedge Fund Investments
Chart 10. Duration of the Investment ProcessDue Diligence
Surprisingly, 50% of all pensions, foundations and endowments say they can deploy assets to a new man-ager in under 6 months, the same as the average time a fund of funds says it needs to reach an investment decision and deploy assets [Chart 10].
0%
25%
50%
75%
Less than 6 months 6-12 months 1-2 years More than 2 years
Fund of Funds
Family Office/High Net Worth IndividualPension, Endowment, Foundation
Bank, Consultant, Corporation, Insurance
Source: 2005 Deutsche Bank Alternative Investment Survey
Source: 2005 Deutsche Bank Alternative Investment Survey

Page 8
Global Markets July 2005
Chart 11. Investors Requesting Future Capacity Rights
0%
10%
20%
30%
40%
50%
60%
Fund of Funds Family Office/High
Net Worth
Individual
Pension,
Endowment,
Foundation
Bank, Consultant,
Corporation,
Insurance
Chart 12. What Lock-up is Acceptable?
2 years
11%
3 years
12%
1 year or less
77%
Source: 2005 Deutsche Bank Alternative Investment Survey
Future Capacity
In 2004, 38% of investors indicated they required fu-ture capacity rights in their hedge funds. This year we saw an increase: 45% of all investors indicate they require future capacity rights [not shown in chart] and 55% of funds of funds report they require future capacity rights as terms set when investing [see Chart 11]. We feel this is due to the massive amounts of capital we have seen fl ow into the industry over the last two years.
Lock-ups
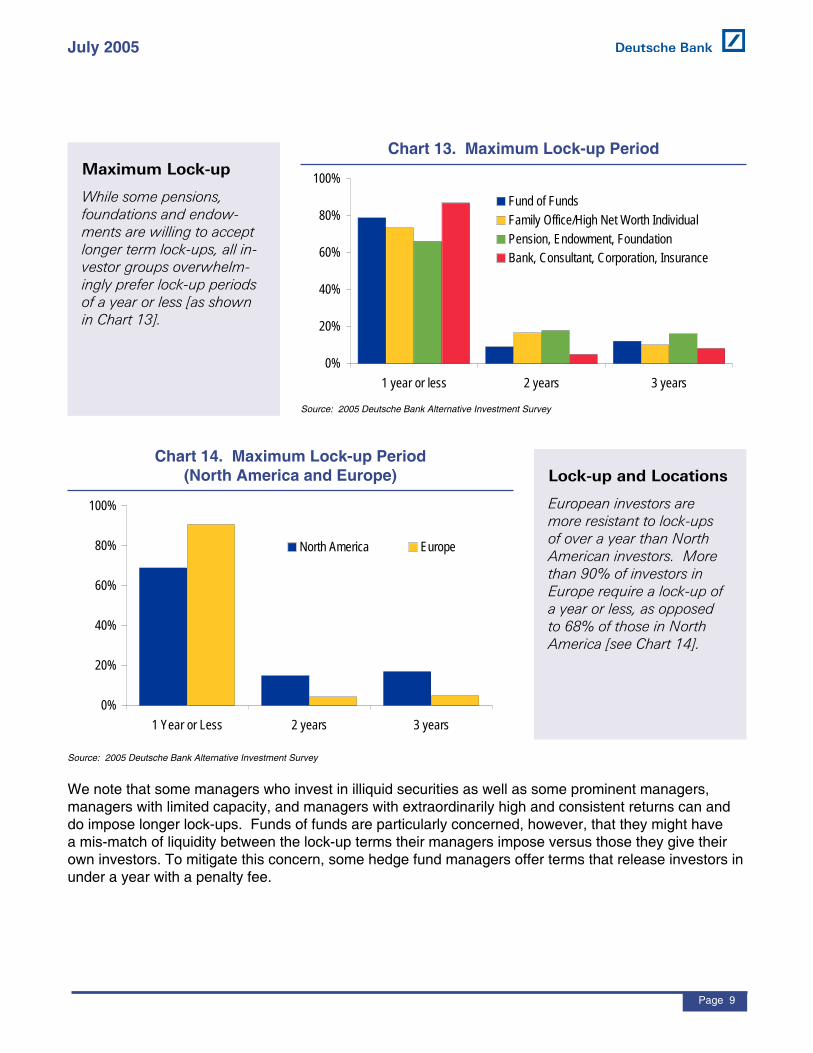
Investors are becoming increasingly resistant to lock-up periods. In 2004, 68% of investors would only invest in managers with lock-ups of one year or less, but in 2005, the number rose to 77% [see Chart 12].
Source: 2005 Deutsche Bank Alternative Investment Survey
Page 9
July 2005
We note that some managers who invest in illiquid securities as well as some prominent managers, managers with limited capacity, and managers with extraordinarily high and consistent returns can and do impose longer lock-ups. Funds of funds are particularly concerned, however, that they might have a mis-match of liquidity between the lock-up terms their managers impose versus those they give their own investors. To mitigate this concern, some hedge fund managers offer terms that release investors in under a year with a penalty fee.
Chart 13. Maximum Lock-up Period
0%
20%
40%
60%
80%
100%
1 year or less 2 years 3 years
Fund of Funds
Family Office/High Net Worth Individual
Pension, Endowment, Foundation
Bank, Consultant, Corporation, Insurance
Chart 14. Maximum Lock-up Period (North America and Europe)
0%
20%
40%
60%
80%
100%
1 Year or Less 2 years 3 years
North America Europe
Maximum Lock-up
While some pensions, foundations and endow-ments are willing to accept longer term lock-ups, all in-vestor groups overwhelm-ingly prefer lock-up periods of a year or less [as shown in Chart 13].
Lock-up and Locations
European investors are more resistant to lock-ups of over a year than North American investors. More than 90% of investors in Europe require a lock-up of a year or less, as opposed to 68% of those in North America [see Chart 14].
Source: 2005 Deutsche Bank Alternative Investment Survey
Source: 2005 Deutsche Bank Alternative Investment Survey

Page 10
Global Markets July 2005
Chart 16. Who Needs Managed or Segregated Accounts?Managed Accounts
In 2004, only 20% of inves-tors indicated they used managed accounts when investing in hedge funds. For those unfamiliar with this term, we refer to a hedge fund’s management of a separate pool of capital for an investor. Managed accounts often have differ-ent terms and conditions than the main fund. This year, we see an increase to 29% of investors using managed accounts [not shown in chart]. The use of managed accounts is highest among foundations (50%) and lowest with insurance companies (10%) [not shown in a chart].
Chart 15. Degree of Transparency Requested
Limited
67%
Full
14%
No transparency
required
19%
Transparency
14% of all investors require full transparency of position level data, and 19% of in-vestors do not require any transparency at all. The remaining investors want some degree of transpar-ency from their managers [as shown in Chart 15].
Transparency may take the form of sector breakdowns, geographic concentrations, top long positions, asset class and security type weightings. This is especially true for investments in Multi-Strategy managers where investors want to know what percentage of the manager’s portfolio is invested in various trading strategies so they can properly understand their overall exposure to these strategies across their entire investment holdings.
Source: 2005 Deutsche Bank Alternative Investment Survey
0%
10%
20%
30%
40%
50%
60%
Require Managed or
Segregated Account
Do not currently require,
but considering in the
future
Do not require
Fund of Funds Family Office/High Net Worth IndividualPension, Endowment, FoundationBank, Consultant, Corporation, Insurance
Source: 2005 Deutsche Bank Alternative Investment Survey

Page 11
July 2005
Allocations
Page 12
Global Markets July 2005
Allocations in 2005
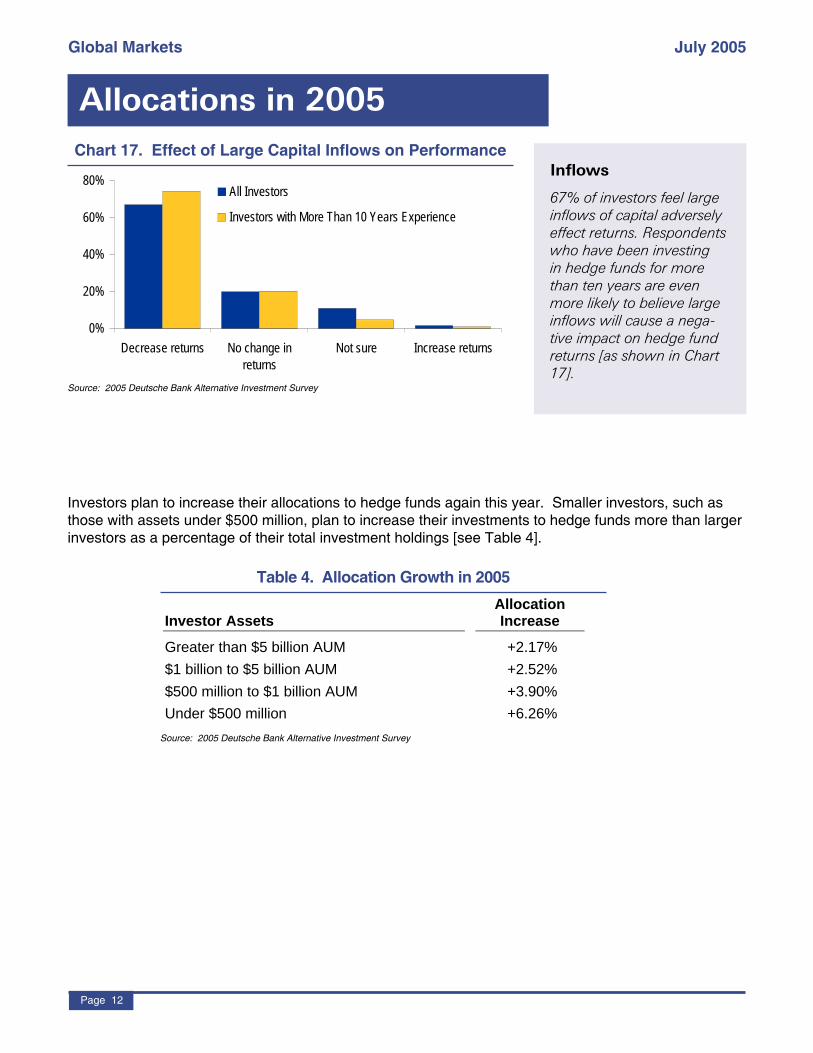
Investors plan to increase their allocations to hedge funds again this year. Smaller investors, such as those with assets under $500 million, plan to increase their investments to hedge funds more than larger investors as a percentage of their total investment holdings [see Table 4].
0%
20%
40%
60%
80%
Decrease returns No change in
returns
Not sure Increase returns
All Investors
Investors with More Than 10 Years Experience
Chart 17. Effect of Large Capital Inflows on Performance
Infl ows
67% of investors feel large infl ows of capital adversely effect returns. Respondents who have been investing in hedge funds for more than ten years are even more likely to believe large infl ows will cause a nega-tive impact on hedge fund returns [as shown in Chart 17].
Investor Assets
Allocation
Increase
Greater than $5 billion AUM +2.17%
$1 billion to $5 billion AUM +2.52%
$500 million to $1 billion AUM +3.90%
Under $500 million +6.26%
Table 4. Allocation Growth in 2005
Source: 2005 Deutsche Bank Alternative Investment Survey
Source: 2005 Deutsche Bank Alternative Investment Survey

Page 13
July 2005
0%
20%
40%
60%
80%
United States Europe Japan Asia excluding
China/Japan
Emerging
markets/Latin
America
China
Bank, Consultant, Corporation, Insurance
Pension, Endowment, Foundation
Family Office/High net worth individual
Fund of funds
Allocations in 2005: RegionsChart 18. Current Regional Exposure in Portfolio*
For the last two years investors have told us that they would be increasing their exposure to European and global managers. This year we see exposure to Europe reaching levels comparable to those of the United States [as shown in Chart 18]. The exception is American pensions, endowments and foundations who favor hedge funds trading in United States securities more than other markets.
Chart 19. Top Predicted Regions in 2005 with Percent of Investors Selecting*
Asia excluding
China and
Japan, 25%
Europe, 23%
United States,
19%
Holdings
We asked investors to which regions they currently have exposure. Approximately 68% of inves-tors polled currently have holdings in managers investing in the US market and 63% in the Eu-ropean market [see Chart 18].
* Columns will not add up to 100% as multiple selections were allowed.
Source: 2005 Deutsche Bank Alternative Investment Survey
* Columns will not add up to 100% as multiple selections were allowed.
Source: 2005 Deutsche Bank Alternative Investment Survey
Performance Predictions
Investors predict Asia, exclud-ing China and Japan, will be the top performing region this year. With investment focus on China over the last few years, investors feel the sur-rounding countries, including India, Korea, and Singapore, will offer greater opportunities in 2005. Europe comes in a close second [see Chart 19].

Page 14
Global Markets July 2005
Investors are acting on their predictions with 73% increasing allocation to Asia excluding China and Japan. 55% of investors will increase allocations to Europe and 26% will increase allocations to the United States [as shown in charts 20, 22 and 24].
Japan ranks high in new investments, even though investors believe the US will outperform Japan in 2005. This may be explained by the relative lack of exposure investors have to the Japanese market. Only 50% of investors have any Japanese hedge fund holdings in their portfolio [as noted in Chart 18]. The following diagram is a snapshot of allocation changes discussed in greater depth over the next few pages.
Diagram 1. Expected Asset Flow Over the Next Six Months Ranked by Investor Response
�� Asia excluding China and Japan
�� Europe
�� Japan
�� Emerging Markets/Latin America
� China
�� United States
KEY
�� 20% or more respondents will increase allocations
� Between 10% and 20% of respondents will increase
allocations
�� Responses included balanced numbers of increases
and decreases of allocation
� Between 10% and 20% of respondents will
decrease allocations
�� 20% or more respondents will decrease allocations
Chart 20. Portfolio Allocation to Asia Excluding China and Japan
Add
73%
Maintain
27%
Reduce
0%
Source: 2005 Deutsche Bank Alternative Investment Survey
Asia excluding China/Japan
As noted earlier in the sur-vey, Asia excluding China and Japan is predicted to be the best performing region in 2005. Three-quar-ters of current investors across all investor types express interest in adding to their exposure and none indicate they will reduce ex-posure [as shown in Chart 20]. In addition, 100% of Asian investors responding to the survey indicate they will increase their Asian allocations [see Chart 21 on next page].

Page 15
July 2005
Chart 21. Portfolio Allocation to AsiaExcluding China and Japan by Investor Location
0%
20%
40%
60%
80%
100%
120%
Add Maintain Reduce
Investors in North America Investors in Europe Investors in Asia/Australia
Chart 22. Portfolio Allocation to Europe
Add
55%
Maintain
44%
Reduce
1%
0%
10%
20%
30%
40%
50%
60%
70%
Add Maintain Reduce
Investors in North America Investors in Europe
Europe
For the third consecutive year, investors express interest in increasing Eu-ropean exposure. 23% of investors rank Europe as a top performer in 2005 [Chart 19] and 55% indi-cate they will be increas-ing their exposure to this region [Chart 22]. Inves-tors across all categories are interested in Europe, but there is particularly strong interest from North American investors [see Chart 23].
Source: 2005 Deutsche Bank Alternative Investment Survey
Source: 2005 Deutsche Bank Alternative Investment Survey
Source: 2005 Deutsche Bank Alternative Investment Survey
Chart 23. Portfolio Allocation to Europeby Investor Location

Page 16
Global Markets July 2005
Add
26%
Maintain
51%
Reduce
23%
Chart 24. Portfolio Allocation to United States
Chart 25. Portfolio Allocation to United Statesby Investor Location
0%
10%
20%
30%
40%
50%
60%
70%
Add Maintain Reduce
Investors in North America Investors in Europe
Source: 2005 Deutsche Bank Alternative Investment Survey
Source: 2005 Deutsche Bank Alternative Investment Survey
United States
51% of investors indicate they will maintain their present weighting in the United States [as shown in Chart 24]. There is more than twice as much interest from North American investors to in-crease their United States allocations (34%) than from European investors (16%) [Chart 25]. But overall, those increasing and those decreasing their exposure are fairly evenly balanced, resulting in no material change in the number of investors allocating to this region [Chart 24].

Page 17
July 2005
0%
20%
40%
60%
80%
Long
/shor
t equ
ity
Event
drive
n
Multi-s
trateg
y
Distre
ssed
Conve
rtible
arbit
rage
Mac
ro
Fixed i
ncom
e
Capita
l stru
cture
arbit
rage
Credit
long
/shor
t
Emergin
g mar
kets
Merge
r arbit
rage
Marke
t neu
tral
Statist
ical a
rbitra
ge
Volatili
ty
Mortga
ge ba
cked
secu
rities
CDO
Bank, Consultant, Corporation, Insurance
Pension, Endowment, Foundation
Family Office/High Net Worth Individual
Fund of Funds
Allocations in 2005: StrategiesChart 26. Current Strategies in Portfolio*
Respondents report current investments in a wide variety of hedge fund strategies. The strategies with the deepest penetration from investors are Long/Short Equity, Event Driven and Multi-strategy.
Chart 27. Top Predicted Strategies in 2005 With Percent of Investors Selecting*
Long/Short, 35%
Macro, 22%
Multi-Strategy, 16%
* Columns will not add up to 100% as multiple selections were allowed.
Source: 2005 Deutsche Bank Alternative Investment Survey
Holdings
We asked investors which strategies they currently hold in their portfo-lios [as shown in Chart 26]. Approximately 68% of inves-tors polled currently have allocations to Long/Short equity manag-ers.
* Columns will not add up to 100% as multiple selections were allowed.
Source: 2005 Deutsche Bank Alternative Investment Survey
Performance Predictions
Each year we ask which strat-egies investors predict will perform best: 35% of inves-tors rank Long/Short Equity as the top performing strategy for 2005. This is the second year Long/Short Equity is among the top three predict-ed best performers. Macro makes its third appearance in the top three with 22% of investors selecting it as a top performer. Rounding out the top three is Multi-strategy, making its fi rst appearance in the top tier this year with 16% of investors selecting it as a top performer [see Chart 27].

Page 18
Global Markets July 2005
In 2005, as in previous surveys, allocations will tend to follow predictions of best strategy. As an example, very few investors believe Convertible Arbitrage will be a top performer in 2005, and thus 44% indicate they will reduce their Convertible Arbitrage holdings this year [as shown in Chart 43 later in this report].
Sometimes, however, investors do not follow their predictions. This year Multi-strategy was a predicted top performer, but more investors indicated they would increase their allocations to Long/Short Equity, Event Driven, Macro and Emerging Markets, than to Multi-strategy. [See Diagram 3].
2004 2005
Diagram 2. Top Predicted Performing StrategiesPredictions
In prior surveys we also asked investors to indicate strategies they believed would perform well. Diagram 2 illustrates the movement of some of the strategies since last year. Note that most strategies retain their relative posi-tion on the list, while a few, like Multi-strategy have taken large leaps.
Source: 2005 Deutsche Bank Alternative Investment Survey

Page 19
July 2005
The following diagram is a snapshot of investor allocation changes discussed in greater depth on the following pages.
�� Long/Short Equity
�� Event Driven
�� Macro
�� Emerging Markets
�� Multi-strategy
�� Credit Long/Short
�� Fixed Income
� Volatility
� Market Neutral
�� Merger Arbitrage
�� Statistical Arbitrage
�� Short Sellers
� Distressed
�� Convertible Arbitrage
Diagram 3. Expected Asset Flow Over the Next Six Months Ranked by Investor Response
KEY
�� 20% or more respondents will increase allocations
� Between 10% and 20% of respondents will increase
allocations
�� Responses included balanced numbers of increases
and decreases of allocation
� Between 10% and 20% of respondents will
decrease allocations
�� 20% or more respondents will decrease allocations
Chart 28. Portfolio Allocation to Long/Short Equity
Add
58%
Maintain
36%
Reduce
6%
Long/Short Equity
Investors predict Long/Short Equity will have the best returns for 2005. 58% of investors indi-cate they will add to the strategy. We note that all categories of investors are universally interested in increasing their alloca-tions to Long/Short Equity managers.Source: 2005 Deutsche Bank Alternative Investment Survey
Source: 2005 Deutsche Bank Alternative Investment Survey
Page 20
Global Markets July 2005
Chart 29. Portfolio Allocation to Macro
Add
59%
Maintain
36%
Reduce
5%
Macro
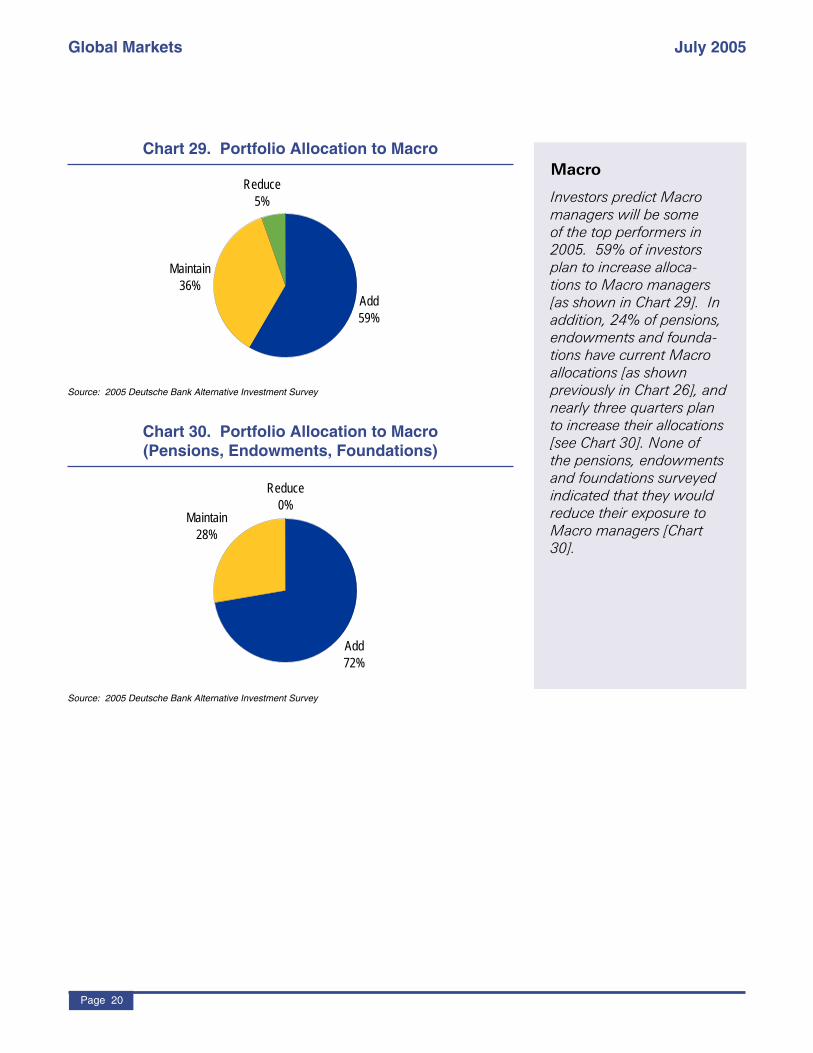
Investors predict Macro managers will be some of the top performers in 2005. 59% of investors plan to increase alloca-tions to Macro managers [as shown in Chart 29]. In addition, 24% of pensions, endowments and founda-tions have current Macro allocations [as shown previously in Chart 26], and nearly three quarters plan to increase their allocations [see Chart 30]. None of the pensions, endowments and foundations surveyed indicated that they would reduce their exposure to Macro managers [Chart 30].
Chart 30. Portfolio Allocation to Macro(Pensions, Endowments, Foundations)
Add
72%
Maintain
28%
Reduce
0%
Source: 2005 Deutsche Bank Alternative Investment Survey
Source: 2005 Deutsche Bank Alternative Investment Survey

Page 21
July 2005
Chart 31. Portfolio Allocation to Multi-Strategy
Maintain
48%
Reduce
12%
Add
40%
Chart 32. Portfolio Allocation to Multi-Strategy
0%
10%
20%
30%
40%
50%
60%
Add Maintain Reduce
Fund of Funds
Family Office/High Net WorthIndividualPension, Endowment,FoundationBank, Consultant, Corporation,Insurance
Multi-strategy
Multi-strategy managers are predicted to perform well in 2005. 40% of inves-tors indicate they will add to managers in this catego-ry while 12% will reduce their allocations [Chart 31].56% of banks, consultants, corporations and insurance companies seek to increase allocations to Multi-strat-egy. Only 26% of family offi ces and high net worth individuals will be increas-ing exposure while 22% of investors in this category will be reducing exposure [see Chart 32]. Many investors told us they prefer Multi-strategy managers over single strategy manag-ers because they can more nimbly allocate capital across different strategies in the current dynamic market environment.
Source: 2005 Deutsche Bank Alternative Investment Survey
Source: 2005 Deutsche Bank Alternative Investment Survey
Page 22
Global Markets July 2005
Chart 34. Portfolio Allocation to Credit Long/Short
Chart 33. Portfolio Allocation to Credit Long/Short
Add
32%
Maintain
55%
Reduce
13%
Credit Long/Short
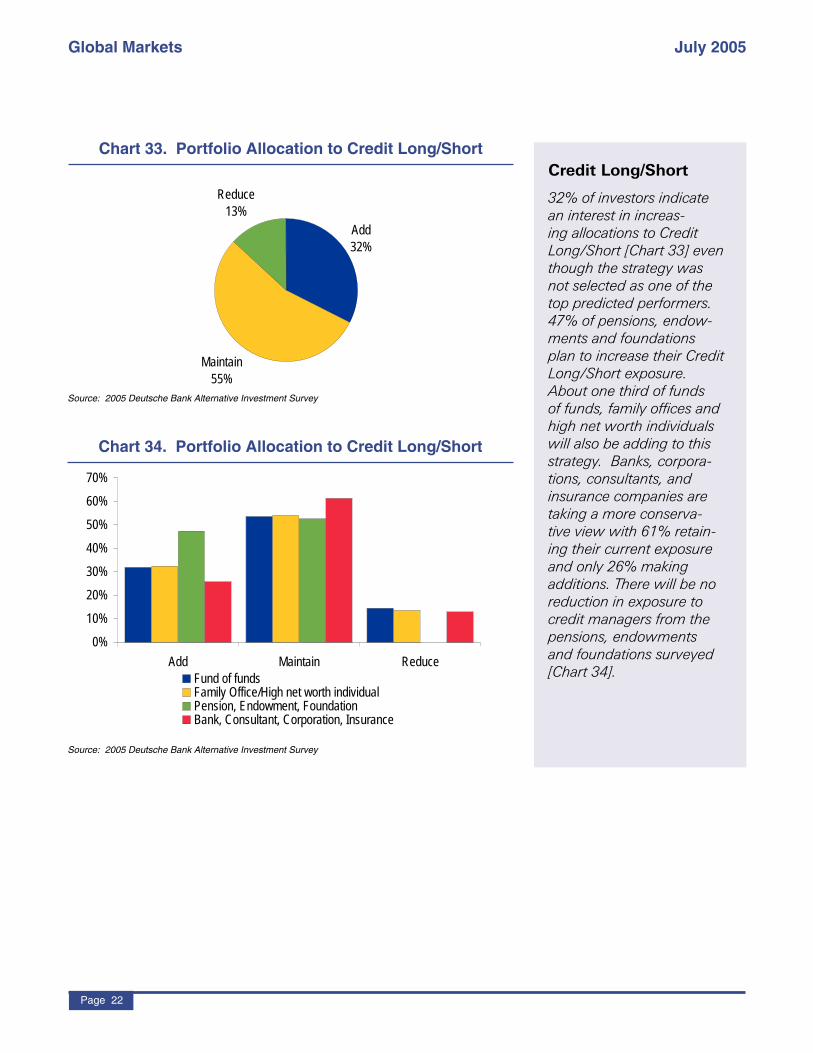
32% of investors indicate an interest in increas-ing allocations to Credit Long/Short [Chart 33] even though the strategy was not selected as one of the top predicted performers. 47% of pensions, endow-ments and foundations plan to increase their Credit Long/Short exposure. About one third of funds of funds, family offi ces and high net worth individuals will also be adding to this strategy. Banks, corpora-tions, consultants, and insurance companies are taking a more conserva-tive view with 61% retain-ing their current exposure and only 26% making additions. There will be no reduction in exposure to credit managers from the pensions, endowments and foundations surveyed [Chart 34].
0%
10%
20%
30%
40%
50%
60%
70%
Add Maintain Reduce
Fund of funds Family Office/High net worth individualPension, Endowment, FoundationBank, Consultant, Corporation, Insurance
Source: 2005 Deutsche Bank Alternative Investment Survey
Source: 2005 Deutsche Bank Alternative Investment Survey
Page 23
July 2005
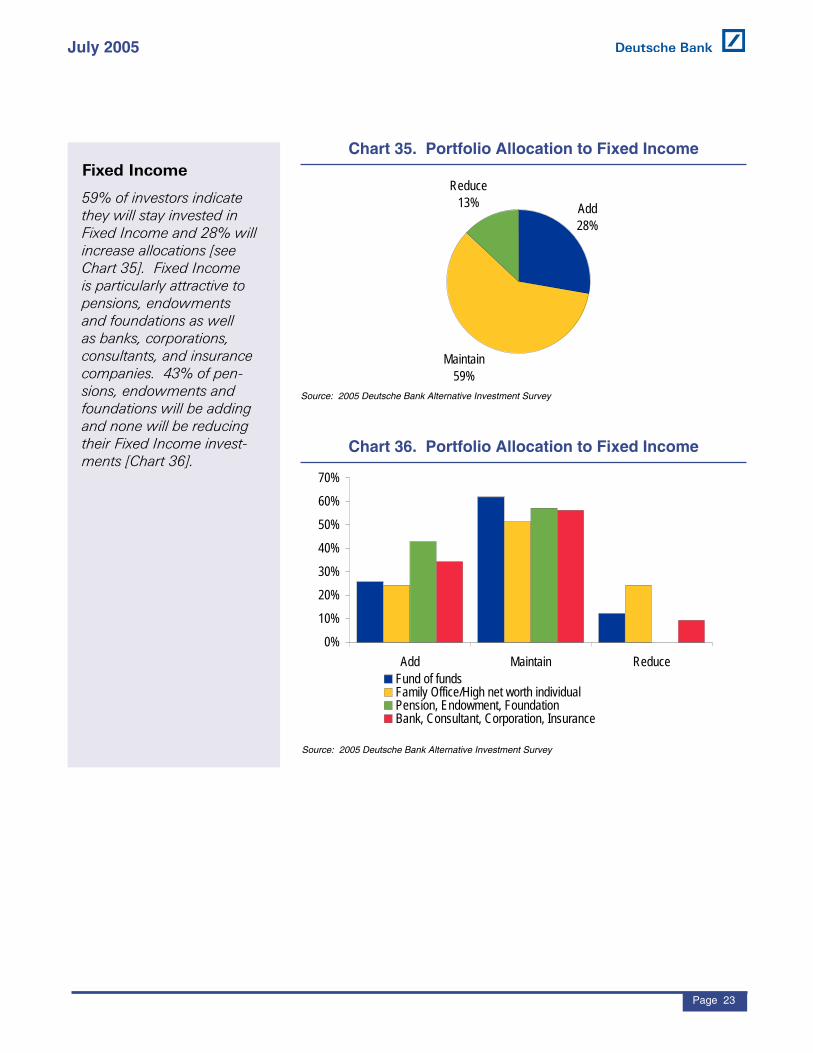
Chart 35. Portfolio Allocation to Fixed Income
Add
28%
Maintain
59%
Reduce
13%
Chart 36. Portfolio Allocation to Fixed Income
0%
10%
20%
30%
40%
50%
60%
70%
Add Maintain Reduce
Fund of funds Family Office/High net worth individualPension, Endowment, FoundationBank, Consultant, Corporation, Insurance
Fixed Income
59% of investors indicate they will stay invested in Fixed Income and 28% will increase allocations [see Chart 35]. Fixed Income is particularly attractive to pensions, endowments and foundations as well as banks, corporations, consultants, and insurance companies. 43% of pen-sions, endowments and foundations will be adding and none will be reducing their Fixed Income invest-ments [Chart 36].
Source: 2005 Deutsche Bank Alternative Investment Survey
Source: 2005 Deutsche Bank Alternative Investment Survey

Page 24
Global Markets July 2005
Chart 37. Portfolio Allocation to Distressed
Add
18%
Maintain
56%
Reduce
26%
Chart 39. Portfolio Allocation to Market Neutral
0%
20%
40%
60%
80%
100%
Add Maintain Reduce
Fund of Funds Family Office/High Net Worth IndividualPension, Endowment, FoundationBank, Consultant, Corporation, Insurance
Chart 38. Portfolio Allocation to Market Neutral
Reduce
10%
Add
28%
Maintain
62%
Distressed
Investors do not believe Distressed will be a top performer in 2005. 26% of investors indicate they will reduce exposure, while only 18% will add. While we see some infl ows and outfl ows, the majority, 56%, will maintain their current allocation level in Distressed funds [Chart 39].
Source: 2005 Deutsche Bank Alternative Investment Survey
Source: 2005 Deutsche Bank Alternative Investment Survey
Source: 2005 Deutsche Bank Alternative Investment Survey
Market Neutral
Market Neutral will see some infl ows, with 28% of investors adding holdings and only 10% reducing [Chart 38]. Family offi ces and high net worth indi-viduals will not be adding to Market Neutral. Instead they will maintain or re-duce their holdings [Chart 39].
Page 25
July 2005
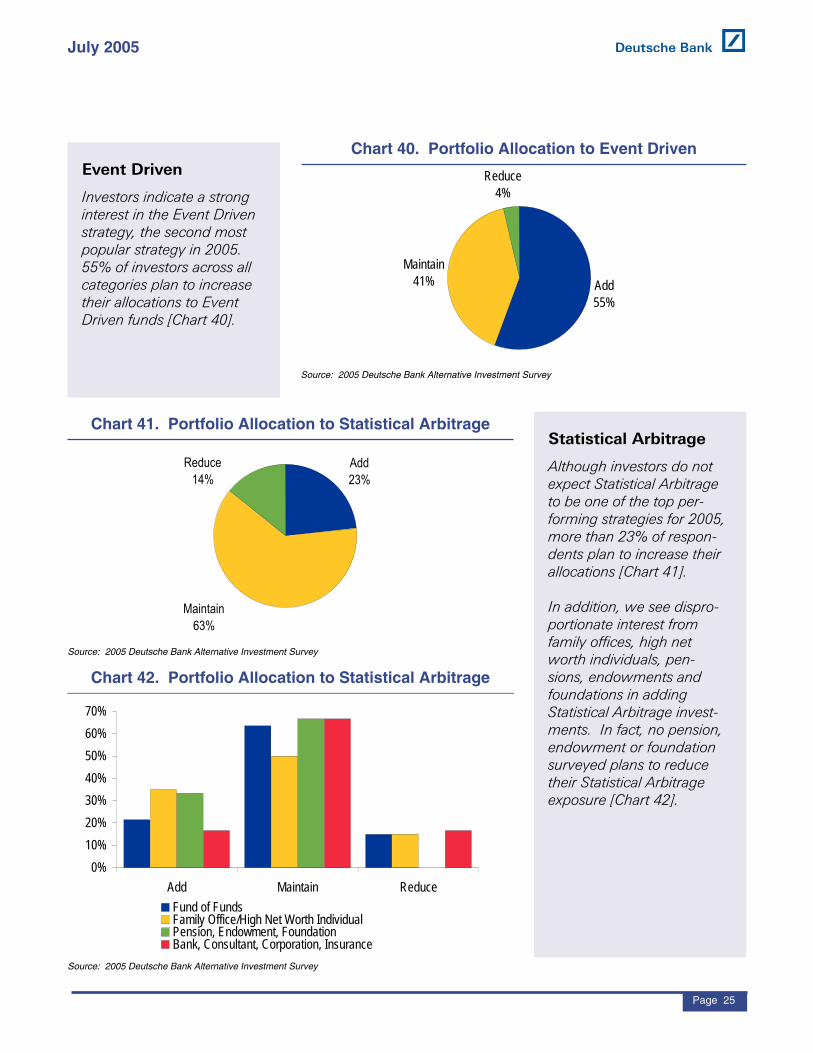
Chart 40. Portfolio Allocation to Event Driven
Add
55%
Maintain
41%
Reduce
4%
Chart 42. Portfolio Allocation to Statistical Arbitrage
0%
10%
20%
30%
40%
50%
60%
70%
Add Maintain Reduce
Fund of Funds Family Office/High Net Worth IndividualPension, Endowment, FoundationBank, Consultant, Corporation, Insurance
Chart 41. Portfolio Allocation to Statistical Arbitrage
Maintain
63%
Add
23%
Reduce
14%
Event Driven
Investors indicate a strong interest in the Event Driven strategy, the second most popular strategy in 2005. 55% of investors across all categories plan to increase their allocations to Event Driven funds [Chart 40].
Source: 2005 Deutsche Bank Alternative Investment Survey
Source: 2005 Deutsche Bank Alternative Investment Survey
Source: 2005 Deutsche Bank Alternative Investment Survey
Statistical Arbitrage
Although investors do not expect Statistical Arbitrage to be one of the top per-forming strategies for 2005, more than 23% of respon-dents plan to increase their allocations [Chart 41].
In addition, we see dispro-portionate interest from family offi ces, high net worth individuals, pen-sions, endowments and foundations in adding Statistical Arbitrage invest-ments. In fact, no pension, endowment or foundation surveyed plans to reduce their Statistical Arbitrage exposure [Chart 42].
Page 26
Global Markets July 2005
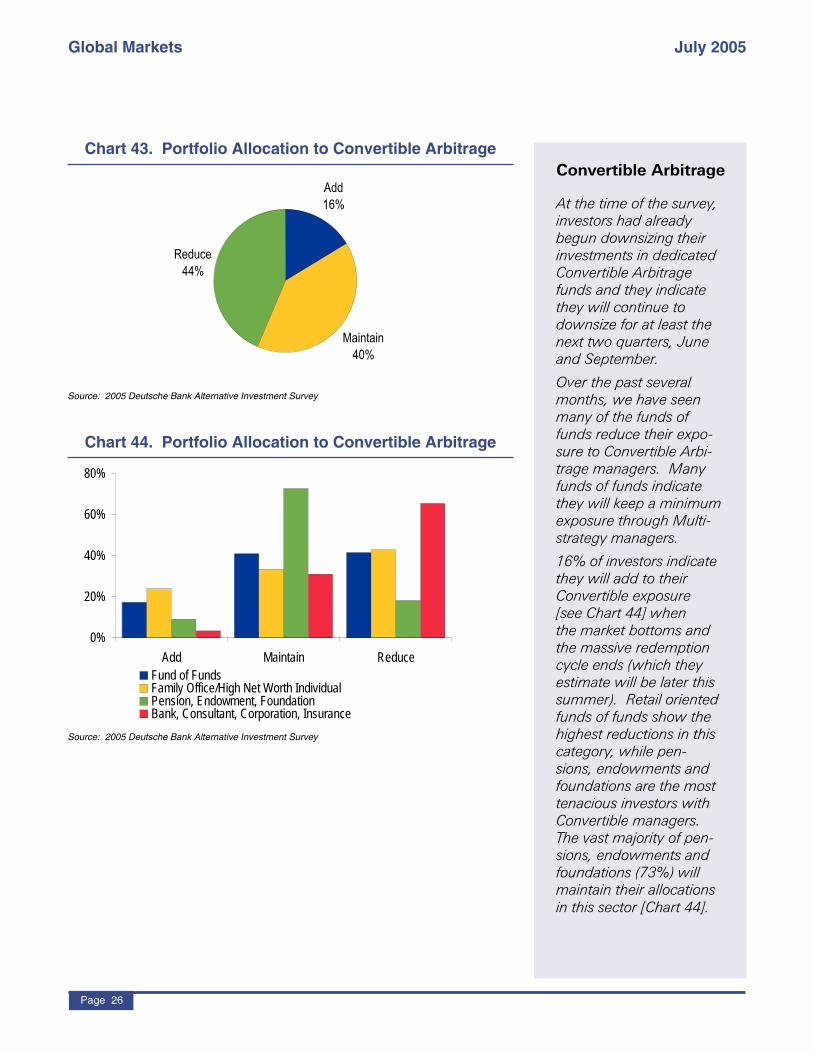
Convertible Arbitrage
At the time of the survey, investors had already begun downsizing their investments in dedicated Convertible Arbitrage funds and they indicate they will continue to downsize for at least the next two quarters, June and September.
Over the past several months, we have seen many of the funds of funds reduce their expo-sure to Convertible Arbi-trage managers. Many funds of funds indicate they will keep a minimum exposure through Multi-strategy managers.
16% of investors indicate they will add to their Convertible exposure [see Chart 44] when the market bottoms and the massive redemption cycle ends (which they estimate will be later this summer). Retail oriented funds of funds show the highest reductions in this category, while pen-sions, endowments and foundations are the most tenacious investors with Convertible managers. The vast majority of pen-sions, endowments and foundations (73%) will maintain their allocations in this sector [Chart 44].
Chart 43. Portfolio Allocation to Convertible Arbitrage
Add
16%
Maintain
40%
Reduce
44%
Chart 44. Portfolio Allocation to Convertible Arbitrage
0%
20%
40%
60%
80%
Add Maintain Reduce
Fund of Funds Family Office/High Net Worth IndividualPension, Endowment, FoundationBank, Consultant, Corporation, Insurance
Source: 2005 Deutsche Bank Alternative Investment Survey
Source: 2005 Deutsche Bank Alternative Investment Survey

Page 27
July 2005
Structured ProductsStrong investor interest in structured products continues [Chart 45]. More than half of investors surveyed are either using structured products or are considering them. The greatest concentration of investors is in enhanced leverage products, followed closely by guaranteed or principally protected products and swaps [Chart 46].
We found funds of funds are almost evenly split between those who use leverage and those who have no plans to employ leverage (41% each). But with 18% of funds of funds interested in applying leverage in the future, this balance may soon change [see Chart 47].
Chart 45. Portfolio Allocation to Structured Products
Do not invest
and do not have
plans to do so
47%Do not currently
invest but will
consider in future
23%
Do invest
30%
Chart 46. Structured Products Presently Used by Hedge Fund Investors
Portable Alpha
Strategies
13%
Swaps
22%
Single manager
structure (versus multi-
manager)
11%
Asset
recharacterization
products (converting
equity-like products to
bond-like products)
6%
Enhanced leverage
products
25%
Guaranteed or
principally protected
products
23%
Do not use
leverage
41%
Do not use
leverage, but
interested in
doing so in future
18%Use leverage
41%
Chart 47. Leveraged Used by Fund of Funds
Source: 2005 Deutsche Bank Alternative Investment Survey
Source: 2005 Deutsche Bank Alternative Investment Survey
Source: 2005 Deutsche Bank Alternative Investment Survey

Page 28
Global Markets July 2005
Conclusions
Page 29
July 2005
The overall health and enthusiasm of the hedge fund industry is not a concern for most investors who took this year’s survey. Many investors are still receiving inflows of capital and allocating this capital to new and existing hedge fund managers.
We note, however, that this year’s investor asset growth has slowed considerably from the record levels we saw in early 2004. Also, some manager strategies (such as Convertible Arbitrage) have experienced significant investor redemptions due to challenging conditions in the first half of 2005.
Allocation trends
This year investors report the average size of an investment into a hedge fund was $19 million, consistent with last year’s survey.
Smaller investors, such as those with assets under $500 million plan to increase their investments to hedge funds more than larger investors as a percentage of their total investments. Investors who have assets greater than $5 billion under management will increase their allocations this year by 2%. Many of these large investors have hundreds of billions of dollars under management and small changes in their asset allocations to hedge funds will continue to have a large effect on overall industry growth.
� 58% of investors indicate they will increase their allocations to Long/Short Equity managers. 55% of
investors plan to increase their allocations to Event Driven funds, and 59% of investors plan to increase
allocations to Macro managers. � Multi-strategy funds continue to gain popularity with most categories of investors this year, largely due
to their ability to dynamically allocate capital across investment strategies in changing market environ-
ments.� European investors typically make more allocations each year to hedge fund managers than do North
American investors. The average size of allocations from European investors tends to be smaller than
those of North American investors.� 55% of investors will increase their exposure to managers who trade European securities. A higher
proportion of North American investors will increase their European holdings than European investors.� Asia is a big focus in 2005, with 73% of investors indicating they will increase their allocations to Asia
excluding China and Japan. However, many found it difficult to find hedge funds in the region who meet
their investment requirements.
Performance Predictions
68% of investors believe the hedge fund industry will return 6% to 8%. Investors feel that record asset inflows depress returns.
Investors predict Long/Short Equity managers will be the best performing managers in 2005. This is the second year Long/Short Equity is among the top three predicted best performers, with 35% of investors selecting the strategy. Macro makes its third appearance in the top three strategies with 22% of investors selecting it as a top performer. Rounding out the top three is Multi-strategy, making its first appearance in the top tier this year with 16% of investors selecting it as a top performer.
General Conclusions
Page 30
Global Markets July 2005
Trends in investment terms
Investors will continue to resist longer lock-ups of their capital by managers, and those managers who require lock-ups of over a year will need to focus on the quarter of the investor marketplace willing to accept them, mostly in North America. Pensions, endowments, and foundations as well as some of the largest funds of funds are typically the investor groups willing to accept lock-ups of longer than one year.
Pensions, Endowments and Foundations
Pensions, endowments and foundations hold the smallest number of hedge funds within their portfolios. 58% invest in less than 10 individual managers and 80% have portfolios with fewer than 20 managers. We continue to observe that this group tends to be “sticky money” meaning that once invested, they are very loyal investors and hold their positions longer than any other group of investors.
Pensions, Endowments and Foundations do not necessarily require a longer time to make investment decisions than other investors. 50% of them can make allocation decisions in under six months while 78% can reach a decision in under one year.
Allocation trends
Pensions, endowments and foundations make fewer allocations each year than other investor types. This group will make, on average, 4 allocations to hedge funds annually, compared to funds of funds with 15 allocations annually.
� 39% of pensions, endowments and foundations indicate their managers average over $1 billion in as-
sets under management.� 43% of pensions, endowments and foundations plan to increase their exposure to Fixed Income man-
agers.� 47% will increase their exposure to managers specifically focused on Credit analysis and none of those
surveyed will decrease their exposure.� 24% of pensions, endowments and foundations will increase their holdings in Macro strategies and
none of those surveyed will decrease their holdings.
Family Offices and High Net Worth Individuals
Family offices and high net worth individuals are investing in a growing number of hedge funds, with 49% having between 21 and 100 managers in their portfolios. Very few (2%) invest in over 100 managers each.
Allocation trends
Family offices and high net worth individuals make, on average, 10 new allocations to managers each year. Family offices and high net worth individuals make the smallest size allocations of all investor types, averaging just $11 million per manager.

Page 31
July 2005
� 58% of family offices can make new allocation decisions in fewer than 6 months.
� 35% of family offices indicated they would add to Statistical Arbitrage strategies and none surveyed
indicate they would be adding to Market Neutral funds.
Trends in investment terms
Future investment capacity rights are not as important to family offices as for fund of funds, banks, consultants, corporations and insurance companies. Only 29% of family offices ask for this option when investing in a manager.
� 73% of family offices prefer managers with a year or less lock-up provision.
� 22% of family offices invest in managers through managed or separate accounts.
Funds of Funds
Funds of funds are generally the most experienced investors in the hedge fund market, with 56% having over ten years of direct investing experience.
Funds of funds make, on average, 15 new investments in managers each year, making them the most frequent source of capital.
69% of funds of funds hold between 21 and 100 direct investments in different managers and 11% of them have over 100 managers in their portfolios.
Over half of funds of funds either have existing leverage products or will consider applying leverage sometime in the future to enhance their returns.
More funds of funds (62%) can reach an investment decision in less than 6 months than any other investor group.
Allocation trends
� On average, a fund of funds makes allocations of $19 million to each of its managers.
� Funds of funds are the primary investors in hedge funds under $100 million.
Trends in investment terms
� As many fund of funds offer their own investors flexible liquidity terms, 79% indicated that they will only
invest in a manager who has a lock-up of one year or less.
� 55% of funds of funds ask for future capacity rights when investing in new managers.

Page 32
Global Markets July 2005
Banks, Consultants, Corporations and Insurance Companies
Banks, consultants, corporations, and insurance companies are providing the largest individual allocations to hedge funds, averaging $26 million, larger than other investor types. They make the second largest number of investments into hedge funds each year, on average 12 new hedge fund investments a year.
Allocation trends
� 56% of this group plan on increasing their allocations to Multi-strategy managers.
� 66% of banks, consultants, corporations and insurance companies indicate they will reduce their expo-
sure to Convertible managers and only 3% said they will add Convertible Arbitrage holdings.
Trends in investment terms
Banks, consultants and insurance companies prefer to lock-up their capital for no more than a year. 87% will not invest with a manager who has terms requiring investors to lock-up their capital longer than one year.
Barry Bausano (1) 212 250 4792 [email protected] Head of Hedge Funds
New York
John Dyment (1) 212 250 3130 [email protected] Head, Hedge Fund Capital Group
Eva Siekierski (1) 212 250 2254 [email protected] Olstein (1) 212 250 0683 [email protected] Lebowitz (1) 212 250 6138 [email protected] Jones (1) 212 250 5719 [email protected] Fonda Pride (1) 212 250 2238 [email protected]
London
Roxanne Mosley (44) 20 754 54984 [email protected] European Head, Hedge Fund Capital Group
Ben Walmsley (44) 20 754 77723 [email protected] Millar (44) 20 754 77825 [email protected] Walker (44) 20 754 72839 [email protected]
Asia
Ferrell Daste (852) 2203 8968 [email protected]
William Healy (1) 212 250 6084 [email protected] of Hedge Fund Relationship Management - Americas
Christy York (44) 20 754 77254 [email protected] of Hedge Fund Relationship Management - Europe
Frank Nelson (1) 212 250 3962 [email protected] Head, Prime Services Sales
Deutsche Bank’s Global Hedge Fund Relationship Management
Deutsche Bank’s Hedge Fund Capital Group
Deutsche Bank’s Global Head of Hedge Funds
Contact Information
Deutsche Bank’s Global Prime Services Sales

Deutsche Bank AG
International locations
Deutsche Bank Securities Inc.60 Wall StreetNew York, NY 10005United States of AmericaTel: (1) 212 250 2500
Deutsche Bank AGLevel 55Cheung Kong Center2 Queen’s Road CentralHong KongTel: (852) 2203 8888 Fax: (852) 2203 6921
Deutsche Bank AG London1 Great Winchester StreetLondon EC2N 2EQUnited Kingdom Tel: (44) 20 7545 8000Fax: (44) 20 7545 6155
Deutsche Securities LimitedTokyo BranchLevel 20, 2-11-1 NagatachoSanno Park TowerChiyoda-ku, Tokyo 100-6171 JapanTel: (81) 3 5156 6701Fax: (81) 3 5156 6700
Deutsche Bank AGGroße Gallusstraße 10-1460272 Frankfurt am MainGermanyTel: (49) 69 910 41339
Deutsche Bank AGLevel 18, Grosvenor Place225 George StreetSydney, NSW 2000AustraliaTel: (61) 2 9258 1555 Fax: (61) 2 9258 1550
© Copyright Deutsche Bank Securities Inc., 2005This material has been prepared for informational and discussion purposes only by the Hedge Fund Capital Group and is not an offer, or solicitation of an offer, or a recommendation, to buy or sell any security, commodity or other financial instrument or to participate in any trading strategy or to enter into any financing arrangement or to provide services of any kind in any jurisdiction. It is based on information from sources which Deutsche Bank Securities Inc. (“DBSI”) believes to be reliable but neither DBSI nor any of its parent companies, affiliates, officers, directors, employees, agents, successors or assigns (collectively, “DB”) makes any representations or warranties of any kind regarding its accuracy or completeness. All terms and conditions are indicative only and are subject to change without notice. Additional materials are available upon request.This material is not intended to represent and does not represent the rendering of any legal or regulatory advice. The ultimate responsibility for the decision on the appropriate application of legal and regulatory treatment rests with the client and his or her counsel. A change in the facts or circumstances of any transaction could materially affect the legal or regulatory treatment for that transaction.