hebbr2-taffic: a novel application of neuro-fuzzy network for visual based traffic monitoring system
TRANSCRIPT

Expert Systems with Applications 36 (2009) 6343–6356
Contents lists available at ScienceDirect
Expert Systems with Applications
journal homepage: www.elsevier .com/locate /eswa
HebbR2-Taffic: A novel application of neuro-fuzzy network for visual basedtraffic monitoring system
Siu-Yeung Cho *, Chai Quek, Shao-Xiong Seah, Chin-Hui ChongCentre for Computational Intelligence, School of Computer Engineering, Nanyang Technological University, Blk N4 #2A-32, Nanyang Avenue, Singapore 639798, Singapore
a r t i c l e i n f o
Keywords:Neuro-fuzzy networkImage processingTraffic monitoring system
0957-4174/$ - see front matter � 2008 Elsevier Ltd. Adoi:10.1016/j.eswa.2008.08.043
* Corresponding author. Tel.: +1 65 6790 5491; faxE-mail address: [email protected] (S.-Y. Cho).
a b s t r a c t
This paper presents a robust methodology that automatically counts moving vehicles along an express-way. The domain of interest for this paper is using both neuro-fuzzy network and simple image process-ing techniques to implement traffic flow monitoring and analysis. As this system is dedicated for outdoorapplications, efficient and robust processing methods are introduced to handle both day and night anal-ysis. In our study, a neuro-fuzzy network based on the Hebbian–Mamdani rule reduction architecture isused to classify and count the number of vehicles that passed through a three- or four-lanes expressway.As the quality of the video captured is corrupted under noisy outdoor environment, a series of prepro-cessing is required before the features are fed into the network. A vector of nine feature values isextracted to represent whether a vehicle is passing through a lane and this vector serves as input patternswould be used to train the neuro-fuzzy network. The vehicle counting and classification would then beperformed by the well-trained network. The novel approach is benchmarked against the MLP and RBFnetworks. The results of using our proposed neuro-fuzzy network are very encouraging with a highdegree of accuracy.
� 2008 Elsevier Ltd. All rights reserved.
1. Introduction have to type the message such as ‘‘Slow Traffic after ABC Ave 6 Ex-
In any fast growing cities, the pace of life is climbing and peopletend to have lesser patience to wasting their time traveling onroads or even being caught in the middle of traffic congestions.Thus, it is important for the local transport authorities to monitorthe traffic conditions and to detect the number of vehicles so as tofacilitate their comprehension of the traffic conditions and reactaccordingly to any new incident. Over the years, there have beenimprovements in sensor technology and communication systemsthat allow the local transport authorities to closely monitor theconditions of the surface transport system. This has resulted inthe development of a diverse range of traffic monitoring tech-niques to collect data on the traffic flow characteristics. However,current system of tracking vehicle volume can be further improvedto achieve a safer and efficient the transportation system. It is crit-ical that the data collected are processed to derive useful informa-tion that will support intelligent decision-making. It is thusimperative that surveillance data be used to manage the systemin a proactive rather than a reactive manner.
Currently, the Land Transport Authority (LTA) of Singapore ismonitoring the traffic of expressways using overhead sky-cameras,which overlook the oncoming traffic. However, upon detection ofvehicle breakdowns, slow traffic or accidents, relative personnel
ll rights reserved.
: +1 65 6792 6559.
it” or ‘‘Vehicle Breakdown on Lane 1” and display them on theExpressway Monitoring Advisory System (EMAS) board for theroad users.
This paper describes an approach using images from videocamera installed along the expressway with computational intel-ligence techniques to perform vehicles counting and incidentdetection. Traffic images are first acquired from the traffic vid-eos. Different image processing techniques will be systematicallyapplied to extract the features of the vehicles from the trafficimages. The features of the moving vehicles are subsequentlyfed into different neural networks such as multi-layer perceptron(MLP) network, radial basis function (RBF) network and neuro-fuzzy network for training and validation. The accuracy of vehi-cle detection using different networks will be compared todetermine which type of neural network is suitable for this vehi-cle detection application.
This paper is organized as follows: Section 2 provides an over-view of the commonly used intelligent traffic monitoring systems.Section 3 describes the methodologies of our proposed system invideo acquisition, image processing and feature extractions. Thecomputational intelligence technique used by neuro-fuzzy net-work is described in Section 4. The automatic construction of neu-ro-fuzzy structure and fuzzy rules reduction process from the rawdata is shown in this section. Section 5 presents the empirical re-sults of our proposed system for day-time and night-time trafficconditions. Finally, the conclusion is drawn in Section 6.

6344 S.-Y. Cho et al. / Expert Systems with Applications 36 (2009) 6343–6356
2. Overview of intelligent traffic monitoring system
Transportation is one of the major concerns for all big cities.With more cars on the road, the relevant road authority has to in-crease the effectiveness and efficiency in dealing with traffic inci-dents. Traffic congestion is not only the problem of a developednation; even developing nations are also faced with this seriousproblem. Traffic incidents are defined as events that reduce thecapacity of a road network links to carry traffic; for example: acci-dent, disabled vehicles, spilled loads, road maintenance and con-struction activities; some of which are known a-priori and otherare unforeseen. Accurate and early detection of traffic incidents,particularly of unforeseen events, is vital for the restoration ofsmooth traffic flow. Besides causing congestion, traffic incidentalso indirectly affects life and incurs significant economic losses,and the impact caused by the incident is directly proportional tothe duration taken to detect the incident. Therefore, automaticincident-detection (AID) algorithms have become interesting andis a topical research issue (Wang, Tang, Sui, & Wang, 2003).
Traffic monitoring system detects traffic flow information suchas the numbers of passing cars, speed, and congestion by con-stantly computing the traffic flow on a road using a wide-anglecamera. Traffic flows of several lanes can be determined using asingle camera so that individual sensor for each lane, like a conven-tional system, is no longer required. By adding additional functionsinto the imaging processor, this system is used as a multi-func-tional sensor for traffic and road conditions. The basic flow diagramis shown in Fig. 1a. In the diagram, background subtraction proce-dure extracts only moving vehicles from the sampled images. Bysubtracting the following two images and eliminating the stableobjects such as road surface, signboards or buildings from one im-age, only moving vehicles are extracted. The outcome is shown inFig. 1b.
Currently, the majority of the traffic sensors used in Singapore isbased on detector coil buried under the road surface. These types ofsensors are accurate but will incur high cost for long term mainte-nance. Recently, several AID models using computational intelli-gence; especially neural networks, fuzzy logic and image
Fig. 1. A typical Traffic Monitoring System. The system is based on extracting moving vehwould be leant and memorized in order to measure the moving distance of each vehiccondition but cannot be used for calculating the traffic flow. (a) Flowchart of the syMonitoring System, (http://www.nagoya-denki.co.jp/english/its3_e.html)).
processing, have been proposed and have shown great promises(Hu, Xiao, Xie, Tan, & Maybank, 2004; Lee, Yen, & Krammes,1996; Srinivasan, Jin, & Cheu, 2004). The idea of using video fortraffic monitoring is relatively new and highly topical. There aretwo main type of video extraction. The first type, for instances(Behrad, Shahrokni, & Ahmad, 2001; Li, Pan, & Zhang, 2000; Mittal& Paragios, 2004; Radke, Andra, Al-Kofahi, & Roysam, 2005; Tzouv-eli, Andreou, Tsechpenakis, Avrithis, & Kollias, 2004), employs thedifference between the current video frame and the previous videoframe to detect motion. The second type is the use of backgroundsubtraction (Li, Pan, & Zhang, 2000; Li, Ding, & Liu, 2003). The onereported in Li et al. (2003) uses a constantly updated backgroundimage for subtraction while another one in Li et al. (2000) is usinga pre-stored background image. A less commonly used method byKovesi (2003) is based on the use of phase congruency to detectedges and corner. More advanced method by Yoneyama, Yeh,and Kuo (2005) eliminates cast shadow which affects the accuracyof vehicles detection. Jung and Ho proposed to extract trafficparameters using video-based vehicle tracking with a new occlu-sion approach consisting of explicit and implicit occlusions (Jung& Ho, 1999). Dailey proposed the use of an image edge extractiontechnique to derive an image showing only vehicles (Dailey & Li,1999). In general, transportation traffic is a complex, nonlinear,non-stationary process and is significantly affected by immeasur-able parameters and variables. Thus, a data-driven computationalintelligence model is needed for accurate detection of incident.Most of the research work uses either neural networks or fuzzyneural network. One particular paper (Martin, Perrin, & Hansen,2000) did a comparison of different computational intelligencenetwork with various traffic systems.
This paper uses image and video processing to extract objectsof interest from the video inputs. Computational Intelligencemethods like neural networks and/or neuro-fuzzy networks willbe subsequently trained to count the number of vehicles. Neuralnetwork (NN) is inspired and modeled after the human brain,for its ability to learn from the past and its reasoning skills. NNsimulates the architecture and operation of the human brain usingstructural and functional units known as neurons. Multi-layer
icle objects by means of background subtraction. The shape of the extracted vehiclesle by tracing the same shape. The approach can be used for monitoring the trafficstem. (b) Background subtraction (adapted from Image Processing-based Traffic

S.-Y. Cho et al. / Expert Systems with Applications 36 (2009) 6343–6356 6345
preceptron (MLP) is the most commonly used neural networkarchitecture and is tuned by the backpropagation learning algo-rithm (Simon, 1999). MLP networks are general-purpose, flexible,and nonlinear models consisting of a number of units organizedinto multiple layers. The complexity of the network can be chan-ged by varying the number of layers and the number of units ineach layer. Another commonly used neural network architectureis the radial basis function (RBF) networks. RBF networks are orig-inally used for data interpolation in multidimensional space andare known as general-purpose method for approximating non-linear mappings (Hornik, Stinchcombe, & White, 1989). Being asingle hidden-layer network, RBF network can establish its param-eters for hidden neurons directly from the input data and train thenetwork parameters by ways of linear optimization. Comparedagainst MLP, it is generally faster to train. Neuro-fuzzy networkis based on a general neural network based connectionist model,combining both fuzzy logic and neural network (NN) (Yuan & SuargaS., 1995). Basically, NN is capable of learning from exemplars toprovide accurate cognitive reasoning. While fuzzy arithmeticembedded within the NN nodes enables approximate-reasoningto be realized as a self-evolving fuzzy system that learns the fuzzyconcepts (in terms of the fuzzy memberships or linguistic labels)and the relationships between the inputs and outputs (as fuzzyrule) on the basis of the training data. This system is able toencapsulate knowledge that can be described.
3. Video acquisition, processing and feature extraction
3.1. Video acquisition
The digital video camera is stationed along the Pan IslandExpressway (PIE-Tuas) towards the city, near Jurong West/NTU(Yunnan Garden), at a height of approximately 8.2-m from the roadsurface, centered over the three-lane traffic at a specified angle.The main criterion in selecting the site is its considerable straightexpressway layout, which provides wide area coverage on a rela-tively level terrain. Observation from the video may allow someframes to be determined inaccurately because the video streamingspeed is too fast for the eyes to determine and for the brain toremember numerous frames. Frames from movie structure asshown in Fig. 2a are extracted as images. Human eye is used to ob-serve every image at a speed, which allows ample time for thebrain to process the information perceived from the eye. Each
1 2 3 n-2 n-1 n
Movie Structure
1st Frame of movie structure
Fig. 2. Extraction of video frames. (a) A movie structure; (b) an extracted frame.
frame extracted from the movie structure is a 24-bit true color im-age; also know as a RGB image as shown in Fig. 2b.
3.2. Image processing
Effective vehicle detection can be achieved by using various im-age processing techniques. But vehicle detection during the dayand the night cannot be approached with the same image process-ing technique, because of different lighting conditions. Image pro-cessing provides several effective techniques to detect the targetobjects in images. All traffic images are complex since the back-ground condition is highly variable as well as differences in theenvironment; namely: weather and lighting conditions.
In our study, different image processing techniques for the dayand night images are devised as shown in Fig. 3, suitably matchingthe different perceivable objects: during the day, moving templatesare detected as vehicles; and at night, moving headlights are de-tected as vehicles. These image processing techniques have thecommon objective of extracting moving vehicles.
During daytime, the traffic image is made of target vehicles and‘‘distracting” objects, such as houses, trees, street lamps and sta-tionary vehicles located along road shoulders. Due to the lightingcondition in the day, the objects in the intensity image are not vis-ibly distinctive, thus enhancement of contrast in the images is per-formed. For contrast enhancement, we assume that the variable rrepresenting the gray scale levels of the image is to be enhanced(Gonzalez, & Woods, 2002). A new value s is produced for every va-lue of r using the following transformation function expressed inEq. (1):
s ¼ TðrÞ 0 6 r 6 1 ð1Þ
The transformation function produces an output image of high-er contrast than the original by darkening levels below m and con-versely brightening levels above m in the original image. Thetransformation function is single valued and monotonic.
For vehicle detection, various techniques such as edge and mo-tion detections are performed to determine the most suitable tech-nique to be used to detect vehicles in the traffic images. In ourempirical studies, traffic lanes can be occupied by moving or sta-tionary objects during different times. Actually, motion seems tobe the most important feature of the target objects (Cucchiara,Grana, Piccardi, & Prati, 2003). Therefore, target extraction is basedon spatio-temporal segmentation: by temporal aspect, it is meant
Day frames Night frames
Image conversion
Contrast enhancement
Vehicle detection
Segmentation
Moving vehicles in the frame
Removal of unwanted regions
Image conversion
Headlight detection
Segmentation
Fig. 3. Image processing for daytime and night-time traffic frames.
6346 S.-Y. Cho et al. / Expert Systems with Applications 36 (2009) 6343–6356
that one exploits information on moving points – extracted by rel-ative difference between successive frames in the image sequence;and by spatial aspect, it is meant that one takes into account light-ing differences in the zone where motion is shown. The movingpoint detection performs difference between one frame f(xi, yi)and the following third frame f(xj, yj), in order to segment only‘‘strong” moving points of true moving objects and is describedby Eq. (2):
dijðx; yÞ ¼ f ðxi; yiÞ � f ðxj; yjÞ ð2Þ
Regions of the image corresponding to moving vehicles need tobe separated from the regions corresponding to the background.Thresholding is used to perform this segmentation on the basisof the different intensities in the foreground and background re-gions of the image (Abutaleb, 1989; Cheriat, Said, & Suen, 1998;Otsu, 1978). In this paper, thresholding using discriminant analysisis used. This thresholding method was suggested by Otsu based ondiscriminant analysis, which partitions the image into two classesG0 and G1 at gray level t such that G0 = {0, 1, 2, . . ., t} and G1 = {t+1,t+2, . . ., L�1}, where L is the total number of gray levels in the im-age (Otsu, 1978). Let rB and rT be the ‘‘between-class” variance and‘‘total” variance respectively, the optimum threshold t* is obtainedby maximizing the ratio of between-class variance to total vari-ance; see Eqs. (3)–(5):
t� ¼maxfgg where g ¼ rB=rT ð3ÞrB ¼ w0w1ðl1 � l0Þ
2 ð4ÞrT ¼
Xi
ði� lTÞ2Pi ð5Þ
where w0 and w1 denote the fraction of pixels lying in G0 and G1
classes respectively and can be represented by Eq. (6):
w0 ¼X
i
Pi and w1 ¼ 1�w0 ð6Þ
where Pi ¼ ni=N and N ¼P
iNi � ni is the number of pixels on the ithgray level and N is the total number of pixels in the image. l1 and l0
daytime ornightime
original RGBvideo
convert grayscalecontrast
enhanceme
convert grayscale headlightdetection
daytime
nightime
Fig. 4. Summary of the image processing fl
represent the class means for G0 and G1 respectively and are com-puted using Eq. (7):
l1 ¼lT � l0
1�w0and l0 ¼
lt
w0ð7Þ
where lt ¼ lT ¼X
i
iPi ð8Þ
Iterative computation was required to determine the bestthreshold for a given image. The property of distinct class separa-tion requires that an object in the image can be easily identifiedfrom the background due mainly to a distinct difference betweenthe object and its background.
However, for the daytime traffic image, the image representedis essentially the illumination of the vehicles by the sun. As thelight intensity of the sun decreases, the level of illumination de-creases. The histogram may be observed with many peaks and val-leys. Basically, the image displays the information of thebackground which is having the same property and the only differ-ence is the amount of intensity of light that is reflected on thebackground. The resultant image does not exhibit distinct classseparation property. Therefore, the Otsu’s method of thresholdingis unsuitable. As the images vary between different lighting condi-tions, the threshold value must be dynamically selected and shouldnot be a pre-fixed value. The proposed method extends from theprinciple of thresholding with the threshold value changingaccordingly in the images. As different images have different histo-grams, the change in the threshold values is based on the charac-teristics of the image histograms. As a result, the obtained imageexhibits distinct class separation property, thus dynamic thres-holding is most suitable for this study. The rule for computingthreshold is shown in Eq. (9),
a ¼0 if a < s1 if a P s
�ð9Þ
where a is the intensity of each pixel of the image and s is the lumi-nance threshold value.
ntmotion
detection
thresholding
removal ofunwanted regions
thresholding
ows with their corresponding outputs.

S.-Y. Cho et al. / Expert Systems with Applications 36 (2009) 6343–6356 6347
The traffic image in the night is very different from those in theday. The only salient visual features are headlights and theirbeams, street lamps and lighted signboards on top of most taxis.The main objective is to identify vehicles based on their pairs ofheadlights. This is a simplifying assumption, since vehicles withsingle headlight, such as motorcycles, can be present. Lighted sign-boards on top of most taxis and headlights of motorcycles may bedetected as identical objects. Thus motorcycles are neglected, sincethey do not have significant impact on typical traffic flow parame-ters like throughput, congestion probability and queue length. Inthe night-time traffic condition, moving points detection is used,similar to the one employed in the traffic images in the day to per-form the difference between one frame f(xi, yi) and the followingthird frame f(xj, yj), in order to segment only ‘‘strong” movingpoints of true moving headlights of the vehicles. Dynamic thres-holding is used, similar to the one used on the traffic images inthe day.
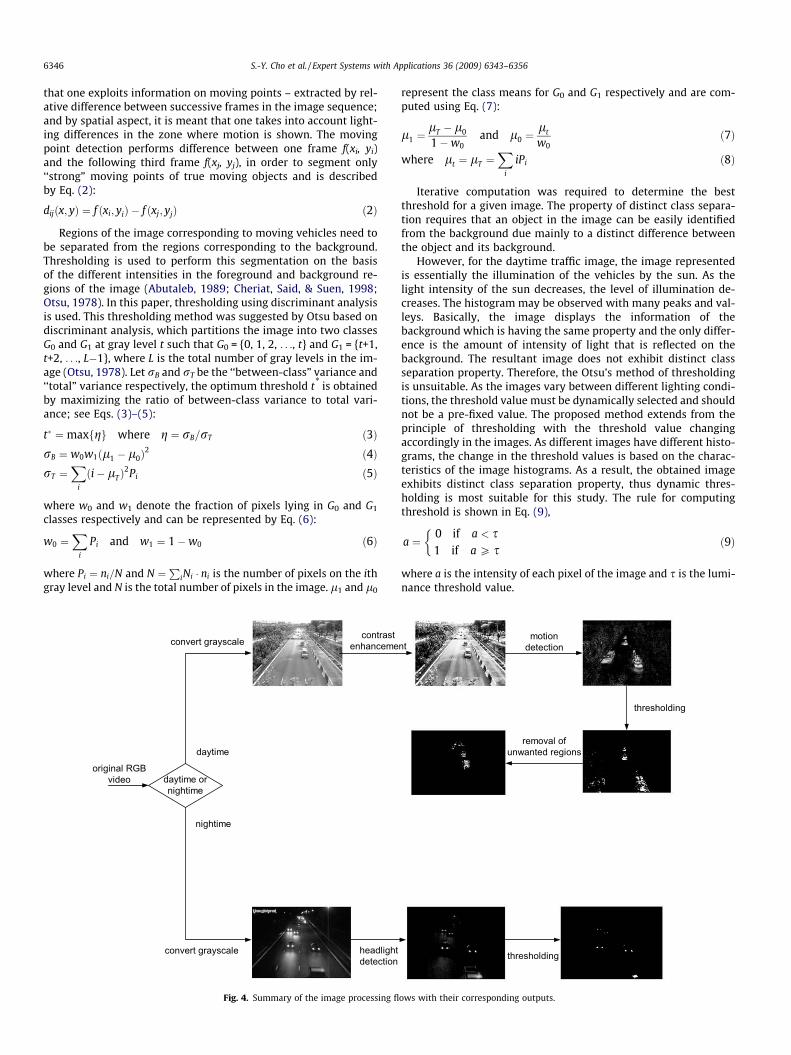
Fig. 4 summarized the flow of the image processing stages andtheir various outputs. The flow would split into two pipelinesaccording to whether the traffic is in the day or at night. If the traf-fic were at daytime, the original RGB video would be convertedinto grayscale images and subsequently enhancing the contrastin grayscale. After which, motion detection would be performed.The dynamic thresholding would be applied to determine the vehi-cles object for feature extraction. If the traffic were at night, theoriginal RGB video would be also converted into grayscale images.The headlights detection would be performed with dynamic thres-holding to extract the vehicle objects.
3.3. Feature extraction
In order to extract features of the vehicles on each lane for rec-ognition, vehicle detection boxes are implemented. Vehicle detec-tion boxes are drawn on each lane to capture the vehicles. Data
Fig. 5. Layout of the vehicle detection boxes. (a
1 2
3 4 X
Y
biglength
Fig. 6. Automatic generation of n
values of each vehicle detection boxes are then acquired. Thissub-section will cover the layout of the vehicle detection boxes,the automatic generation of nine vehicle detection boxes and theacquisition of data values from the vehicle detection boxes.
Layout of the vehicle detection boxes is very important. Incor-rect layout of the vehicle detection boxes may fail to capture thevehicles passing through them since they represent the ‘‘virtual vi-sual detection coil” akin to the surface embedded induction coil. Inour study, nine vehicle detection boxes in square shapes arealigned to form a bigger square shape to be drawn in each laneas shown in Fig. 5a. This layout of the vehicle detection boxes isunexpected, as it cannot capture the whole vehicle, which will af-fect the results of the neural networks training. The expected lay-out of the boxes is where the nine vehicle detection boxes aredrawn to cover the whole lane and are aligned closely togetheras shown in Fig. 5b to capture the whole vehicle.
In this paper, an automatic generation of the nine-vehicle-detection boxes is implemented. As shown in Fig. 6, a region ismarked out on the traffic image and the coordinates of point1, 2, 3, and 4 are obtained. From these four coordinates, thelength of the sides of the region can be easily computed usingEq. (10):
lengthbig ¼ffiffiffiffiffiffiffiffiffiffiffiffiffiffiffiffiffiffiffiffiffiffiffiffiffiffiffiffiffiffiffiffiffiffiffiffiffiffiffiffiffiffiffiffiffiffiffiðxa � xbÞ2 þ ðya � ybÞ
2q
ð10Þ
The length of each smaller box can be computed using Eq. (11):
lengthsmall ¼lengthbig
3ð11Þ
The gradient of each line can be computed using Eqs. (12) and(13):
m ¼ ya � yb
xa � xbð12Þ
y ¼ mxþ c ð13Þ
) Unexpected layout; (b) expected layout.
3 4
1 2
e
f
a b
c d
g
h
ae
af
be
bf
Y
X
smalllength
ine vehicle detection boxes.

6348 S.-Y. Cho et al. / Expert Systems with Applications 36 (2009) 6343–6356
With these parameters derived, the points a, b, c, d, e, f, g, h, ae,af, be, bf can be easily determined by solving the equations whichare shown in Fig. 6. As shown in the figure, nine boxes are gener-ated for the vehicle detection on each lane.
In order to extract the features of the vehicles, data values fromthe vehicle detection boxes are acquired. Vehicle detection boxesare in binary images so that the pixels in each binary image iseither ‘1’ (white) or ‘0’ (black). The pixels which are ‘1’ (white)show the features of the vehicles and ‘0’ (black) is the default valueto show that there is no vehicle. The value of each box can be com-puted as described by Eq. (14):
value ¼ Number of pixels with value ‘1’Total number of pixels
ð14Þ
When there is no vehicle inside the box, there is no pixel in thebinary image with value ‘1’ (white). When there is a vehicle insidethe box, there are pixels in the binary image with value ‘1’ (white)as shown in Fig. 7. An array of binary values represents the featurevalues of the vehicle inside the box (see Fig. 7a). A binary image isalso extracted to represent the feature pattern of the vehicle insidethe box (see Fig. 7b). A stream of the features is used to train and isgeneralized by the neuro-fuzzy network as described in the nextsection.
Fig. 7. Extracted binary images of a vehicle detection box. (a)
Fig. 8. Structure of 5-layer neuro-fuzzy netwo
4. Neuro-fuzzy networks
Data values acquired from vehicle visual detection boxes are ex-tracted as the features of vehicles in the traffic images. Classifica-tion based on simple discriminating functions is rather difficult.A neural network-based approach is a logical choice for the in-tended classification process of the visual features, for examplein Cho, Chow, and Leung (1999). The data values acquired fromvehicle visual detection boxes that are derived using the featureextraction described in the previous section form a set of numeri-cal figures, which do not have any significant meaning. Therefore,to perform vehicle classification, these image features are fed intoan artificial neural network for classification.
Increasingly the research focus on neural networks has shiftedfrom a black box approach to a semantic based fuzzy neural archi-tecture (Ang & Quek, 2005). The integration of the fuzzy systemsand neural networks is called neuro-fuzzy network (Lin & Lee,1996). It has become popular in the recent years to take the advan-tage of the low-level learning ability of neural networks and thehigh-level reasoning ability of fuzzy systems. The identificationof interpretable fuzzy rules is one of the most important issuesin the design of neuro-fuzzy network and much of which drawsinspiration from the cognitive processes in the human brain.
Binary values inside the box; (b) binary image of the box.
rk (adapted from Quek and Zhou (1999)).

S.-Y. Cho et al. / Expert Systems with Applications 36 (2009) 6343–6356 6349
Currently, extensive research efforts have been undertaken onneuro-cognitive science and the study of functional and computa-tional models of memory structures that underlie the human rea-soning process. This permits higher order cognitive architecturesto be crafted for problem solving in an increasingly complex envi-ronment. Fuzzy and rough sets methodology that map formal fuz-zy logical structures onto neural systems to perform the fuzzy setderivation and rule identification/reduction processes are alsoinvestigated (Ang & Quek, 2005; Liu, Quek, & Ng, 2007); therebyallowing compact fuzzy rule base to be judiciously crafted on thebasis of the underlying salient relationships between the variables.These research endeavours culminated with the developments ofthe human hippocampus-inspired semantic learning memory sys-tems such as GenSoFNN (Tung & Quek, 2002), pseudo adaptivecomplementary learning networks (Lin, Lin, & Lee, 1995; Quah,Quek, & Leedham, 2005; Quek & Tung, 2001; Tan, Quek, & Ng,2005; Tung & Quek, 2004) and POPFNN based hippocampus-likesemantic memories (Ang & Quek, 2005; Ang, Quek, & Pasquier,2003; Quek & Singh, 2005; Quek & Zhou, 1999; Quek & Zhou,2001; Quek & Zhou, 2006). They are linguistic fuzzy models that at-tempt to capture interpretability. Semi-fuzzy neural networks suchas (Jang, 1993; Kasabov & Song, 2002; Tang, Quek, & Ng, 2005;Wang, Quek, & Ng, 2004) are precise fuzzy models. Together theyform a class of formalized neural fuzzy systems that exhibit globa-lised learning that is akin to the learning memory structures of thehuman hippocampus. This is the human memory structure that isresponsible for knowledge construction. In addition, computa-tional models that functionally emulate the semantic associationof the neocortex have also been reported in the literatures (Minh,Shi, & Quek, 2006; Ng, Quek, & Han, 2008; Sim, Tung, & Quek,2006). This group of fuzzy associative memories is governed bylocalized activation and encoding and hence are potentially capa-ble of incremental learning. In addition, brain-inspired cerebel-lar-based computational models (Albus, 1975; Ang, Quek, &Wahab, 2002; Sintiani, Teddy, Lai, & Quek, 2007) for the modelingof complex, dynamic and non-linear problem domains possess sig-nificant advantage of learning by error correction.
The neuro-fuzzy modeling usually comes with two contradic-tory requirements: interpretability and accuracy. An iterative pro-cess is proposed to reduce the rule base to obtain goodinterpretability while at the same time maintaining a high-levelof modeling accuracy (Feng, 2007). This approach can be basedon the Hebbian ordering of the rules and is called Hebbian based
Initial rule generation
Rank fuzzy rules
Merge membership function
Remove redundant and conflicting rules and reduce
feature
Membershiprefinem
Ei+1 >Or i >
Iterative rulerefinement
Fig. 9. Hebbian based rule reduction pr
rule reduction (Feng, 2007). The Hebbian based rule reduction pro-cess not only reduces the rule base by merging the fuzzy sets ineach dimension, but it also considers the merging order which isrealized by the Hebbian ordering process. Hebbian ordering is usedto represent the importance of the rules, where a higher Hebbianordering indicates a larger coverage of the training points by a gi-ven rule. The rules with higher importance are more likely to bepreserved. The least mean square (LMS) algorithm is used to tunethe membership functions of the rule base after each time of thereduction. Interpretability and accuracy are balanced using thisiterative process.
4.1. Neuro-fuzzy network architecture
Fuzzy models consist of four components, a fuzzifier, a fuzzyrule base, an inference engine and a defuzzifier (Feng, 2007). Theraw inputs are first fuzzified to fuzzy inputs through the fuzzifier.Fuzzy inference is used in the inference engine based on a set offuzzy rules which has the following form of Mamdani fuzzy ruledescribed in Eq. (15):
R : IFx1 is A and x2 is B then y1 is C ð15Þ
It transforms the fuzzy inputs into fuzzy outputs through a for-mal fuzzy inference process. Fuzzy outputs are finally defuzzifiedto raw outputs through the defuzzifier. When the fuzzy model isintegrated within a neural network, the integrated model has afive-layer network, as shown in Fig. 8. The five layers are the inputlayer (layer one), the condition layer (layer two), the rule nodelayer (layer three), the consequence layer (layer four) and the out-put layer (layer five).
The inputs and outputs of the neuro-fuzzy network are repre-sented as non-fuzzy vectors XT = [x1, x2, . . ., xi, . . ., xn1], andYT = [y1, y2, . . ., yi, . . ., yn5]. The fuzzification and defuzzification,which are the functions of the fuzzifier and the defuzzifier compo-nents of the fuzzy model, are accomplished by the input and out-put layers of the neuro-fuzzy network. The fuzzy rule basecomponent is realized by the rule node layer. The condition, therule node and the consequence layers collectively perform the fuz-zy inference of the fuzzy system. The terms n1, n2, n3, n4, n5 denotethe number of the neurons of the input, condition, rule node, con-sequence and output layers respectively. n2 =
PLi and n4 =
PTm,
where Li and Tm are the number of input and output linguistic la-bels for each dimension.
function ent
Membership function tuning
Ei
imax
reduction and
η
ocess (adapted from Feng (2007)).

6350 S.-Y. Cho et al. / Expert Systems with Applications 36 (2009) 6343–6356
The first layer is the input layer, where each node transfers theraw input directly to the condition layer, which plays the role ofsingleton fuzzifier in fuzzy inference. That is, net input: f I
i = xi,and net output: oI
i ¼ f Ii .
The second layer is the condition layer, in which the neuron iscalled an input label. In this layer, each node transforms a raw in-put to a fuzzy input. The Gaussian membership function is used inthis case. It is used mainly for two reasons. Firstly, it ensures thedifferentiability of the activation function of each node, which isa necessary property for the least mean square (LMS) algorithmemployed in the neuro-fuzzy network for tuning the membershipfunctions. Secondly, a fuzzy system with Gaussian membershipfunction has been shown to be a universal approximator of anynon-linear functions on a compact set. For each input label ILi;j,the net input and output are specified as follows: net input:f IIi;j ¼ �ðoI
i � cIIi;jÞ
2=ðdII
i;jÞ2, and net output: oII
i;j ¼ ef IIi;j .
The third layer is the rule node layer, where each rule node rep-resents an ‘‘if then” fuzzy rule. The activation function of each nodein this layer performs the T-norm operation. The product operatoris used. That is, net input: f III
k ¼Q
i;joIIi;j, and net output: oIII
k ¼ f IIIk . oIII
k
is called the firing strength of the fuzzy rule in the presence of aninput XT.
The fourth layer is the consequence layer, where each node inthis layer is called the output label. It aggregates the output of eachnode in the rule node layer, and performs the S-norm operation offuzzy inference. The summation operator is used. That is, net input:f IVl;m ¼
PkoIII
k , and net output: oIVl;m ¼ f IV
l;m .The last layer is the output layer, which performs the defuzzifi-
cation operation. The modified center average defuzzifier is em-ployed here. That is, net input: f V
m ¼PTm
t¼1ðcIVl;m=d
IVl;mÞ � oIV
l;m and netoutput: oV
m ¼ f Vm=PTm
l¼1ðoIVl;m=d
IVl;mÞ. The final output can be expressed
as Eq. (16):
oVm ¼
PTml¼1cIV
l;m=dIVl;m � ð
Pk
oIIIk ÞPTm
l¼1ðP
koIII
k Þ=dIVl;m
ð16Þ
Fig. 11. Detection result by the proposed system during daytime traffic. (a) No vehi
Fig. 10. Vehicle representation in the detection boxes. (a) A vehicle completely within thetraffic. (c) A pair of headlights in the middle of the nine boxes during nighttime traffic. (d)
By denoting iLkðiÞ as the input label in the ith input dimension ofthe kth rule, and oLkðmÞ as the output label in the mth outputdimension of the kth rule, the above equation can be expressedas Eqs. (17) and (18):
oVm ¼
Pn3k¼1cIV
oLkðmÞ;m=dIVoLkðmÞ;m � oIII
kPn3k¼1f III
k =dIVoLkðmÞ;m
ð17Þ
where oIIIk ¼ f III
k ¼Yn1
i¼1
exp �ðxi � cII
i;iLkðiÞÞ2
ðdIIi;iLkðiÞÞ
2
( ): ð18Þ
4.2. Hebbian based rule reduction process
The Hebbian based rule reduction process consists of threephases: the initial rule generation, the iterative rule reductionand refinement and the membership function tuning, as shownin Fig. 9. The three phases will be deliberated as follows.
4.2.1. Phase 1: initial rule generationDuring the rule initialization phase, whenever a new data sam-
ple is presented, if there are no rules in the rule base, or if thestrength of the rule with the largest firing strength is below a spec-ified threshold, a new rule node will be created with the centroid ofthe sample. This threshold controls the coverage of data space bythe rules and affects the number of initial rules. The larger thethreshold the lesser the number of rules will be generated, and viceversa.
4.2.2. Phase 2: Iterative rule reduction and refinementExcessive membership functions and rules would be generated
during the rule initialization phase and they should be reduced soas to provide a clear linguistic semantic meaning of each fuzzy setand decrease the complexity of the model. In fuzzy modeling, eachfuzzy rule corresponds to a sub-region of the decision space. Somerules lying in a proper region may represent many samples and
cle is detected at these three lanes. (b) A vehicle is detected at the central lane.
nine boxes during daytime traffic. (b) Parts of a vehicle with the boxes during daytimeA pair of headlights not in the middle of the nine boxes during nighttime traffic.

S.-Y. Cho et al. / Expert Systems with Applications 36 (2009) 6343–6356 6351
have much influence on the final result, while some other rulesmay occasionally be generated by noise and become redundantin the rule base. Thus, the importance of each rule is not necessar-ily of the same value. This section introduces the Hebbian impor-tance of fuzzy rules and explains how it is utilized to merge thefuzzy sets.
As the membership functions of a rule are determined, thetraining sample (XT
i ;YTi ) is simultaneously fed into both the input
and output layers. The input XTi is used to produce the firing
strength of the kth rule node, while YTi is fed into the consequence
layer to derive the membership values at the output label nodes. Ifall the input–output samples repeatedly fire a rule by the productof their firing strength and the membership values, and the accu-mulated strength surpasses that of other rules, it indicates the exis-tence of such a rule. In another view, the accumulated strengthexerted by the sample pairs reflects the degree of coverage of themby the rule. The rule that covers the samples to a higher degree willhave greater influence on the modeling accuracy. This is due to thefact that when the membership functions of the rule or the rule it-self are merged or deleted respectively, it will result in a largerchange in the fuzzy inference results and significantly affect themodeling accuracy. Thus such a rule is of greater importance. Toderive a good balance between interpretability and accuracy, whenmembership functions and rules are reduced, it is desirable to pre-serve all such efficient and effective rules.
Let’s define the degree of the coverage of the ith data point(XT
i ;YTi ) by the kth rule as the product of their firing strength and
the membership function values as described by Eq. (19):
ck;i ¼ f IIIk
Yn5
m¼1
lIVoLkðmÞ;mðyi;mÞ ð19Þ
The Hebbian importance of the kth rule is defined as the sum ofthe degree of coverage of all the training samples as computedusing Eq. (20):
Ik ¼Xn
i¼1
ck;i ð20Þ
Graph of Mean Square Error Vs Types of Network
0.040.09
0.53
0
0.1
0.2
0.3
0.4
0.5
0.6
MLP RBF Neuro-fuzzy
Types of network
MSE
(%)
Graph of Mean Square Error Vs Types of Network
0.110.27
1.71
00.20.40.60.8
11.21.41.61.8
MLP RBF Neuro-fuzzy
Types of network
MSE
(%)
Fig. 12. Comparison between different types of network in different lanes
The fuzzy rules can then be effectively sorted by the importanceof them in a decreasing order. This is called the Hebbian ordering ofthe rules.
At the beginning of the rule reduction, the original rule set, de-noted by R, contains all the sorted rules and the reduced rule set,denoted by R0, is null. The rules in R are presented successivelyaccordingly to their Hebbian orders. If there is no rule in the re-duced rule set, the rule in R is directly added into R0, otherwise,the fuzzy set in each dimension of the rule will be added or mergedinto the fuzzy sets in R0 according to a set of criteria defined below.All the newly added or merged fuzzy sets will be linked together toformulate a new rule in the reduced rule set R0.
During the merging process, some fuzzy sets may be shared byseveral rules. To change a fuzzy set shared by many rules is equiv-alent to simultaneously modifying these rules, thus may exertmuch influence on the performance of system, while a less sharedfuzzy set only affects the performance locally. Thus, much sharedfuzzy set is of higher importance than the lesser shared ones.
Denote the importance of a fuzzy set F as IF. The IF is a changingvalue during the merging process. At each time the kth rule in theoriginal rule set R is presented, its fuzzy sets Ai and Bj (i.e. the kthrule is ‘‘IF xi = Ai THEN yj = B00j ) have the same importance with theirassociated rule. That is described by Eq. (21):
M1 : IAi¼ IBj
¼ Ik ð21Þ
for i = 1, . . ., n1 and j = 1, . . ., n5.For each input dimension i, among the fuzzy sets in the reduced
rule set R’ of this dimension, the fuzzy set A0i with the maximumdegree of overlap over Ai is selected. If the maximum degree ofoverlap satisfies a specified criterion, they will be merged into an-other fuzzy set A00i , otherwise, the fuzzy set Ai is directly added intothe reduced rule set of this dimension. The centroid and the vari-ance of Ai and A0i; (cAi
; dAi) and (cA0i
; dA0i) respectively, are merged into
(cA00i; dA00i
) by Eq. (22):
M2 : cA00i¼
IAicAiþ IA0i
cA0i
IAiþ IA0i
; dA00i¼
IAidAiþ IA0i
dA0i
IAiþ IA0i
ð22Þ
Graph of Mean Square Error Vs Types of Network
0.220.56
3.07
0
0.5
1
1.5
2
2.5
3
3.5
MLP RBF Neuro-fuzzy
Types of network
MSE
(%)
Graph of Mean Square Error Vs Types of Network
0.982.46
14.33
02468
10121416
MLP RBF Neuro-fuzzy
Types of network
MSE
(%)
during daytime traffic. (a) Lane 1; (b) Lane 2; (c) Lane 3; (d) all lanes.

6352 S.-Y. Cho et al. / Expert Systems with Applications 36 (2009) 6343–6356
The importance of the new fuzzy set A00i is given by Eq. (23):
M3 :IA00i¼ IAi
þ IA0ið23Þ
In other words, the centroid and variance of resultant fuzzy setis the weighted average of the two fuzzy sets according to theirimportance, and the degree of importance of this final fuzzy setis the sum of the values of importance of the two. Then the newlygenerated fuzzy set A00i replaces the previous fuzzy set A0i. For eachoutput dimension, fuzzy set Bj is either directly added or mergedinto the fuzzy sets of this output dimension in the reduced ruleset, using the same process for the input dimensions. Finally, thenewly added or merged fuzzy sets in all the dimensions are linkedtogether to formulate a fuzzy rule in the reduced rule set R’.
Given fuzzy sets A and B, the degree of overlap of A by B is de-fined as in Eq. (24):
SAðBÞ ¼A \ B
A
�������� ð24Þ
As the Gaussian membership function is used in the proposedmethod, the overlap measure can be derived using the centersand variances of the membership functions. For the fuzzy sets Aand B, with membership functions lAðxÞ ¼ expf�ðx� cAÞ2=d2
Agand lBðxÞ ¼ expf�ðx� cBÞ=d2
Bg respectively, assuming cA P cB andthen jAj and jA \ Bj can be expressed as Eqs. (25) and (26):
jAj ¼ffiffiffiffipp
dA ð25Þ
jA \ Bj ¼ 12
h2 ½cB�cAþffiffiffippðdAþdBÞ�ffiffiffi
ppðdAþdBÞ
þ 12
h2 ½cB�cAþffiffiffippðdA�dBÞ�ffiffiffi
ppðdB�dAÞ
þ 12
h2 ½cB�cA�ffiffiffippðdA�dBÞ�ffiffiffi
ppðdA�dBÞ
ð26Þ
where hðxÞ ¼ maxf0; xg.The criterion for merger is that, if SA(B) > k or SB(A) > k, they will
be merged, where k is a specified threshold that determines themaximum degree of overlap between fuzzy sets that the system
DdIVoLkðmÞ;m ¼ �
oE
odIVoLkðmÞ;m
¼ � oEooV
m
ooVm
odIVoLkðmÞ;m
¼ �2em
oIIIk
Pn3k0¼1cIV
oLkðmÞ;moIIIk0 = dIV
oLk0 ðmÞ;m
� �2� �
� cIVoLkðmÞ;m
Pn3k0¼1oIII
k0 = dIVoLk0 ðmÞ;m
� �2� �� �
Pn3k0¼1oIII
k0= dIV
oLk0 ðmÞ;m
� �2� �2
dIVoLkðmÞ;m
� �3ð29Þ
For cIIi;iLK ðiÞ,
DcIIi;iLK ðiÞ ¼ �
oEocII
i;iLK ðiÞ¼ � oE
ooVm
ooVm
olIIi;iLK ðiÞ
olIIi;iLK ðiÞ
ocIIi;iLK ðiÞ
¼ �2em
oIIIk cIV
oLK ðmÞ;mPn3
k0¼1oIIIk0 = dIV
oLK0 ðmÞ;m
� �2� �
�Pn3
k0¼1cIVoLK0 ðmÞ;m
oIIIk0 = dIV
oLK0 ðmÞ;m
� �2� �� �
xi � cIIi;iLK0 ðiÞ
� �Pn3
k0¼1oIIIk0= dIV
oLK0 ðmÞ;m
� �2� �2
dIIi;iLK ðiÞ
� �2doLK ðmÞ;m 2
ð30Þ
For dIIi;iLK ðiÞ,
DdIIi;iLK ðiÞ ¼ �
oE
odIIi;iLK ðiÞ
¼ � oEooV
m
ooVm
olIIi;iLK ðiÞ
olIIi;iLK ðiÞ
odIIi;iLK ðiÞ
¼ �2em
oIIIk cIV
oLK ðmÞ;mPn3
k0¼1oIIIk0= dIV
oLK0 ðmÞ;m
� �2� �
�Pn3
k0¼1cIVoLK0 ðmÞ;m
oIIIk0= dIV
oLK0 ðmÞ;m
� �2� �� �
xi � cIIi;iLK0 ðiÞ
� �2
Pn3k0¼1oIII
k0= dIV
oLK0 ðmÞ;m
� �2� �2
dIIi;iLK ðiÞ
� �3doLK ðmÞ;m 2
ð31Þ
can tolerate. A higher k may increase the accuracy but could possi-bly degrade the interpretability, while a lower k may cause a largernumber of rules to be reduced, however, running the risk that thenumber of rules is lesser than necessary to maintain high modelingaccuracy. We choose 0.5 to strike a balance between accuracy andinterpretability.
After all the rules are presented, the following steps will be exe-cuted to remove feature and delete redundant and conflicting rulesin the reduced rule set R’:
S1: If there is only one membership function within one dimen-sion, this dimension (feature) will be removed.
S2: If there is any rule that has the same conditions and conse-quences with others, it is removed.
S3: If there are any conflicting rules that have equivalent condi-tions but different consequences, the one with a higherdegree of importance is preserved and the others aredeleted. Finally, the original rule set is replaced with thereduced rule set.
4.2.3. Phase 3: membership function tuningThe least mean square (LMS) algorithm is employed to tune the
parameters of the neuro-fuzzy network. The error function used isdescribed by Eq. (27):
E ¼ 12
Xn5
m¼1
ðoVm � ymÞ
2 ¼ 12
Xn5
m¼1
e2m ð27Þ
where em ¼ oVm � ym:
Using the following set of equations below (Eqs. (28)–(31), eachparameter in the fuzzy neural network is adjusted according to thepartial derivative E with respect to that parameter
For cIVoLkðmÞ;m,
DcIVoLkðmÞ;m ¼ �
oEocIV
oLkðmÞ;m¼ � oE
ooVm
ooVm
ocIVoLkðmÞ;m
¼ �em
oIIIk =ðd
IVoLkðmÞ;mÞ
2
Pn3k0¼1oIII
k = dIVoLk0 ðmÞ;m
� �2 ð28Þ
For dIVoLkðmÞ;m,
5. Results and discussion
This section summarizes the relevant results obtained using theproposed neuro-fuzzy network for traffic monitoring system. Italso presents the results on vehicle count and error rate and isbenchmarked against other well-known neural network systems,

S.-Y. Cho et al. / Expert Systems with Applications 36 (2009) 6343–6356 6353
such as multilayer perceptron (MLP) network and radial basis func-tion (RBF) network.
In the experiments, training data patterns consist of data setsmade up of nine real values inputs and a binary (1 or 0) target out-put. The nine inputs are extracted from the data values of each ofthe nine boxes respectively. These values always lie in the range of0–1. However, the desired output values associated with each in-put data can only be obtained manually through human inspec-
Table 1Daytime traffic counts result in lane 1
Type of network Vehicle count
CV1 CV2 CV3 CV4 CV5 Total error counts
MLP 10 12 13 12 12 36RBF 17 22 22 16 23 15Neuro-fuzzy 17 19 20 16 17 8Human (Target) 19 19 19 19 19 NA
Table 2Daytime traffic counts result in lane 2
Type of network Vehicle count
CV1 CV2 CV3 CV4 CV5 Total error counts
MLP 26 30 32 31 29 87RBF 42 52 55 39 57 36Neuro-fuzzy 43 48 49 39 42 20Human (Target) 47 47 47 47 47 NA
Table 3Daytime traffic counts result in lane 3
Type of network Vehicle count
CV1 CV2 CV3 CV4 CV5 Total error counts
MLP 19 21 23 22 20 65RBF 31 38 39 28 41 25Neuro-fuzzy 31 35 35 28 31 14Human (Target) 34 34 34 34 34 NA
Table 4Daytime traffic counts result in all lanes
Type of network Vehicle count
CV1 CV2 CV3 CV4 CV5 Total error counts
MLP 55 63 68 65 61 188RBF 90 112 116 83 121 76Neuro-fuzzy 91 102 104 83 90 42Human (Target) 100 100 100 100 100 NA
Fig. 13. Detection result by the proposed system during nighttime traffic. (a) No ve
tion. For the daytime traffic, when a vehicle is seen completelywithin the nine boxes of the lane, the output is set to ‘‘1” as shownin Fig. 10a. Other cases when only parts of the vehicle are withinthe nine boxes will be set to ‘‘0” as shown in Fig. 10b. For thenight-time traffic, when a pair of headlight is seen in the middleof the nine boxes of the lane, the output is set to ‘‘1” as shown inFig. 10c. Other cases when no pair of headlight is in the middleof the nine boxes will be set to ‘‘0” as shown in Fig. 10d. This willensure that the network is trained to classify only when the wholevehicle is within the nine boxes or a pair of headlight is in the mid-dle of the nine boxes to prevent multiple detections.
In our experiments, a 5-fold cross validation is conducted forevaluations. Five hundreds training data are partitioned into 5 setsand 5 experiments were conducted; and each time using onefoldfor training and the remaining 4 folds for testing. The mean squareerror is used as the performance metric to compute the error ratebetween the actual vehicle and the output counts generalized by
hicle is detected at these four lanes. (b) A vehicle is detected at the right lane.
Table 7Nighttime traffic counts result in lane 3
Type of network Vehicle count
CV 1 CV 2 CV 3 CV4 CV5 Total error counts
MLP 39 37 33 36 35 50RBF 35 40 30 36 36 47Neuro-fuzzy 24 22 24 24 25 11Human (Target) 26 26 26 26 26 NA
Table 6Nighttime traffic counts result in lane 2
Type of network Vehicle count
CV1 CV2 CV3 CV4 CV5 Total error counts
MLP 41 38 34 38 36 52RBF 36 41 32 38 38 50Neuro-fuzzy 25 23 25 25 26 11Human (Target) 27 27 27 27 27 NA
Table 5Nighttime traffic counts result in lane 1
Type of network Vehicle count
CV1 CV2 CV3 CV4 CV5 Total error counts
MLP 23 21 19 21 20 29RBF 20 23 18 21 21 28Neuro-fuzzy 14 13 14 14 14 6Human (Target) 15 15 15 15 15 NA

6354 S.-Y. Cho et al. / Expert Systems with Applications 36 (2009) 6343–6356
the networks. Both daytime and night-time traffic occasions areinvestigated.
Table 8Nighttime traffic counts result in lane 4
Type of network Vehicle count
CV1 CV2 CV3 CV4 CV5 Total error counts
MLP 47 46 40 44 44 61RBF 44 48 37 45 44 58Neuro-fuzzy 30 27 29 29 30 15Human (Target) 32 32 32 32 32 NA
Table 9Nighttime traffic counts result in all lanes
Type of network Vehicle count
CV1 CV2 CV3 CV4 CV5 Total error counts
MLP 150 142 126 139 135 192RBF 135 152 117 140 139 183Neuro-fuzzy 93 85 92 92 95 43Human (Target) 100 100 100 100 100 NA
Graph of Mean Square Error Vs Types of Network
0.02
0.340.35
00.050.1
0.150.2
0.250.3
0.350.4
MLP RBF Neuro-fuzzy
Types of network
MSE
(%)
Graph of Mean Square Error Vs Types of Network
0.06
0.991.04
0
0.2
0.4
0.6
0.8
1
1.2
MLP RBF Neuro-fuzzy
Types of network
MSE
(%)
Graph of Mean Square
15.37
02468
1012141618
MLP
Types
MSE
(%)
Fig. 14. Comparison between different types of network in different lanes during
5.1. Results on daytime traffic
There are three lanes in the traffic images in the daytime data.Nine vehicle detection boxes are placed on each lane to detect thevehicles. The nine-vehicle-detection boxes in each of the lane turnsred when the simulated output is ‘1’ and remain blue when thesimulated output is ‘0’. The detection results of ‘‘no vehicledetected” and ‘‘one vehicle detected” are shown in Fig. 11. Anaccompanying video clip (‘‘daytime.mpg”) included the full se-quence of the daytime traffic video is attached to show the vehiclesdetection results of each lane on the expressway.
Moreover, vehicle counts using neural network based trafficmonitoring system of a 5-fold cross validations are compared withthe actual vehicle count by human judgment on each lane. Themean square error is used to compute the error rate, to benchmarkour proposed neuro-fuzzy network against the other tested neuralnetworks (i.e. MLP and RBF) for vehicle detection (see Fig. 12).
Tables 1–3 show the results of the vehicle count of the 5-foldcross validation compared against the actual vehicle count by hu-man and the count by different networks in lane 1, 2 and 3, respec-tively. Table 4 shows the overall result in all 3 lanes. In all cases,the neuro-fuzzy network based system is able to achieve the
Graph of Mean Square Error Vs Types of Network
0.06
1.091.14
0
0.2
0.4
0.6
0.8
1
1.2
MLP RBF Neuro-fuzzy
Types of network
MSE
(%)
Graph of Mean Square Error Vs Types of Network
0.10
1.481.55
00.20.40.60.8
11.21.41.61.8
MLP RBF Neuro-fuzzy
Types of network
MSE
(%)
Error Vs Types of Network
0.85
14.68
RBF Neuro-fuzzy
of network
nighttime traffic. (a) Lane 1; (b) Lane 2; (c) Lane 3; (d) Lane 4; (e) all lanes.

S.-Y. Cho et al. / Expert Systems with Applications 36 (2009) 6343–6356 6355
lowest error counts in all lanes for the daytime traffic. Moreover(Fig. 12) shows the comparisons of different types of network usedfor the system in each lane. The lowest mean square error isachieved by the neuro-fuzzy network. The results clearly demon-strate the effectiveness of the proposed system is providing consis-tent daytime traffic monitoring.
5.2. Results on nighttime traffic
For the night-time traffic monitoring, our proposed system wasemployed to monitor the four lane traffic on the expressway. Sim-ilar to the daytime traffic monitoring, nine vehicle detection boxeswere placed on each lane to detect vehicles. The nine-vehicle-detection boxes in each lane turn red when simulated output is‘1’ and remain blue when simulated output is ‘0’. Examples ofthe detection results are shown in Fig. 13 that there is no vehicledetected in the left image and that there is one vehicle detectedat the rightmost lane in the right image. An accompanying videoclip (‘‘night-time.mpg”), which includes the full sequence of thenighttime traffic video, is attached to show the vehicles detectionresults of each lane on the expressway.
Again, similar to daytime traffic simulation, vehicle count usingneural network based traffic monitoring system with a 5-fold crossvalidation is compared against the actual vehicle count by humanon the headlights of each lane. The mean square error is also usedto benchmark our proposed neuro-fuzzy network with the othertested neural networks (namely, MLP and RBF) for vehicle detection.
Tables 5–8 show the results of the vehicle count of a 5 fold crossvalidation that compared against the actual vehicle count by humanjudgment and the count by different networks in lane 1, 2, 3 and 4,respectively. Table 9 shows the overall result in all the 4 lanes dur-ing the nighttime traffic. In all cases, the neuro-fuzzy network basedsystem is able to achieve the lowest error counts in the four lanesduring night-time traffic. Moreover Fig. 14(a–e) shows the compar-isons of different types of network used for the system in each lane.The lowest mean square error is achieved by the neuro-fuzzy net-work. The results are promising and shown that the proposed sys-tem is able to provide a consistent night-time traffic monitoring.
6. Conclusion
In this paper, the concept of new vehicle detection is proposedbased on a computational neuro-cognitive approach. Firstly, theframes from the captured traffic video were extracted throughimage acquisition. Various image processing techniques were re-viewed and implemented in the daytime and nighttime trafficimages. The motion detection incorporating the dynamic thres-holding was employed in the image processing module. Oncethe images have been processed, parametric features are ex-tracted. The implementation of vehicle detection boxes was pro-posed to extract nine parameters to represent the features ofthe vehicles. These parameters were then fed into our proposedneuro-fuzzy network, which is based on the Hebbian–Mamdanirule reduction approach. This neuro-fuzzy network is able to gen-eralize the training data so as to correctly infer the output forsimilar data while the MLPs and RBF will normally over learnthe training data hence memorizes the training data. The Heb-bian–Mamdani architecture is also able to judge under certain de-gree of confidence using the membership. Combination of thesetwo factors makes it possible to reach the accuracy of vehicledetection as high as 95%.
In conclusion, a general tool for vehicle detection is conceptu-alized using a novel brain-inspired computational learning mem-ory that judiciously constructs a minimal set of fuzzy neural rulebase from the processed image data based on the Hebbian learn-
ing paradigm to order and prune the rules. The proposed systemis capable of extracting features of the vehicles and to detectvehicles by the use of Hebbian ranked neuro-fuzzy based classi-fier. The ultimate aim of this system is to detect traffic incidentusing the traffic video and to predict the traffic condition to pro-vide early warning to road users as well as to reduce the time todetect an incident hence reducing economic losses. All this is onlypossible if the system is able to detect vehicles in the first place.Counting of vehicles acts as a means to judge whenever it can de-tect a vehicle correctly.
References
Abutaleb, Ahmed S. (1989). Automatic thresholding of gray-level pictures usingtwo-dimensional entropy. Computer Vision, Graphics and Image Processing,22–32.
Albus, J. S. (1975). A new approach to manipulator control: The cerebellar modelarticulation controller. Transactions of the ASME, 97(3), 220–227.
Ang, K. K., & Quek, C. (2005). RSPOP: Rough set-based pseudo-outer-product fuzzyrule identification algorithm. Neural Computation, 17(1), 205–243.
Ang, K. K., Quek, C., & Pasquier, M. (2003). POPFNN-CRI(S): A pseudo outer productbased fuzzy neural network using the compositional rule inference and asingleton fuzzifier. IEEE Transactions on Systems, Man, and Cybernetics, Part B:Cybernetics, 33(6), 838–849.
Ang, K. K., Quek, C., & Wahab, A. (2002). MCMAC-CVT: A novel associative memorybased CVT transmission control system. Neural Networks, 15(3), 219–236.
Behrad, A., Shahrokni, A., & Ahmad, M. (2001). A robust vision-based moving targetdetection and tracking system, In Proceeding of Image and Vision ComputingConference.
Cheriat, M., Said, J. N., & Suen, C. Y. (1998). A recursive thresholding technique forimage segmentation. IEEE Transactions on Image Processing, 7, 918–921.
Cho, S. Y., Chow, T. W. S., & Leung, C. T. (1999). A neural-based crowd estimation byhybrid global learning algorithm. IEEE Transactions on Systems Man andCybernetics Part B-Cybernetics, 29(4), 535–541. August.
Cucchiara, R., Grana, C., Piccardi, M., & Prati, A. (2003). Detecting moving objects,ghosts, and shadows in video streams. IEEE Transactions on Pattern Analysis andMachine Intelligence, 25(10), 1337–1342.
Dailey, D. J., & Li, L. (1999). Video image processing to create a speed sensor. Universityof Washington, ITS Research Program, Final Research Report.
Gonzalez, Rafael C., & Woods, Richard E. (2002). Digital image processing. PrenticeHall Int.
Hornik, K., Stinchcombe, M., & White, H. (1989). Multilayer feedforward networkare universal approximation. Neural Networks, 2, 359–366.
Hu, W., Xiao, X., Xie, D., Tan, T., & Maybank, S. (2004). Traffic accident predictionusing 3-D model-based vehicle tracking. IEEE Transactions of VehicularTechnology, 53(3), 677–694.
Jang, R. (1993). ANFIS: Adaptive-network-based fuzzy inference system. IEEETransactions on Systems, Man, and Cybernetics, Part B, 23(3), 665–685.
Jung, Y.-K., & Ho, Y.-S. (1999). Traffic parameter extraction using video-basedvehicle tracking. Proceedings of IEEE/IEEJ/JSAI international conference onintelligent transportation systems, 764–769.
Kasabov, N. K., & Song, Q. (2002). DENFIS: dynamic evolving neural-fuzzy inferencesystem and its application for time-series prediction. IEEE Transactions on FuzzySystems, 10(2), 144–154.
Kovesi, P. (2003). Phase Congruency Detects Corners and Edges, Technical report inSchool of Computer Science & Software Engineering, The University of WesternAustralia. Crawley, W.A. 6009. <http://www.cmis.csiro.au/Hugues.Talbot/dicta2003/cdrom/pdf/0309.pdf>.
Lee, S., Yen, J., & Krammes, R. A., (1996). Application of fuzzy logic for detectingincidents at signalized highway intersections. In Proceedings of fifth IEEEinternational conference fuzzy systems, New Orleans, LA, September (pp. 867–872).
Li, P., Ding, L., & Liu, J. (2003). A video-based traffic information extraction system.In Proceedings of the IEEE intelligent vehicles symposium, 2003.
Li, J., Pan, S., & Zhang, Y.-Q. (2000). Automatic extraction of moving objects usingmultiple features and multiple frames. Proceedings – IEEE internationalsymposium on circuits and systems, 1. I-36-I-39.
Lin, C. T., & Lee, G. (1996). Neural fuzzy systems: A neuro-fuzzy synergism to intelligentsystems. Prentice Hall.
Lin, C. T., Lin, C. J., & Lee, C. S. G. (1995). Fuzzy adaptive learning control networkwith online neural learning. Fuzzy Sets and Systems, 71, 25–45.
Liu, F., Quek, C., & Ng, G. (2007). A novel generic Hebbian ordering based fuzzy rulebase reduction approach to Mamdani neuro-fuzzy system. Neural Computation,1656–1680.
Martin, P. T., Perrin, H. J., Hansen, B. G. (2000). Incident detection algorithmevaluation, Technical Report, UTL-0700–31.
Minh, D., Shi, D., & Quek, C. (2006). FCMAC-BYY: Fuzzy CMAC using Bayesian Ying-Yang learning. IEEE Transactions in Systems, Man and Cybernetics, Part B, 36(5),1180–1190.
Mittal, Anurag, Paragios, Nikos. (2004). Motion-based background subtraction usingadaptive kernel density estimation. In Proceedings of the IEEE Computer SocietyConference on Computer Vision and Pattern Recognition (Vol. 2, pp. II302–II309.

6356 S.-Y. Cho et al. / Expert Systems with Applications 36 (2009) 6343–6356
Ng, G. S., Quek, C., & Han, J. (2008). FCMAC-EWS: A bank failure early warningsystem based on a novel localized pattern learning and semantically associativefuzzy neural network. Expert Systems with Applications, 989–1003.
Otsu, N. (1978). A threshold selection method from gray level histogram. IEEETransactions on Systems Man and Cybernetics, 8, 62–66.
Quah, K. H., Quek, C., & Leedham, C. G. (2005). Reinforcement learning combinedwith fuzzy adaptive learning control network (FALCON-R) for patternclassification. Pattern Recognition, 38(4), 513–526.
Quek, C., & Singh, A. (2005). POP-Yager: A novel self-organising fuzzy neuralnetwork based on the Yager inference. Expert Systems with Applications, 29(1),229–242.
Quek, C., & Tung, W. L. (2001). A novel approach to fuzzy membership functionsusing the Falcon-MART architecture. Pattern Recognition Letters, Official Journalof the International Pattern Recognition Society, 22(9), 941–958.
Quek, C., & Zhou, R. W. (1999). POPFNN-AARS: A pseudo outer-product based fuzzyneural network. IEEE Transactions on Systems, Man and Cybernetics, Part B, USA,29(6), 859–870.
Quek, C., & Zhou, R. W. (2001). The POP learning algorithms: reducing work inidentifying fuzzy rules. Neural Networks, The Official Journal of the InternationalNeural Network Society, European Neural Network Society and Japanese NeuralNetwork Society, 14(10), 1431–1445.
Quek, C., & Zhou, R. W. (2006). Structure and learning algorithms of a nonsingletoninput fuzzy neural network based on the approximate analogical reasoningschema. Fuzzy Sets and Systems, 157(13), 1814–1831.
Radke, R. J., Andra, S., Al-Kofahi, O., & Roysam, B. (2005). Image change detectionalgorithms: A systematic survey. IEEE Transactions on Image Processing, 14(3),294–307.
Sim, J., Tung, W. L., & Quek, C. (2006). FCMAC-Yager: A novel Yager inferencescheme based fuzzy CMAC. IEEE Transactions on Neural Networks, 17(6),1394–1410.
Simon, Haykin (1999). Neural networks: A comprehensive foundation (2nd edition.).Prentice Hall.
Srinivasan, D., Jin, X., & Cheu, R. L. (2004). Evaluation of adaptive neural networkmodels for freeway incident detection. IEEE Transaction of Intelligent TransportSystems, 1–11.
Tan, T. Z., Quek, C., & Ng, G. S. (2005). Ovarian cancer diagnosis by hippocampus andneocortex-inspired learning memory structures. Neural Networks, 18(5/6),818–825.
Tang, A. M., Quek, C., & Ng, G. S. (2005). GA-TSKFNN: Parameters tuning of fuzzyneural network using genetic algorithms. Expert Systems with Applications,29(4), 769–781.
Sintiani, D., Teddy Lai, E., & Quek, C. (2007). Hierarchically clustered adaptivequantization cmac and its learning convergence. IEEE Transactions on NeuralNetworks, 1658–1682.
Tung, W. L., & Quek, C. (2002). GenSoFNN: A generic self-organising fuzzy neuralnetwork. IEEE Transactions on Neural Networks, 13(5), 1075–1086.
Tung, W. L., & Quek, C. (2004). Falcon: Fuzzy neural control and decision systemsusing FKP and PFKP clustering algorithms. IEEE Transactions on Systems, Man andCybernetics, Part B, 34(1), 686–694.
Tzouveli, P., Andreou, G., Tsechpenakis, G., Avrithis, Y., & Kollias, S. (2004). Intelligentvisual descriptor extraction from video sequences. Lecture notes in computer science– adaptive multimedia retrieval. Springer-Verlag (Vol. 3094, pp. 132–146).
Wang, D., Quek, C., & Ng, G. S. (2004). Novel self-organizing Takagi-Sugeno-Kangfuzzy neural networks based on ART-like clustering. Neural Processing Letters,20(1), 39–51.
Wang, F.-Y., Tang, S., Sui, Y., & Wang, X. (2003). Toward intelligent transportationsystems for the Olympics 2008. IEEE Intelligent Systems, 18(6), 8–11. November/December.
Yoneyama, A., Yeh, C. H., & Kuo, C.-C. (2005). Robust vehicle and traffic informationextraction for highway surveillance. Eurasip Journal on Applied SignalProcessing(14), 2305–2321.
Yuan, Y. & Suarga S. (1995). On the integration of neural networks and fuzzy logicsystems. In International conference on systems, man and cybernetics, Vancouver,Canada (pp. 452–456).