heat transfer model for plug flow anaerobic digesters model developed herein will aid in identifying...
TRANSCRIPT

Heat Transfer Model for
Plug Flow Anaerobic Digesters1
by
K.G. Gebremedhin, B. Wu, C. Gooch, P. Wright and S. Inglis
ABSTRACT A comprehensive and fundamental mathematical model that predicts energy requirements to operate a plug-flow anaerobic digester at a specified temperature was developed. This information is supportive to designers as they determine heating requirements and energy use by the digester system. The model accounts for heat loss/gain by the influent and effluent flows, the digester floor, top-covering material and walls. Also, the model accounts for frozen ground surrounding digester walls, thus increasing heat loss through the walls. Solar energy transmitted through the top-covering material was also accounted for in the model. Predicted heat was validated against experimental data and the results agree reasonably well. The model can be used to estimate energy requirements to operate a plug-flow anaerobic digester on a daily, monthly or yearly basis. Low energy was required to operate the digester in June through August, the lowest being in July, and more energy was required in November through March. Considerable energy could be saved if the effluent manure heat was used to pre-heat the influent manure. Keywords: anaerobic digester, plug flow, mathematical model, energy requirement, heat exchange, INTRODUCTION When designing a plug-flow anaerobic digester for a specific site, knowledge of total energy input required for digester function is essential to predict the net energy available for secondary use. There is currently no comprehensive, fundamentally based model that predicts energy requirements to operate a digester for varying environmental conditions. There are many factors to consider when modeling heat exchange between an anaerobic digester and its environment. The density, thermal conductivity, specific heat and temperature of the ground must be considered for a digester with walls and floor in contact with the ground. The density, thermal conductivity and specific heat of the ground are dependent upon soil type and water content. For example, a digester placed in dry sand with a thermal conductivity of approximately 0.3W/m K will lose heat at a considerably slower rate than a digester placed in saturated sand, which has a thermal conductivity of 3.14W/m K (Jumikis, 1977). Anaerobic digesters could be installed entirely below grade, partially below grade, or entirely above grade. The model developed herein will aid in identifying critical parameters in design of plug-flow anaerobic digesters built below grade, partially below grade and entirely above grade. The top-covering surface should, however be exposed to ambient air. Ground surface temperature is influenced by many factors including ambient air temperature, solar load, wind speed, soil thermal conductivity, emissivity and surface roughness/cover. Ground temperature varies with time and depth from the surface. Temperature variations with depth are a function of variations of surface conditions with time, and soil diffusivity, which in
1Transactions of ASAE, 2005, Vol. 48(2): 777-785.

turn is a function of soil thermal conductivity, specific heat and density all of which vary with moisture content. Previous models have assumed either a constant ground temperature throughout the depth of the digester (Minot, 2002) or a linear temperature gradient (Alpert et al., 1976, Rykbost et al., 1976, Axaopoulos et al., 2001). The model reported herein assumes a sinusoidal ground temperature gradient until a calculated ground depth, and remains constant thereafter. Formulations for determining the depth where the temperature begins to be constant is given in the mathematical formulation section. Ground surface temperature is a function of weather conditions. Derivation of the model is comprehensive in order to account for all relevant venues of heat transfer. A simplified model may be developed once the value of each venue is established. The comprehensive model is also being coded into a web-based, easy to use model that could be used for practical applications. To our knowledge, no such model exists in the literature. Objectives The focus of this paper was to develop a comprehensive heat transfer model that predicts energy requirements to operate a plug-flow anaerobic digester built below grade, partially below grade and entirely above grade. The specific objectives were to:
1. Develop a comprehensive and fundamental heat transfer model that predicts energy requirements for a plug-flow anaerobic digester to operate at a specified temperature.
2. Validate the mathematical model using measured energy loss data from two operating plug-flow anaerobic digesters located in Upstate New York.
3. Simulate daily, monthly or yearly energy requirements to operate plug-flow anaerobic digesters.
LITERATURE REVIEW Anaerobic digestion of dairy cow manure produces a fuel that can be used as an alternative to conventional source of energy. To determine the optimum value of the design parameters and simultaneously analyze the feasibility of producing biogas in a plug-flow digester, energy demand of the digester must be determined. There are two major energy requirements that must be determined: (1) the amount of energy to bring the effluent manure up to the digester operating temperature, and (2) the amount of energy required to maintain the digester at the operating temperature. Walker et al. (1985) reported that to address capital cost per daily net energy produced, digester energy demand should be determined. Determination of energy required to maintain a digester at an operating temperature is critical to optimization and system modeling. Several researchers have outlined the energy requirements to operate an anaerobic digester. Fischer (1983) listed the energy inputs necessary to run a digester. To maintain the digester at optimal operating temperature, the heat loss to the surroundings must offset by a heating system. Chen and Hashimoto (1980) showed these components to include the heat loss through the walls, floor and top of the digester, heat loss due to evaporation, the heat loss due to the gas leaving the digester, the heat required to raise the influent manure to digester temperature. For plug-flow digesters constructed below the surface of the ground, heat loss through the walls and floor is affected by the soil surrounding the digester. Alpert et al. (1976) and Rykbost et al. (1976)
2

investigated the effect of heat sources on soil temperatures. Their investigations revealed a wide range of thermal conductivities, 3.61 - 5.63 mcal (cm sec C) depending on moisture content and type of soil. In both of these studies, the temperature through the soil was treated as a steady state condition. Hills (1986) assumed that the digester does not affect the soil temperature and the temperature of the soil remains the same regardless of the digester temperature. He realized, however, that this assumption would increase heat loss to the soil because the resistance is decreased. He also assumed steady state conditions for calculating heat losses through floor and walls.
0 -1
Axaopoulos et al., (2001) developed a mathematical model to simulate a solar-heated anaerobic digester. The digester was constructed below ground level and its fix cover was made of flat-plate solar collector, which was an integral part of the roof structure. The model considered a time-dependent energy balance for the digester and included: energy delivered from solar collectors, heat losses from manure surface by convection and radiation, energy of the incoming manure, heat losses through the digester walls and floor, and heat losses through side-walls of the cover. The flow through the digester walls and floor to the soil was defined as a combination of steady state value for the digester wall and soil along the corresponding heat flow path to ambient air. The average heat transfer coefficient calculated in this manner was used with ambient air. Minott (2002) proposed two methods for determining heating requirements for a plug-flow digester. The first method employs temperature difference of hot water that is used to heat the digester from the time it enters until the time it leaves the digester. Knowing the mass flow rate and specific heat of water, as well as the length of time hot water was pumped through the digester each day, it is possible to determine total heat transferred from water to manure in a given day. Assuming a steady state condition, total heat lost from a digester in a given day was assumed to be equal to heat gained. The second proposed method requires no temperature measurements from a working anaerobic digester and assumes a plug-flow digester with its four walls built below grade level. Total heat required by the digester is determined by summing the energy it takes to heat the influent manure to the required digester operating temperature and total heat losses through walls, floor and top covering material. Minott (2002) reported the total heat loss using the first approach was approximately 10% greater than that using the second approach. In the second approach, the following assumptions were made: (1) constant ambient air temperature of -5°C, (2) constant soil temperature of 0°C throughout the depth of the anaerobic digester, but 12.8°C at the base, (3) temperature at inside surface of the lid was equal to the temperature of the contents of the digester, (4) specific heat of manure was equal to specific heat of water, and (5) convection and radiation from the lid surface were considered to be negligible. An interactive model was designed by Crosby (2002) to describe heat loss from a household size mixed anaerobic digester built above grade level. The model calculates heat losses by conduction to the base, and heat required to raise influent sludge to the mesophilic (37.8ºC) range, and was calculated as
q =m•
cp ΔT (1)
3

where, is mass flow rate of manure, c is specific heat of manure, and m& p ΔT is temperature difference between influent manure and digester operating temperature. Total energy requirement for digester function was determined by adding heat loss by conduction through walls, floor and heat required to raise temperature of manure to the operating temperature. In this model, heat loss by radiation and convection were assumed to be negligible, and ambient air temperature, defined by the user, was assumed to be constant. The model proposed herein is an improvement of the models reported previously because it includes: (1) a weather model for calculating ambient air temperature, (2) a transient heat flow through the ground (sinusoidally varying ground temperature gradient), which accounts for frozen soil, and (3) solar irradiation load on the digester cover for a defined latitude and elevation. MODEL DEVELOPMENT Assumptions
(1) The digester is built entirely below grade, partially below grade or entirely above grade. The top surface which may be covered with a synthetic or concrete material is exposed to ambient air.
(2) Circulating hot water pipes are used to heat manure inside the digester. (3) Temperature of the manure inside the digester is maintained constant. (4) Sinusoidally varying ground temperature from the grade level to a calculated
depth and constant thereafter. (5) Steady state heat transfer within the system. (6) Transient heat transfer condition through the ground in contact with digester walls
but steady state condition through digester floor. (7) Negligible microbial heat generation. Hashimoto and Chen (1979) showed that
heat gain from the exothermic reaction can be neglected. (8) Uniform soil properties (specific heat, thermal conductivity and density)
throughout the depth. (9) Negligible atmospheric long-wave radiation.
Heat Transfer Model Taking an anaerobic digester as control volume (Fig. 1), energy balance in the system is expressed as
, ,{( ) } 0solar heating manure out manure in cover floor wallQ Q Q Q Q Q Q+ − − + + + = (2) where, is heat gain from circulating water. heatingQ
4
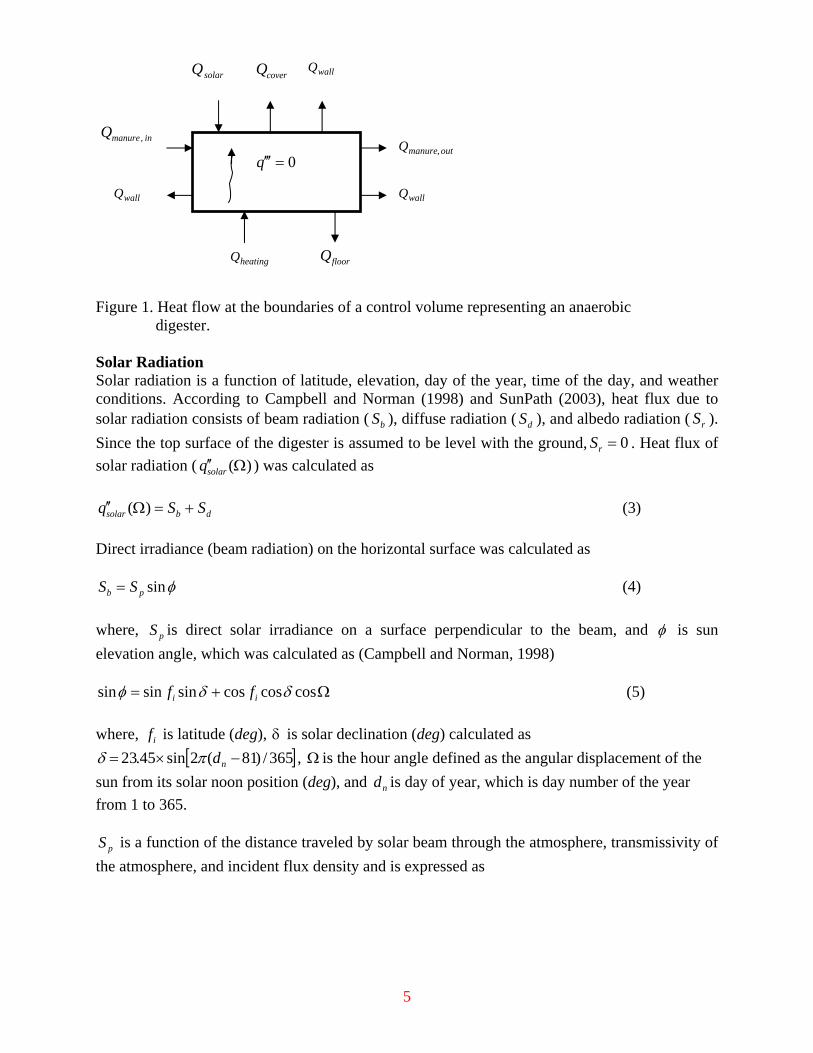
Figure 1. Heat flow at the boundaries of a control volume representing an anaerobic digester. Solar Radiation Solar radiation is a function of latitude, elevation, day of the year, time of the day, and weather conditions. According to Campbell and Norman (1998) and SunPath (2003), heat flux due to solar radiation consists of beam radiation ( ), diffuse radiation ( ), and albedo radiation ( ). Since the top surface of the digester is assumed to be level with the ground, . Heat flux of solar radiation ( ) was calculated as
bS dS rS0=rS
)(Ω′′solarq
dbsolar SSq +=Ω′′ )( (3) Direct irradiance (beam radiation) on the horizontal surface was calculated as
φsinpb SS = (4) where, is direct solar irradiance on a surface perpendicular to the beam, and pS φ is sun elevation angle, which was calculated as (Campbell and Norman, 1998)
Ω+= coscoscossinsinsin δδφ ii ff (5) where, is latitude (deg), δ is solar declination (deg) calculated as if
[ ]/)81(2sin45.23 −×= nd 365πδ , is the hour angle defined as the angular displacement of the sun from its solar noon position (deg), and is day of year, which is day number of the year from 1 to 365.
Ω
nd
pS is a function of the distance traveled by solar beam through the atmosphere, transmissivity of
the atmosphere, and incident flux density and is expressed as
wallQ solarQ
,
heatingQ Qfloor
inmanure
coverQ
Q
0=′′′q outmanureQ ,
wallQ wallQ
5

0Pm
p SaS = (6) where, is extraterrestrial flux density normal to the solar beam assumed to be 1.36 , is transmission coefficient, which varies from 0.9 for a very clear atmosphere to 0.6 for a hazy or smoggy atmosphere. A typical value for clear days is 0.84. The term is optical air-mass number calculated as
0PS 2/ mkW a
mφsin/)/( 0PPm = , where, P is atmospheric pressure at digester site (Pa),
and is atmospheric pressure at sea level (Pa). 0P The diffuse radiation component was estimated as (Campbell and Norman, 1998)
φsin)1(3.0 0m
pd aSS −= (7) On a cloudy day, was assumed to be negligible. bS Total solar radiation flux during a day was obtained by integrating )(Ω′′solarq from sunrise hour angle ( ) to sunset hour angle ( ), and is expressed as 1sΩ 2sΩ
ΩΩ′′=′′ ∫Ω
Ωdqq s
ssolarsolar
2
1
)( (8)
where, is calculated as1sΩ )](tan)(tan[arccos1 δis f−=Ω . A negative value of denotes that sunrise is before solar noon, and
1sΩ
12 ss Ω−=Ω , in which positive value of 2sΩ denotes that sunset is after solar noon. Average daytime solar radiation flux was calculated as
)/( 12 sssolarsolar qq Ω−Ω′′=′′ (9) Heat gain by the anaerobic digester from solar radiation during daytime was calculated as
( )solar solar coverQ q A τ λ′′= (10) where, )(λτ is transmissivity of the covering material and A is its surface area. Heat Loss from Circulating Hot Water inside Digester Hot water was circulated inside the digester to maintain a constant manure temperature. Heat loss from water was calculated from a standard sensible heat equation as
( )coldhotpwaterwater TTcmQwater
−=•
(11) and heat gain by the digester from pipes carrying water was
6

pipe
wheating R
TTQ 0−
= (12)
where, wT is average temperature of heating water calculated as 2)( coldhotw TTT −= ,
0T is temperature of manure inside the digester and, is total thermal resistance of pipes calculated as
pipeR)2()/(ln 12 pipepipepipe LkrrR π= , and are inside and outside radius of pipe,
respectively, and is total length of pipe in the digester. 1r 2r
pipeL Heat Loss due to Mass Flow Energy required to heat influent manure to reach the required operating temperature inside the digester was calculated as
, 0( )manuremass flow manure in p manure inQ m c T T
•
= − , (13)
flowmassQ represents heat required to raise temperature of the influent manure ( ) to the operating temperature of the digester ( ). is the constant temperature at which the digester is operated, which is the temperature of the effluent manure. Therefore, Equation (13) combines and .
,manure inQ
,manure outQ 0T
,manure inQ ,manure outQ Heat Exchange between Digester Cover and Ambient Air Heat exchange between digester cover and ambient air is by convection and radiation. When the cover surface temperature ( ) was greater than ambient air ( ), the digester was assumed to loose heat, otherwise it gains heat.
surfT ∞T
Heat conducted to the cover-air interface is equal to the sum of heat losses by convection and radiation.
radconvconder qqqq ′′+′′=′′=′′cov (14) Expanding the individual terms become
40( ) /( ) ( ) (gascover
surf surf c sky surfcover gas
LLT T T T h T Tk k
ε σ∞ ∞− + = − + 4 )− (15)
where, and are the cover thickness and biogas thickness, respectively. coverL gasL Convective heat transfer coefficient of air ( was calculated from Nusselt Number (Nu) by treating the digester as a flat plate as (Datta, 2002)
)ch
7

⎪⎭
⎪⎬
⎫
⎪⎩
⎪⎨
⎧
>
<==
∞ 631
54
531
21
cov
103RePrRe037.0
102RePrRe664.0
x
xkLh
Nu erc (16)
where, Pr is Prandtl number assumed to be 0.70, Re is Reynolds number calculated as ν/)(Re cov erLu∞= , is conductivity of air, is ambient air velocity, ∞k ∞u ν is kinematic air viscosity, skyε is emissive coefficient of sky, which is assumed to be 1.0, and σ is Stefen-Boltzmann constant. The cover surface temperature ( ) was a dynamic quantity, which must be solved iteratively by Eq. (15).
surfT
Total heat exchange between the covering material and ambient air was, therefore
cover cover coverQ q A= (17) where, A is surface area of the cover material. cover Temperature Profile through the Ground Heat loss from the anaerobic digester to the ground occurs along the four walls and floor. Heat exchange between the ground and digester walls was characterized as partly steady state and partly transient. The transient part occurs where the temperature of the ground changes with time and depth and the steady state part (constant temperature) occurs below it. The depth where these two conditions interface is a moving boundary. In order to determine heat loss through the digester walls, a temperature profile through the ground at the interface of the exterior digester wall and ground needs to be defined.
Temperature profile through the transient section of the ground was calculated by modeling the ground as a semi-infinite region and is expressed as (Wang, 1998)
444 3444 2143421
functionperiodic
0soil0amplitude
etemperatur
yt
F)t,y( )yt
tt2(coseATT 0soil
απ
−π
=− απ
−
(18)
where, is ground temperature at any depth and time t, is temperature amplitude at ground surface,
T(y ,t ) y FA
soilα is thermal diffusivity of soil, is time length of a year, and 0t T is ground mean surface temperature. Thermal diffusivity of soil ( ) is a function of density, specific heat and thermal conductivity. These properties of soil can be highly variable depending on the nature of the soil and its moisture content. In this case, a representative range of thermal diffusivities could be estimated and run the model to assess the effect of on heat loss.
soilα
soilα
8
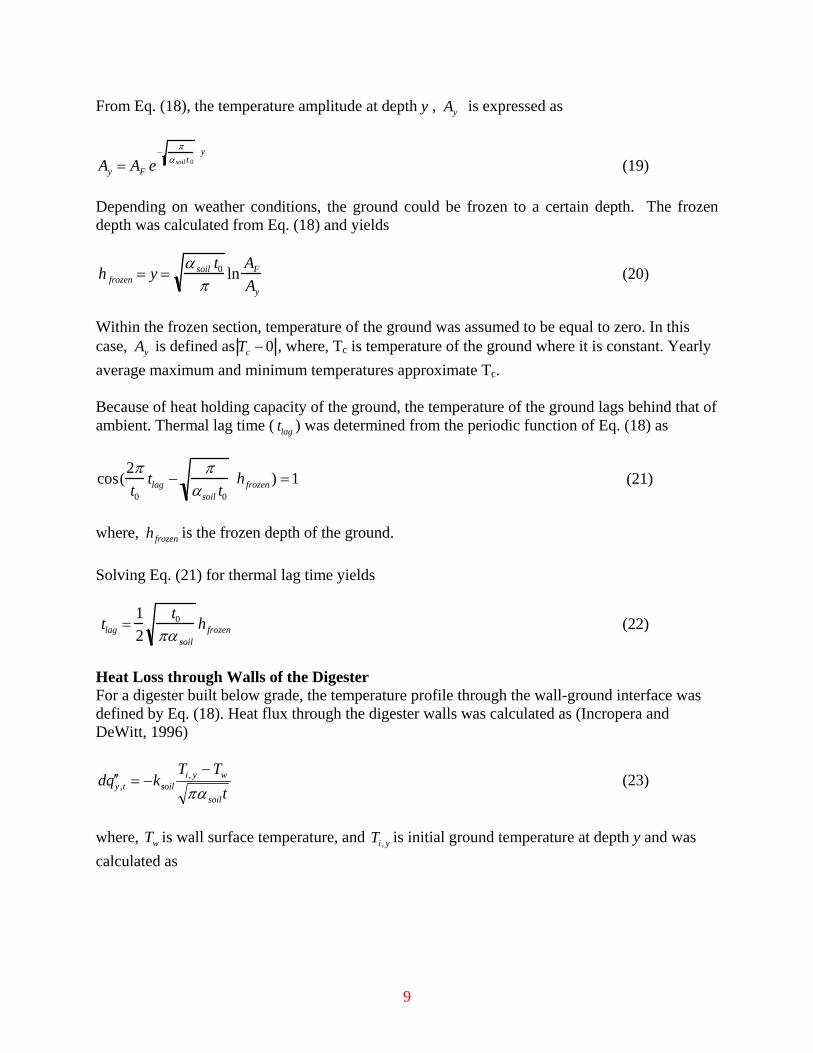
From Eq. (18), the temperature amplitude at depth , is expressed as y yA
Ay = AF e− π
αsoil t 0y
(19) Depending on weather conditions, the ground could be frozen to a certain depth. The frozen depth was calculated from Eq. (18) and yields
h frozen = y =α soil t0
πln
AF
Ay
(20)
Within the frozen section, temperature of the ground was assumed to be equal to zero. In this case, is defined asyA Tc − 0 , where, T is temperature of the ground where it is constant. Yearly average maximum and minimum temperatures approximate T .
c
c Because of heat holding capacity of the ground, the temperature of the ground lags behind that of ambient. Thermal lag time ( ) was determined from the periodic function of Eq. (18) as tlag
cos(2πt0
tlag −π
αsoil t0
hfrozen ) =1 (21)
where, is the frozen depth of the ground. frozenh Solving Eq. (21) for thermal lag time yields
tlag =12
t0
πα soil
h frozen (22)
Heat Loss through Walls of the Digester For a digester built below grade, the temperature profile through the wall-ground interface was defined by Eq. (18). Heat flux through the digester walls was calculated as (Incropera and DeWitt, 1996)
tTT
kqdsoil
wyisoilty απ
−−=′′ ,
, (23)
where, is wall surface temperature, and is initial ground temperature at depth y and was calculated as
wT yiT ,
9

Ti,y =0 for 0 ≤ y ≤ hfrozen
(y − hfrozen
h − hfrozen
) Tc for hfrozen < y ≤ h
⎧ ⎨ ⎪
⎩ ⎪ (24a)
this means that initial ground temperature was assumed to be zero for the frozen section, and changed linearly beyond the frozen section until it became constant. The term represents the depth of the digester.
yiT ,
h
For a condition when there was no freezing of the ground surface, that is, the temperature of the ground surface is above zero, was calculated as yiT ,
Tyh
TTT cyi +
−=, (24b)
Heat flux through the digester wall was calculated by integrating Eq. (23) as
dydtdqht
qt
ty
h
ty ∫ ∫=′′0 ,0
0, )1)(1( (25)
Conduction heat flux through the digester wall was calculated as
∑−
=′′=′′wall
wtywall R
TTqq )( 0, (26)
where, is total thermal resistance of the wall materials. ∑ wallR
wT is solved by combining Eqs. (25) and (26). The total heat loss from the four walls was then calculated as
wallsAwallqwallsQ "= (27)
where, A is total surface area of the digester. The shape of the digester could be rectangular or cylindrical as long as appropriate thermal resistance (
wall
∑ wallR ) and surface area for the shape are calculated. For anaerobic digesters built above grade level (but the floor is in the ground), in Eq. (26) is substituted by ambient air temperature ( ) and conduction heat flux through walls was calculated as
wT
∞T
∑∞−
=′′=′′wallRTT
tyqwallq)0(
, (28)
10

For anaerobic digesters built partially above grade level, heat loss from digester walls is calculated as
2,''
2,1,''
1, wallsAwallqwallsAwallqwallsQ += (29)
where, is heat flux through walls in contact with the ground and is calculated by Eqs.
(23) to (26); is heat flux through walls exposed to ambient air and is calculated by Eq.
(28), is wall surface area in contact with the ground; and is wall surface area
exposed to ambient air.
1,"wallq
2,"
wallq
1,wallsA 2,wallsA
Heat Loss through Digester Floor In a steady state condition, heat flux through the floor is equal to heat conducted to the ground, and was expressed as
floor
bfloor R
TTq∑
−=′′ )( 0 (30)
where, is total thermal resistance of the floor materials, and is temperature at the
floor-ground interface, which is defined as floor
R∑ bT
Tb =0 for h ≤ h frozen
Tc for h > h frozen
⎧ ⎨ ⎩
(31)
If the digester is above the frozen level, the temperature of the ground under the digester floor is considered to be transient. In this case, heat flux was calculated by modeling the ground as a semi-infinite region as (Incropera and DeWitt, 1996)
tTTkqdsoil
bisoiltb απ
−−=′′ , (32)
where, is initial ground temperature assumed to beiT T . Integrating Eq. (32) over time yields
soil
bisoilt
tbtbt
tTTkdtdq
tq
απ00 ,
0,
)(21 −−==′′ ∫ (33)
The temperature at the floor-soil interface (Tb ) is a dynamic quantity and was solved iteratively by combining Eqs. (30) and (33). Heat loss through the floor was then calculated as
11

floorfloorfloor AqQ ′′= (34) Weather Model Average daily temperature was calculated from the average of the day’s high and low temperatures at the site where the digester is located. Day’s high and low temperatures for the location were obtained from meteorological data (http://weather.com). Average daily temperature for a specific day of the year ( )( ndT ) was calculated from mean temperatures obtained from the meteorological data or calculated as (Timmons, 2002)
( ) minminmax 1
2)( YYYdT n +⎥
⎦
⎤⎢⎣
⎡+⎟
⎠⎞
⎜⎝⎛ −
= φ (35)
where, is maximum yearly temperature value of all mean daily values, is minimum yearly temperature value of all mean daily values,
maxY minY)sin( nd−−= λφ if ( ) 0<− λnd , and
)sin( λφ −+= nd if ( ) 0≥− λnd . 100=λ . The magnitude of λ was selected based on when the peak temperature of the year was desired to occur. It is constant for a particular location and phenomenon. For example, it would be different for temperature, solar radiation or precipitation. Solution Procedure
1. Input all required information such as the dimensions of the digester, thickness and thermal conductivities of the building materials used to build the digester, soil properties, and weather conditions, etc.
2. Solve Eqs. (3) – (10) to obtain heat gain from solar radiation ( ). solarQ3. Calculate heat required to raise manure temperature to the desired operating
temperature, using Eq. (13). inmanureQ ,
4. Solve Eqs. (14) – (17) to obtain heat loss (or gain) from the digester cover ( ) by Newton-Raphson algorithm.
coverQ
5. Calculate soil frozen depth in winter ( ) by Eq. (20). frozenh6. Calculate thermal lag time for frozen soil ( by Eq. (22). )tagt7. Solve Eqs. (23) – (29) to obtain heat loss from the digester walls ( ). wallQ8. Solve Eqs. (30) – (34) to obtain heat loss from the digester floor ( floorQ ).
9. Calculate total heat required for the digester ( ) by Eq. (2). heatingQ
10. Solve Eqs. (11) – (12) to obtain hot water flow rate ( ) and its temperature at the inlet ( ), and solve the heat loss from the hot water to manure inside the digester.
waterm•
hotT
EXPERIMENTAL MEASUREMENTS Two digesters, one located in Homer, NY and the other in York, NY, were instrumented to measure temperatures, flow rates and energy use. The digesters are plug-flow type built below grade level. Dimensions of the digester located in Homer, NY are: 31.6-m long, 9.1-m wide, 5.8-m deep, and has 3-mm thick soft-top cover made of Hypalon 45. This digester has no bottom
12

insulation. The reactor in York, NY is 36.5-m long, 15.2-m wide, 4.87-m deep, and the top cover consists of a 0.3-m thick concrete, 50-mm styrofoam and 305-mm earth cover. The walls are insulated with 76.2-mm styrofoam and the floor with 50.8 mm styrofoam. Ambient air temperature was measured and recorded every ten minutes using HOBO pro battery-operated data logger (Model H08-030-08, Onset Computer Corp.) mounted in a solar shield. The readings were converted into hourly and daily averages. Influent and effluent manure temperatures were measured using Hobo H8 outdoor/industrial data logger (Model H08-008-04) equipped with temperature probes (Model TMC50-HD). Temperature probes were lowered into the raw manure reception tank located before the digester and inside the digester at the effluent weir. These temperatures were recorded every 10 minutes and converted into hourly and daily averages. Two heat flux meters were used to measure heat exchange between the circulating water heating system and manure in the digester. Heat flux meters (Model TFXD and TFXP, Dynasonics Corp.), were non-invasive ultrasonic flow meters outfitted with two RTDs (Resistance Temperature Detector) and a 200,000-event electronic data logger. A flow meter was installed on the cold-water return pipe in the digester heating system as per the manufacturer’s specification. One RTD was mounted on the outside of the steel hot-water pipe and the second was mounted on the steel cold-water return pipe. Heat sink compound was used between the RTD and the steel pipe to facilitate heat transfer from the pipe to the RTD. Polyethylene foam pipe insulation was used to wrap the pipes and RTDs to limit ambient temperature effects on the RTDs. All measurements were recorded every minute. The influent volume was estimated from the manure pump run-time and the volume of manure the pump was calibrated to pump every minute. Pump run-time was determined using Hobo H8 outdoor/industrial data logger (Model H08-008-04) with Onset Computer Corporation split core AC current sensor, (Model CTV-C 0-100 amp). Data was recorded every minute. When AC current was over 0.6 amps, the pump was determined to be running. As a safety factor, a second data logger was mounted on the manure pump as well. The AC field sensor motor on/off data logger was also from Onset Computer Corporation (Model HO6-004-02). This logger records if the motor is turned on or off within 0.5 seconds after the pump was turned on. Pump run-time was recorded daily. RESULTS AND DISCUSSION From the principles of energy conservation and transient heat transfer, the model predicts (1) solar load on the digester, (2) heat loss through cover, walls and floor of the digester, and (3) heat required to maintain a constant operating temperature inside the digester. Predictions can be made for each day of the year. From daily predictions, average monthly and yearly energy requirements to run the digester at the desired temperature can be obtained. Model inputs are grouped into six categories. They are: (1) information pertaining to the anaerobic digester, such as configuration (rectangular, cylindrical), physical dimensions (length, width, height, radius), location (latitude, elevation), and installation (below grade, above grade, partially above grade); (2) information pertaining to materials used to construct the digester, such as wall and floor thickness, thickness of insulation, thermal conductivity, and solar transmissivity
13

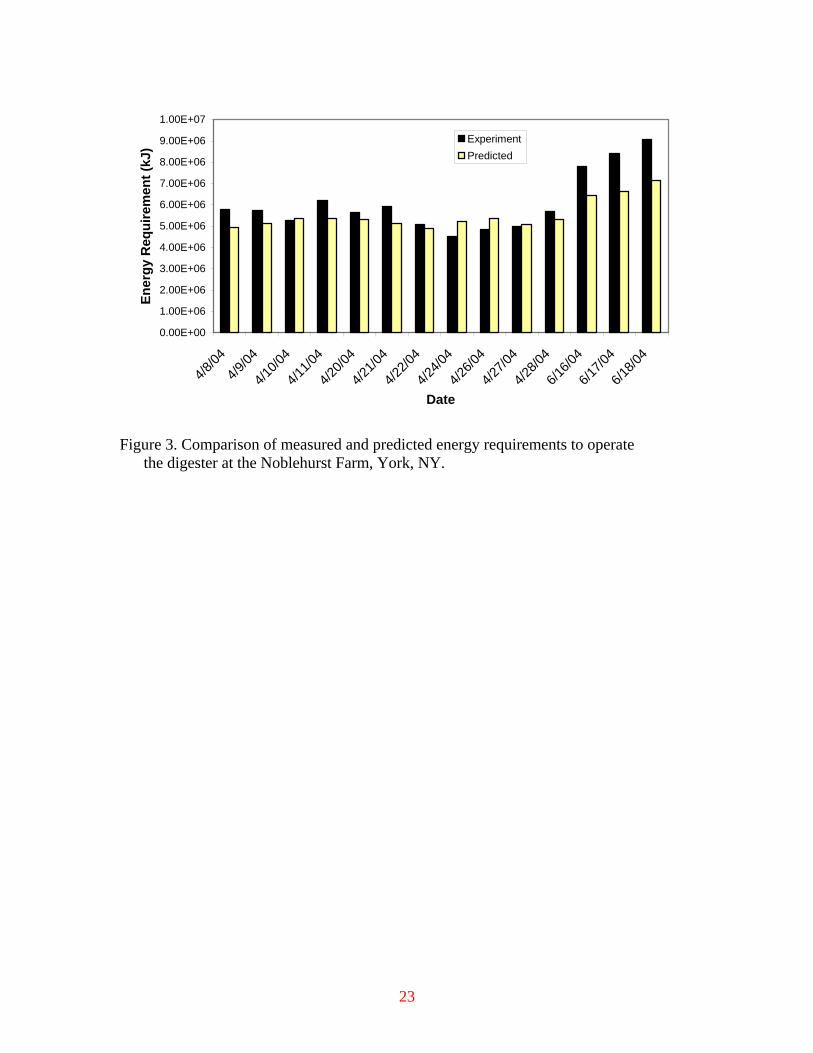
of covering material; (3) information pertaining to soil surrounding the digester, such as density, thermal conductivity, and specific heat; (4) information pertaining to manure influent, such as density, thermal conductivity, flow rate and temperature; (5) information on weather conditions, such as mean daily temperature, wind speed, and sky conditions; and (6) information pertaining to operating requirements of the anaerobic digester, such as temperature and retention time. Input and output information are organized in an easy to use format so that the model can serve as an application tool for evaluating anaerobic digesters at any geographic location any time of the year. The heat transfer model was validated against measured data from two digesters located in Upstate New York – one located in Homer (DDI Farm) and the other in York (Noblehurst Farm). Comparisons of predicted and measured heat requirements to operate the digesters at specified temperatures agreed reasonably well with the exception of day 03/05/04 (Table 1), which resulted in 20.26% error. The reason for this larger error for this particular day is not evident to us at this point. A paired t test was performed on the actual and predicted values in Table 1 including the data of 03/05/04. The 95% confidence interval about the mean contains zero and the P-value was 0.197 suggesting that there is no statistically significant difference between the measured and predicted values. The measured and predicted values are graphically shown in Figure 2. Comparison of measured and predicted energy requirements for the anaerobic digester in Noblehurst, Farm, York, NY is given in Table 2. The increase in measured heat on 06/16/04 – 06/18/04 was due to an operator error. The operating temperature of the digester was inadvertently elevated from 37.8 on 06/11/04 to an approximately 41.1 on 06/18/04. In the model, a constant operating temperature of 37.8 was used – thus the reason for the higher error. A similar paired t test was performed on the actual and predicted values (Table 2) including the last three data values that are in error. The 95% confidence interval about the mean did not contain zero and the P-value was 0.020 suggesting that there is statistically significant difference between the measured and predicted values. However, when the last three data points were treated as outliers and are excluded in the analysis, the 95% confidence interval about the mean does contain zero and the P-value was 0.166 suggesting no statistically significant difference between the measured and predicted values. The measured and predicted values are graphically shown in Figure 3. Heating requirement data were collected from these two digesters during a different project. The method of data collection was discussed previously.
C0 C0
C0
Simulations were conducted for three temperatures to compare energy requirements to operate the plug-flow digester at Homer, NY. The digester was operated at 37.8ºC. The three temperatures were: (1) a hot summer day (July 20 , 2003), (2) a cold winter day (January 20th, 2004), and (3) for each month of 2003. The digester is located at 40-deg latitude, and an elevation of 150-m. The plug-flow digester considered in the simulation was built entirely below grade level with dimensions of 31.6-m long, 9.1-m wide, and 5.8-m high. The material and thickness obtained were: concrete walls and floor = 300-mm thick, synthetic covering material = 3-mm thick, and walls and floor insulation = 50-mm thick. Thermal conductivities of the covering material, digester walls, floor and insulation assumed were: 0.33, 1.5, 1.5, and 0.15 W/m-K, respectively. Properties of the surrounding soil were assumed to have a density of a
th
14

1,450 kg/m , a specific heat of 0.835 kJ/kg-C, and a heat conductivity of 1.0 W/m-K. The influent manure was pumped at a flow rate of 60 m /day and at a temperature of 8ºC for January 20 and 30ºC for July 20 . Effluent manure density was assumed to be 970-kg/m with thermal conductivity of 3.84 W/m-K. Weather conditions for the site on January 20 , 2003 were: –5ºC for mean ambient air temperature, 6 m/s wind speed and clear sky conditions. For July 20th, 2003, the corresponding values were: 30ºC, 6 m/s, and clear sky conditions, respectively. Manure inside the digester was maintained at 37.8ºC and the retention time was assumed to be 22 days.
3
3
th th 3
th
Predicted heat flows for the conditions listed above are given in Table 3. As expected, solar load on July 20 was greater than on January 20 because of higher solar intensity and longer solar time. Heat required to maintain digester operation temperature on January 20 was more than 2.5 times than was required on July 20 . This increased energy requirement was necessary to bring the influent manure to the desired operating temperature and to compensate for increased heat loss, particularly through the digester walls. On January 20 , 65.9% of the total heat loss was due to raising the temperature of the influent manure, 23.7% was lost through the digester walls and 10.5% through the floor. On July 20 , the corresponding numbers are: 45.0%, 30.2% and 27.4%, respectively. The actual heat loss through the walls is higher in January 20 than in July 20 because of higher temperature gradient whereas heat loss through the digester floor is the same for both dates (Table 3). The percentages, however, indicate the opposite because of higher total energy requirement in January 20 than in July 20 (Table 3). Heat loss from the top covering material was negligible when compared to the heat loss through the walls and floor because of its low thermal conductivity.
th th
th
th
th
th
th
th
th th
On January 20 , heat loss through the walls was much higher than through the floor. This difference was due to the greater temperature gradient between the digester walls and the surrounding soil. However, on July 20 , the difference in heat loss between walls and floor was not as high because in summer, the ground temperature surrounding the digester walls was approaching the temperature of the floor.
th
th
When the influent manure temperature was pre-heated by an increase of 1ºC, the energy requirement decreased by 224,300 kJ/day, which is considerable. This is due to high flow rate (60 m /day) used. Considerable energy could be saved if the influent manure could be pre-heated before delivering it into the digester. The effluent manure heat is a potential source.
3
Energy requirements for a day in a month for year 2003 are given in Figure 4. These values are normalized for number of days in each month. These values reflect average daily energy requirements as a function of ambient temperature (assuming an average temperature for each day of the month). Input parameters necessary to generate these results are given in Table 4. As expected, less energy was required to operate the anaerobic digester in June through August, the lowest being in July and more energy was required in November through March. These results are consistent with expectations because of weather conditions. The relative consistency in energy requirements in November through March was because of frozen ground surrounding the digester, and thus requires additional heat to raise the influent manure temperature.
15

CONCLUSIONS A comprehensive model based on the principles of energy conservation was developed. The model accounts for incident solar radiation, transient temperature profile of the ground surrounding the digester walls, and periodic weather conditions. The model is validated against experimental data measured from two plug-flow anaerobic digesters built below grade level operating in Upstate New York. The following conclusions can be drawn from this study:
1. A fundamentally based heat transfer model that predicts energy requirements to operate a plug-flow anaerobic digester at any environmental condition was developed.
2. Predicted results of the model were validated against measured energy data from two
operating plug-flow anaerobic digesters. The results compared reasonably well.
3. Based on predicted energy requirements for 2003, low energy was required to operate the anaerobic digesters in June through August, the lowest being in July and more energy was required in November through March. Monthly energy requirements were higher and relatively consistent from November through March because of frozen ground. Operation during this time period required more heat to raise influent manure temperature.
4. For a flow rate of 60 m /day, an increase of 1ºC in influent manure temperature resulted
in a saving of 224,300 kJ/day of energy. Considerable energy could be saved if effluent manure heat was used to pre-heat influent manure.
3
REFERENCES
1. Alpert, J.E., S.C. VanDemark, D.D. Fritton, and D. R. DeWalle. 1976. Soil temperatures and heat loss for a hot water pipe network buried in irrigated soil. J. of Environmental Quality, Vol. 5(4):24-48.
2. Campbell, G.S, and Norman, J.M. 1998. An Introduction to Environmental
Biophysics. Springer-Verlag New York, Inc. 3. Chen, Y.R. and A.G. Hashimoto. 1980. Energy requirements for anaerobic
fermentation of livestock wastes. Proceedings of the Fourth International Symposium on Livestock Wastes, Amarillo, Texas, April 15-17. In: Livestock Waste: A Renewable Resource, pp.117-121.
4. Crosby, R. 2002. Household anaerobic digester. Available at:
http://biorealis.com/digester/left_const.html (accessed in Spring, 2004). 5. Datta, A. 2002. Biological and environmental heat and mass transfer. Marcel
Dekker, Inc. New York. 6. Fisher, J.R.,E.L.Iannotti and J. Durand. 1983. Anaerobic digestion of animal
manure. In: Alternative Energy in Agriculture, Vol.II:129-149.
16
7. Hashimoto, A.G. and Y.R. Chen. 1979. The overall economics of anaerobic
digestion. First International Symposium on Anaerobic Digestion. University College, Cardiff, Wales, England, September 17-21.
8. Hills, L.A. 1986. Analysis and optimum design of a methane digester for use on
dairy farms. Unpublished M.S. Thesis. Department of Biological and Environmental Engineering, Cornell University, Ithaca, NY.
9. Incropera, F.P. and D.P. DeWitt. 1996. Fundamentals of heat and mass transfer,
4 Ed. John Wiley & Sons, New York. th
10. Jumikis, A.R. 1977. Thermal Geotechnics. Rutgers University Press. New
Brunswick, New Jersey. 11. Minott, S.J. 2002. Feasibility of fuel cells for energy conversion on the dairy
farm. Thesis. Cornell University, Ithaca, NY. 12. Rykbost, K.A., L. Boersma and G.D. Jarman. 1976. Soil temperature increases
induced by subsurface line heat sources. Agronomy Journal, Vol. 68 (1):94-99. 13. SunPath Users Guide. Downloaded: June, 2003. Available at:
http://solar.anu.edu.au/Sun/help/SPguide.html. 14. Timmons, M.B, J.M. Ebeling, F.W. Wheaton, S.T. Summerfelt, and B.J. Vinci.
Recirculating Aquaculture System. 2 edition. 2002. NRAC Publication No. 01-002.
nd
15. Walker, L. P., R.A. Pellerin, M.G. Heisler, G.S. Farmer and L.A. Hills. 1985.
Anaerobic digestion on a dairy farm: overview. Energy in Agriculture, 4: 347-363.
16. Wang, B. 1998.Engineering heat and mass transfer. Scientific Press. Beijing,
China.
17

Table 1. Comparison of measured and predicted energy requirements to operate the digester at the DDI Farm, Homer, NY.
Day Measured (kJ)
Predicted (kJ)
Error (%)
03/05/04 8,883,709 8,857,616 0.2903/09/04 8,594,128 6,852,217 20.2603/22/04 7,445,797 7,225,984 2.9504/08/04 8,941,712 8,571,288 4.1404/09/04 8,469,760 8,777,583 3.605/06/04 9,076,309 8,727,653 3.8405/07/04 8,134,030 8,031,191 1.26
18

Table 2. Comparison of measured and predicted energy requirements to operate the digester at the Noblehurst Farm, York, NY.
Day Measured (kJ)
Predicted (kJ)
Error (%)
04/08/04 5,787,598 4,937,950 14.6804/09/04 5,754,576 5137223 10.7204/10/04 5,281,826 5,381,555 -1.8804/11/04 6,226,771 5,353,754 14.0204/20/04 5,662,041 5,302,989 6.3404/21/04 5,935,566 5,129,138 13.5804/22/04 5,099,039 4,906,205 3.7804/24/04 4,540,980 5,243,488 -15.4704/26/04 4,845,976 5,351,896 -10.4404/27/04 5,001,476 5,083,461 -1.6304/28/04 5,683,141 5,310,655 6.5506/16/04 7,815,336 6,450,009 17.46*
06/17/04 8,388,814 6,610329 21.20*
06/18/04 9,059,308 7,153,931 21.03*
*The increase in measured heat was due to an operator error. The operating temperature of the digester was inadvertently elevated from 37.8 C on 6/11/04 to an approximately 41.1 C on 6/18/04. 0 0
In the model, a constant operating temperature of 37.8 C was used – thus 0
the reason for the higher error.
19

Table 3. Heat flow through the different components for January 20 and July 20 th th
for the DDI Farm, Homer, NY.
Heat gain Heat loss Energy required
Date
solarQ ( kJ)610−×
massQ ( kJ)610−×
coverQ ( kJ)610−×
wallQ ( kJ)610−×
floorQ ( kJ)610−×
requiredQ ( kJ)610−×
Januay 20 th
July 20 th
0.03
0.1
6.67
1.74
0.02
0.003
2.40
1.17
1.06
1.06
10.12
3.87
20

Table 4. Input information for the results in Table 4 for the DDI Farm, Homer, NY.
Month Jan Feb Mar Apr May Jun Jul Aug Sep Oct Nov DecMax.
ambient temperature
( )Co
-0.8
0.3
5.9
13.3
20.2
24.9
27.6
26.1
22.0
15.7
8.9
1.9
Min. ambient
temperature ( )Co
-9.9
-9.2
-3.8
1.9
7.8
12.1
15.0
14.3
10.8
5.0
0.6
-6.0
Mean wind speed (m/s)
6.0
6.0
6.0
6.0
6.0
6.0
6.0
6.0
6.0
6.0
6.0
6.0
Sky condition
0.8
0.8
0.8
0.8
0.8
0.8
0.8
0.8
0.8
0.8
0.8
0.8
Influent manure
temperature ( )Co
8.0
8.0
8.0
7.6
14.0
18.5
21.3
20.0
16.4
10.3
4.7
8.0
Sky conditions = 0.8 is equivalent to a “partial cloudy day”. Manure flow rate = 60 daym /3
1Transactions of ASAE, 2005, Vol. 48(2): 777-785.

0.00E+00
1.00E+06
2.00E+06
3.00E+06
4.00E+06
5.00E+06
6.00E+06
7.00E+06
8.00E+06
9.00E+06
1.00E+07
3/5/04 3/9/04 3/22/04 4/8/04 4/9/04 5/6/04 5/7/04
Date
Ener
gy R
equi
rem
ent (
kJ)
Experiment
Predicted
Figure 2. Comparison of measured and predicted energy requirements to operate the digester at the DDI Farm, Homer, NY.
22
0.00E+00
1.00E+06
2.00E+06
3.00E+06
4.00E+06
5.00E+06
6.00E+06
7.00E+06
8.00E+06
9.00E+06
1.00E+07
4/8/04
4/9/04
4/10/0
4
4/11/0
4
4/20/0
4
4/21/0
4
4/22/0
4
4/24/0
4
4/26/0
4
4/27/0
4
4/28/0
4
6/16/0
4
6/17/0
4
6/18/0
4
Date
Ener
gy R
equi
rem
ent (
kJ)
ExperimentPredicted
Figure 3. Comparison of measured and predicted energy requirements to operate
the digester at the Noblehurst Farm, York, NY.
23

0
2
4
6
8
10
12
Jan Feb Mar Apr May Jun Jul Aug Sep Oct Nov Dec
Day of a Month
Ave
rage
Dai
ly H
eat R
equi
rem
ent
(kJx
1.0E
6)
Figure 4. Predicted daily heat requirement for each day of a month to operate the example digester at 37.8 . Monthly values are normalized for the number of days in each month.
C0
24