heat loss test and estimate for the large-scale …...heat loss test and estimate for the...
TRANSCRIPT
Send Orders for Reprints to [email protected]
The Open Petroleum Engineering Journal, 2015, 8, 117-125 117
1874-8341/15 2015 Bentham Open
Open Access
Heat Loss Test and Estimate for the Large-scale Floating Roof Tank
Jian Zhao*, Hang Dong, Li X. Wei and Yang Liu
Oil and Gas Transportation and Storage Department, Northeast Petroleum University, Daqing, 163318, P.R. China
Abstract: The heat loss and surface temperature of the top surface and sidewall of large-scale floating roof tank is tested
by the heat flow meter and surface temperature method. Based on the test data, the heat loss from the top surface is about
twice more than that of the sidewall which means the top surface is the weakest insulation part of the floating roof tank.
On the surface, the heat loss profile is in accord with the surface temperature distribution. Special attention is given on the
calculation of thermal conductivity for the top surface and sidewall which finally deduced the total heat transfer coeffi-
cient of large floating roof tank. Moreover, the heat loss of floating roof tank in different working conditions is predicted.
According to the calculation results, the level of 6m is regarded as a critical level determining the heat loss. And the cen-
tralization storage of oil is a more energy conservation storage pattern.
Keywords: Floating roof tank, heat loss, test, total heat transfer coefficient.
1. INTRODUCTION
Nowadays, in order to avoid the energy crisis, an increas-ing attention is given on the energy storage in many coun-tries. As one of the most important primary energy, the stor-age of crude oil always dominates in the existing energy sys-tem. With the increasing storage scale of crude oil, the heat dissipation during the storage course draws many people’s attention. Especially in the cold region, for the storage of waxy crude oil, the heat loss is considerable. For many large crude oil depot, the floating roof tank has become the pre-ferred facility to store oil. But due to the specific construc-tion, the heat loss from the different part of the tank is diffi-cult to ascertain.
Normally, the theoretical calculation based on the heat transfer theory is induced to investigate the heat loss, Busson and miniscloux [1] developed a simple model to predict the steady state heat losses from a fuel oil tank based on the as-sumption of a well-mixed core of fluid. Kumana and Kothari [2] proposed empirical correlations for heat transfer coeffi-cients of the tank and published a model to predict the cool-ing rate of oil. Venart [3] solved the governing natural con-vection equations to investigate the steady state heat losses from a fuel oil tank. Cotter and Michael [4-6] presented a simplified heat loss model based on the numerical calcula-tion of heat transfer in the oil tank. Moreover, the effect of heat transfer coefficient, aspect ratio and temperature de-pendent viscosity on the fluid flow and heat transfer was examined. In general, most research takes the dome roof tank as the research object, the heat loss rule of which is very different from the float roof tank due to the different roof construction. Together with the complex heat transfer course which is difficult to characterized, the actual measurement is still regarded as the most effective method.
As mentioned above, the actual measurement of heat loss from floating roof tank has not been reported in the litera-ture. The aim of this work is to investigate the heat loss from the different part of the floating roof tank, and special atten-tion is given on the heat flux from the top surface and the calculation of thermal conductivity for air layer in the top surface. The surface temperature of the tank is also tested to estimate the inner temperature profile of oil. Moreover, the total heat transfer coefficient of large floating roof tank is proposed to predict the heat loss in different working condi-tion which is significant for the management of the oil depot, in the meantime provides the basis for the energy-saving and efficient storage of crude oil.
2. EXPERIMENTAL STUDIES
2.1. Test Principles
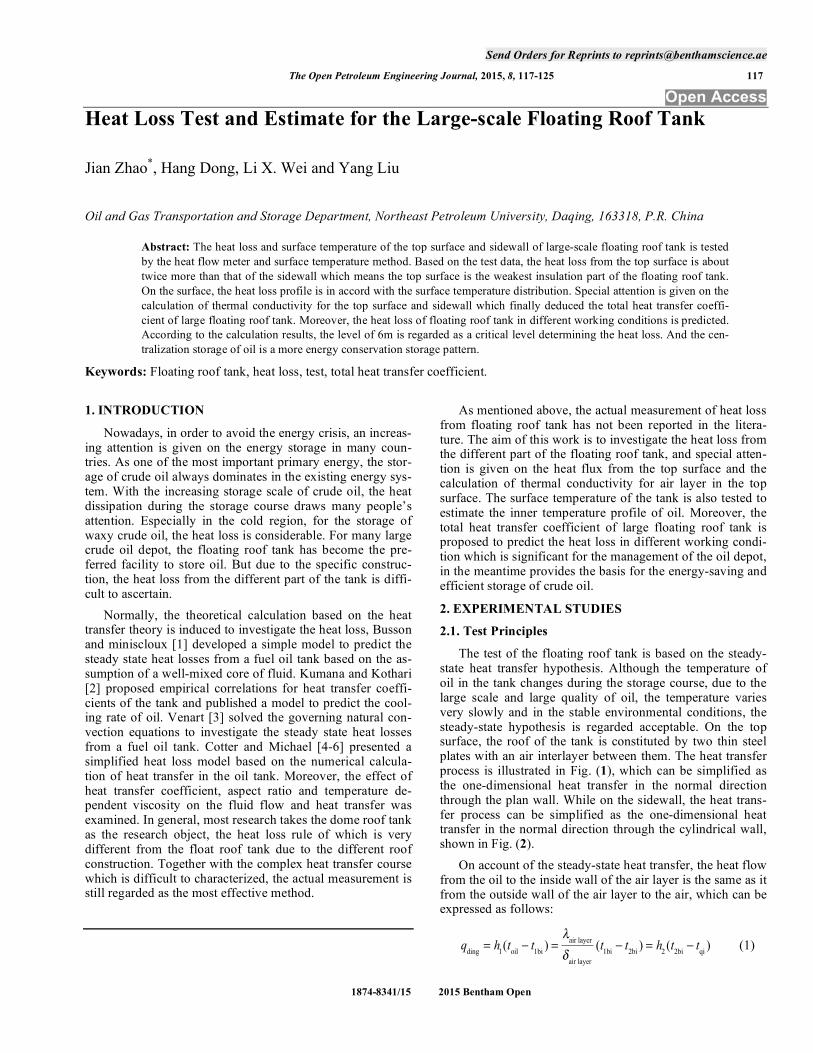
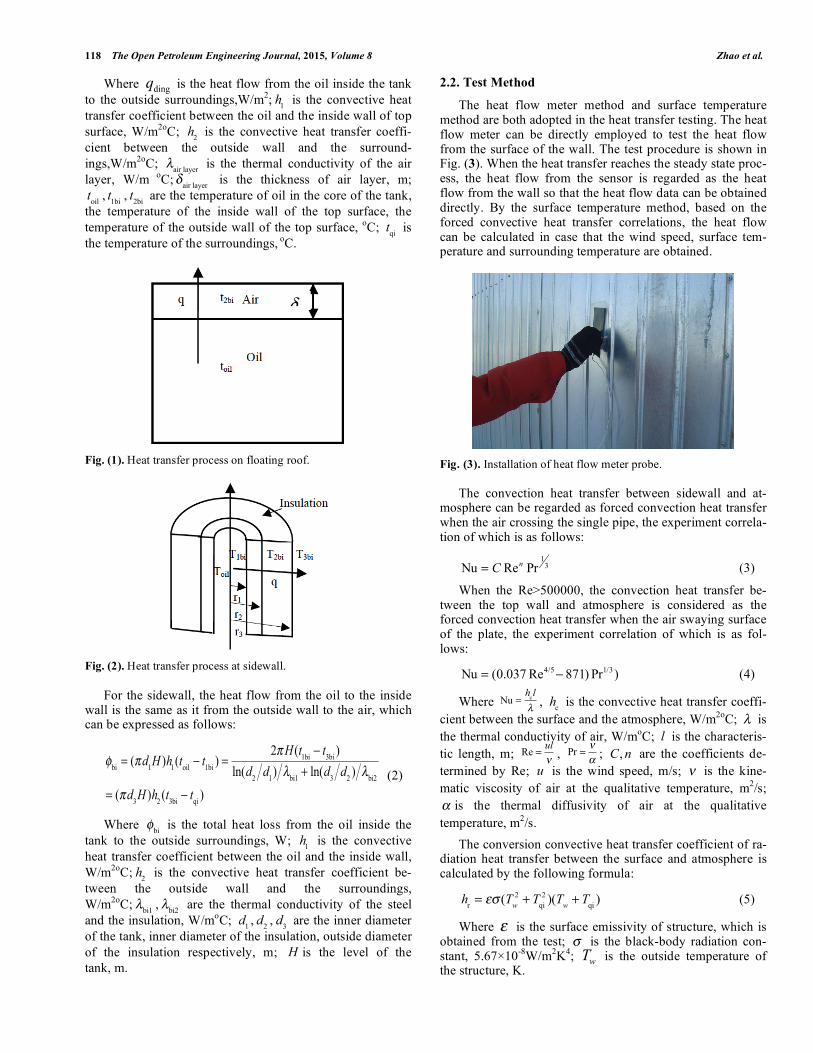
The test of the floating roof tank is based on the steady-state heat transfer hypothesis. Although the temperature of oil in the tank changes during the storage course, due to the large scale and large quality of oil, the temperature varies very slowly and in the stable environmental conditions, the steady-state hypothesis is regarded acceptable. On the top surface, the roof of the tank is constituted by two thin steel plates with an air interlayer between them. The heat transfer process is illustrated in Fig. (1), which can be simplified as the one-dimensional heat transfer in the normal direction through the plan wall. While on the sidewall, the heat trans-fer process can be simplified as the one-dimensional heat transfer in the normal direction through the cylindrical wall, shown in Fig. (2).
On account of the steady-state heat transfer, the heat flow from the oil to the inside wall of the air layer is the same as it from the outside wall of the air layer to the air, which can be expressed as follows:
qding
= h1(t
oilt1bi
) =air layer
air layer
(t1bi
t2bi
) = h2(t
2bitqi
) (1)
118 The Open Petroleum Engineering Journal, 2015, Volume 8 Zhao et al.
Where dingq is the heat flow from the oil inside the tank
to the outside surroundings,W/m2; h1
is the convective heat
transfer coefficient between the oil and the inside wall of top
surface, W/m2o
C; h2 is the convective heat transfer coeffi-
cient between the outside wall and the surround-
ings,W/m2o
C; air layer
is the thermal conductivity of the air
layer, W/m o
C; air layer
is the thickness of air layer, m;
toil
, t1bi
, t2bi
are the temperature of oil in the core of the tank,
the temperature of the inside wall of the top surface, the
temperature of the outside wall of the top surface, oC;
tqi
is
the temperature of the surroundings, o
C.
Fig. (1). Heat transfer process on floating roof.
Fig. (2). Heat transfer process at sidewall.
For the sidewall, the heat flow from the oil to the inside
wall is the same as it from the outside wall to the air, which can be expressed as follows:
bi= ( d
1H )h
1(t
oilt1bi
) =2 H (t
1bit3bi
)
ln(d2
d1)
bi1+ ln(d
3d
2)
bi2
= ( d3H )h
2(t
3bitqi
)
(2)
Where bi
is the total heat loss from the oil inside the
tank to the outside surroundings, W; h
1 is the convective
heat transfer coefficient between the oil and the inside wall,
W/m2o
C; h
2 is the convective heat transfer coefficient be-
tween the outside wall and the surroundings,
W/m2o
C;bi1
,bi2
are the thermal conductivity of the steel
and the insulation, W/moC;
d
1, d
2, d
3 are the inner diameter
of the tank, inner diameter of the insulation, outside diameter
of the insulation respectively, m; H is the level of the
tank, m.
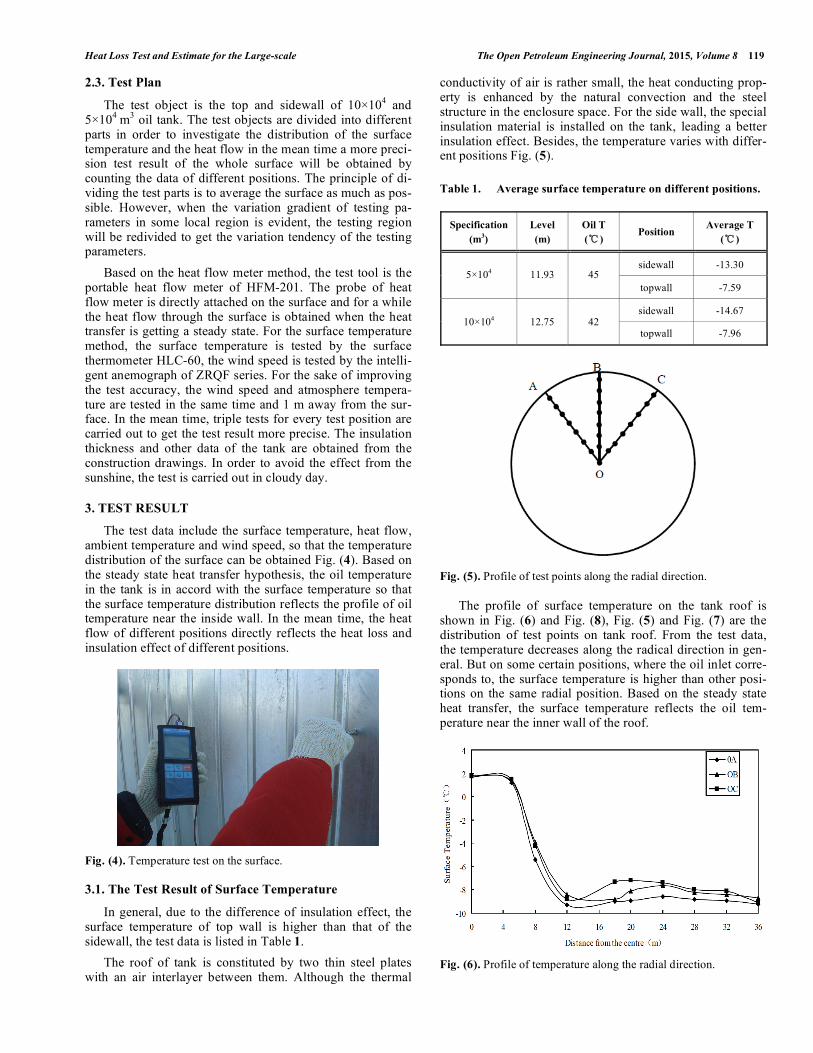
2.2. Test Method
The heat flow meter method and surface temperature method are both adopted in the heat transfer testing. The heat flow meter can be directly employed to test the heat flow from the surface of the wall. The test procedure is shown in Fig. (3). When the heat transfer reaches the steady state proc-ess, the heat flow from the sensor is regarded as the heat flow from the wall so that the heat flow data can be obtained directly. By the surface temperature method, based on the forced convective heat transfer correlations, the heat flow can be calculated in case that the wind speed, surface tem-perature and surrounding temperature are obtained.
Fig. (3). Installation of heat flow meter probe.
The convection heat transfer between sidewall and at-
mosphere can be regarded as forced convection heat transfer when the air crossing the single pipe, the experiment correla-tion of which is as follows:
Nu = C Ren
Pr1
3 (3)
When the Re>500000, the convection heat transfer be-tween the top wall and atmosphere is considered as the forced convection heat transfer when the air swaying surface of the plate, the experiment correlation of which is as fol-lows:
Nu = (0.037 Re4/5 871) Pr1/3 ) (4)
Where
Nu =h
cl
, h
c is the convective heat transfer coeffi-
cient between the surface and the atmosphere, W/m2o
C; is
the thermal conductivity of air, W/moC; l is the characteris-
tic length, m;
Re =ul
,
Pr = ; C, n are the coefficients de-
termined by Re; u is the wind speed, m/s; is the kine-
matic viscosity of air at the qualitative temperature, m2/s;
is the thermal diffusivity of air at the qualitative
temperature, m2/s.
The conversion convective heat transfer coefficient of ra-diation heat transfer between the surface and atmosphere is calculated by the following formula:
h
r= (T
w
2+ T
qi
2 )(Tw+ T
qi) (5)
Where is the surface emissivity of structure, which is obtained from the test; is the black-body radiation con-stant, 5.67 10
-8W/m
2K
4;
wT is the outside temperature of
the structure, K.
Heat Loss Test and Estimate for the Large-scale The Open Petroleum Engineering Journal, 2015, Volume 8 119
2.3. Test Plan
The test object is the top and sidewall of 10 104 and
5 104
m3 oil tank. The test objects are divided into different
parts in order to investigate the distribution of the surface temperature and the heat flow in the mean time a more preci-sion test result of the whole surface will be obtained by counting the data of different positions. The principle of di-viding the test parts is to average the surface as much as pos-sible. However, when the variation gradient of testing pa-rameters in some local region is evident, the testing region will be redivided to get the variation tendency of the testing parameters.
Based on the heat flow meter method, the test tool is the portable heat flow meter of HFM-201. The probe of heat flow meter is directly attached on the surface and for a while the heat flow through the surface is obtained when the heat transfer is getting a steady state. For the surface temperature method, the surface temperature is tested by the surface thermometer HLC-60, the wind speed is tested by the intelli-gent anemograph of ZRQF series. For the sake of improving the test accuracy, the wind speed and atmosphere tempera-ture are tested in the same time and 1 m away from the sur-face. In the mean time, triple tests for every test position are carried out to get the test result more precise. The insulation thickness and other data of the tank are obtained from the construction drawings. In order to avoid the effect from the sunshine, the test is carried out in cloudy day.
3. TEST RESULT
The test data include the surface temperature, heat flow, ambient temperature and wind speed, so that the temperature distribution of the surface can be obtained Fig. (4). Based on the steady state heat transfer hypothesis, the oil temperature in the tank is in accord with the surface temperature so that the surface temperature distribution reflects the profile of oil temperature near the inside wall. In the mean time, the heat flow of different positions directly reflects the heat loss and insulation effect of different positions.
Fig. (4). Temperature test on the surface.
3.1. The Test Result of Surface Temperature
In general, due to the difference of insulation effect, the surface temperature of top wall is higher than that of the sidewall, the test data is listed in Table 1.
The roof of tank is constituted by two thin steel plates with an air interlayer between them. Although the thermal
conductivity of air is rather small, the heat conducting prop-erty is enhanced by the natural convection and the steel structure in the enclosure space. For the side wall, the special insulation material is installed on the tank, leading a better insulation effect. Besides, the temperature varies with differ-ent positions Fig. (5).
Table 1. Average surface temperature on different positions.
Specification
(m3)
Level
(m)
Oil T
( ) Position
Average T
( )
sidewall -13.30 5 104 11.93 45
topwall -7.59
sidewall -14.67 10 104 12.75 42
topwall -7.96
Fig. (5). Profile of test points along the radial direction.
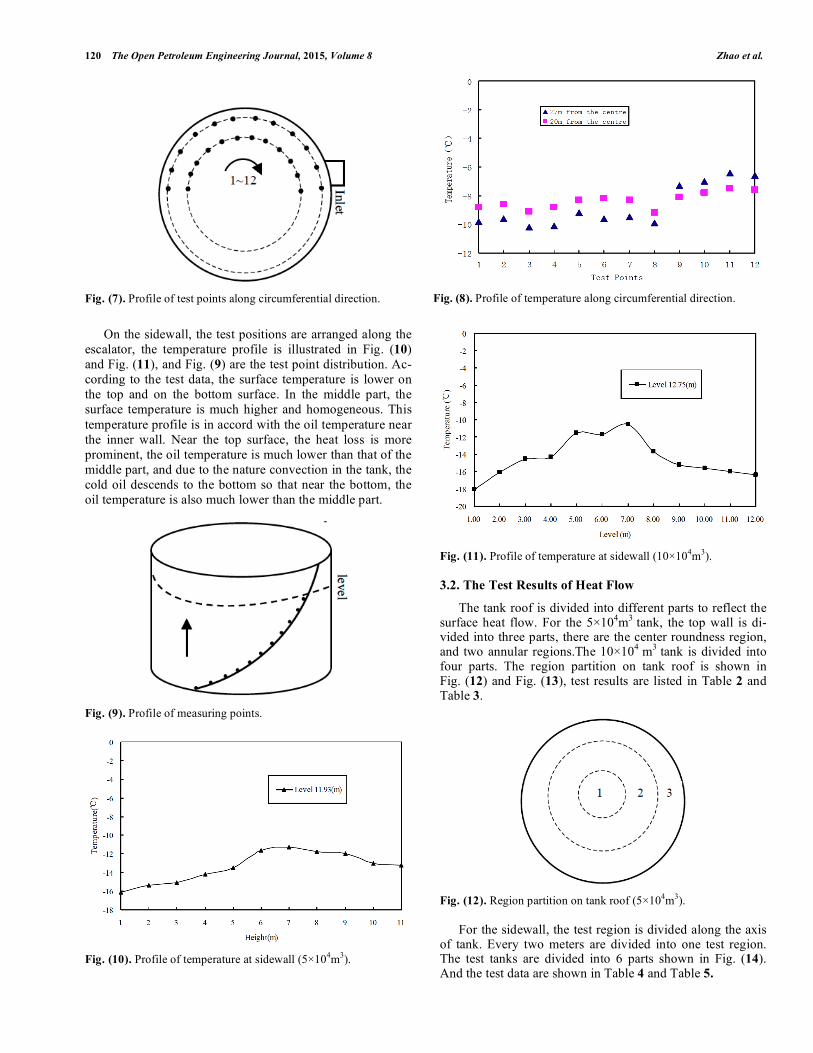
The profile of surface temperature on the tank roof is shown in Fig. (6) and Fig. (8), Fig. (5) and Fig. (7) are the distribution of test points on tank roof. From the test data, the temperature decreases along the radical direction in gen-eral. But on some certain positions, where the oil inlet corre-sponds to, the surface temperature is higher than other posi-tions on the same radial position. Based on the steady state heat transfer, the surface temperature reflects the oil tem-perature near the inner wall of the roof.
Fig. (6). Profile of temperature along the radial direction.
120 The Open Petroleum Engineering Journal, 2015, Volume 8 Zhao et al.
Fig. (7). Profile of test points along circumferential direction.
Fig. (8). Profile of temperature along circumferential direction.
On the sidewall, the test positions are arranged along the
escalator, the temperature profile is illustrated in Fig. (10)
and Fig. (11), and Fig. (9) are the test point distribution. Ac-
cording to the test data, the surface temperature is lower on
the top and on the bottom surface. In the middle part, the
surface temperature is much higher and homogeneous. This
temperature profile is in accord with the oil temperature near
the inner wall. Near the top surface, the heat loss is more
prominent, the oil temperature is much lower than that of the
middle part, and due to the nature convection in the tank, the
cold oil descends to the bottom so that near the bottom, the
oil temperature is also much lower than the middle part.
Fig. (9). Profile of measuring points.
Fig. (10). Profile of temperature at sidewall (5 104m
3).
Fig. (11). Profile of temperature at sidewall (10 104m
3).
3.2. The Test Results of Heat Flow
The tank roof is divided into different parts to reflect the surface heat flow. For the 5 10
4m
3 tank, the top wall is di-
vided into three parts, there are the center roundness region, and two annular regions.The 10 10
4 m
3 tank is divided into
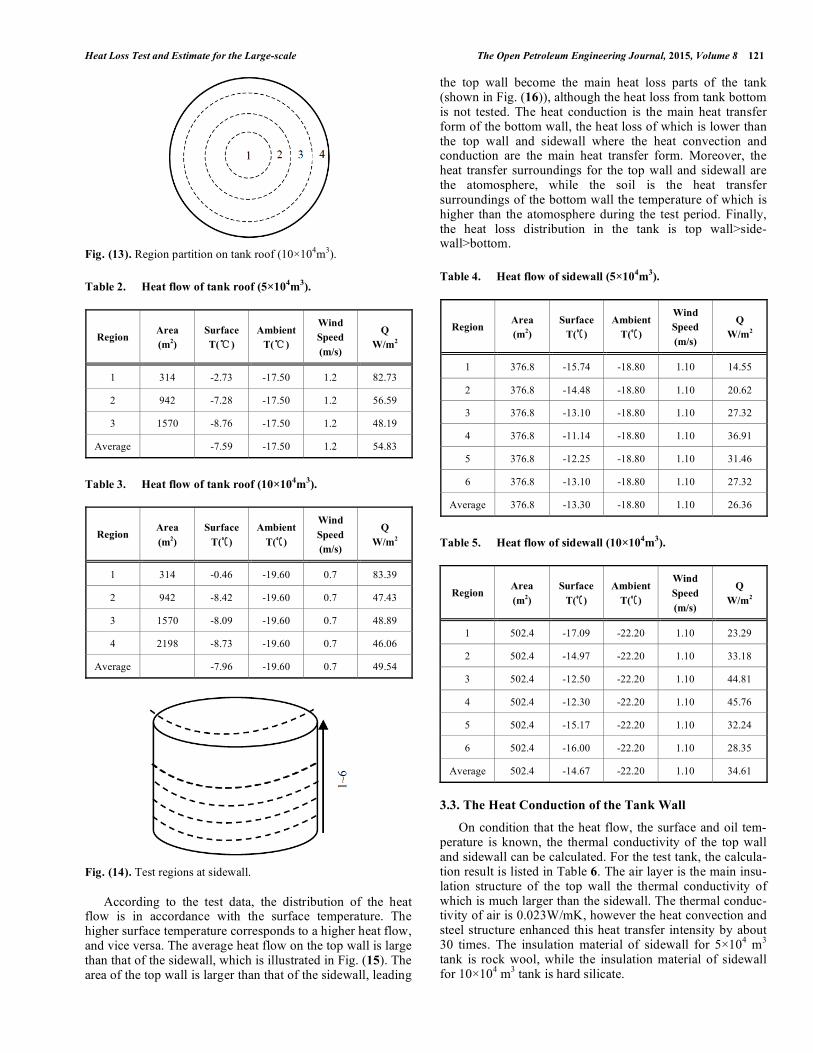
four parts. The region partition on tank roof is shown in Fig. (12) and Fig. (13), test results are listed in Table 2 and Table 3.
Fig. (12). Region partition on tank roof (5 104m
3).
For the sidewall, the test region is divided along the axis
of tank. Every two meters are divided into one test region. The test tanks are divided into 6 parts shown in Fig. (14). And the test data are shown in Table 4 and Table 5.
Heat Loss Test and Estimate for the Large-scale The Open Petroleum Engineering Journal, 2015, Volume 8 121
Fig. (13). Region partition on tank roof (10 104m
3).
Table 2. Heat flow of tank roof (5 104m
3).
Region Area
(m2)
Surface
T( )
Ambient
T( )
Wind
Speed
(m/s)
Q
W/m2
1 314 -2.73 -17.50 1.2 82.73
2 942 -7.28 -17.50 1.2 56.59
3 1570 -8.76 -17.50 1.2 48.19
Average -7.59 -17.50 1.2 54.83
Table 3. Heat flow of tank roof (10 104m
3).
Region Area
(m2)
Surface
T( )
Ambient
T( )
Wind
Speed
(m/s)
Q
W/m2
1 314 -0.46 -19.60 0.7 83.39
2 942 -8.42 -19.60 0.7 47.43
3 1570 -8.09 -19.60 0.7 48.89
4 2198 -8.73 -19.60 0.7 46.06
Average -7.96 -19.60 0.7 49.54
Fig. (14). Test regions at sidewall.
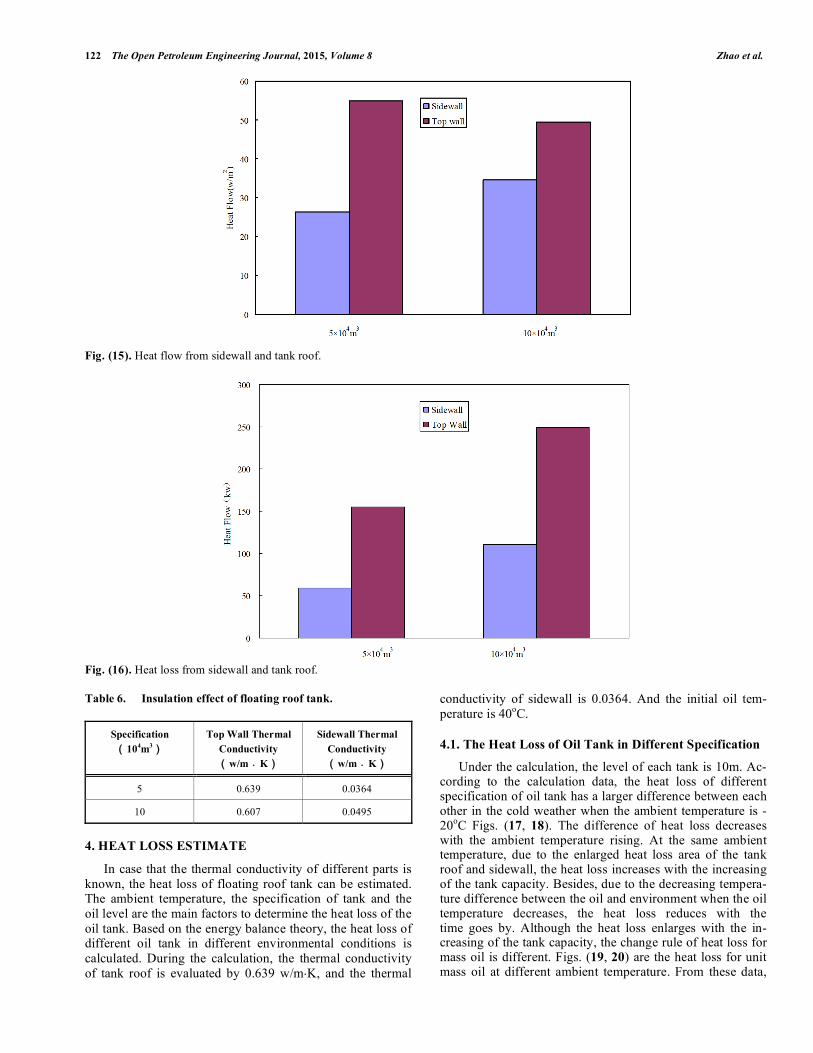
According to the test data, the distribution of the heat
flow is in accordance with the surface temperature. The higher surface temperature corresponds to a higher heat flow, and vice versa. The average heat flow on the top wall is large than that of the sidewall, which is illustrated in Fig. (15). The area of the top wall is larger than that of the sidewall, leading
the top wall become the main heat loss parts of the tank (shown in Fig. (16)), although the heat loss from tank bottom is not tested. The heat conduction is the main heat transfer form of the bottom wall, the heat loss of which is lower than the top wall and sidewall where the heat convection and conduction are the main heat transfer form. Moreover, the heat transfer surroundings for the top wall and sidewall are the atomosphere, while the soil is the heat transfer surroundings of the bottom wall the temperature of which is higher than the atomosphere during the test period. Finally, the heat loss distribution in the tank is top wall>side-wall>bottom.
Table 4. Heat flow of sidewall (5 104m
3).
Region Area
(m2)
Surface
T( )
Ambient
T( )
Wind
Speed
(m/s)
Q
W/m2
1 376.8 -15.74 -18.80 1.10 14.55
2 376.8 -14.48 -18.80 1.10 20.62
3 376.8 -13.10 -18.80 1.10 27.32
4 376.8 -11.14 -18.80 1.10 36.91
5 376.8 -12.25 -18.80 1.10 31.46
6 376.8 -13.10 -18.80 1.10 27.32
Average 376.8 -13.30 -18.80 1.10 26.36
Table 5. Heat flow of sidewall (10 104m
3).
Region Area
(m2)
Surface
T( )
Ambient
T( )
Wind
Speed
(m/s)
Q
W/m2
1 502.4 -17.09 -22.20 1.10 23.29
2 502.4 -14.97 -22.20 1.10 33.18
3 502.4 -12.50 -22.20 1.10 44.81
4 502.4 -12.30 -22.20 1.10 45.76
5 502.4 -15.17 -22.20 1.10 32.24
6 502.4 -16.00 -22.20 1.10 28.35
Average 502.4 -14.67 -22.20 1.10 34.61
3.3. The Heat Conduction of the Tank Wall
On condition that the heat flow, the surface and oil tem-perature is known, the thermal conductivity of the top wall and sidewall can be calculated. For the test tank, the calcula-tion result is listed in Table 6. The air layer is the main insu-lation structure of the top wall the thermal conductivity of which is much larger than the sidewall. The thermal conduc-tivity of air is 0.023W/mK, however the heat convection and steel structure enhanced this heat transfer intensity by about 30 times. The insulation material of sidewall for 5 10
4 m
3
tank is rock wool, while the insulation material of sidewall for 10 10
4 m
3 tank is hard silicate.
122 The Open Petroleum Engineering Journal, 2015, Volume 8 Zhao et al.
Fig. (15). Heat flow from sidewall and tank roof.
Fig. (16). Heat loss from sidewall and tank roof.
Table 6. Insulation effect of floating roof tank.
Specification
104m
3
Top Wall Thermal
Conductivity
w/m K
Sidewall Thermal
Conductivity
w/m K
5 0.639 0.0364
10 0.607 0.0495
4. HEAT LOSS ESTIMATE
In case that the thermal conductivity of different parts is
known, the heat loss of floating roof tank can be estimated. The ambient temperature, the specification of tank and the
oil level are the main factors to determine the heat loss of the
oil tank. Based on the energy balance theory, the heat loss of different oil tank in different environmental conditions is
calculated. During the calculation, the thermal conductivity
of tank roof is evaluated by 0.639 w/m.K, and the thermal
conductivity of sidewall is 0.0364. And the initial oil tem-
perature is 40oC.
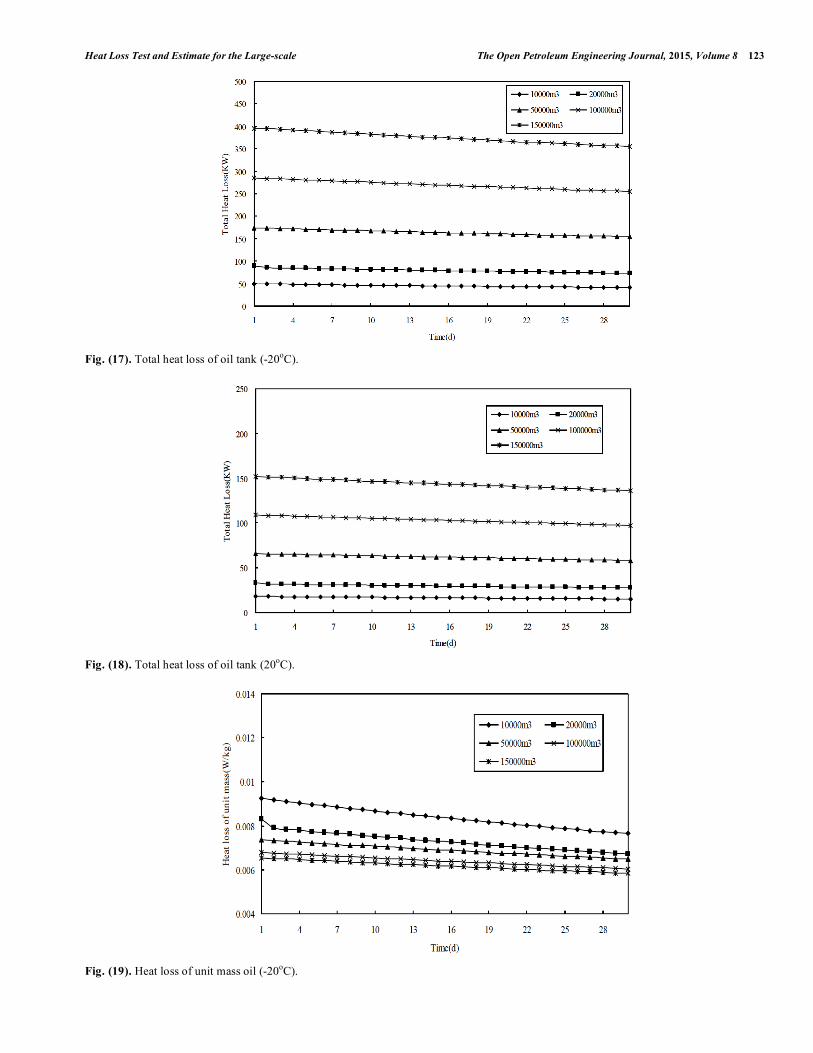
4.1. The Heat Loss of Oil Tank in Different Specification
Under the calculation, the level of each tank is 10m. Ac-cording to the calculation data, the heat loss of different specification of oil tank has a larger difference between each other in the cold weather when the ambient temperature is -20
oC Figs. (17, 18). The difference of heat loss decreases
with the ambient temperature rising. At the same ambient temperature, due to the enlarged heat loss area of the tank roof and sidewall, the heat loss increases with the increasing of the tank capacity. Besides, due to the decreasing tempera-ture difference between the oil and environment when the oil temperature decreases, the heat loss reduces with the time goes by. Although the heat loss enlarges with the in-creasing of the tank capacity, the change rule of heat loss for mass oil is different. Figs. (19, 20) are the heat loss for unit mass oil at different ambient temperature. From these data,
Heat Loss Test and Estimate for the Large-scale The Open Petroleum Engineering Journal, 2015, Volume 8 123
Fig. (17). Total heat loss of oil tank (-20oC).
Fig. (18). Total heat loss of oil tank (20oC).
Fig. (19). Heat loss of unit mass oil (-20oC).
124 The Open Petroleum Engineering Journal, 2015, Volume 8 Zhao et al.
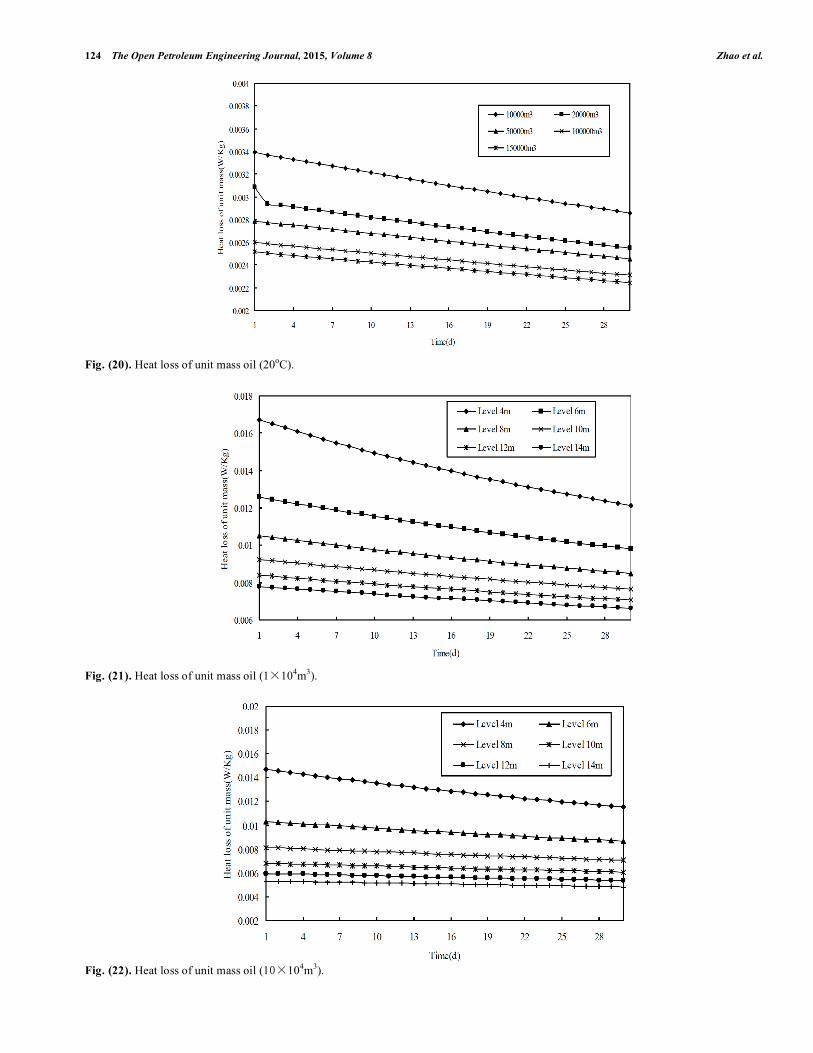
Fig. (20). Heat loss of unit mass oil (20oC).
Fig. (21). Heat loss of unit mass oil (1 104m
3).
Fig. (22). Heat loss of unit mass oil (1 10
4m
3).
Heat Loss Test and Estimate for the Large-scale The Open Petroleum Engineering Journal, 2015, Volume 8 125
the heat loss of unit mass oil decreases with the increasing of the tank capacity, which means the centralization storage of oil is a more energy conservation storage pattern.
4.2. The Heat Loss of Oil Tank in Different Level
In order to investigate the effect of tank level on the heat loss of floating roof tank, the levels 4m, 6m, 8m, 10m, 12m
and 14m of 1 104 and 10 10
4 oil tank are calculated at the
temperature of -20oC, the results are shown as follows
Figs. (21, 22):
For the same capacity of tank, with the increasing of level, the oil temperature decreasing slower, leading the heat loss of unit mass oil decrease. Especially under the level of 6m, an obvious variation of heat loss can be seen. So the level of oil tank should be a little higher under the safety condition.
CONCLUSION
The heat loss and surface temperature from the top sur-face and sidewall of large-scale floating roof tank is tested by the heat flow meter and surface temperature method. Based on the test data, the heat loss from the top surface is about twice more than that of the sidewall which means the top surface is the weakest insulation part of the footing roof tank. On the surface, the heat loss profile is in accord with the surface temperature distribution. Special attention is given on the calculation of thermal conductivity of different walls which finally deducing the total heat transfer coeffi-cient of large floating roof tank.
The tank capacity, the temperature gradient between oil and ambient, the level of oil is regarded as the main factors on the heat loss. From the calculation results under different conditions, the large capacity of oil tank corresponds to a higher heat loss. However, a lower heat loss of unit mass oil is got. The ambient temperature makes an obvious effect on
the heat loss of oil tank. Besides, with the increasing of tank level, the heat loss decreases. The level of 6m is regarded as a critical level determining the heat loss. In summary, the centralization storage of oil is a more energy conservation storage pattern.
CONFLICT OF INTEREST
The authors confirm that this article content has no con-flict of interest.
ACKNOWLEDGEMENTS
This work is supported by PetroChina Innovation Foun-dation (2014D-5006-0607). In addition, the authors express gratitude to the Key Laboratory of Enhance Oil and Gas Re-covery of Educational Ministry and The Transportation and Storage and Marketing Subsidiary Company of Daqing Oil Field for the support of the test work.
REFERENCES
[1] C. Busson, and C. Miniscloux, “Modele technoeconomique de calorifugeage des reservoirs de fuel lourd,” Rev. Gen. Therm, vol.
226, pp. 785-797, 1980. [2] J.D. Kumana, and S.P. Kothari, “Predict storage tank heat transfer
precisely,” Chem. Eng., vol. 6, pp. 127-132, 1982. [3] J.E.S. Venart, A.C.M. Sousa, M. Laplante, and R. Pickles, “Free
convective flows in large heated oil storage tanks”, In: Proc. 7th Int. Heat Trans. Conf., vol. 2, pp. 293-297, 1982.
[4] M. Cotter, and M. Charles, “Transient cooling of petroleum by natural convection in cylindrical storage tanks-I. Development and
testing the numerical simulator”, Int. J. Heat Mass Transfer, vol. 36, pp. 2165-2174, 1993.
[5] M. Cotter, and M. Charles, “Transient cooling of petroleum by natural convection in cylindrical storage tanks-II. Effect of heat
transfer coefficient, aspect ratio and temperature-dependent viscos-ity,” Int. J. Heat Mass Transfer, no. 36, pp. 2175-2182, 1993.
[6] M. Cotter, and M. Charles, “Transient cooling of petroleum by natural convection in cylindrical storage tanks: a Simplified Heat
Loss Model,” Can. J. Chem. Eng., vol. 70, pp. 1090-1093, 1992.
Received: December 15, 2014 Revised: January 04, 2015 Accepted: February 25, 2015
© Zhao et al.; Licensee Bentham Open.
This is an open access article licensed under the terms of the Creative Commons Attribution Non-Commercial License (http://creativecommons.org/-
licenses/by-nc/3.0/) which permits unrestricted, non-commercial use, distribution and reproduction in any medium, provided the work is properly cited.