heat flux induced coherent vibration of h-shaped single
TRANSCRIPT
Nanoscale
PAPER
Cite this: DOI: 10.1039/c7nr08223a
Received 5th November 2017,Accepted 15th December 2017
DOI: 10.1039/c7nr08223a
rsc.li/nanoscale
Heat flux induced coherent vibration of H-shapedsingle layer graphene structure
W. Li, *a J. Chen, b H. Zhao *c and G. Li *c
We report an exciting behavior of H-shaped single layer graphene structures subject to a heat flux.
H-shaped graphene structures with certain particular dimensions were observed to be able to establish
coherent mechanical vibrations in the out-of-plane direction directly from a steady state heat flux flowing
from the centerline of the structure towards the two ends. Molecular dynamics (MD) simulation methods
together with phonon spectral energy density (SED) analysis techniques were used to obtain the phonon
dispersion profiles and identify the low frequency high energy phonon modes. Based on these calcu-
lations, we proposed a hypothesis that the mechanical vibration is the result of the superposition of the
high energy out-of-plane acoustic (ZA mode) phonons traveling in opposite directions via scattering
mechanisms. By using a theoretical model based on the superposition principle, we reproduced the
vibrational mode of the graphene structure observed in the MD simulation and verified the proposed
hypothesis.
Introduction
As a two dimensional (2D) honeycomb lattice of carbon atoms,single layer graphene has excellent mechanical properties witha Young’s modulus of 1 TPa and an ultimate strength of 130GPa,1 high electrical conductivity up to 6000 S cm−1,2 highthermal conductivity of 5000 W mK−1,3 and a theoreticalsurface-to-mass ratio of ∼2600 m2 g−1.4 Due to its extraordi-nary material properties and 2D crystal lattice nature, gra-phene has been adopted in the development of energy conver-sion devices, such as solar cells in which absorbed photonsare converted into electrical current,5–7 thermoelectric devicesin which a potential difference between electron and hole-doped crystals is created by a temperature gradient,8,9 and fuelcells in which electrical energy is generated by the conversionof chemical energy.10–12 Meanwhile, numerical simulations,such as classical molecular dynamics (MD) simulations,13 thenon-equilibrium Green’s function (NEGF) method,14,15 andBoltzmann transport equation (BTE) methods,16 have beenemployed to understand the mechanical, electrical andthermal transport properties of graphene with respect tosize,17 temperature,18 defect concentrations,19 doping,20,21
edge roughness,22 shape,23 as well as other factors.
While many methods and mechanisms are available forenergy conversion among mechanical, chemical, thermal, andelectrical energies, none of the energy conversion mechanismshas been identified to directly transform incoherent internalthermal energy to coherent mechanical vibrational energy.Conventional thermal-to-mechanical kinetic energy conversionmethods demand heat cycles involving chemical reactionsand/or liquid–gas phase transitions, such as the cases of com-bustion and steam engines. Herein, for the first time, we haveidentified a direct energy conversion from incoherent thermalenergy to coherent mechanical vibrational energy in anH-shaped graphene structure through MD simulations. Asshown in Fig. 1, the H-shaped graphene sheet was observed toestablish sustained mechanical vibration in the out-of-planedirection (schematically depicted and colored in light gray)when a heat flux was applied from the centerline (colored inred) towards the two ends. This phenomenon implicates that,given a right size and shape of a 2-D material such as the gra-phene sheet in this case and a right configuration of the heatsource/sink, the incoherent internal thermal energy in thematerial can be directly converted to a coherent mechanicalvibrational energy associated with a net momentum. Wehypothesize that such a low frequency standing wave wasformed due to a superposition of high energy phonons thatwere traveling from the narrow section (centerline) to the widesections (sides) and the ones that were scattered and reflectedback by the edges of the H-shaped graphene. In this letter, wepresent the MD simulation details, describe our observationson the thermal-to-mechanical energy conversion and test thehypothesis by using a wave superposition model and phonon
aNingbo Institute of Technology, Zhejiang University, Ningbo, Zhejiang, 315100,
P. R. China. E-mail: [email protected] of Energy and Power Engineering, Nanjing University of Science and
Technology, Nanjing, Jiangsu, 210094, P. R. ChinacDepartment of Mechanical Engineering, Clemson University, SC, 29634-0921, USA.
E-mail: [email protected], [email protected]
This journal is © The Royal Society of Chemistry 2018 Nanoscale
Publ
ishe
d on
18
Dec
embe
r 20
17. D
ownl
oade
d by
Cle
mso
n U
nive
rsity
on
05/0
1/20
18 1
2:15
:44.
View Article OnlineView Journal

spectral energy density (SED) analysis. The findings describedin this letter reveal for the first time the possibility of directthermal-to-mechanical vibrational energy conversion within asingle material through phonon transport and the great poten-tial of phonon engineering of nanomaterials.
Method
As shown in Fig. 2, the H-shaped graphene structure underconsideration is a primitive cell (or unit cell) of an infinitelylarge graphene with uniformly distributed rectangular shapedholes. Just as graphene is often referred as a honeycomblattice structure, based on the shape of the graphene lattice inthe unit cell and the characteristics of the heat flux, in thiswork the graphene lattice shown in Fig. 2 (right) is defined so
as to have an H-shaped structure. The H-shaped graphenelattice structure was characterized by four parameters: totallength L and width W, the width of the narrow region a, andthe length of the wide region b, as shown in Fig. 2 (right). Weadopted the molecular dynamics solver LAMMPS24 andAdaptive Intermolecular Reactive Empirical Bond Order(AIREBO) potential to simulate the H-shaped graphene latticewith the heat source along the centerline and heat flux direc-tion along armchair direction as shown in Fig. 2 (right). Thegraphene is decomposed into the hot, cold and heat conduc-tion regions. Periodic boundary condition was applied in thein-plane x and y-directions while a 5 nm thick vacuum wasmaintained in z-direction to avoid the out-of-plane interaction.The initial graphene structure was equilibrated at room temp-erature 300 K under the canonical ensemble (NVT) for 60 ps.The time step was 0.5 fs. After equilibration, the heat flow wasintroduced into the system under the microcanonical ensem-ble (NVE) by exchanging the velocity of the lowest kineticenergy atom in the hot region with the velocity of the highestkinetic energy atom in the cold region as shown in Fig. 2(right) following the Muller-Plathe algorithm.25
In order to test the proposed hypothesis, a SED analysiswas adopted to calculate the phonon dispersion curves andestimate boundary scattering effects.20,26–28 Here, the SED unitcell was defined as the two columns of carbon atoms along theheat flux direction, as indicated by the black box region shownin Fig. 2 (right). The SED calculation domain was defined asthe periodic domain within the simulation box without dis-continuity along heat flux direction, as indicated by the greenbox region shown in Fig. 2 (right). Derived from the timederivative of normal modes,26 the phonon SED can beexpressed as:
Φðk;ωÞ ¼ m2πt0Nl
X3α¼1
XNj
j¼1
ðt00
XNl
l
uαðjl; tÞeik�rl0 e�iωtdt
����������2
; ð1Þ
Fig. 1 The H-shaped graphene sheet was observed to establish sus-tained mechanical vibration in the out-of-plane direction (schematicallydepicted and colored in light gray) when a heat flux was applied fromthe centerline (colored in red) towards the two ends (heat sinks). Theheating at the center can be applied by laser. The blue regions areassumed attached to heat sinks that remove heat from the latticewithout restricting the macroscopic coherent motion of the atoms. Thegreen and gray colored structures are the original and vibrationalconfigurations of the graphene lattice, respectively.
Fig. 2 The H-shaped graphene lattice structure is a primitive cell of an infinitely large graphene with uniformly distributed rectangular shapedholes. Red box: the hot region; blue box: the cold region; black box: the unit cell for SED calculation; and green box: the SED calculation domain.
Paper Nanoscale
Nanoscale This journal is © The Royal Society of Chemistry 2018
Publ
ishe
d on
18
Dec
embe
r 20
17. D
ownl
oade
d by
Cle
mso
n U
nive
rsity
on
05/0
1/20
18 1
2:15
:44.
View Article Online

Tab
le1
ThekineticenergyprofilesoftheH-shap
edgraphenestructure
(L=21.72
6nm,W
=8.608nm)withdifferentco
mbinationsofaan
db
3.19
54.26
05.32
56.39
07.45
5
1.47
6
2.95
1
4.42
7
5.90
3
7.37
9
Nanoscale Paper
This journal is © The Royal Society of Chemistry 2018 Nanoscale
Publ
ishe
d on
18
Dec
embe
r 20
17. D
ownl
oade
d by
Cle
mso
n U
nive
rsity
on
05/0
1/20
18 1
2:15
:44.
View Article Online
where j is the atom index in each SED unit cell, l is the unitcell index in the calculation domain, Nj is the number ofatoms in the unit cell, Nl is the number of unit cells, u is thevelocity of j-th atom in the l-th SED unit cell at time t, α rep-resents the velocity direction (x, y or z directions), rl0 is theequilibrium position of l-th unit cell, and m is the mass ofcarbon atom, ω is the angular frequency, t0 is the total inte-gration time. The wave vector k is in the heat flux direction,which is corresponding to armchair graphene direction in realspace. The resolution of the frequency axis is defined by fc/Nf
where fc is the Nyquist critical frequency and Nf is number ofsamples. In the present study, the resolution of the frequencyis 0.061 THz. The resolution of the wave-number axis is
defined by2πas
� �=Nl, where as ¼
ffiffiffi3
pac�c of lattice constant
ac–c. Here, the resolution of the wave-number is 5 × 10⁸ m−1.
Results and discussion
Table 1 shows the steady state atomic kinetic energy distri-bution of 25 H-shaped graphene sheets with L = 21.726 nm,W = 8.608 nm and different combination of a and b. When theatomic motions are incoherent, the average kinetic energy ofthe atoms represents their temperature. In pristine graphene,the steady state kinetic profile presents a smooth temperaturetransition between the hot and the cold regions. The H-shapedgraphene lattice model shown in Fig. 2 was divided into 102bins with thickness equal to
ffiffiffi3
pac�c (ac–c = 0.142 nm is the
carbon–carbon bond length) along the heat flux direction. Thelocal temperature of the i-th bin can be calculated by averagingthe kinetic energy of all the atoms in the i-th bin as
Ti ¼ 13NikB
XNi
j¼1
mvj2, where Ti is the temperature of the i-th bin,
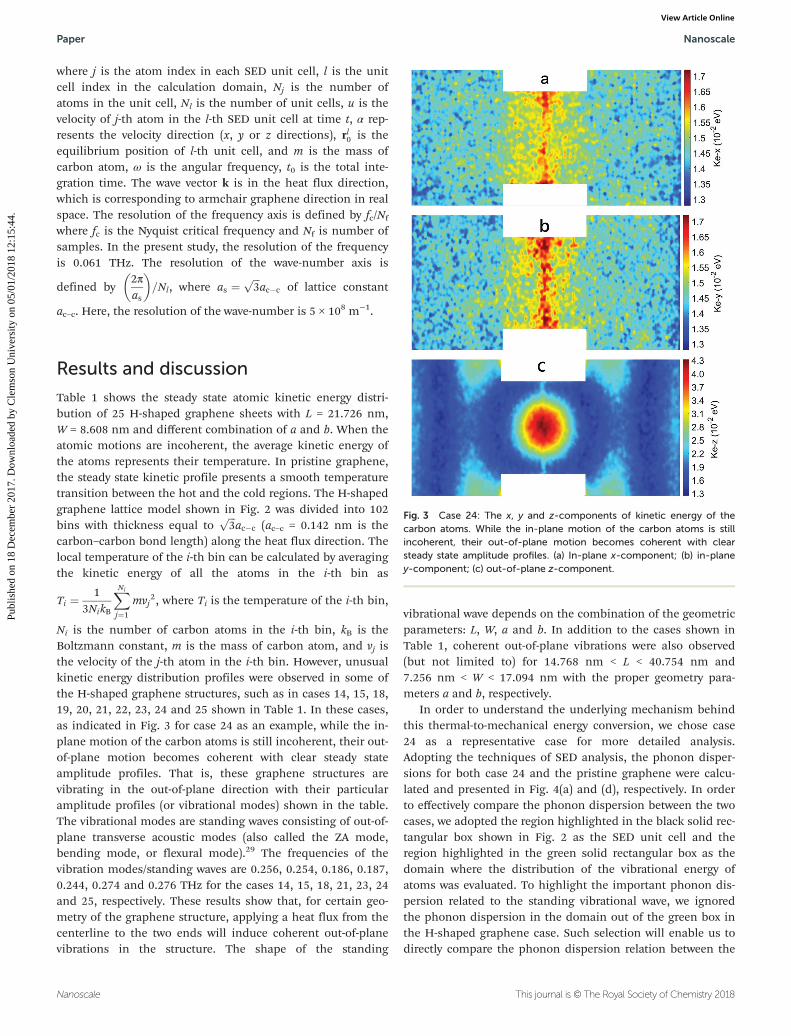
Ni is the number of carbon atoms in the i-th bin, kB is theBoltzmann constant, m is the mass of carbon atom, and vj isthe velocity of the j-th atom in the i-th bin. However, unusualkinetic energy distribution profiles were observed in some ofthe H-shaped graphene structures, such as in cases 14, 15, 18,19, 20, 21, 22, 23, 24 and 25 shown in Table 1. In these cases,as indicated in Fig. 3 for case 24 as an example, while the in-plane motion of the carbon atoms is still incoherent, their out-of-plane motion becomes coherent with clear steady stateamplitude profiles. That is, these graphene structures arevibrating in the out-of-plane direction with their particularamplitude profiles (or vibrational modes) shown in the table.The vibrational modes are standing waves consisting of out-of-plane transverse acoustic modes (also called the ZA mode,bending mode, or flexural mode).29 The frequencies of thevibration modes/standing waves are 0.256, 0.254, 0.186, 0.187,0.244, 0.274 and 0.276 THz for the cases 14, 15, 18, 21, 23, 24and 25, respectively. These results show that, for certain geo-metry of the graphene structure, applying a heat flux from thecenterline to the two ends will induce coherent out-of-planevibrations in the structure. The shape of the standing
vibrational wave depends on the combination of the geometricparameters: L, W, a and b. In addition to the cases shown inTable 1, coherent out-of-plane vibrations were also observed(but not limited to) for 14.768 nm < L < 40.754 nm and7.256 nm < W < 17.094 nm with the proper geometry para-meters a and b, respectively.
In order to understand the underlying mechanism behindthis thermal-to-mechanical energy conversion, we chose case24 as a representative case for more detailed analysis.Adopting the techniques of SED analysis, the phonon disper-sions for both case 24 and the pristine graphene were calcu-lated and presented in Fig. 4(a) and (d), respectively. In orderto effectively compare the phonon dispersion between the twocases, we adopted the region highlighted in the black solid rec-tangular box shown in Fig. 2 as the SED unit cell and theregion highlighted in the green solid rectangular box as thedomain where the distribution of the vibrational energy ofatoms was evaluated. To highlight the important phonon dis-persion related to the standing vibrational wave, we ignoredthe phonon dispersion in the domain out of the green box inthe H-shaped graphene case. Such selection will enable us todirectly compare the phonon dispersion relation between the
Fig. 3 Case 24: The x, y and z-components of kinetic energy of thecarbon atoms. While the in-plane motion of the carbon atoms is stillincoherent, their out-of-plane motion becomes coherent with clearsteady state amplitude profiles. (a) In-plane x-component; (b) in-planey-component; (c) out-of-plane z-component.
Paper Nanoscale
Nanoscale This journal is © The Royal Society of Chemistry 2018
Publ
ishe
d on
18
Dec
embe
r 20
17. D
ownl
oade
d by
Cle
mso
n U
nive
rsity
on
05/0
1/20
18 1
2:15
:44.
View Article Online

H-shaped graphene case and the pristine graphene case. Asshown in Fig. 4(a) and (d), the difference between the phonondispersion relations of the H-shaped graphene and the pristinegraphene is small, except in the region of low frequency acous-tic phonons. The zoomed-in figures of the small region forboth cases shown in Fig. 4(c) clearly shows a very bright spotat around 0.3 THz in the ZA branch of the H-shaped graphenecase. Such a bright spot means that the phonons in this smallregion have significantly higher energies. This is confirmed bythe phonon SED plot of case 24 shown in Fig. 4(b), in which ahigh peak appears near 0.3 THz. On the other hand, asobserved in the MD simulation, the mechanical vibration atthe center of the H-shaped structure had a frequency of about0.274 THz. Therefore, it is evident that, for case 24, in thesteady state heat transfer from the center to the left and rightends, the amount of ZA phonons near 0.3 THz increased sig-nificantly, and this accumulation of the ZA phonons wasclosely related to the mechanical vibration of the H-shaped
graphene structure since the frequency of the mechanicalvibration was also around 0.3 THz.
In order to understand how the mechanical vibrationalmode was developed in case 24, we plot the potential energyvariation with respect to the NEMD simulation time, as shownin Fig. 5(a). It is clear that the whole process can be dividedinto undeveloped (blue), developing (red) and developed (i.e.steady state) stages (yellow). We selected a representative timerange of 15 ps within each of the three stages as highlightedand evaluated the PSED of the MD data in these time periods.As shown in Fig. 5(b), the amplitude of PSED near the 2-Dband around 48 THz decreased when the out-of-planevibration was being developed. Meanwhile, a peak of PSEDnear the frequency of the vibrational mode (0.274 THz)appeared. This indicates that a portion of the incoherent highfrequency phonon energy was transferred into phonon energyat low frequencies as shown in Fig. 5(b), and the accumulatedlow frequency phonon energy was further transformed into the
Fig. 4 Phonon dispersion comparison between pristine graphene and the H-shaped graphene structure (case 24). (a) Partial phonon dispersion ofcase 24 H-shaped graphene. (b) PSED of case 24 H-shaped graphene. (c) Zoomed-in view of the low frequency phonon region. (d) Phonon dis-persion of pristine graphene. The difference between the phonon dispersion relations of the H-shaped graphene and the pristine graphene is small,except a very bright spot at around 0.3 THz in the ZA branch of the H-shaped graphene case in the region of low frequency acoustic phonons. Suchbright spot means that the phonons in this small region have significantly higher energies.
Nanoscale Paper
This journal is © The Royal Society of Chemistry 2018 Nanoscale
Publ
ishe
d on
18
Dec
embe
r 20
17. D
ownl
oade
d by
Cle
mso
n U
nive
rsity
on
05/0
1/20
18 1
2:15
:44.
View Article Online

coherent vibrational energy at the low frequency as shown inFig. 5(a). Throughout the time evolution, the H-shaped gra-phene structure gradually collected phonon thermal energyfrom the heat flux and converted it into mechanical vibrationalenergy, and finally reached a thermal and vibrational steadystate. Similar observations were made in other cases withcoherent vibrations as well.
Next, we investigate the formation of the mechanicalvibrational mode in the H-shaped graphene structure. It is wellknown that superposition of traveling waves going oppositedirections can form a standing wave. In this study, thephonons are traveling waves and the observed mechanicalvibrational mode of the graphene structure is a standing wave.The formation and amplitude growth of the out-of-planemechanical vibration was observed to be accompanied simul-taneously with the accumulation of the ZA-mode phonons atfrequencies close to 0.3 THz. Therefore, we can postulate thatthe out-of-plane mechanical vibration is the result of superpo-sition of traveling phonons originated from the heat sourceand reflected from the boundary. To test this hypothesis, forcase 24, we recorded the z-directional trajectories of 5 atoms inthe standing wave region every 100 time steps for 200 ps afterthe vibration is fully developed. The positions of these 5 atoms
were marked with different colors in Fig. 6(a). By using theFast Fourier Transformation (FFT), three main frequency com-ponents of the time domain trajectories of the atoms were cap-tured as shown in Fig. 6(b). The frequency at which thehighest peak appeared was about 0.278 THz, which was closeto the frequency of the vibrational mode at the center obtainedfrom the MD trajectories (0.274 THz) and that of the brightestspot in the phonon dispersion plot of the case 24 (∼0.3 THz).For the ZA modes, when the wave vector k or angular frequencyω approaches zero, we take the linear approximation to dis-persion curve given by30
ωðk ! 0Þ ¼ a
ffiffiffiffiJm
rjkj; ð2Þ
where J is the force constant, m is the mass, and a is the unitcell length. Based on linear approximation to the ZA mode dis-persion curve, the wave vectors corresponding to the three fre-quencies, 0.129, 0.267 and 0.278 THz, were calculated to be0.1522, 0.3159 and 0.3292 nm−1, respectively. Based on thethree frequencies and their corresponding wave vectors, onecan form three pairs of oppositely traveling phonon modes aslisted in Table 2. Through superposition, a vibrational mode(standing wave) at the center of case 24 could be obtained as
y ¼X3j¼1
Aj sinðkjxþ ωjtÞ þX3j¼1
A′j sinðkjx� ωjtÞ; ð3Þ
where j is the phonon mode index, Aj and A′j are the ampli-tudes of the phonon modes in the positive and negative direc-tions, respectively. The amplitudes were estimated from MDtrajectories. Considering energy dissipation of phonon trans-port in the lattice, a smaller A′j compared to Aj was chosen inthe calculation.
The out-of-plane displacements of the 5 atoms as functionsof time from MD simulations are shown in Fig. 6(c). Followingeqn (3), the superposition of the six phonon modes listed inTable 2 gave the displacements of the 5 atoms as shown inFig. 6(d). For all the 5 atoms, the time-dependent displacementprediction based on the ZA-mode phonon superpositionhypothesis was in very good agreement with the MD results. Inother words, through superposition of high energy travelingphonons in the ZA mode, we reproduced the vibrational modeat the center of the graphene structure. This result stronglysupports the phonon superposition hypothesis for the for-mation of the mechanical vibration.
Regarding how the ZA-phonons were accumulated at theparticular frequencies, it can be suggested that due to the par-ticular geometry of the graphene structure, ZA phonons atcertain low frequencies were created due to phonon–phononand phonon-boundary scattering. At the same time, some ofthe ZA-phonons at these frequencies were destroyed throughscattering with other phonons and/or boundaries. In the unde-veloped and developing stages of the process shown inFig. 5(a), the rate of creation of these particular ZA phononsexceeded the rate of their destruction, resulting in the accumu-lation of these phonons and, by superposition, the amplitude
Fig. 5 Energy variation during the development of the mechanicalvibration. A portion of the incoherent high frequency phonon energywas transferred into phonon energy at low frequencies and the accumu-lated low frequency phonon energy was further transformed into thecoherent vibrational energy at the low frequency. Throughout the timeevolution, the H-shaped graphene structure gradually collected phononthermal energy from the heat flux and converted it into mechanicalvibrational energy, and finally reached a thermal and vibrational steadystate. (a) Variation of the potential energy as a function of time; (b) PSEDof the structure at the undeveloped (blue), developing (red) and devel-oped (black) stages.
Paper Nanoscale
Nanoscale This journal is © The Royal Society of Chemistry 2018
Publ
ishe
d on
18
Dec
embe
r 20
17. D
ownl
oade
d by
Cle
mso
n U
nive
rsity
on
05/0
1/20
18 1
2:15
:44.
View Article Online

growth of the mechanical vibrational standing wave. Thistrend continued until the rates of creation and destruction ofthe ZA phonons became equal, that is, when the steady state(developed stage) was reached. As mentioned previously, wehave simulated H-shaped graphene lattice with different sizes,aspect ratios and feature sizes, coherent out-of-planevibrations were also observed (but not limited to) when theH-shaped graphene size belongs to 14.768 nm < L < 40.754 nmand 7.256 nm < W < 17.094 nm with the proper geometry para-meters a and b, respectively. The results show that the build-up of energy into the ZA mode depends on the combination ofthese parameters. There exist specific geometrical configur-ations of the graphene lattice that promote reflection andsuperposition of certain ZA modes and yet exclude unrest-ricted propagation of other frequency modes via phonon–phonon and boundary scattering. In such cases, LA and TAmodes remain incoherent and partially cancelled, and ZAmode energy at certain frequencies is built up to form thevibrational standing wave. However, questions remain as towhy the heat flux generates and accumulates phonons of this
particular mode and at these particular frequencies and howthis accumulation is related to the size and geometry of thegraphene structure. In addition, effects of spatial distributionof heat flux and energy dissipation/damping when there is anexternal bath on the ZA mode energy build-up is not clear.Further investigation and evidence are necessary for us tounderstand the precise mechanisms of this incoherent tocoherent energy conversion.
Conclusions
H-shaped graphene structures with specific dimensions wereobserved to be able to establish coherent mechanicalvibrations in the out-of-plane direction directly from a steadystate heat transfer in the material. MD simulation data andphonon spectral energy density analysis evidence show that inthe process of developing a steady state heat transfer in thegraphene structure, a portion of the incoherent high frequencyphonon energy was transferred into ZA mode phonon energy
Fig. 6 The formation of the vibrational mode at the center of case 24. (a) Position of the picked atoms; (b) FFT results of frequency components; (c)MD results; (d) results from model based on the hypothesis.
Table 2 The parameters of superposition component phonons
Frequency ω (2π THz) Wave vector k (108 m−1) Amplitude A (nm)Amplitude of the phonon inthe opposite direction A′ (nm)
Phonon 1, 1′ 0.129 1.522 0.0342 0.0338Phonon 2, 2′ 0.267 3.159 0.0314 0.0304Phonon 3, 3′ 0.278 3.292 0.1676 0.1665
Nanoscale Paper
This journal is © The Royal Society of Chemistry 2018 Nanoscale
Publ
ishe
d on
18
Dec
embe
r 20
17. D
ownl
oade
d by
Cle
mso
n U
nive
rsity
on
05/0
1/20
18 1
2:15
:44.
View Article Online

at low frequencies. We further demonstrate that it is the super-position of these accumulated traveling low frequency ZAmode phonons that generates the coherent mechanicalvibration of the graphene structure. While this finding revealsthe possibility of direct thermal-to-mechanical vibrationalenergy conversion within a single material through phonontransport and the great potential of phonon engineering innanomaterials, questions, such as how the size and geometryof the graphene structure determine the accumulation of thephonons at particular frequencies and consequently the for-mation of the mechanical vibrational modes, remain to beanswered.
Conflicts of interest
There are no conflicts to declare.
Acknowledgements
This investigation was supported by the Natural ScienceFoundation of China (no. 51406181), the NationalSupercomputer Center in Guangzhou, China (NSCC-GZ) andClemson University. Part of the calculations in this work wasperformed on TianHe-2 at NSCC-GZ. The authors would like tothank the reviewers for their insightful comments.
References
1 Z. Yang, R. Gao, N. Hu, J. Chai, Y. Cheng, L. Zhang, H. Wei,S. W. Kong and Y. Zhang, Nano-Micro Lett., 2012, 4(1), 1–9.
2 X. Du, I. Skachko, A. Barker and E. Y. Andrei, Nat.Nanotechnol., 2008, 3(8), 491.
3 A. A. Balandin, S. Ghosh, W. Bao, I. Calizo,D. Teweldebrhan, F. Miao and C. N. Lau, Nano Lett., 2008,8(3), 902.
4 F. Bonaccorso, L. Colombo, G. Yu, M. Stoller, V. Tozzini,A. C. Ferrari, R. S. Ruoff and V. Pellegrini, Science, 2015,347(6217), 1246501.
5 L. Kavan, J. Yum and M. Grätzel, Nano Lett., 2011, 11(12),5501–5506.
6 S. Mathew, A. Yella, P. Gao, R. Humphry-Baker,B. F. E. Curchod, N. Ashari-Astani, I. Tavernelli,U. Rothlisberger, M. K. Nazeeruddin and M. Grätzel, Nat.Chem., 2014, 6(3), 242–247.
7 X. Yan, X. Cui, B. Li and L. Li, Nano Lett., 2010, 10(5), 1869–1873.
8 B. Poudel, Q. Hao, Y. Ma, A. Minnich, A. Muto, Y. C. Lan,B. Yu, X. Yan, D. Z. Wang and D. Vashaee, Science, 2008,320(5876), 634.
9 F. J. Disalvo, Science, 1999, 285(5428), 703.10 S. Hu, M. Lozadahidalgo, F. C. Wang, A. Mishchenko,
F. Schedin, R. R. Nair, E. W. Hill, D. W. Boukhvalov,M. I. Katsnelson and R. A. Dryfe, Nature, 2014, 516(7530),227.
11 L. Dong, R. R. S. Gari, Z. Li, M. M. Craig and S. Hou,Carbon, 2010, 48(3), 781–787.
12 E. Yoo, T. Okata, T. Akita, M. Kohyama, J. Nakamura andI. Honma, Nano Lett., 2009, 9(6), 2255.
13 Y. Wang, A. K. Vallabhaneni, B. Qiu and X. Ruan, NanoscaleMicroscale Thermophys. Eng., 2014, 18(2), 155–182.
14 W. Zhang, T. S. Fisher and N. Mingo, Numer. Heat Transfer,Part B, 2007, 51(4), 333–349.
15 J.-S. Wangt, B. K. Agarwalla; and J. Thingna, Front. Phys.,2014, 9(6), 673–697.
16 M. Omini and A. Sparavigna, Phys. B, 1995, 212(2), 101–112.
17 H. Zhao, K. Min and N. R. Aluru, Nano Lett., 2009, 9(8),3012.
18 H. Zhao and N. R. Aluru, J. Appl. Phys., 2010, 108(6),064321.
19 M. M. Sadeghi, M. T. Pettes and L. Shi, Solid StateCommun., 2012, 152(15), 1321–1330.
20 C. Li, G. Li and H. Zhao, J. Appl. Phys., 2015, 118(7), 075102.21 C. Li, G. Li and H. Zhao, Carbon, 2014, 72(72), 185–191.22 J. Haskins, A. Kınacı, C. Sevik, H. Sevinçli, G. Cuniberti
and T. Çağın, ACS Nano, 2011, 5(5), 3779.23 J. Hu, X. Ruan and Y. P. Chen, Nano Lett., 2010, 9(7),
2730.24 S. Plimpton, Fast parallel algorithms for short-range mole-
cular dynamics, Academic Press Professional, Inc., 1995, pp.1–19.
25 M. Zhang, E. Lussetti, L. E. de Souza and F. Müller-Plathe,J. Phys. Chem. B, 2005, 109(31), 15060.
26 J. A. Thomas, J. E. Turney, R. M. Iutzi, C. H. Amon andA. J. H. McGaughey, Phys. Rev. B: Condens. Matter Mater.Phys., 2010, 81(8), 081411.
27 J. Shiomi and S. Maruyama, Phys. Rev. B: Condens. MatterMater. Phys., 2006, 73(20), 205420.
28 T. Feng, B. Qiu and X. Ruan, J. Appl. Phys., 2015, 117(19),195102.
29 J. W. Jiang, B. S. Wang, J. S. Wang and H. S. Park, J. Phys.:Condens. Matter, 2015, 27(8), 083001.
30 M. T. Dove and C. A. Condat, Am. J. Phys., 1994, 62(11),1051–1052.
Paper Nanoscale
Nanoscale This journal is © The Royal Society of Chemistry 2018
Publ
ishe
d on
18
Dec
embe
r 20
17. D
ownl
oade
d by
Cle
mso
n U
nive
rsity
on
05/0
1/20
18 1
2:15
:44.
View Article Online