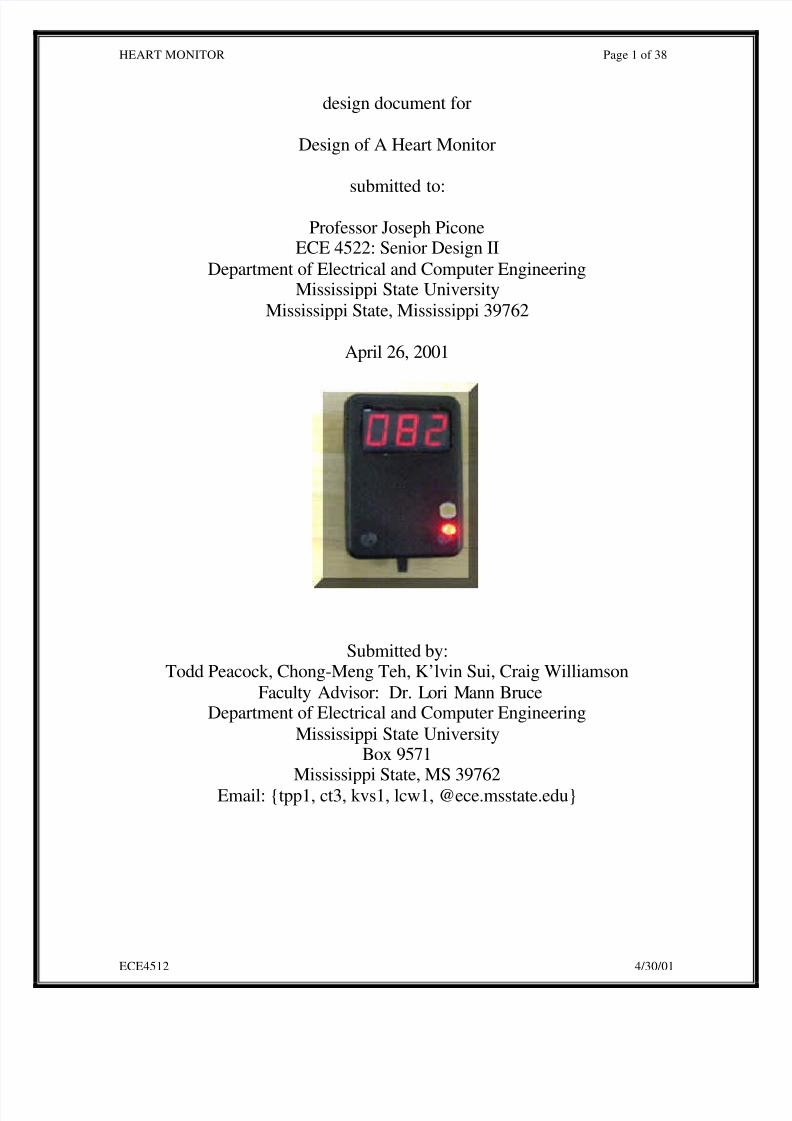
heart monitor
TRANSCRIPT
7/31/2019 Heart Monitor
http://slidepdf.com/reader/full/heart-monitor 1/38
HEART MONITOR Page 1 of 38
ECE4512 4/30/01
design document for
Design of A Heart Monitor
submitted to:
Professor Joseph PiconeECE 4522: Senior Design II
Department of Electrical and Computer EngineeringMississippi State University
Mississippi State, Mississippi 39762
April 26, 2001
Submitted by:Todd Peacock, Chong-Meng Teh, K’lvin Sui, Craig Williamson
Faculty Advisor: Dr. Lori Mann BruceDepartment of Electrical and Computer Engineering
Mississippi State UniversityBox 9571
Mississippi State, MS 39762Email: {tpp1, ct3, kvs1, lcw1, @ece.msstate.edu}

7/31/2019 Heart Monitor
http://slidepdf.com/reader/full/heart-monitor 2/38
HEART MONITOR Page 2 of 38
ECE4512 4/30/01
EXECUTIVE SUMMARY
What does the heart rate signify? It’s a window into your muscles and lungs; it revealshow hard they are working. Your heart pounds to pump oxygen-rich blood to your
muscles and to carry cell waste products away from your muscles. The more you
demand of your muscles, the harder your heart has to work to perform these tasks. Thatmeans your heart must beat faster to deliver more blood. The heart rate gives a good
indication during exercise routines of how effective that routine is improving your health.Once only used by elite athletes, heart rate monitors are now becoming an essential tool
for everyone from the casual athlete to the personal trainer. Heart monitors provide aneasy and scientific measure of the effort you are putting into your workouts. A heart ratemonitor is simply a device that takes a sample of heartbeats and computes the beats per
minute so that the information can easily be used to track heart condition. Currenttechnology consists of optical and electrical monitors. The electrical method provides a
bulky strap around one’s chest. The optical method does not require the strap and can beused more conveniently than the electrical method.
There are many constraints in producing a heart monitor. First, the technology used tomeasure the pulse has to be determined. A cost efficient way of measuring the pulse is
the combination of a LED and photo-sensor. With the LED technology, ambient lightcauses excess noise. Therefore, a filter would be needed to attenuate the noise in orderthat the pulse signal can be extracted. The device must have a display or some way to
observe the heart rate. The device should be accurate and easy to use to be attractive tothe general public. To make an impact on the market, the design must be small,
lightweight, durable and affordable. With these constraints noted, one can propose adesign to produce a heart monitor.
Using the design constraints described above, we can now state how we will approachour design. The basis of our design is to construct an efficient and affordable heart
monitor. A LED and photo-sensor will be used to measure the pulse by measuring thechange in blood flow through one of the index fingers. A noise filter will be designed tofilter out any unwanted noise and interference from ambient light. A micro-controller
will be programmed to count the pulse rate and control a LED display to show the pulserate. The device will operate in the power range of 3 volts to facilitate battery operation.
With this low power consumption, it will last for a reasonably long time under normaluse. The final product will be packaged in a small, lightweight, and durable package thatwill be approximately 2.5” x 1.7” x 1”. The production cost will not exceed $90.00.
Heart monitors exist today, so our design is not the first heart monitor to be built.However, our device will apply to all ages of people who want to monitor their heart ratefor any reason. It will provide fast and accurate readings. Because of its portable size,our design can be used at home or the office or any desired location. Under the time
constraints, we will only be able to produce a prototype meeting the general constrainsabove. Many features could be added such as wireless monitoring, ECG technology, and
alarm features.

7/31/2019 Heart Monitor
http://slidepdf.com/reader/full/heart-monitor 3/38
HEART MONITOR Page 3 of 38
ECE4512 4/30/01
Table of Contents
Abstract ____________________________________________________________ 4
1. Introduction_______________________________________________________ 4
2. Problem __________________________________________________________ 4
3. Objectives_________________________________________________________ 5
3.1 Pulse Detection__________________________________________________ 63.2 Signal Extraction_________________________________________________ 6
3.3 Pulse Digitization ________________________________________________ 73.4 Display ________________________________________________________ 73.5 Accuracy_______________________________________________________ 7
4. Approach _________________________________________________________ 8 4.1 Optical transmitter and receiving circuit_______________________________ 9
4.2 Filtering_______________________________________________________ 114.3 Digitization of the pulse rate signal _________________________________ 124.4 Micro-controller ________________________________________________ 14
4.5 Complete Design________________________________________________ 164.6 Cost Analysis __________________________________________________ 17
5. Test Specifications_________________________________________________ 18
6. Test Certification _________________________________________________ 19 7. Summary ________________________________________________________ 35
8. Acknowledgements ________________________________________________ 35
9. Individual Contributions ___________________________________________ 36 10. References ______________________________________________________ 37

7/31/2019 Heart Monitor
http://slidepdf.com/reader/full/heart-monitor 4/38
HEART MONITOR Page 4 of 38
ECE4512 4/30/01
Abstract
Heart related disease is rising among today’s population. The need for an accurate yetaffordable heart monitor is essential to ensure one’s health quality. However, in today’s
market, most heart monitors are expensive and are not user friendly. Our goal is to design
and build an affordable heart monitor that is user friendly. In order to make our goalpossible, we will utilize optical technology to construct an accurate and inexpensive
means for one to monitor his heart rate and stay in touch with his physical condition.
1. Introduction
The goal of our project is to design a low powered heart monitor that will provide anaccurate reading of ones heart rate. The monitor will be easy to use, portable, and
affordable. It will measure the heart rate from an index finger using an LED and a photo-sensor to detect changes in blood flow in an index finger. The heart rate will be
displayed on a LED display for easy monitoring. The significance of the heart monitor isthat it provides an inexpensive and accurate means of measuring one’s heart rate athis/her convenience.
2. Problem
The human heart rate is a very good indicator of one’s physical condition [1]. In order to
monitor the heart, one must have a way to measure his heart rate. Heart rate is measuredin different ways. Two of the most common techniques to measure the heart rate are
optical and electrical methods. A cost effective and convenient way of measuring the
heart rate is using the optical method. The optical method measures the heart rate bysensing changes in blood flow through the index finger. The electrical method requires a
bulky strap to be worn around the chest to monitor the heartbeat [4]. The electricalmethod has an average error of 1% and average cost of $150.00. The optical method has
an accuracy rating of 15% and an average cost of $90.00. Our approach is to design aportable monitor that can be used at one’s leisure. Therefore, the optical technology willbe used in our design. This approach will result in an accurate and portable package by
meeting specified design requirements.
Design requirements are determined by the optical and signal processing technology.This technology serves as a convenient alternative to other pulse measuring technology.
Other technologies are often inconvenient to use, inaccurate, or expensive. A visit to thedoctor’s office will result in the use of an electrocardiogram. Another technique is astethoscope used in conjunction with a stopwatch [6]. The ECG is accurate but
expensive and not as convenient as our proposed design. The stethoscope is a goodindicator, but is not as accurate as most people would like. A trip to the doctor’s office isusually expensive which leaves many people wishing for a cheap and accurate alternative
that they can use at their own leisure.

7/31/2019 Heart Monitor
http://slidepdf.com/reader/full/heart-monitor 5/38
HEART MONITOR Page 5 of 38
ECE4512 4/30/01
The goal of our project is to design a low powered heart monitor that will provide anaccurate reading of the heart rate using optical technology. The monitor will be easy to
use, portable, durable, and affordable. We will incorporate the optical technology using astandard red LED and photo-sensor. The LED and photo-sensor will used to measure the
heart rate within seconds from an index finger. A micro-controller will be programmed
to count the pulse rate. The heart rate will be digitally displayed on a LED displaycontrolled by the same micro-controller that counts the pulse rate. The significance of
the heart monitor is that it provides an inexpensive and accurate means of measuringone’s heart rate at his or her convenience. With this in mind, one can begin to see the
impact of the heart monitor.
The heart monitor will have a significant impact on everybody that is willing to use it
[10]. The low price of the heart monitor will make it accessible to every household. Onewill be able to monitor his heart at home safely, which will eliminate doctor visits unless
an abnormality is detected. Studies show that SIDS could be primarily a cardiovasculardisorder [3]. With the heart monitor, parents with newborn infants showing symptoms of SIDS could detect any abnormality in the infant’s heart rate [7]. The heart monitor would
also have an impact on athletes. Once athletes start monitoring their heart rates, they’llprobably discover the answers to most of their fitness questions [8]. With the aid of the
heart monitor, athletes can learn to exercise at an ideal heart rate for their training andhealth maintenance [5]. In athletic training, athletes will be able to use their heart rates todetermine how hard they were working [2]. Monitoring the heart rate would help
decrease over-training that can lead to injuries and months of rehabilitation. Stress canalso be monitored using the heart rate monitor. A person at work could frequently check
his or her pulse rate to reduce the onset of stress. In summation, the heart monitor wewill design can help monitor anyone’s health at his or her leisure.
3. Objectives
1. Pulse Detection: Our device will use a red LED and a photo-sensor paired in a
manner that will be able to measure ones heart rate through blood reflectivity changesin the index finger. Attenuation will be on average 80% of transmitted light.Voltage created will vary between 0 and 10 mV with respect to each heart pulse.
2. Signal Extraction: We will use a low pass filter to remove any interference
caused by ambient light and level detection distortions. The filter used will have acutoff frequency of 4 Hz, a roll off rate of 20 dB/decade, and pass-band frequencies
amplified by a factor of 40dB.
3. Pulse Digitization: The conditioned signal will be analyzed by a comparator to
provide a digital pulse of amplitude 1Vpp to be fed into the micro-controller digitalinput. This stage of the design will require that the amplified and filtered heart pulsesignal have a SNR of 20 dB.

7/31/2019 Heart Monitor
http://slidepdf.com/reader/full/heart-monitor 6/38
HEART MONITOR Page 6 of 38
ECE4512 4/30/01
4. Display: The heart rate will be displayed on a 3-digit LED display. A micro-controller will be programmed to operate the LED display. A 3 digit LED display
will be used because it will allow the full range pulses detected by the device to bedisplayed.
5. Accuracy: Our design should give accurate readings with no more than +/- 10%error. The accuracy of current optical heart monitoring devices is typically 10-15%.
6. Power: The device will operate using a 3-volt lithium coin cell battery source
because of the small packaging being utilized by our design. Our target battery is thecommonly used CR2477, which has a current capacity of 1000mAh. The device willconsume 30mA or less. The battery should last one year under normal use.
7. Durability: The device will be designed to operate in a standard temperature
environment of –30 C to 80 C. The device will be shock and water-resistant.
8. Physical Packaging : The final packaged dimensions shall be no larger than a
2.5” x 1.7” x 1” (H x W x D). This small packaging will be achieved by takingadvantage of the small footprint of current SMT devices.
9. Cost: Cost will be kept to a minimum to maintain a competitive edge withcurrently available products. A maximum estimate for production at this point is
$90.00. This cost will be achieved through the unique design approach andcomponent selection we will employ.
3.1 Pulse Detection
Our device will use a red LED and a photo-sensor paired in a manner that will be able
to measure ones heart rate through blood reflectivity changes in the index finger.The power transmitted by the LED will be matched to the photo sensor in such a way
that the resistance will vary within the range capable of the photo sensor afterattenuations through the index finger. Since attenuations will vary somewhatdepending on the person using the device, our specifications will assume the
attenuation will be on average 80% of the light transmitted. A resistance network will be used with the sensor to transform the changes in resistance to changes in
voltage. The voltage created will vary between 0 and 10 mV with respect to eachheart pulse.
3.2 Signal Extraction
We will use a low pass filter to remove any interference caused by ambient light and
level detection distortions. The filter used will have a cutoff frequency of 4 Hz toallow a maximum heart rate of 200 BPM (Beats/Minute) to be measured by thedevice with minimal loss in accuracy. Since the filter roll off is not required to be

7/31/2019 Heart Monitor
http://slidepdf.com/reader/full/heart-monitor 7/38
HEART MONITOR Page 7 of 38
ECE4512 4/30/01
high performance, the filter will use a roll off rate of 20 dB/decade. This roll off willprovide an attenuation of the greatest source of noise, 60Hz, by 23.5dB. The pulse
will have a –14 dB SNR before it will pass through the filter. The pass-bandfrequencies will be amplified by a factor of 40 dB with the aid of a small signal
amplifier. DC blocking will be used to prevent immeasurable pulses caused by a high
dc offset from ambient light.
3.3 Pulse Digitization
The conditioned signal will be analyzed by comparator to provide a digital pulse of
amplitude 1Vpp to be fed into the micro-controller digital input. The comparator willdetect the peak of each pulse and create a corresponding digital pulse. This stage of the design will require that the amplified and filtered heart pulse signal have a SNR of
20 dB to obtain a clean digital pulse. The time between each successive rising digitalpulse edge will be interpreted by the micro-controller as the period between each
heart pulse.
3.4 Display
The heart rate will be displayed on a 3-digit LED display. A micro-controller will beprogrammed to operate the LED display. Since improper finger placement couldcause problems with the user, a flashing segment on the LED display will be used to
help the user identify when a heart rate is being measured. A 3 digit LED display willbe used because it will allow the full range pulses detected by the device to be
displayed.
3.5 Accuracy
Our design should give accurate readings with no more than +/- 10% error. Thisaccuracy is not quite as tight as the tolerance of ECG monitors (+/- 1%) but asignificant cost reduction will be achieved by taking our approach. The accuracy of
current optical heart monitoring devices is typically 10-15%. The accuracy of ourdevice is controlled primarily by the amount of time used to average the pulse rate
from the user. The more time used means more samples and thus greater accuracy.Our device will use a method that will have a dynamic time for pulse gathering. The
pulse will be averaged after a set number of pulses are obtained, five in our case, bythe micro-controller. This will allow a better distribution of accuracy over the rangeof pulses that can be measured by the device.

7/31/2019 Heart Monitor
http://slidepdf.com/reader/full/heart-monitor 8/38
HEART MONITOR Page 8 of 38
ECE4512 4/30/01
3.6 Power
The device will operate using a 3-volt lithium coin cell battery source because of thesmall packaging being utilized by our design. The use of SMT devices will help in
the reduction of power needed and thus power source size. A standard watch battery
form will be used to aid in compact packaging. Our target battery is the commonlyused CR2477. This choice of battery will provide us with a nominal current capacity
of 1000 mAh. Given that our device will consume no more than 30 mA, the durationof the battery should be 33 hours. The battery should last one year under normal use;
however, this will vary from between users. Typical usage of 5 minutes per day willallow the device to operate for 1 year.
3.7 Durability
The device will be designed to operate in a standard temperature environment of –30
C to 80 C. The device packaging will be designed to hold up under normal usage.The packaging will be shock and water-resistant.
3.8 Physical Packaging
Our design is a small and lightweight device that will be the size of a standardstopwatch. It will be approximately the size of one’s palm for easy usage. The final
packaged dimensions shall be no larger than a 2.5” x 1.7” x 1” (H x W x D). Thissmall packaging will be achieved by taking advantage of the small footprint of
current SMT devices.
3.9 Cost
Cost will be kept to a minimum to maintain a competitive edge with currentlyavailable products. A maximum estimate for components at this point is $30.00.This cost will be achieved through the unique design approach and component
selection we will employ. Our design will have a market price of $90.00 dollars.
4. Approach
To successfully simulate this project, design will be done in stages. The first stagewill be design a circuit that will receive the pulse rate. Next, the signal will be
extracted using a filter. Next, the signal must be digitized so that it can be counted.Once these three stages are designed, they will be tied together to show a workingdesign through simulation. If this is done successfully, we should have proof that our
design will work. Next, a micro-controller will be used to count the pulse rate and

7/31/2019 Heart Monitor
http://slidepdf.com/reader/full/heart-monitor 9/38
HEART MONITOR Page 9 of 38
ECE4512 4/30/01
display it on a three digit LED display. Finally, each stage will be put together toform a working project.
4.1 Optical transmitter and receiving circuit
In order for our design to work, the pulse rate must be measured through changes of
blood flow through an index finger. Each pulse of blood from the heart will increasethe density of blood in the finger pulsatile tissue and cause a decrease in light power
received by the photo-sensor. The Figure 4.1-1 shows a diagram of tissues that willcontribute to the received signal. The photo-sensor will not pick up a purely ACsignal since there are some DC components received from other non-pulsatile tissues
and ambient light levels. The varying light levels received will be converted into avarying resistance in the photo-sensor. The varying resistance will be converted into
a varying voltage by using a resistance network and power source. In order to do this,a red led will be used in combination with a photo-sensor to detect and transmit the
pulse rate. Since the tissue in the human body acts a filter for red light (Figure 4.1-2),a red LED was chosen to allow the maximum amount of light energy to pass throughthe index finger. The circuit shown in figure 4.1-3 was designed to do this. The red
LED is basically a stand-alone system.
Figure 4.1-1 Pulsatile index finger tissues
Figure 4.1-2 Attenuation Levels of Light through blood fluids

7/31/2019 Heart Monitor
http://slidepdf.com/reader/full/heart-monitor 10/38
HEART MONITOR Page 10 of 38
ECE4512 4/30/01
The circuit in Figure 4.1-3 shows our pulse-rate to voltage converter and our sourceof constant red light that was designed and constructed to gather real-world data for
our analysis and design of our pulse detection system. The red LED is simplyforward biased through a resistor to create a current flow. The value of R2 was
chosen based on the current needed by our 3000 mCandela LED to produce a
maximum amount of light output but that was within the current limits of the device.The value calculated was then approximated to a resistance value that is commonly
available. The photo-resistor is placed in series with a resistor to reduce the currentdrawn by the detection system and to prevent shorting the battery when no light is
detected by the photoresistor.
Figure 4.1-3 Pulse receiving circuit
The diagram in Figure 4.1-4 shows the configuration of the LED and photo-sensor inrelation to the index finger. They are placed in such a way that the light has to passthrough finger tissue before it enters the photo-sensor.
Figure 4.1-4 Finger positioning

7/31/2019 Heart Monitor
http://slidepdf.com/reader/full/heart-monitor 11/38
HEART MONITOR Page 11 of 38
ECE4512 4/30/01
4.2 Filtering
Once the pulse rate has been detected, it will need to be extracted. A second orderbutterworth filter will be used to do this. Using P-SPICE and MATLAB, we will
simulate the filter to make sure it will operate under our specified design
requirements.
Due to interference caused by ambient light and level detection distortions, thedesired signal can be extracted from the noisy signal using a second order low pass
Butterworth filter. This filter is chosen because it is characterized by a magnituderesponse that is maximally flat in the passband and monotonic overall. Butterworthfilters sacrifice roll-off steepness for monotonicity in the passband and stopband.
Since the heart signal we are measuring is low in amplitude, we do not want anyattenuation in the passband and therefore the second order Butterworth filter will
meet our design objectives.
The frequency response of the filter is obtained by using the following equation:__________H(jw) = K / v1 + (w/wc)2n
The pole-zero plot for the filter is obtained and shown below;
Figure 4.2-1 Pole-Zero plot of 2nd
Order Low Pass Filter
The gain of the filter used is 1, and R1 = mR, R2 = R, C1 = C, C2 = nC. Since it is a
lowpass Butterworth filter, m = 0.229 and n = 3.3. By setting C2 = 0.068 µF, the

7/31/2019 Heart Monitor
http://slidepdf.com/reader/full/heart-monitor 12/38
HEART MONITOR Page 12 of 38
ECE4512 4/30/01
value of the resistance R1 and R2 and capacitance C1 are obtained using thefollowing equation:
___
fc = 1 / (2pRCvmn ); where fc = 4Hz
Figure 4.2-1 2nd
order Butterworth Filter
4.3 Digitization of the pulse rate signal
In order to use a micro-controller to count the pulse rate, the signal must be digitized.
A phase-shift comparator will be used to find rising edges of the filtered signalreceived by the photo-sensor. A one-bit Analog to Digital converter should beadequate to digitize the pulse signal. This will allow one pin of the micro-controller
to be used as an input. The time between rising pulse edges will be determined by themicrocontroller so that the frequency of the heart rate can be measured. We willdesign a comparator that has a performance that will produce a reliable output for a
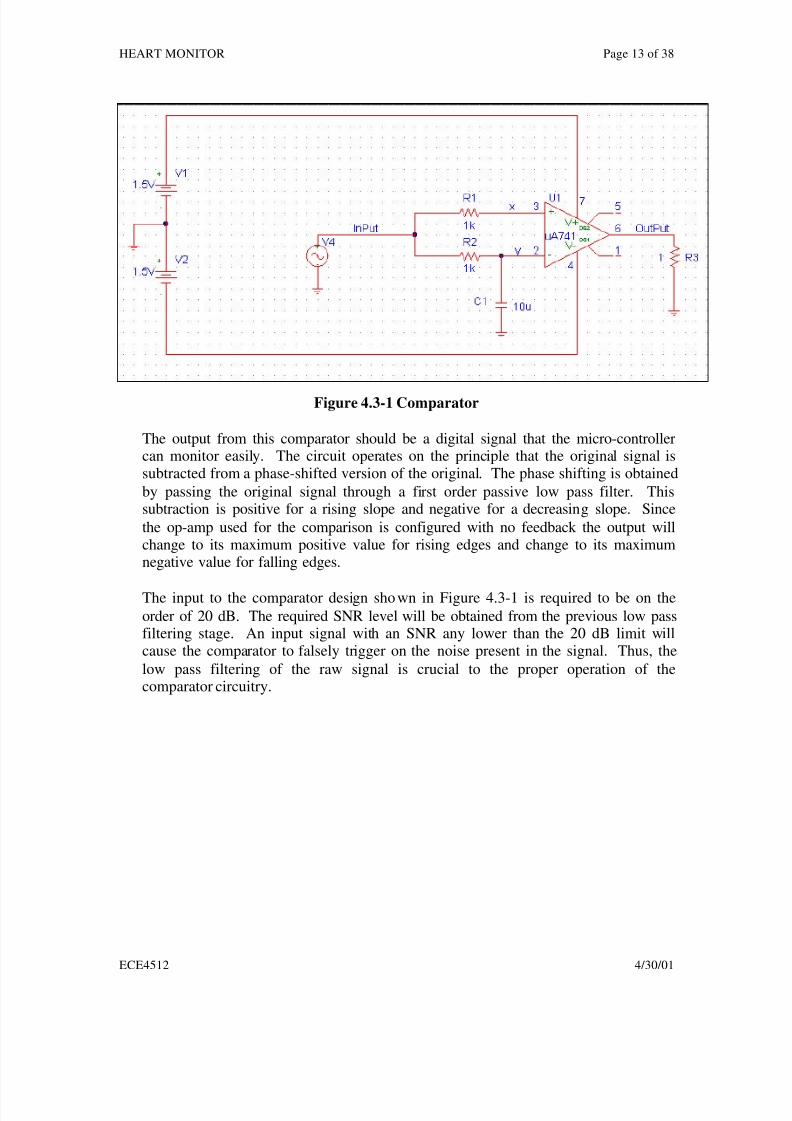
relatively low input SNR. The designed circuit is shown in Figure 4.3-1.
7/31/2019 Heart Monitor
http://slidepdf.com/reader/full/heart-monitor 13/38
HEART MONITOR Page 13 of 38
ECE4512 4/30/01
Figure 4.3-1 Comparator
The output from this comparator should be a digital signal that the micro-controllercan monitor easily. The circuit operates on the principle that the original signal issubtracted from a phase-shifted version of the original. The phase shifting is obtained
by passing the original signal through a first order passive low pass filter. Thissubtraction is positive for a rising slope and negative for a decreasing slope. Since
the op-amp used for the comparison is configured with no feedback the output willchange to its maximum positive value for rising edges and change to its maximumnegative value for falling edges.
The input to the comparator design shown in Figure 4.3-1 is required to be on the
order of 20 dB. The required SNR level will be obtained from the previous low passfiltering stage. An input signal with an SNR any lower than the 20 dB limit willcause the comparator to falsely trigger on the noise present in the signal. Thus, the
low pass filtering of the raw signal is crucial to the proper operation of thecomparator circuitry.

7/31/2019 Heart Monitor
http://slidepdf.com/reader/full/heart-monitor 14/38
HEART MONITOR Page 14 of 38
ECE4512 4/30/01
4.4 Micro-controller
A micro-controller is an economical means of counting the pulse rate and controllinga LED display. The circuit diagram in figure 4.4-1 shows the combined
microcontroller and display interconnection. Since board space is at a premium in
our design, we directed our design toward reducing the number of large chips used.The method used below allows the displays to be driven without the use of a display
driver. The displays will be set and refreshed by multiplexing the segment lines tothe same I/O pins on the microcontroller.
Figure 4.4-1 Micro-controller
Programming the micro-controller will involve developing a calculation algorithm to
count the pulse rate. The calculation algorithm for counting the pulse rate will beeasy to develop using Firmware.

7/31/2019 Heart Monitor
http://slidepdf.com/reader/full/heart-monitor 15/38
HEART MONITOR Page 15 of 38
ECE4512 4/30/01
The micro-controller will continuously be checking if a signal is fed into it. Once asignal is detected the algorithm will begin as follow:
1) Set the timer to zero.
2) Increment the timer for every peak of the digitized signal.
3) Repeat step two until timer equals 5, and the time taken to reach the 5counts (Na) is stored.
4) Calculate the beats per minute using equation: BPM = 12Na.5) Send the heart beat rate to the LED display.
6) If the reset button is pushed the routine will reset.
Figure 4.4-2 Algorithm for detecting pulse rate
Start Reset TMR N + 1
CalculateFrequency
If TMR <5
If Reset DisplayBPM
BPM =12Nα

7/31/2019 Heart Monitor
http://slidepdf.com/reader/full/heart-monitor 16/38
HEART MONITOR Page 16 of 38
ECE4512 4/30/01
4.5 Complete Design
Once each stage of the design has been simulated to prove that each stage will work,the design will be tied together to form a complete working design. The signal will
be transmitted and received using the circuit in Figure 4.1-3. Next, using the low-
pass filter in Figure 4.2-1, the signal will extracted so that it can be digitized using thecomparator circuit in Figure 4.3-1. Once the signal is digitized, it will be counted and
displayed using the micro-controller in Figure 4.4-1. In Figure 4.5-1 below, thisprocess is illustrated.
Figure 4.5-1 Flowchart of design
Optical Signal
Transmitter
Optical Signal
Receiver
Low Pass Filter&
AmplifierA/D
Micro-Controller
Display82

7/31/2019 Heart Monitor
http://slidepdf.com/reader/full/heart-monitor 17/38
HEART MONITOR Page 17 of 38
ECE4512 4/30/01
4.6 Cost Analysis
At this point, we have documented the necessary components along with componentprices to construct the design that we have simulated. Our design constraint for
component cost is $30.00. The chart below shows that this requirement has been met
at this point.
Table 4.6-1 Cost Analysis for components
Red LED (RS-2760307) $1.99
Photo-Sensor (RS-2761657) $0.45
Micro-controller (PIC16F84) $7.33
741 Op-Amp (LM324D) $0.56
3 volt battery (614-CR2477N) $2.90Capacitors and resistors $3.85
LED display (153-1005-ND) $5.70
PCB board $1.99
Plastic package (SCRA-ND) $3.06
Battery Clip (RS-2710777) $0.79
Transistor (2N2222) $0.99
Total $29.61
Part Price

7/31/2019 Heart Monitor
http://slidepdf.com/reader/full/heart-monitor 18/38
HEART MONITOR Page 18 of 38
ECE4512 4/30/01
5. Test Specifications
In order to obtain specifications for our design, several preliminary tests will beconducted. These tests will consist of both analog and digital applications. Hardware
and software will be used to perform these tests. We will construct prototypes of
each stage of our design to ensure that they interface properly.
In table 1 below, a description of the tests used to verify our requirements isillustrated. By performing these tests, we will produce the needed data to ensure that
our design will interface and work properly.
Requirement OpticalTransmit andReceive Test
CircuitSimulation
Noise Filtering Firmware Test PhysicalPackaging
Pulse Detection • •
Signal Extraction• • •
Accuracy •
Display •
Duration •
Power •
Durability •
Packaging •
Cost • •
Table 1. A general description of the tests to be used in the design of a heart rate
monitor.
5.1 Optical Transmit and Receive Testing
The transmit and receive testing will be done using the LED and photo-sensor. A
simple circuit using these components will be constructed and tested to obtainnecessary data. From this data, we will be able to examine pulse detection andexperiment with signal extraction.

7/31/2019 Heart Monitor
http://slidepdf.com/reader/full/heart-monitor 19/38
HEART MONITOR Page 19 of 38
ECE4512 4/30/01
5.2 Circuit Simulation
This test will help analyze several requirements. Using P-spice, we will constructschematics in different stages of our design. Designing a filter to attenuate the noise
will simulate signal extraction. Power and duration requirements will be determined
by simulation. Once we have a complete schematic of our design, the accuracyrequirement can be tested. From this simulation, specifications calculated willdetermine which parts to buy that will address the cost requirement.
5.3 Noise Filtering
This test will begin by capturing raw data from the LED and photo-sensor. An
oscilloscope will be used to detect noise from ambient light and other sources. Thistest will determine the amount of noise that will be attenuated to extract the pulsesignal. Matlab will be used for some signal analysis.
6. Test Certification
The prototype heart monitor was tested so that it meets all the test specifications set inthe beginning of the project. This is done by comparing the hardware results with the
simulated results to verify its functionality. The tests are conducted in several parts toensure that each individual component of the design is functioning.
6.1. Simulated Results.
Before the hardware was build, every single part of the design was first simulated.The simulations are very important in making sure that the design will function. In
this design, the simulations were divided into several parts: optical receive andtransmit circuit, filter circuit, comparator circuit and finally, the entire integratedcircuit.
6.1 .1. Optical Receive and Transmit Results.
A simple circuit containing a red LED matched to the photo sensor is connected to an
oscilloscope to measure the signal received by the photo sensor.

7/31/2019 Heart Monitor
http://slidepdf.com/reader/full/heart-monitor 20/38
HEART MONITOR Page 20 of 38
ECE4512 4/30/01
Figure 6.1.1-1 Pulse Receiving Circuit
The pulse receiving circuit shown above is used to obtain real data using the O-
Scopes in the Communications Laboratory. The scope plot in Figure 6.1.1-2 isobtained from the pulse receiving circuit under low ambient light noise condition.This is achieved in an environment where there is no ambient light source in the
vicinity. This plot contains the heart beat signal, which is around 2Hz and some120Hz noise.
Figure 6.1.1-2 Real Pulse with low noise

7/31/2019 Heart Monitor
http://slidepdf.com/reader/full/heart-monitor 21/38
HEART MONITOR Page 21 of 38
ECE4512 4/30/01
Matlab was then used to simulate the obtained pulse rate with low noise data andfigure 6.1.1-3 shows the plot obtained from the simulation.
Figure 6.1.1-3 Matlab simulated plot for real pulse rate with low noise
In Matlab, the FFT of the low noise signal was obtained to measure its SNR. Fromthe plot above, the SNR is found to be 9.54 dB.
The second scope plot shown in Figure 6.1.1-4 on the other hand is obtained under
noisy ambient light condition. This plot contains the heart beat signal and a large sumof 120Hz noise.
Figure 6.1.1-4 Real pulse rate with heavy 120 Hz noise
H
FF
Raw Signal
t

7/31/2019 Heart Monitor
http://slidepdf.com/reader/full/heart-monitor 22/38
HEART MONITOR Page 22 of 38
ECE4512 4/30/01
Again, Matlab was used to simulate the obtained pulse rate with heavy 120 Hz noisedata, shown in figure 6.1.1-4.
Figure 6.1.1-5 Matlab simulated plot for real pulse rate with heavy 120 Hz noise
From the plot above, the SNR is calculated to be –18dB. The plot shows the signal ismainly influenced by 120Hz noise and its harmonics at 240Hz.
6.1.2. Noise Filtering
A second-order butterworth low-pass filter was used to filter the noise from thesignal. Figure 6.1.2-1 shows the Butterworth 2nd order low-pass filter circuitry. The
filter will have a cutoff frequency of 4Hz to allow a maximum heart rate of 200 beatsper minute. The filter also has a roll off rate of 20dB/decade. Referring to the outputof the filter simulation at figure 6.1.2-2, this roll off will provide an attenuation of the
greatest source of noise at 120Hz by 60dB
v
Hz
FFT
Raw Signal
t

7/31/2019 Heart Monitor
http://slidepdf.com/reader/full/heart-monitor 23/38
HEART MONITOR Page 23 of 38
ECE4512 4/30/01
Figure 6.1.2-1 Butterworth 2nd Order Low-Pass Filter
Figure 6.1.2-2 Output from the filter simulations
The filter is also being simulated using Matlab to verify its functionality. The raw
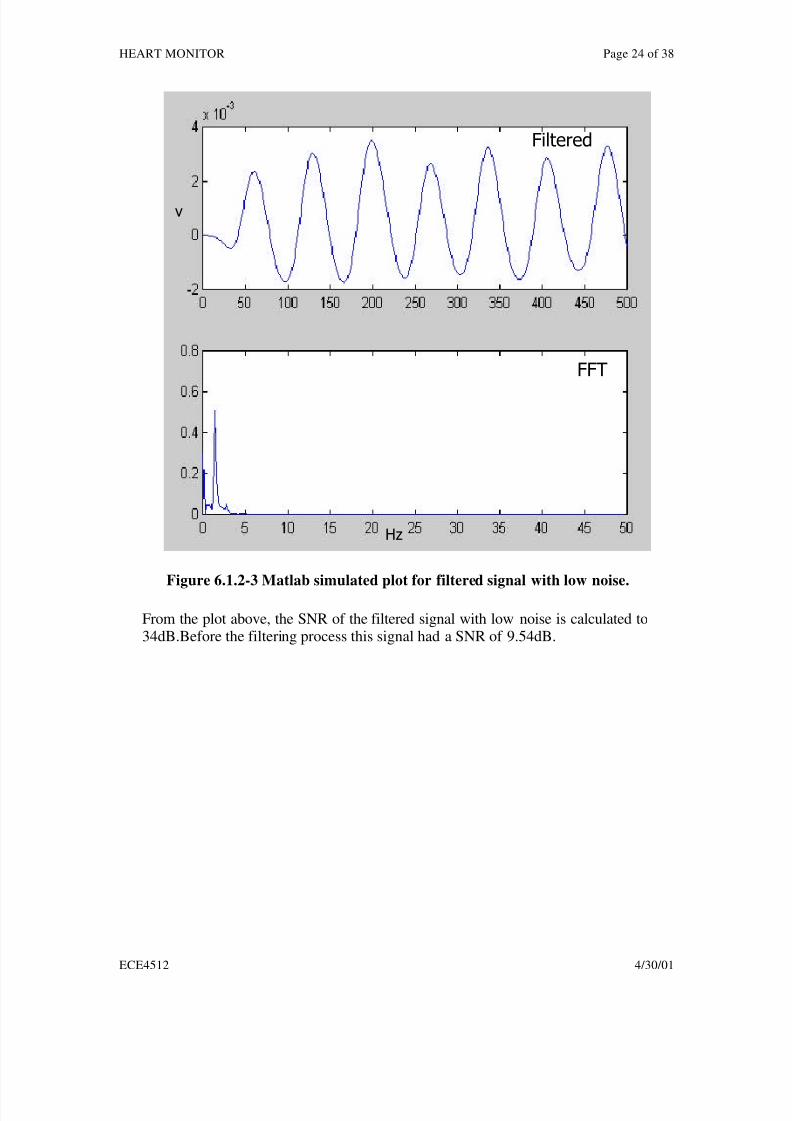
heart pulse signal obtained from section 6.1 is used in the simulation of theButterworth 2nd order low-pass filter. Figure 6.1.2-3 shows the Matlab simulated plot
for the filtered signal with low noise.
=
60Hz
120Hz
7/31/2019 Heart Monitor
http://slidepdf.com/reader/full/heart-monitor 24/38
HEART MONITOR Page 24 of 38
ECE4512 4/30/01
Figure 6.1.2-3 Matlab simulated plot for filtered signal with low noise.
From the plot above, the SNR of the filtered signal with low noise is calculated to34dB.Before the filtering process this signal had a SNR of 9.54dB.
FFT
Filtered
Hz
v

7/31/2019 Heart Monitor
http://slidepdf.com/reader/full/heart-monitor 25/38
HEART MONITOR Page 25 of 38
ECE4512 4/30/01
Figure 6.1.2-4 below shows the Matlab simulated plot for the filtered signal withheavy noise.
Figure 6.1.2-4 Matlab simulated plot for filtered signal with heavy noise.
From the plot above, the SNR of the filtered signal with low noise is calculated to23.5dB.Before the filtering process this signal had a SNR of –18dB. This plot also
proves that the Butterworth 2nd Order low-pass filter has successfully removed the120Hz noise.
6.1.3. Pulse Digitizing
The design of the comparator shown in Figure 6.1.3-1 is used to convert the
continuous signal to a discrete signal of 1Vpp. The comparator requires the incomingsignal to have a SNR of at least 20dB so that it can successfully digitize the signal.
An input signal with an SNR of any lower than 20dB will cause the comparator tofalsely trigger on the noise present in the signal. The plot in Figure 6.1.3-2 shows the

7/31/2019 Heart Monitor
http://slidepdf.com/reader/full/heart-monitor 26/38
HEART MONITOR Page 26 of 38
ECE4512 4/30/01
simulated results from PSPICE. This plot shows that the comparator circuit is able toconvert the continuous signal to a discrete signal.
Figure 6.1.3-1 Comparator circuit
Figure 6.1.3-2 Comparator Simulated Output
Requires20dB SNR

7/31/2019 Heart Monitor
http://slidepdf.com/reader/full/heart-monitor 27/38
HEART MONITOR Page 27 of 38
ECE4512 4/30/01
The comparator is also being simulated using Matlab to verify its functionality. Theraw filtered heart pulse signal obtained from section 6.1.2 is used in the simulation of
the comparator. Figure 6.1.3-3 shows the matlab simulated comparator output for thefiltered signal with low noise. Figure 6.1.3-4 shows the matlab simulated comparator
output for the filtered signal with heavy noise.
Figure 6.1.3-3 Matlab simulated comparator output for signal with low noise
Figure 6.1.3-4 Matlab simulated comparator output for signal with heavy noise.
Comparator Output

7/31/2019 Heart Monitor
http://slidepdf.com/reader/full/heart-monitor 28/38
HEART MONITOR Page 28 of 38
ECE4512 4/30/01
6.1.4. Design Simulation using theoretical data for the entire circuitry
This stage of simulation contains the pulse receiving circuit, the filter and comparator.Using P-SPICE, the pulse rate is simulated using a 60 Hz and 120 Hz noise under
ideal conditions. This simulation shows that under ideal conditions, our design is
successful. The figure below shows three plots that show the process of detecting,filtering, and digitizing the pulse-rate signal.
Figure 6.1.4-1 P-SPICE simulations using theoretical noise

7/31/2019 Heart Monitor
http://slidepdf.com/reader/full/heart-monitor 29/38
HEART MONITOR Page 29 of 38
ECE4512 4/30/01
6.2. Actual Hardware Test Results
6.2.1. Optical Receive and Transmit Results.
The first phase of the prototype, the optical receiver and transmitter, is constructed
and tested. The output of the receiver is connected to an O-scope to obtained the heartbeat signal. Figure 6.2.1-1 shows the heart beat signal obtained from the prototype.As expected from our simulation, the obtained signal contains 120Hz noise. Thissignal has a SNR of –9dB.
Figure 6.2.1-1 Heart Beat Signal
6.2.2. Noise Filtering
A second-order butterworth low-pass filter is used to filter the noise from the heart
beat signal. The low pass filter has a cutoff frequency of 4Hz and a roll-off rate of 20dB/decade. Figure 6.2.2-1 shows the real output obtained after the noisy heart
signal is passed through the filter. Comparing figure 6.2.1-1 and figure 6.2.2-1, it isclear that the high frequency noise of 120Hz from ambient lights has been filtered out
as expected. The filtered signal is required to have a SNR of 20dB or greater, toensure that the comparator is able to correctly convert the continuous signal to adigitize form without producing false trigger due to noise. The filtered signal below
has a SNR of approximately 24dB, and this will allow the comparator to properlydigitize the heartbeat. This test shows that the filter is able to remove high frequencynoise from the heartbeat signal.

7/31/2019 Heart Monitor
http://slidepdf.com/reader/full/heart-monitor 30/38
HEART MONITOR Page 30 of 38
ECE4512 4/30/01
Figure 6.2.2-1 Filter Output
6.2.3. Comparator Circuit Results.
A phase-shift comparator is used to detect rising edges of the filtered signal. Thecomparator will convert the continuous signal from the low pass filter to a digital
signal of 1Vpp and then feed this digitized signal into the micro-controller. Thecomparator will be able to produce a digital output if the input signal has a SNR of order 20dB or higher. Figure 6.2.3-1 is the real output of the comparator, where the
continuous heart signal was successfully converted to a digitized form.
From figure 6.2.3-1, three spikes occurred due to the comparator falsely triggering thesignal. This happened because the photon sensor of the prototype does not have astable position on the breadboard. However, at the final packaging, this problem
would not arise because it will be fitted properly on the PC board.

7/31/2019 Heart Monitor
http://slidepdf.com/reader/full/heart-monitor 31/38
HEART MONITOR Page 31 of 38
ECE4512 4/30/01
Figure 6.2.3-1 Comparator Output
6.2.4. Micro-Controller
The micro-controller is programmed to count the number of peaks of the input signalin 10 seconds, and the result is further multiplied by 6 to obtain the total number of peaks per minute. In the testing of the micro-controller, the LED display is connected
to the micro controller and a known frequency pulse signal is fed into it. The correct
number of peaks per minute value is showed on the LED display. When the micro-controller is integrated into the entire design circuitry, it is able to count the numberheartbeats per minute and drive the LED display to display the counted value.Therefore, the interface between the entire circuit and the micro-controller is
functional. The accuracy of the heart monitor is also tested. The only way to performthis test is to obtain a more consistent and accurate heart pulse from an
electrocardiogram (EKG) and compared the results with the one obtained using theprototype heart monitor. Table 6.2.4-1. shows the results of the comparison.

7/31/2019 Heart Monitor
http://slidepdf.com/reader/full/heart-monitor 32/38
HEART MONITOR Page 32 of 38
ECE4512 4/30/01
Electrocardiogram(beats per minute)
Heart Monitor(beats per minute)
Percentage Error (%)
76 78 2.56
78 78 0.00
76 72 5.56
82 84 2.3883 84 1.19
85 90 5.56
77 84 8.33
79 84 5.95
89 96 7.29
Table 6.2.4-1 Accuracy Comparison with an Electrocardiogram
The comparison shows that the accuracy of the prototype heart monitor has a mean of
4.31 and standard deviation of 2.87. However, this accuracy may defer depending onthe circumference size of the finger of the user. Table 6.2.4-2 shows the percentage
average error of the prototype for different users with different fingers’ circumferencesize.
Finger Type Average % errorBig Finger (3.0”) 15.67
Medium Finger (2.5”) 4.31Small Finger (2.125”) 8.91
Table 6.2.4-2 Accuracy Comparison with different finger sizes
6.2.5. Power Consumption
The initial proposed power consumption was to use a CR 2477, 3-volt lithium coincell battery source. Initial estimate of power consumption of the design was no morethan 30mA. However during the process of implementing the design, the circuitry is
consuming more power than expected. The reason being so, is because an amplifyingstage was added in the design to amplify the incoming signal from the photo sensor.
In driving the LED display, the micro-controller is also consuming more power thanwas expected. The design is now consuming approximately 36mA. To solve thisproblem, an additional CR 2477, 3-volt lithium cell battery will be used to operate the
device.

7/31/2019 Heart Monitor
http://slidepdf.com/reader/full/heart-monitor 33/38
HEART MONITOR Page 33 of 38
ECE4512 4/30/01
6.2.6. Durability
This part of the test is not performed on the final package of the heart monitorbecause the final product is not functioning.
6.2.7. Physical Packaging
In order to fulfill the size constrained as proposed in the project, a printed circuitboard (PCB) is used for the heart monitor. Surface mount technology (SMT)components are used for the design due to the small size of the board. A very difficult
task was faced by the team members, in the process of soldering the SMTcomponents onto the PCB. This is because every SMT components used are
extremely small and thus, soldering the components requires tedious job and patience.Figure 6.2.7-1 shows the PCB used for the final package of the design, while figure6.2.7-2 shows the size comparison of one of the SMT resistors used in the final
package with a through-hole resistor.
Figure 6.2.7-1 Printed Circuit Board

7/31/2019 Heart Monitor
http://slidepdf.com/reader/full/heart-monitor 34/38
HEART MONITOR Page 34 of 38
ECE4512 4/30/01
Figure 6.2.7-2 Size Comparison of SMT and Through-hole resistor
However, the components are successfully mounted onto the PCB and the PCB isplaced into an enclosed rectangular box with the dimension of 2.5” X 1.7” X 1” (H XW X D). Figure 6.2.7-3 below shows the layouts of the design in its final package.
Figure 6.2.7-3 Final Package Layouts

7/31/2019 Heart Monitor
http://slidepdf.com/reader/full/heart-monitor 35/38
HEART MONITOR Page 35 of 38
ECE4512 4/30/01
6.2.8. Final Cost
The final cost of the prototype including all the components used is shown in Table6.2.8-1. However, if the heart monitor is produced in bulk, the bulk cost per unit will
not exceed USD 24.86.
Part Price (USD)
Red LED (RS-2760307) 1.99
Photo-Sensor (RS-2761657) 0.45
Micro-Controller (PIC 16F84) 6.58
741 Op-amp (LM 324D) 0.50
3 Volt Battery (614-CR2477N) 3.76
Capacitors and resistors 3.34
LED Display (153-1005-ND) 5.58
PCB Board 9.99
Plastic Package (SCRA-ND) 2.99Battery Clip (RS-2710777) 1.56
Transistor (2N2222) 0.30
Total 37.04
Table 6.2.8-1 Final Prototype Cost
7. Summary
Through thorough simulation, we have shown that the pulse rate can be detected fromchanges of blood flow through an index finger. Simulation also shows that the pulse
rate can be filtered and digitized so that it can be counted to calculate an accuratepulse rate. The results obtained from the prototype matches the simulation resultsobtained in Senior Design I. During the course of implementing the prototype, only
one design requirement was changed. The power requirement for the design waschanged from using one 3-volt lithium cell battery to two 3-volt lithium cell battery.
However, the overall design was a success. The prototype is able to detect, filter,digitize, and display the heartbeat of a user.
8. Acknowledgements
We wish to acknowledge Dr. Lori Bruce for her technical support regarding this
project. We also want to thank Dr. Joe Picone for his guidance through the designprocess.

7/31/2019 Heart Monitor
http://slidepdf.com/reader/full/heart-monitor 36/38
HEART MONITOR Page 36 of 38
ECE4512 4/30/01
9. Individual Contributions
Todd Peacock
• Filter and comparator design
• Micro-controller frequency detection
• Optical signal generation and detection• Matlab and Pspice simulation
• Packaging
• Documentation
Craig Williamson
• Filter and comparator design
• Optical signal generation and detection
• Matlab and Pspice simulation
• Packaging
•
Documentation
Chong Meng Teh
• Updating and maintaining the webpage
• Optical signal generation and detection
• Matlab and Pspice Simulation
• PCB layout design
• Documentation
Voon Siong Sui
• Filter design simulation
• Micro-controller LED display programming• Matlab and Pspice simulation
• PCB layout design
• Documentation

7/31/2019 Heart Monitor
http://slidepdf.com/reader/full/heart-monitor 37/38
HEART MONITOR Page 37 of 38
ECE4512 4/30/01
References
[1] Z. Kmietowicz, “Better coronary care reduces deaths from heart disease,” BritishMedical Journal, p600, Tavistock Square, London March 2000.
[2] J. Weller, “You’ve got the beat,” Women’s Sport and Fitness, p68, USA,September 1997.
[3] R. Bandler, “Cardiac problem at heart of SIDS?”, BBI Newsletter,
American Health Consultant, Inc., USA, April 1998.
[4] J. Hastings, “You Call This Exercise?”, Health, Vol. 14, p106, USA, June 2000.
[5] M. Bane, “Watch the Monitor,” Men’s Health, Vol. 11, p144, USA, November
1996.
[6] P. Kandela, “The stethoscope,” The Lancet Interactive, UK, p23, September1998.
[7] J. Carroll, “SIDS: counseling parents to reduce the risk,” American FamilyPhysician, Leawood, KS, April 1998.
[8] J. Csatari, “The beat goes down,” Men’s Health, Vol. 10, p23, USA, September1995.
[9] T. Fritz, “The Heart of bodybuilding,” Muscle & Fitness, USA, p77, October1999.
[10] C. Smith, “How to become your own personal trainer with the use of a heart rate
monitor,” Fire Engineering, Vol. 149, p118, USA, June 1996.
[11] J. Hilburn and D. Johnson, Manual of Active Filter Design, McGraw-Hill, Inc.,
New York, 1973.
[12] A. Roll, “PIC-based Controllers”, Electronics Australia, Vol. 62, p70, September2000.
[13] S. Orfanidis, Introduction to Signal Processing, 1st edition, Prentice Hall, Inc.,
New Jersey, USA, 1995.
[14] R. Goody, Microsim Pspice for Windows: A Circuit Simulation Primer, 2nd edition, vol. 1, Prentice Hall, Upper Saddle River, New Jersey, USA, 1998.
[15] T. Sifferlen and V. Vartanian, Digital Electronics with Engineering Applications,
Prentice-Hall, Inc., New Jersey, 1970.

7/31/2019 Heart Monitor
http://slidepdf.com/reader/full/heart-monitor 38/38
HEART MONITOR Page 38 of 38
[16] M. Fogiel, Modern Microelectronics, Research & Education Association, NewYork, 1972.
[17] J. Millman, Digital and Analog Circuits and Systems, McGraw-Hill, Inc., New
York, 1979.
[18] D. Comer, Modern Electronic Circuit Design, Addison-Wesley Publishing
Company, Inc., 1976.
[19] D. Defatta and J. Lucas and W. Hodgkiss, Digital Signal Processing: A SystemDesign Approach, John Wiley & Sons, Inc., New York, 1988.
[20] PIC Micro Microcontroller Families,http://www.microchip.com/10/lit/pline/picmicro/families/16f8x/index.htm,
Microchip Corporation, Santa Clara, California, USA.
[21] D. Hanselman and B. Littlefield, Mastering MATLAB 5, Prentice Hall, Upper
Saddle River, New Jersey, USA, 1998.