how to build a simple heart rate monitor - abiola bakare's ... · introduction to manual on...
TRANSCRIPT

2013
Abiola Bakare
University of North Texas
5/3/2013
How To Build A Simple Heart Rate Monitor


iii
Table of Contents Introduction ............................................................................................................. v
Design and Biomedical influence............................................................................. v
Materials Needed .................................................................................................... vi
Theory of Operation ................................................................................................. 1
Instructions .............................................................................................................. 2
Step 1: Building the Circuit ................................................................................... 2
Step 2: Reading the data ....................................................................................... 3
Step 3: Building the VI .......................................................................................... 4
Step 4: Testing the Heart rate monitor ................................................................ 5
How the Band-pass Filter Works ............................................................................. 6
Conclusion ................................................................................................................ 7


v
Introduction to manual on building a simple heart rate monitor
A heart rate monitor is a good piece of equipment that can be used by a variety of persons. It is mostly used by medical practitioners to monitor their patients’ heart rate, senior citizens who usually have high pulse rates and athletes who consider it a valuable equipment to measure the intensity of their exercises. The heart rate is the only number that is essential since the heart rate provides a true index of their current fitness level and a solid way to measure fitness improvement.
This manual is a step by step breakdown of how to build a simple heart rate monitors for electrical engineering projects and to better understand digital signal processing. We will explain the use of signal filtering, as the circuit design decision for the project. We will also explain data acquisition and processing with the LabVIEW project.
Design and Biomedical influence Basically the sensor includes a photoresistor absorbing enough light to generate an analogue signal that is transmitted into the NI myDAQ. In this project we are dealing mostly with the systole which occurs when blood is pushed from the heart through the aorta that is then transferred to the rest of the body, we used an extremity (the index finger) because it the easiest to pass through a basic cheap sensor like ours. As the heart beats blood is pushed into the arteries which are present in the fingers, this can be detected as momentary increase in the volume of blood; when you shine the red led through the finger light is absorbed based the increase or decrease of blood in the finger. This change can be counted as a pulse, which is then absorbed by the photoresistor.

vi
Materials Needed • 2 red LED’s. • A photoresistor. • 330 ohms resistors (2). • NI myDAQ kit. • A 9v battery. • A breadboard. • Jumper Wires. • LabVIEW software installed on a windows PC
LED Photoresistor Resistors
myDAQ
9V battery Jumper wires
breadboard

1
Theory of Operation For the Heart Rate Monitor we only need a Collector VI, Filter VI and Peak Finder VI on the LabVIEW program. On the Peak finder we encounter a problem setting the parameters in the electrocardiogram (ECG) with wandering baseline and different shapes of the individual waveforms for different individuals. For the wandering baseline we will have to use two filters, a high-pass filter and a low-pass filter. Since the ECG tends to have a wandering baseline, we need a high pass cut off about 0.05 HZ. This will allow enough baseline wander to work with the peak finding. So we will filter the signal beforehand with a high-pass filter with a higher frequency like 1 Hz. For different shapes we will use a low-pass filter since people have different shaped PQRST (provoke, quality, radiation, severity, triggering factor) complexes, and we want to set the peak threshold below the R-peak but above the other features that might trigger the peak finder’s P as T waves. But since we only want to show the heart rate monitor, we don’t need to include this and we can just filter as much as we can of the lower frequencies of P and T, leaving mostly R peaks to do the peak finding. Here we will low-pass as a frequency below 60 Hz before the peak finding. Since we will have to use two a high-pass filter and a low-pass filter we chose a band-pass filter on the LabVIEW program.
We must also set the number of peak samples in the peak finder to prevent multiple peak detections. After we are done with the signal filtering, we need to set the threshold. Since people have different R-wave peak magnitudes, we can’t just fix the values. Thus, we must fix some percentage of the maximum value in a given window as 15 or more seconds. Once we have the maximum value, we set the threshold at a fraction of the new value, as .6 as example. Then we will always cut only the R-waves and only once each peak samples.
The other part is the calculation for the Heart Rate. At the output of the peak finder there is the size of the location vector which is the number of peaks. The net sample separation is the sample value of the last peak minus the sample sampling time or delta S. The heart rate is the number of beats minus 1 as the number of beats in that time interval and as well we have to convert beats per minute dimensions. Since we want this on a rolling window of many seconds we will use the Collect VI.
2
Instructions for building a simple heart rate monitor
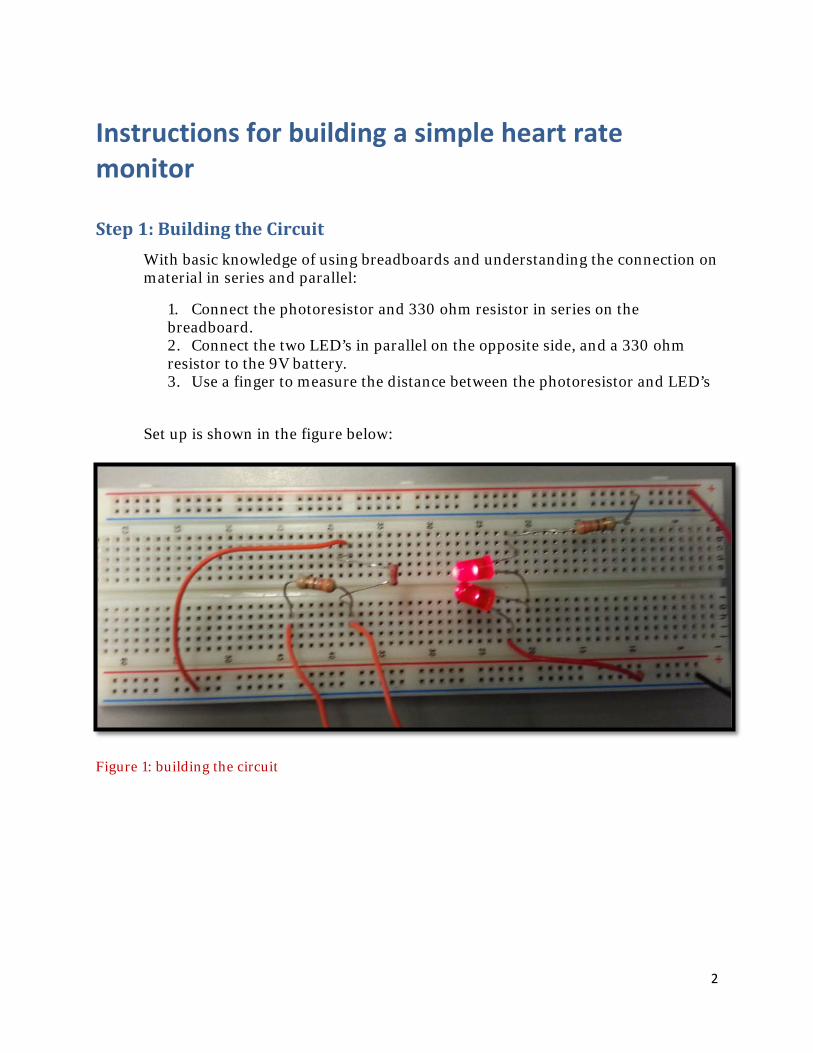
Step 1: Building the Circuit With basic knowledge of using breadboards and understanding the connection on material in series and parallel:
1. Connect the photoresistor and 330 ohm resistor in series on the breadboard. 2. Connect the two LED’s in parallel on the opposite side, and a 330 ohm resistor to the 9V battery. 3. Use a finger to measure the distance between the photoresistor and LED’s
Set up is shown in the figure below:
Figure 1: building the circuit

3
Step 2: Reading the data 1. Using the NI myDAQ, connect jumper wires to AGND and 1+ under the AI (+10 V) ports below respectively.
Figure 2: Front view of the physical structure of the NI myDAQ
2. Connect both wires from the NI myDAQ to the 330 ohm resistor linking the photoresistor to read analog data.
Figure 3: reading analog data with the myDAQ

iii
Step 3: Building the VI Modules Needed:
1. DAQ assistant 2. Waveform graph 3. Band pass filter 4. Collector module 5. Statistics module 6. Basic multiplication and division module 7. Peak detect module 8. Waveform graph for the filtered signal
Drag and drop all the modules needed onto the LabVIEW block diagram and connect them as shown below:
Figure 4: Block diagram for the LabVIEW
1. 2
3.
4.
5.
6.
6.
6.
7.
8.

5
By connecting the modules together as shown in figure 3, we have basically programmed the myDAQ to collecting the analog data, filter the data, collect the highest data point and filter it output in beats per minute as shown in the figure 5.
Step 4: Testing the Heart rate monitor Place any finger in between the LED’s and the photoresistor as shown in figure 4, then run the LabVIEW program.
Figure 5: testing the circuit
Similar outputs shown below should be obtained
Figure 6: output of the program running

iii
How the Band-pass Filter Works The band-pass filter has a pass-band set between 1 Hz and 3 Hz to allow heart beat signal to come through and other environmental frequency (noise) would be rejected. The band pass works by allowing frequency within a certain range pass and attenuates other signal frequencies.
Initially we intended on making both a high and low pass filter but instead we used a band-pass. The low pass was supposed to attenuate frequency from 40 Hz because the working frequency of surrounding light was around 60 Hz so I originally went low enough to eliminate that; but we ended up with a bad pass because it was better

7
Conclusion The heart rate monitor projects demonstrate how valuable LabVIEW can be on a daily basis of a person’s live. LabVIEW have many uses and help us familiarize deeper and enrich our curiosity to develop new and innovative projects. This final project also helped us to work in groups and share knowledge which at the time got us to know each other better.