heart failure hospitalizations - acc.21 scientific session
TRANSCRIPT

Reduction in Heart Failure Hospitalizations
With Ambulatory Hemodynamic Monitoring
Seen in Clinical Trials Is Maintained in the
'Real World'
Akshay S. Desai, MD, MPH*, Arvind Bhimaraj, MD, MPH, Rupinder Bharmi, MS,
Rita Jermyn, MD, Kunjan Bhatt, MD, David Shavelle, MD, Margaret M. Redfield, MD,
Robert Hull, MD, Jamie Pelzel, MD, Kevin Davis, BS, Nirav Dalal, MS, MBA,
Philip B. Adamson, MD, J. Thomas Heywood, MD

Background
• Despite guideline-directed treatment, patients with
symptomatic heart failure (HF) are at high risk for recurrent
hospitalizations and death
• Most HF hospitalizations (HFH) are congestive exacerbations
driven by progressive rise in intracardiac filling pressures
• Filling pressures typically rise weeks in advance of overt
symptoms
• Ambulatory hemodynamic monitoring may enable early
detection of impending congestion and direct intervention to
prevent hospitalization Chun S, et al. Circ Heart Fail. 2012;5:414-421
Zile MR, et al. Circulation. 2008; 118:1433-1441

CHAMPION Trial (N=550) Reduction in HFH with PA Pressure-guided therapy
CardioMEMS
PAP sensor
FDA Approved
May 2014
Chronic HF
NYHA III
Prior HFH
Abraham WT, et al. Lancet 2016; 387: 453-461.
- Treatment Group (158 HF hospitalizations)
- Control Group (254 HF hospitalizations)

Open Questions
Effectiveness vs. Efficacy
• How effective is ambulatory PAP monitoring in
reducing HF hospitalizations in ‘real world’ clinical
practice?
• Does the effectiveness vary in subgroups defined by
sex or age?
• Are comprehensive healthcare costs reduced in
practice?

Methods• Objective
– To evaluate the effectiveness of hemodynamic monitoring in
reducing health care utilization in the general use population
• Study Design
– Retrospective cohort study based on administrative claims using
100% data from the CMS Standard Analytic File
• Population
– All Fee-for-service Medicare beneficiaries undergoing PAP sensor
implantation between June 1, 2014 and June 30, 2016
– At least 6 months of continuous enrollment before and after
implantation
Statistical Methods
• Rates of HF and all-cause hospitalization during the 6 months
before and after PAP sensor implantation compared using the
Andersen-Gill method (accounting for competing risks)
• Comprehensive costs pre- and post-implant compared using a
non-parametric bootstrap model
• Analyses repeated for the smaller cohort with data available for
12 months before and after implant
• Sensitivity analyses conducted in cohorts restricted to
ambulatory implants and those completing the full analytic
period
• Data analyzed in subgroups defined by sex and age

Patient Selection1935 patients with PAP sensor implants
from June 1, 2014- June 30, 2016
1241 minimum 6-month follow-up data
11146-month cohort (primary analysis)
558 with minimum 12-month follow-up data
48012 month cohort (secondary analysis)
694 implanted after Jan 1, 2016
127 not continuously enrolled in Medicare
Part A and B or enrolled in HMO plan
556 implanted after June 30, 2015
78 not continuously enrolled in Medicare
Part A and B or enrolled into HMO plan

Patient Characteristics at Implant
6-month cohort (N=1114) 12-month cohort (N=480)
Mean age (yrs) 71.3 ± 10.8 71.4 ± 11.4
Age ≥ 75 yrs 460 (41.3%) 211 (44.0%)
Female 403 (36.2%) 180 (37.5%)
Race
White
Black
Other
902 (81.0%)
161 (14.5%)
51 (4.6%)
396 (82.5%)
69 (14.4%)
15 (3.1%)
Comorbidities
Diabetes
Hypertension
COPD
727 (65.3%)
1089 (97.8%)
861 (77.3%)
311 (64.8%)
471 (98.1%)
384 (80.0%)

Clinical Outcomes before and after PAP
sensor Implantation (6-month cohort)
1899
1020879
0
500
1000
1500
2000
All-CauseHospitalizations
HF Hospitalizations Non-HFHospitalizations
Pre-Implant Post-Implant

Clinical Outcomes before and after PAP
sensor Implantation (6-month cohort)
HR 0.55, 95% CI (0.49-0.61)
p<0.001
Cu
mu
lati
ve H
F H
osp
ital
izat
ion
s
1899
1020879
1119
381
738
0
500
1000
1500
2000
All-CauseHospitalizations
HF Hospitalizations Non-HFHospitalizations
Pre-Implant Post-Implant
Post-Implant:
139 deaths
17 VAD/transplants
NB: Event accumulation during the pre-implant interval displayed backwards
from time of implant
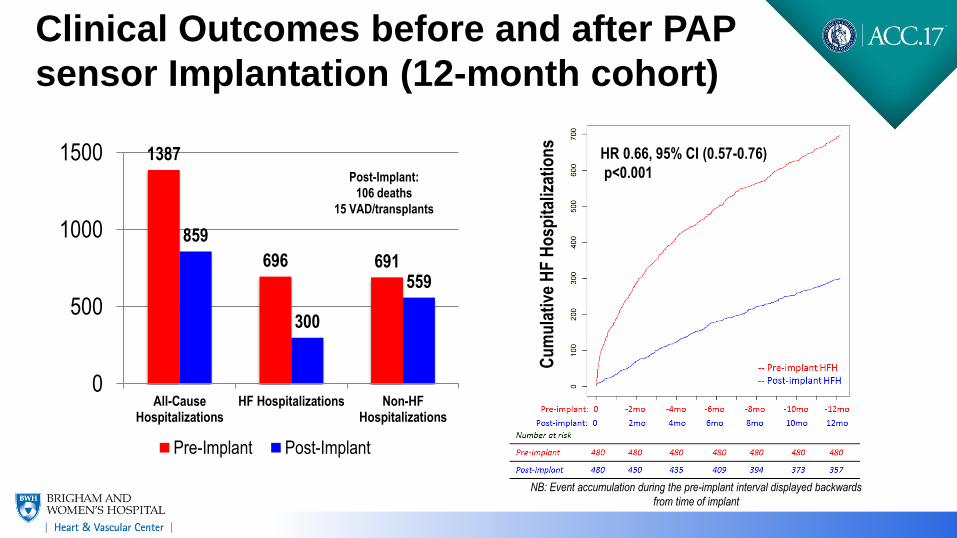
Clinical Outcomes before and after PAP
sensor Implantation (12-month cohort)
HR 0.66, 95% CI (0.57-0.76)
p<0.001
Cu
mu
lati
ve H
F H
osp
ital
izat
ion
s
1387
696 691
859
300
559
0
500
1000
1500
All-CauseHospitalizations
HF Hospitalizations Non-HFHospitalizations
Pre-Implant Post-Implant
Post-Implant:
106 deaths
15 VAD/transplants
NB: Event accumulation during the pre-implant interval displayed backwards
from time of implant
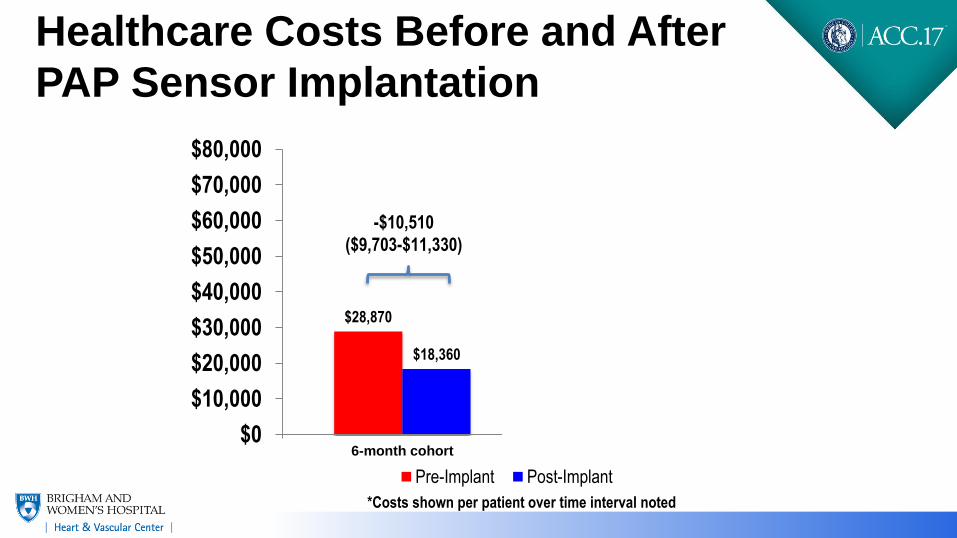
Healthcare Costs Before and After
PAP Sensor Implantation
$28,870
$47,690
$18,360
$34,500
$0
$10,000
$20,000
$30,000
$40,000
$50,000
$60,000
$70,000
$80,000
6-month cohort 12-month cohort
Pre-Implant Post-Implant
-$10,510
($9,703-$11,330)
-$13,190
($11,590-$14,740)
*Costs shown per patient over time interval noted

Subgroups of Interest
Age
Sex
Implant Type
Excluding Death
Excluding Death/VAD/Tx
Hazard Ratio for HFH (post v. pre)

Subgroups of Interest
Age
Sex
Implant Type
Excluding Death
Excluding Death/VAD/Tx
Hazard Ratio for HFH (post v. pre)

Limitations
• Nonrandomized data, no concurrent control
• Data regarding EF and NYHA Class not available
• Unable to comment on medication or hemodynamic changes
following device implantation
• Cannot exclude confounding by additional enhancements to
disease management in post-implant interval

Conclusions• In this retrospective, Medicare claims-based analysis,
cumulative HFH were 45% lower in the 6 months following PAP
sensor implantation than in the 6 months prior
• Similar HFH reductions seen in the subset of patients with
available 12 month pre- and post-implant data
• No observed variation in HFH reduction by sex or age
• Reductions in healthcare utilization translate into estimated
cost savings of $13,190 at 1 year (breakeven point of ~2 years)
• These data from an unselected population support the ‘real
world’ effectiveness of this approach to HF management


Back-up slides

Billing procedure codes used to identify PAP sensor implants
20

Billing codes used to identify HF hospitalizations
21

1899
1020879
1119
381
738
0
500
1000
1500
2000
All-CauseHospitalizations
HF Hospitalizations Non-HFHospitalizations
Pre-Implant Post-Implant
Post-Implant:
139 deaths
17 VAD/transplants
NB: Event accumulation during the pre-implant interval displayed backwards
from time of implant
Cu
mu
lati
ve A
ll-C
ause
Ho
spit
aliz
atio
ns
All-cause clinical outcomes before and after PAP sensor
Implantation (6-month cohort)

All-cause clinical outcomes before and after PAP sensor
Implantation (12-month cohort)
Cu
mu
lati
ve A
ll-C
ause
Ho
spit
aliz
atio
ns
1387
696 691
859
300
559
0
500
1000
1500
All-CauseHospitalizations
HF Hospitalizations Non-HFHospitalizations
Pre-Implant Post-Implant
Post-Implant:
106 deaths
15 VAD/transplants
NB: Event accumulation during the pre-implant interval displayed backwards
from time of implant

HF Healthcare Costs Before and After PAP Sensor Implantation
$12,410
$19,900
$4,945
$8,690
$0
$5,000
$10,000
$15,000
$20,000
$25,000
$30,000
$35,000
$40,000
6-month cohort 12-month cohort
Pre-Implant Post-Implant
-$7,433
($7,000-$7,884)
-$11,260
($10,460-$12,020)
*Costs shown per patient over time interval noted

PA Pressure Reduction in PracticeFirst 2000 Commercial PAP sensor Implants
Heywood JT, et. al. Circulation. 2017; ePub
CHAMPION Control
CHAMPION Treatment
General Use Cohort
Cha
nge
in P
AP
(A
UC
), m
mH
g-da
y
P=
0.0
47
6
P<
0.0
01