healthy people 2020: who’s leading the leading health ... indicators? featured speakers: • don...
TRANSCRIPT

Healthy People 2020: Who’s Leading the
Leading Health Indicators?

Tiffani Kigenyi, MPHPublic Health Analyst,
Office of Disease Prevention and Health Promotion,
U.S. Department of Health and Human Services

3
Who’s Leading the Leading Health Indicators?
• Leading Health Indicators are:o Critical health issues that, if addressed
appropriately, will dramatically reduce the leading causes of preventable deaths and illnesses
o Linked to specific Healthy People objectiveso Intended to motivate action to improve the health of
the entire population
1200 Healthy People objectives
LHIs are a subset of Healthy People
objectives

4
Who’s Leading the Leading Health Indicators?
Featured Speakers: • Don Wright, MD, MPH - Acting Assistant Secretary
for Health, U.S. Department of Health and Human Services
• Dr. Sarah Bacon, PhD - Lead Behavioral Scientist, Opioid Overdose Prevention Programs Team, Division of Unintentional Injury Prevention, National Center for Injury Prevention, Centers for Disease Control and Prevention, U.S. Department of Health and Human Services
• Fred Wells Brason II - President, CEO, Project Lazarus

Dr. Don Wright, MD, MPHActing Assistant Secretary for Health, U.S. Department of Health and Human
Services

6
Injury and Violence
• Unintentional injuries and violence-related injuries are important public health issues in the United States.
• Examples include motor vehicle crashes, homicide, domestic and school violence, child abuse and neglect, suicide, and unintentional drug overdoses.
• Both unintentional injuries and suicide are among the top 15 leading causes of death for Americans of all ages.
• In 2016, unintentional injuries were the 3rd leading cause of death for Americans of all ages.

7
Injury and ViolenceLeading Health Indicators
• Reduce fatal injuries(IVP-1.1)
• Reduce homicides (IVP-29)
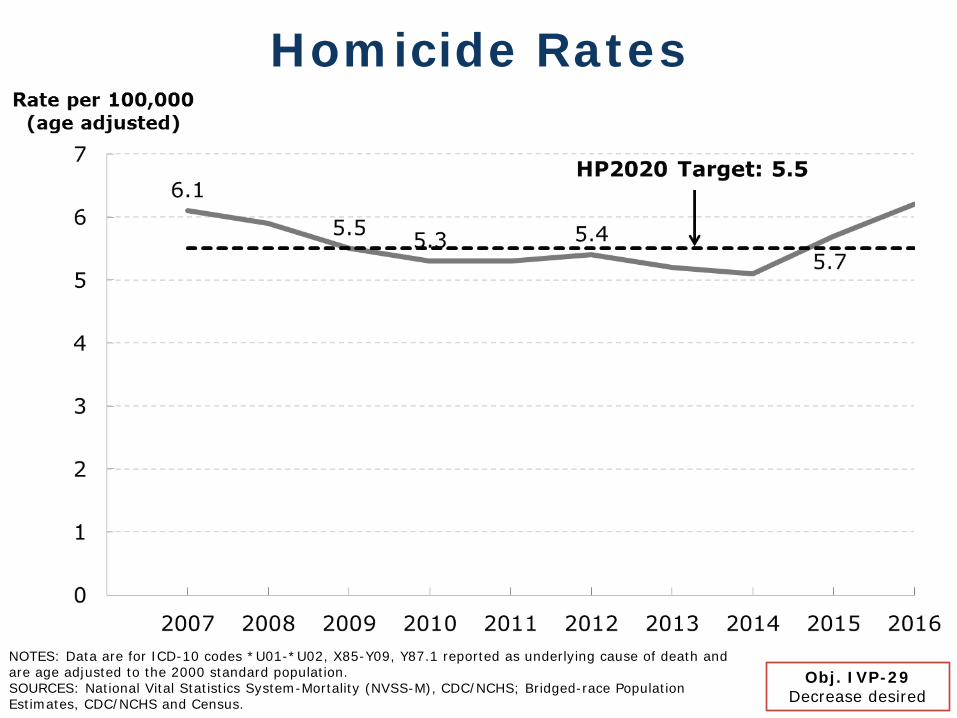
Homicide Rates
NOTES: Data are for ICD-10 codes *U01-*U02, X85-Y09, Y87.1 reported as underlying cause of death and are age adjusted to the 2000 standard population. SOURCES: National Vital Statistics System-Mortality (NVSS-M), CDC/NCHS; Bridged-race Population Estimates, CDC/NCHS and Census.
Obj. IVP-29Decrease desired

All Injury Death Rates by Sex
NOTES: Data are for injury deaths regardless of intent (unintentional, intentional, undetermined) based onICD-10 codes *U01-*U03, V01-Y36, Y85-Y87, Y89 reported as the underlying cause of death. Rates are age adjusted to the 2000 standard population. SOURCES: National Vital Statistics System-Mortality (NVSS-M), CDC/NCHS; Bridged-race Population Estimates, CDC/NCHS and Census.
Obj. IVP-1.1Decrease desired

Injury Death Rates by Cause
NOTES: Data are for poisoning, firearm and fall deaths regardless of intent (unintentional, intentional, undetermined). Motor vehicle traffic deaths are all unintentional. *IVP-23.1 tracks only unintentional fall deaths, which constitute the majority of fall deaths. IVP-23.1 does not include fall deaths that are of intentional or of undetermined intent so the HP2020 target is not shown. Rates are age adjusted to the 2000 standard population.SOURCES: National Vital Statistics System-Mortality (NVSS-M), CDC/NCHS; Bridged-race Population Estimates, CDC/NCHS and Census.
Obj. IVP-9.1, 13.1, 23.1*, 30Decrease desired

Poisoning Death Rates by Poison Type
NOTES: Data are for poisoning deaths regardless of intent (unintentional, intentional, undetermined). All poisoning data are for ICD-10 codes *U01.6-*U01.7, X40-X49, X60-X69, X85-X90, Y10-Y19, Y35.2 reported as underlying cause of death. Drug poisoning data are for ICD-10 codes X40-X44, X60-X64, X85, Y10-Y14 reported as the underlying cause of death. Opioid data are for drug poisonings reported as the underlying cause with ICD-10 T40.0-T40.4, 40.6 reported as a multiple cause of death, Both prescription and nonprescription opioids are included. Rates are age adjusted to the 2000 standard population.SOURCES: National Vital Statistics System-Mortality (NVSS-M), CDC/NCHS; Bridged-race Population Estimates, CDC/NCHS and Census.

12
Addressing Drug Overdoses in the United States
• Drug overdose deaths in the United States more than tripled from 1999 to 2016.
• In 2016, opioids killed more than 42,000 people in the United States.
• The best ways to prevent opioid overdose deaths include:o Improve opioid prescribingo Reduce exposure to opioidso Prevent misuseo Treat opioid use disorderso Reverse overdoses

National Center for Injury Prevention and Control
Injury Death in the United States
A focus on Opioids
Sarah Bacon, PhDLead Behavioral Scientist
Division of Unintentional Injury Prevention
Healthy People 2020January 18th, 2018


Healthy People 2020 and the Opioid Epidemic
IVP- 1.9 Prevent an increase in poisoning deaths

2000 Rapid Increase in Drug Overdose Death Rates by County
SOURCE: National Center for Health Statistics, National Vital Statistics System, mortality data (http://www.cdc.gov/nchs/deaths.htm).

2005 Rapid Increase in Drug Overdose Death Rates by County
SOURCE: National Center for Health Statistics, National Vital Statistics System, mortality data (http://www.cdc.gov/nchs/deaths.htm).

2010 Rapid Increase in Drug Overdose Death Rates by County
SOURCE: National Center for Health Statistics, National Vital Statistics System, mortality data (http://www.cdc.gov/nchs/deaths.htm).

2015 Rapid Increase in Drug Overdose Death Rates by County
SOURCE: National Center for Health Statistics, National Vital Statistics System, mortality data (http://www.cdc.gov/nchs/deaths.htm).

RISE IN OPIOID DEATHS
Overlapping, Entangled but Distinct Epidemics
3 Waves

Rise in Prescription Opioid Deaths in United States
1st WaveNearly 200,000 people died from prescription opioids in the last 17 years.
Natural and semi-synthetic opioid death rate increased
5-fold from 2000 to 2011
Methadone death rate increased 4-fold from 2000 to 2007

Rise in Heroin Deaths in United States
2nd WaveOver 60,000 people have died from heroin since 2010
Heroin death rate has increased over 5 fold since 2010

Rise in Synthetic Opioid Deaths in United States – Likely Illicit Fentanyl
3rd WaveDeaths from synthetic opioids excluding methadone increased from approximately 3,100 in 2013 to over 19,000 in 2016
Synthetic opioid death rate (excluding methadone) has increased 6-fold from
2013 to 2016

Pillars of CDC Activity
Conduct surveillance
and research
Build state, local, andtribal capacity
Support providers,health systems,and payers
Partner withpublic safety
Empowerconsumers to
makesafe choices
https://www.cdc.gov/drugoverdose/index.html

Conduct Surveillance and ResearchOverdose Prevention in States (OPIS)

Conduct Surveillance and Research
OPIS’s Enhanced State Opioid Overdose Surveillance(https://www.cdc.gov/drugoverdose/foa/state-opioid-mm.html)
Injury Control Research Centers (ICRC) fund extramural research like Project Lazarus

Build State, Local, and Tribal Capacity
Five Components of OPIS
https://www.cdc.gov/drugoverdose/states/state_prevention.html

Support Providers, Health Systems, & Payers
APP includes:– MME Calculator– Prescribing Guidance– Motivational Interviewing
https://www.cdc.gov/mmwr/volumes/65/rr/rr6501e1.htm

Partner with Public Safety
Heroin Response Strategy

Empower Consumers to Make Safe Choices

For more information please contact Centers for Disease Control and Prevention1600 Clifton Road NE, Atlanta, GA 30333Telephone: 1-800-CDC-INFO (232-4636)/TTY: 1-888-232-6348E-mail: [email protected] Web: www.cdc.govThe findings and conclusions in this report are those of the authors and do not necessarily represent the official position of the Centers for Disease Control and Prevention.

ODPHP Office of Disease Prevention and Health Promotion
Fred Wells Brason II President/CEO

Wilkes County, NC
http://www.law.unc.edu/documents/poverty/publications/wilkes_report_web.pdf

Wilkes County, NC
Marvelous 4 M’s
Moonshine
Marijuana
MethMedicine
• 2007 3rd worst USA County for mortality from prescription medication - CDC• Number One in NC for meth lab busts 2012 & 2013 - NC SBI• Wilkes County had the 2nd largest percentage decrease in median income in
all USA counties 2000 to 2014 - U.S. Census data.
https://www.projectlazarus.org

Prevent, Intervention, Treatment…why should I care?

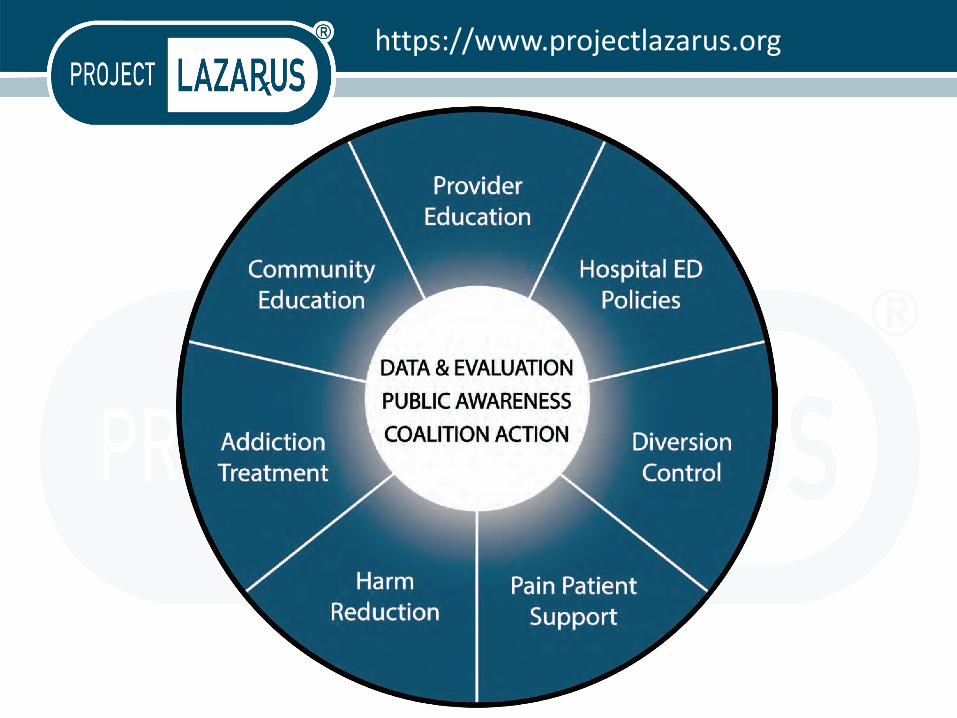
The SPOKES
Community Education
“Got Meds?: take correctly, store securely,
dispose properly and never share.”
A prescriber can write appropriately, a pharmacist can dispense properly…but once in the community?
https://www.samhsa.gov/capt/tools-learning-resources/opioid-overdose-prevention-toolkit

COMMUNITY
• Why am I/We needed
• What do I/We need to know
• What needs to be done

Prescriber Education
Wilkes Chronic Pain Initiative (CPI) PilotNorthwest Community Care Network, Wilkes Health Department and Project Lazarus
• Use of the Prescribers Toolkit• Bio/Psycho/Social Assessment• Overdose/Respiratory Depression Risks• Use of Prescription Drug Monitoring Program (CSRS)• Treatment Agreement• Urine screens/pill counts• Co-Prescribing naloxone• Prescribing Abuse Deterrent Formulations
https://www.communitycarenc.org/population-management/opioid-safety/

THE SPOKES cont. Hospital ED Prescribing
Hospital Emergency Department (ED) Policies –Initiated Wilkes Regional Hospital
1) Embedded ED Case Manager2) “Frequent fliers” for chronic pain,
non-narcotic medication and referral3) No refills of controlled substances4) Utilization of PDMP (CSRS)5) Limited dosing (10 tablets)6) Co-prescribing naloxone7) Peer Support
Adopted by many hospitals and hospital networks in NChttps://www.projectlazarus.org/hospital-ed-policies
NCHA - https://www.ncqualitycenter.org/wp-content/uploads/2013/01/NC-ED-Pain-Mgt-Guidelines_2017-03-15.pdf

DISPOSAL-Diversion Prevention
https://www.projectlazarus.org/ncdi

Overarching Medication Disposal Study ConceptEducation for Prevention

Treating Chronic Pain Appropriately
Appropriate treatment for chronic pain is multimodal including interventions like:
- Psychotherapy/counseling- Chiropractic- Acupuncture- Physical and Occupational
Therapy- Massage Therapy- Relaxation/guided
imagery/meditation- Exercise- Weight loss- Good nutrition- Etc.
“Meeting patients where they are at” means that small changes at home
and daily living can lead to less pain.
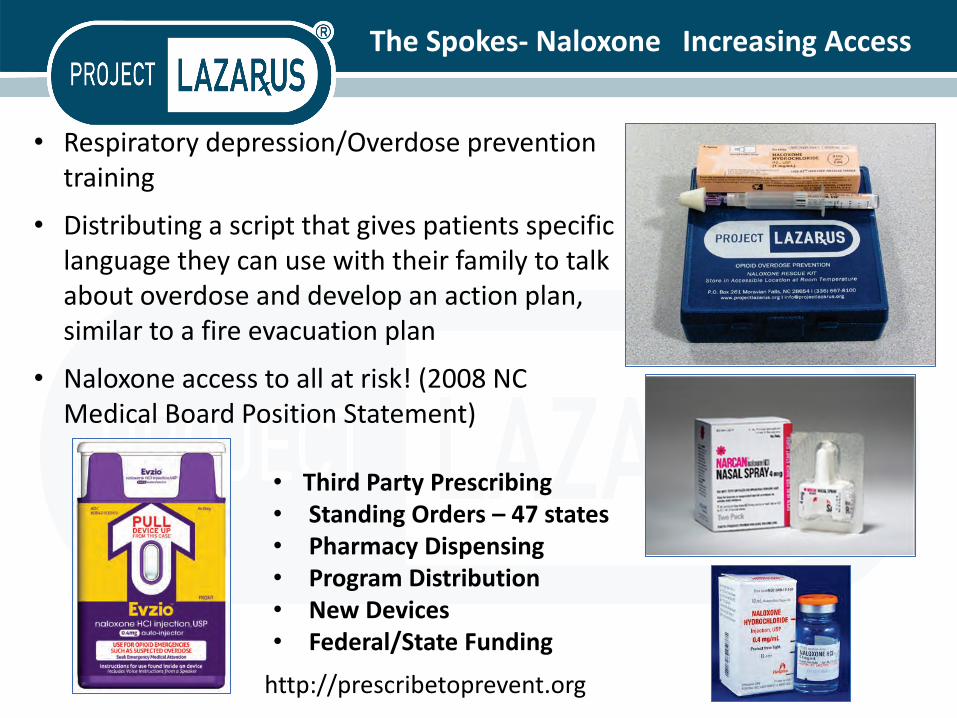
The Spokes- Naloxone Increasing Access
• Respiratory depression/Overdose prevention training
• Distributing a script that gives patients specific language they can use with their family to talk about overdose and develop an action plan, similar to a fire evacuation plan
• Naloxone access to all at risk! (2008 NC Medical Board Position Statement)
• Third Party Prescribing• Standing Orders – 47 states• Pharmacy Dispensing• Program Distribution• New Devices• Federal/State Funding
http://prescribetoprevent.org

Substance Use treatment and Recovery
Substance Use Disorder treatment, Unfortunately, access to treatment is limited by three main factors:
• Acceptance, Availability and Accessibility• stigma associated with addiction and drug treatment.• Integration
Law Enforcement – Behavioral Health –SA Treatment – ED – Health Department –Medical Providers – Labor and Delivery - OB/GYN – Community
buprenorphine, naltrexone, methadone, 12 Step, abstinence programs, residential, Peer and Community Support
Opioid Treatment Program oin Wilkes now over 600 clientshttp://www.journalpatriot.com/news/local-methadone-clinic-helps-reduce-rx-
deaths/article_dbd0f6e8-aa0c-11e3-8435-001a4bcf6878.html

UNC Injury Prevention Research Center
Apostolos Alexandridis, MPHUNC Injury Prevention
Research [email protected]
+1-313-799-2447
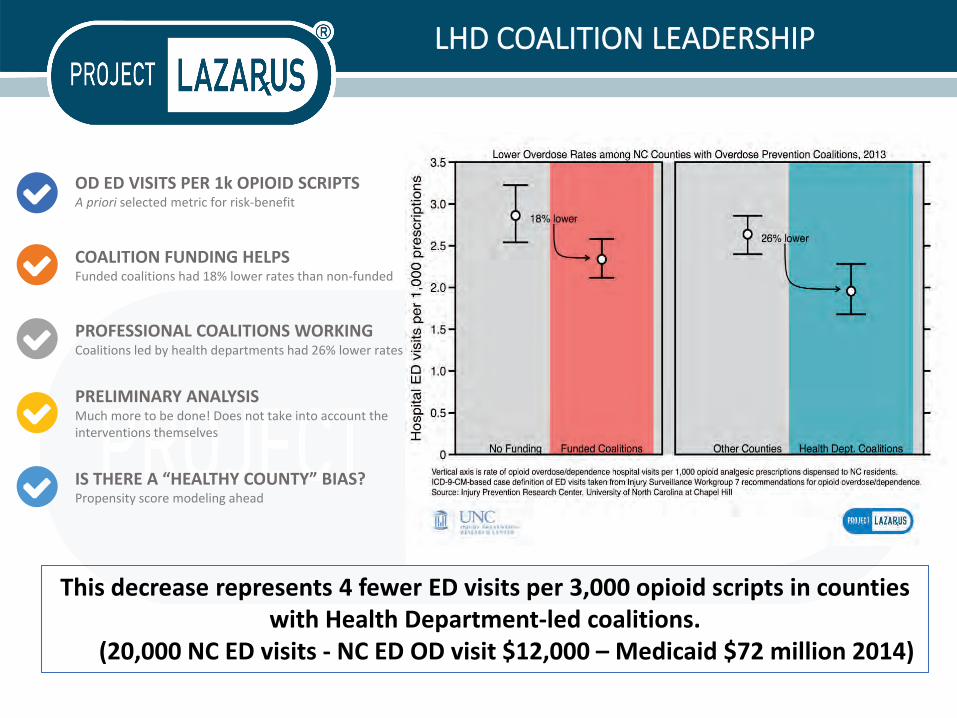
LHD COALITION LEADERSHIP
OD ED VISITS PER 1k OPIOID SCRIPTSA priori selected metric for risk-benefit
COALITION FUNDING HELPSFunded coalitions had 18% lower rates than non-funded
PROFESSIONAL COALITIONS WORKINGCoalitions led by health departments had 26% lower rates
PRELIMINARY ANALYSISMuch more to be done! Does not take into account the interventions themselves
IS THERE A “HEALTHY COUNTY” BIAS?Propensity score modeling ahead
This decrease represents 4 fewer ED visits per 3,000 opioid scripts in counties with Health Department-led coalitions.
(20,000 NC ED visits - NC ED OD visit $12,000 – Medicaid $72 million 2014)
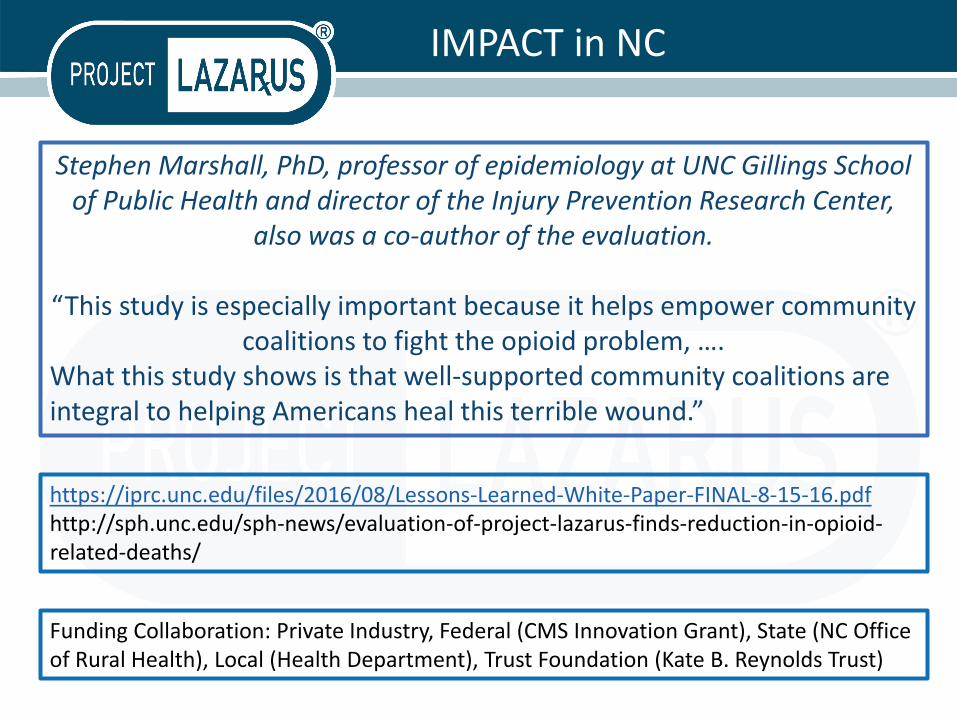
IMPACT in NC
Stephen Marshall, PhD, professor of epidemiology at UNC Gillings School of Public Health and director of the Injury Prevention Research Center,
also was a co-author of the evaluation.
“This study is especially important because it helps empower community coalitions to fight the opioid problem, ….
What this study shows is that well-supported community coalitions are integral to helping Americans heal this terrible wound.”
https://iprc.unc.edu/files/2016/08/Lessons-Learned-White-Paper-FINAL-8-15-16.pdfhttp://sph.unc.edu/sph-news/evaluation-of-project-lazarus-finds-reduction-in-opioid-related-deaths/
Funding Collaboration: Private Industry, Federal (CMS Innovation Grant), State (NC Office of Rural Health), Local (Health Department), Trust Foundation (Kate B. Reynolds Trust)

COMMUNITY GOALS – EVERY SECTOR
Achieve Measurable Reductions in Substance Use and Overdose Using a
Comprehensive Approach
Expand and Strengthen Primary Prevention
Improve Monitoring and Surveillance
Expand and Strengthen Control and Enforcement
Increase Utilization of Treatment and Support of Recovery
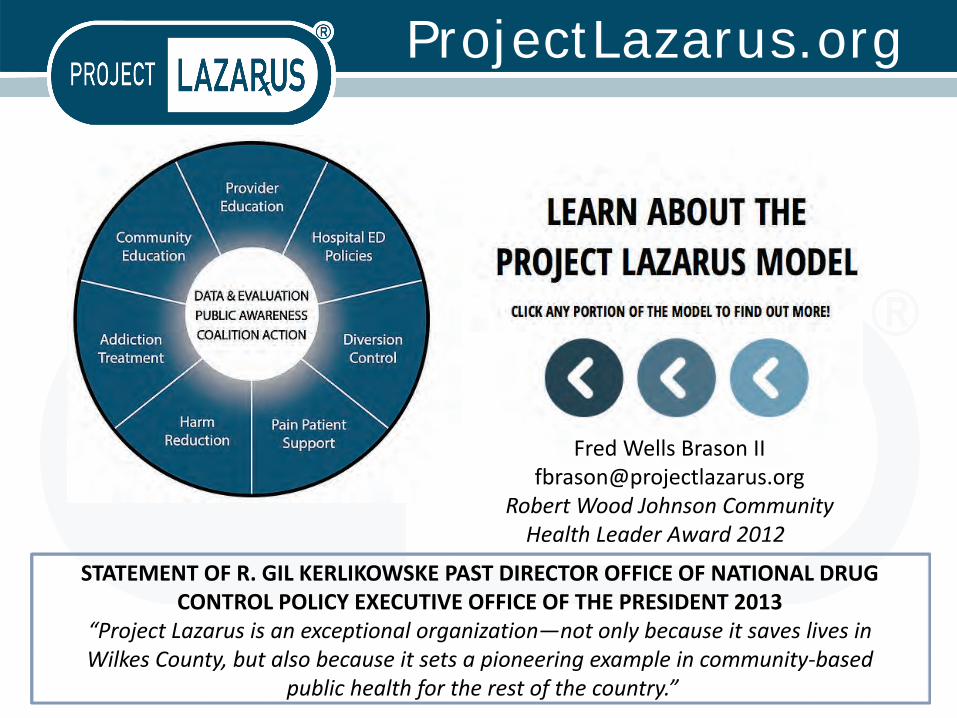
ProjectLazarus.org
Fred Wells Brason [email protected]
Robert Wood Johnson Community Health Leader Award 2012
STATEMENT OF R. GIL KERLIKOWSKE PAST DIRECTOR OFFICE OF NATIONAL DRUG CONTROL POLICY EXECUTIVE OFFICE OF THE PRESIDENT 2013
“Project Lazarus is an exceptional organization—not only because it saves lives in Wilkes County, but also because it sets a pioneering example in community-based
public health for the rest of the country.”
51
Roundtable Discussion

52
Progress Review Webinar
The Diagnosis, Prevention, and Treatment of Sensory Disorders
Thursday, February 22 | 12:30 PM ET
Join us as we review the progress of Healthy People 2020 objectives in the Hearing and Other Sensory or Communication Disorders and Vision topic areas.
To register, visit: healthypeople.gov

Stay Connected
▪ Visit healthypeople.gov to learn more about the Healthy People 2020 Leading Health Indicators
▪ To receive the latest information about Healthy People 2020 and related events, visit our website to:▪ Join the Healthy People 2020 Consortium▪ Share how your organization is working to
achieve Healthy People goals
Follow us on Twitter @gohealthypeople

Drug Overdose Death Ratesby Opioid Category
NOTES: Data are for opioid overdose deaths regardless of intent (unintentional, intentional, undetermined). Drug poisoning data are for ICD-10 codes X40-X44, X60-X64, X85, Y10-Y14 reported as the underlying cause of death. Drug overdose deaths involving selected drug categories are identified by specific multiple-cause-of-death codes: heroin, T40.1; natural and semisynthetic opioids, T40.2; methadone, T40.3; synthetic opioids other than methadone, T40.4. Deaths involving more than one opioid category (e.g., a death involving both methadone and a natural and semisynthetic opioid) are counted in both categories. The percentage of drug overdose deaths that identified the specific drugs involved varied by year ranging from 75-79% from 1999 through 2013 and from 81-85% from 2014 through 2016.SOURCES: National Vital Statistics System-Mortality (NVSS-M), CDC/NCHS; Bridged-race Population Estimates, CDC/NCHS and Census.