healthy mothers and healthy babies
TRANSCRIPT

February 21 - 22, 2014 | Vancouver, BC
Healthy Mothersand Healthy Babies: New Research and Best Practice Conference
S Y L L A B U S

Healthy Mothers and Healthy Babies: New Research and Best Practice Conference 11
P L E N A R Y
Plenary The Intergenerational Cycle of Obesity – Why We Should Be Concerned Kristi Adamo

10/02/2014
1
e H e a l t h S t r a t e g y O f f i c e
eHealth Enabled mother & baby centred care: trends and opportunities
Healthy Mothers & Healthy Babies ConferenceFebruary 21st, 2014
Kendall Ho, MD FRCPCProfessor, Emergency Medicine
Director, eHealth Strategy Office
e H e a l t h S t r a t e g y O f f i c e
•
•
•
•
•
e H e a l t h S t r a t e g y O f f i c e
AliveCor MobisanteUltrasound
Probes
NetraiExaminer
Medtronic CGM
SpiroSmart (FEV1, FVC, PEF)
From telehealth to mHealth
AirStrip Patient Monitoring
From Pt Centred Care to Active Pt Engagement
86 February 21 - 22, 2014 | Vancouver, BC
P L E N A R Y
Plenary eHealth Enabled Mother and Baby Centred Care: Trends and Opportunities Kendall Ho

10/02/2014
2
(Reuters February 3, 2010)
2010 Survey (Oct-Nov 2010, 22,600) •8/10 Canadians (>16) Internet for personal use•1/3 go on line via mobile devices•64/100 for medical information
A set of socio-technical approaches for people to connect, support, and learn from each other
e H e a l t h S t r a t e g y O f f i c e
• Content (documentation)
• Comfort (sharing)
• Communication (network)
• Consideration (reflection)
SMS/Text Messaging in Health• Lifestyle management (exercise, weight, …)• Smoking cessation• Drugs of abuse cessation• Medical results reporting• Medication reminder• Diabetes• Asthma• Sexually transmitted infections• ….
e H e a l t h S t r a t e g y O f f i c e
• Mental wellness
• Diet
• Exercise
• Physiology
• …
Mobile Health Apps: “43,000+”
“Fav Apps” criteria:
• Usefulness
• Ease of use
• Safe
• Cost: “free” preferable
• Privacy
Healthy Mothers and Healthy Babies: New Research and Best Practice Conference 87
P L E N A R Y

10/02/2014
3
Mood Panda
Mindshift
• Test Anxiety• Perfectionism• Social Anxiety• Performance Anxiety
• Worry• Panic• Conflict
e H e a l t h S t r a t e g y O f f i c e
e H e a l t h S t r a t e g y O f f i c e
88 February 21 - 22, 2014 | Vancouver, BC
P L E N A R Y

10/02/2014
4
e H e a l t h S t r a t e g y O f f i c e
e H e a l t h S t r a t e g y O f f i c e
Biosensors Text Messaging
Social Media
Mobile Digital Access to Wireless Network (mDAWN)
Diabetic patients & caregivers
Mobile Platform for Children & Mother
Guangzhou & Vancouver
e H e a l t h S t r a t e g y O f f i c e
•
•
•
•
•
•
•
•
•
•
•
•
e H e a l t h S t r a t e g y O f f i c e
e H e a l t h S t r a t e g y O f f i c e
Web: www.eHealth.ubc.caFacebook: UBC eHealth Strategy OfficeTwitter: @ehealthstrategy
Healthy Mothers and Healthy Babies: New Research and Best Practice Conference 89
P L E N A R Y

14-‐01-‐28
1
D R . D E A N L E D U C M O N T F O R T H O S P I T A L
F E B R U A R Y 2 2 , 2 0 1 4 V A N C O U V E R , B C
Induction of Labor Provocation de travail
I H A V E N O F I N A N C I A L R E L A T I O N S H I P S T O D I S C L O S E
I W I L L D I S C U S S O F F - L A B E L U S E O F M I S O P R O S T O L
I W I L L N O T D I S C U S S I N V E S T I G A T I O N A L P R O D U C T S
Induction of Labor
Induction of Labor
Objectives ¡ Review SOGC IOL guideline
Importance cervical status Selection method to optimize VD Prevention of induction Choices of induction agent
¡ Literature since publication
Induction rates, 1995-2005
Induction rates, 2007-2012
BORN Ontario
Induction rate by region in Ontario
BORN, 2011-12
90 February 21 - 22, 2014 | Vancouver, BC
P L E N A R Y
Plenary Induction of Labour Dean Leduc

14-‐01-‐28
2
Induction of Labor, Workload
Induction of labor represent 25-33% of our intra-partum workload
Indications – High Priority
Pre-eclampsia > 37 weeks* Term PROM / GBS positive Chorioamnionitis Suspected fetal compromise Stable antepartum hemorrhage Significant maternal disease
*change in the 2013 SOGC guidelines
Indications – Other
Post dates (>41 weeks) Post-term (> 42 weeks) Oligohydramnios IUGR Gestational HTN > 38 weeks* Term PROM / GBS negative Twin >= 38 weeks Intrauterine fetal demise (IUFD)/prior IUFD Diabetes (not controlled)* Logistical (precipitous labor, distance)
Indications - unacceptable
Suspected fetal macros0mia in non-diabetic women* Patient / care provider convenience
Complications of IOL
Failure to achieve labor / delivery CS Operative vaginal delivery Tachysystole ± fetal changes Chorioamnionitis Cord prolapse with ARM Uterine rupture
Contra-indications
Contra-indications to vaginal delivery
Healthy Mothers and Healthy Babies: New Research and Best Practice Conference 91
P L E N A R Y

14-‐01-‐28
3
Induction of Labor
HOW DOES CERVICAL STATUS HELP ME?
Cervical factors and successful induction
Bishop > 6 CS rate same as spontaneous labor Resources
Neilsen 2005, Durodola 2005, Osmundson 2010
Cervical factors and prediction of success
Cervical dilation >
Effacement, station, position >
Consistency
Crane, 2006
Failed induction
Xenakis, 1997
Failed induction defined as inability to achieve active phase of labor > 4cm despite adequate exposure to cervical priming and oxytocin stimulation (high dose protocol)
Failed induction / CS rate
Xenakis, 1997
Induction of Labor
WHAT ABOUT OTHER CLINICAL FACTORS FOR SUCCESS?
92 February 21 - 22, 2014 | Vancouver, BC
P L E N A R Y

14-‐01-‐28
4
Risk factors associated with IOL success
Factor
OR
Multiparity 4.63
Bishop score > 4 2.2
BMI > 30 0.6
Age > 35 0.79
Pevnver, 2009
Risk factors associated with IOL failure
Vrounraets, 2005
Ennen, 2005 Erhnedal, 2010
OR OR OR
Nulliparity 3.85
Bishop score 2.3 (BS<5) 2.4 (BS <1)
BMI 2.87 (>30) 1.9 (>40) 4.3 (>30) / 6.3 (>40)
Diabetes 1.9 1.8
Age 1.6 (>30) 2.4 (>35)
2.0 (>25)
Pre-induction factors – Risk for failure
Unfavorable cervix (Bishop ≤6) Obesity (BMI > 40)
¡ Ennen, Pevnver, Ehrendal
Estimated fetal weight > 4000gm ¡ Ennen, Coonrod
Diabetes mellitus, pre-existing ¡ Ennen, Coonrod
Maternal age > 35 ¡ Pevnver, Ehrendal, Coonrod
What about other methods cervical assessment?
Fetal fibronectin + TVUS
Shown to predict successful induction
Neither superior to Bishop score
Crane, 2006
Reasons for Induction
BORN, 2011-12
Induction of Labor
POST- DATES
Healthy Mothers and Healthy Babies: New Research and Best Practice Conference 93
P L E N A R Y

14-‐01-‐28
5
Routine vs Indicated Induction of Labour at 41 or > 41 weeks GA
Gulmezoglu AM et al, Cochrane Library Issue 6, 2012
Perinatal death(>41) 0.31 (0.12,0.88)
MAS (41) 0.27 (0.11,0.68)
C/S (41) 0.74 (0.58,0.96) C/S (>41) 0.91 (0.82,1.00)
Assisted Vag Del (41) 1.09 (0.40,2.98)
Assisted Vag Del (>41) 1.05 (0.65,1.16)
Apgar<7 at 5 min (41) 0.55 (0.12,2.55)
0.1 1 10 Relative Risk (95% Confidence Interval)
Outcome RR
MAS (>41) 0.61 (0.40,0.92)
Apgar<7 at 5 min (>41) 0.75 (0.44,1.26)
NNT=410
Induction of Labor
HOW DID THIS ALL START?
Hannah Trial
IOL vs serial monitoring in post term pregnancy 3407 women > 41 weeks, uncomplicated, singleton, vertex pregnancy,
cx < 3cm RCT at >= 41 weeks
¡ Induction within 2-3 days (study group) vs monitored (control group)
¡ Serial monitoring – Kick count and AFV + NST 2-3 per week Induced if NST abnormal, low AFV (< 3cm), OBS complication, 44
weeks
Outcomes ¡ Rate of CS ¡ Perinatal mortality and neonatal morbidity
NEJM, 1992
Hannah Trial
Induction group
Serial monitor group
P value
Numbers 1701 1706
Method induction
PG x 3, oxytocin/ARM
Oxytocin/ ARM / CS
CS 360 (21.1%) 418 (24.5%) 0.03
CS fetal distress 5.7% 8.3% 0.003
Perinatal deaths 2 0* NS
• 2 infants with lethal congenital abnormalities excluded • 1 death – IUFD, presence of meconium, , HIE • 1 death – labor, acute fetal distress, NRP, meconium aspiration
Hannah Trial (NEJM, 1992)
Conclusion ¡ Lower rate of CS in induction group ¡ Similar perinatal mortality and neonatal morbidity
Resulted in the routine offer of induction > 41 weeks
SOGC Guidelines
Management of Post Term Pregnancy, 1994 ¡ Patient should be offered elective delivery. ¡ Labor should be induced or CS in the case that a VD is
contraindicated
Post-term Pregnancy, 1997 ¡ A policy of induction for women who reach 41 weeks is
preferred due to higher risk of adverse maternal, fetal and neonatal outcomes.
Induction of Labor at Term, 2001 ¡ Indication should be discussed ¡ Ripening of the cervix should be considered before induction
Induction of Labor, 2013
94 February 21 - 22, 2014 | Vancouver, BC
P L E N A R Y

14-‐01-‐28
6
Induction of Labor
PREVENTION OF POST-DATES
Prevention of post dates (>41 weeks)
Accurate dating ¡ LMP ¡ 1st trimester US +/- 5 days ¡ 2nd trimester US +/- 10 days
Sweeping membranes – 3 circumferential rotations within the cervix or massage for 15-30 sec ¡ Weekly after 38 weeks (Yildirm, 2009)
NNT (to prevent one induction) = 8 ¡ Twice weekly after 41 weeks (de Miranda, 2006)
NNT (to prevent one induction) = 6
Intercourse ¡ No difference (Tan, 2007)
Women < 41 weeks induced for post dates
BORN, 2011-12
Prevention of post dates (>41 weeks)
Quality improvement program ¡ Induction committee used to review each request for induction
request and enforce the use of proper indication Fisch, 2009 – reduction elective inductions < 39 weeks Oshiro, 2009 - reduction elective inductions < 39 weeks Reisner, 2008 - reduction elective inductions < 39 weeks and
unfavorable cervix ¡ Decrease CS rate for all institutions
Institutional philosophy ¡ Low induction centers had a lower overall CS rate compered to
higher induction centers
Methods of induction
Mechanical - Foley Prostaglandins
¡ PGE2 – dinoprostone ¡ PGE1 - misoprostol
ARM Oxytocin Breast stimulation
Mechanical
Catheter Contra-indications
¡ Absolute – low lying placenta ¡ Relative – APH, ruptured membranes, infection
Advantages ¡ Less tachysystole ¡ Can be used as an outpatient ¡ VBAC ¡ No increase rates maternal / neonatal infection ¡ No increase risk CS compared to PG
Disadvantages ¡ Increase need for oxytocin
Healthy Mothers and Healthy Babies: New Research and Best Practice Conference 95
P L E N A R Y

14-‐01-‐28
7
PROBAAT studies (Prostaglandin versus balloon for IOL)
Foley (30ml ) vs: ¡ Prostaglandin E2 gel (PROBAAT), 2011 ¡ Prostaglandin 10mcg vaginal insert (PROBAAT-P), 2013 ¡ Misoprostol 25mcg vaginal tablet (PROBAAT-M), 2013
Prospective, RCT, not blinded Single, term, cephalic, intact membranes, unfavorable
cervix (Bishop <6), no prior CS ARM when favorable, oxytocin augmentation prn Outcomes
¡ Primary – CS ¡ Secondary – maternal and neonatal morbidity
Included meta-analyses in their results Eikhelder, 2013
PROBAAT (Foley vs PGE2 gel)
824 women, 412 Foley, 412 vaginal PGE2 gel Results:
¡ Similar rate of CS (23% vs 20%) ¡ Similar rate of fetal distress (7% vs 9%) ¡ More oxytocin augmentation with Foley group (86% vs 59%,
p<0.001) ¡ Similar hyperstimulation rates (2% vs 3%) ¡ All cases of hyperstimulation with Foley had oxytocin ¡ Longer intervention-delivery time similar with Foley (29h vs
17h, p<0.001)
Jozwiak, 2011
PROBAAT-P (Foley vs PGE2 pessary)
226 women, 107 Foley, 119 vaginal inserts Results:
¡ Similar rate of CS (20% vs 22%) ¡ Similar rate of fetal distress ¡ Less hyperstimulation with Foley alone but similar when
oxytocin used ¡ Intervention-delivery time similar (28h vs 27h)
Jozwiak, 2013
PROBAAT-M (Foley vs PGE1)
120 women, 56 Foley, 64 misoprostol Results:
¡ Non-significant difference in rate of CS (25% Foley vs 17% miso, RR 1.46 95% CI 0.72-2.94)
¡ More CS due to dystocia in Foley group (14% vs 3%) ¡ No difference in hyperstimulation ¡ Intervention-delivery time longer in Foley group (36h vs 25h,
p<0.001)
Jozwiak , 2013
Outpatient vs Inpatient Foley
RCT outpatient (61 women) vs inpatient (50 women) Foley for IOL unfavourable cervix
Results: ¡ Similar change in Bishop score ¡ No difference in oxytocin, epidural rate, induction time, Apgar
and cord pH ¡ Less hospitalization time for outpatient group
Sciscione, Obstet Gynecol, 2001
Outpatient Foley vs Inpatient PGE2
RCT outpatient Foley (50 women) vs inpatient vaginal PGE2 (51 women) for IOL unfavourable cervix
Results: ¡ OPC had shorter antenatal hospital stay (21.3h vs 32.4h) ¡ Similar VDs (66% vs 71%), induction-delivery time (33.5h vs
31.3h), total hospital inpatient time (96h vs 105h) ¡ OPC had less pain (26% vs 58%), more sleep (5.8h vs 3.4h) and
more need for oxytocin (88% vs 59%) ¡ IP more likely to deliver within 12h (53% vs 28%)
Henry, BMC Preganancy and Childbirth, 2013
96 February 21 - 22, 2014 | Vancouver, BC
P L E N A R Y

14-‐01-‐28
8
Mechanical – Single vs double lumen
RCT, 330 women, > 36 weeks, nulliparous, BS<5
Single lumen
Double lumen
PGE2 P score
CS 36% 43% 37% NS
Induction to delivery time
25.8h 30.6h 25.8h P=0.043
Tachysystole None None 14% P=0.050
Pain score >3 36% 55% 63% P< 0.001
Foley had lower CS rate, lower induction-delivery time and less pain
Pennell, BJOG 2009
Maternal / neonatal infection – Foley vs PG
Systematic review, 30 RCTs
Outcomes Foley Pharmaco-logical
Pooled OR (95% CI)
Maternal infection
7.6% 5.0% 1.5 (1.07-2.09) é
Chorioamnionitis 7.6% 3.7% 2.05 (1.22-3.44) é
Endometritis 5.1% 3.2% 1.47 (0.74-1.94) è
Neonatal infection
3.2% 2.5% 1.2 (0.48 – 2.97) è
Higher rate for all mechanical but rates similar for studies limited to Foley catheters. Heinemann, AJOG, 2008
Mechanical - summary
Safe Outpatient Unfavourable cervix VBAC More need for oxytocin
Prostaglandins
Prostaglandin E2 – dinoprostone ¡ Intracervical gel - Cervidil® ¡ Intravaginal gel - Prostin® ¡ Intravaginal pessary - Prepidil®
Prostaglandin E1 – misoprostol ¡ Oral ¡ Vaginal
Prostaglandin E2 – Intact Membranes
Kelly, Cochrane, 2009 63 studies, 10 441 women, intact membranes No difference CS
PG placebo
No SVD 24h 18% 99% ê
Oxytocin stimulation
21.6% 40.3% ê
Tachysystole 4.6% 0.51% é
Prostaglandins work with intact membranes
Prostaglandin E2 - PROM
Dare, Cochrane, 2006 12 trials, 6814 women, PROM > 37 weeks
Outcomes Relative risk
CS 0.94 (0.82-1.08) è
Operative VD 0.98 (0.84-1.16) è
Chorioamnionitis 0.74 (0.56-0.97) ê
Endometritis 0.3 (0.12-0.74) ê
Neonatal infection 0.83 (0.61-1.12) è
NICU 0.72 (0.57-0.92) ê
Negative experience 0.45 (0.37-0.54) ê
Prostaglandins work with ruptured membranes
Healthy Mothers and Healthy Babies: New Research and Best Practice Conference 97
P L E N A R Y

14-‐01-‐28
9
Sweeping + PGE2
Foong, 2000, RCT 130 nullip + 118 multip, term ¡ Benefits limited to nullips with unfavourable cervix
Shorter induction labor time (13.6h vs 17.3h) Increase vaginal delivery (83.3% vs 58.2%)
Tan, 2006, RCT, 264 women, term ¡ Benefits to nullip and multips
Higher SVD (69% vs 56%) Shorter induction-labor time (14h vs 19h) Less oxytocin (46% vs 59%) More post-sweeping pain
Prostaglandins work better when sweeping is performed at the time of insertion
Time of day
Dodd, 2006, Obstet Gynecol RCT, 620 women, > 37 weeks, PG induction Time of admission
0800h 2000h RR
Oxytocin infusion
45% (126/280)
54% (184/340)
0.83 (0.7-0.97) ê
Operative vaginal delivery (nullip only)
16.1% (10/62) 34.2% (28/82)
0.47 (0.25-0.90) ê
No difference primary outcomes – vaginal delivery < 24h, CS, tachysystole with FH changes Less intervention when started in morning
Outpatient Induction with vaginal PGE2
Biem, JOGC, 2003 300 women, > 37 weeks, reactive NST, Bishop <7
Outcome Outpatient (n=150)
Inpatient (n=150)
P value
Satisfaction 56% 39% < 0.008 Delivery < 24h 115 107 NS Time to labor 9.8h 11.4h NS
Time to delivery 21.4h 20.7h NS Oxytocin 22 29 NS CS 35 37 NS Epidural 117 115 NS Tachysystole 15 15 NS Non-reassuring FH 4 1 NS
Induction of Labor
How many doses of PGE2 can I give?
Methods for repetitive doses PGE2
Retrospective cohort 3514 nulliparous induced for post-dates Bishop < 6 Compared <2 and > 2 (max 5) doses PGE2 tabs/gel
¡ PGE2 licensed for 2 doses only Maternal and neonatal outcomes
¡ Mode of delivery – CS, SVD, AVD ¡ Indication for CS – failed IOL, dystocia ¡ Oxytocin stimulation ¡ Epidural ¡ PPH ¡ Terbutaline use for “hyperstimulation” ¡ NICU admission ¡ Apgar < 7 at 5 minutes
Ayaz, Eur J Obstet Gynecol, 2013
Results for repetitive doses PGE2
Maternal outcomes
Ayaz, Eur J Obstet Gynecol, 2013
98 February 21 - 22, 2014 | Vancouver, BC
P L E N A R Y

14-‐01-‐28
10
Results for repetitive doses PGE2
Neonatal outcomes
Ayaz, Eur J Obstet Gynecol, 2013
Results for repetitive doses PGE2
Ayaz, Eur J Obstet Gynecol, 2013
Results for repetitive doses PGE2
Conclusion by authors: ¡ No increased maternal or neonatal morbidity
Increased number of doses of PGE2: ¡ Increase CS ¡ Increased failed IOL (cervix not favorable to perform ARM) ¡ Increase dystocia ¡ Decrease SVD
Induction of Labor
Is PGE2 safe in grand-multiparous women?
PGE2 safety in grand-multiparous women
Retrospective study of 1376 women, parity > 5 VD 96.6% of women No difference in:
¡ CS ¡ Operative vaginal delivery ¡ PPH (all received 20U oxytocin im/iv + 0.2mg ergot) ¡ One case of uterine rupture (one day after perforated
appendix)
Haas, Journal Maternal-Fetal and Neonatal Medicine, 2013; 26
PGE2 – Summary
Bishop < 7 (unfavorable cervix) PGE2 are effective agents of cervical ripening Safe with ruptured membranes at term Safe in asthma Outpatient for low risk women Cannot be used in VBAC (contrary to NICE 2008
guidelines) Sweep + insertion Less intervention when applied in the morning
Healthy Mothers and Healthy Babies: New Research and Best Practice Conference 99
P L E N A R Y

14-‐01-‐28
11
Induction of Labor
WHAT ABOUT MISOPROSTOL?
Prostaglandin E1 - misoprostol
Cervical ripening agent + uterotonic Approved for prevention and treatment of gastric
ulcers First study published 1987 to describe successful
induction of labor of stillbirth > 100 RCTs for obstetrical care Inexpensive, stability at room temperature, rapid
onset
Misoprostol vs placebo / PGE2
Hofmeyr, 2010 Cochrane review, 121 trials
¡ Compared to placebo Less failure to achieve vaginal delivery < 24h (RR 0.51) More tachysystole
¡ Compared to PGE2 / oxytocin Less epidural use Less failure to achieve vaginal delivery < 24h Less oxytocin augmentation More meconium stained liquor More tachysystole
Misoprostol vs Dinoprostone
Multiple reviews (Cochrane, 2006; Crane, 2006; Kundodyiwa, 2009; Cochrane 2010) ¡ Lower CS ¡ More tachysystole ¡ Similar or less need for oxytocin ¡ Trend more meconium ¡ Less failure to achieve vaginal delivery < 24 hours ¡ No increase maternal / fetal adverse events
Misoprostol – Oral vs Vaginal
Cochrane review (Alfiveric, 2006) found that oral had: ¡ Less tachysystole without FH changes (RR 0.37) ¡ More need for oxytocin (RR 1.28) ¡ More meconium (RR 1.27)
RCT 204 women (Colon, 2005) – 25mcg PO vs 50mcg PV ¡ Less tachysystole with FH changes (2.2% vs 5.4%) ¡ Lower CS rate (19.4% vs 32.4%) ¡ No difference induction-delivery time or side effects (fever, shivering,
nausea)
RCT 120 women (Cecatti, 2006) – 12.5mcg PO vs 25mcg PV ¡ No difference mode of delivery, induction-delivery time, oxytocin use
Misoprostol – Dosing
Vaginal – 25mcg vs 50 mcg ¡ More need for oxytocin ¡ Less tachysystole ± fetal heart rate changes ¡ Longer induction – delivery time ¡ More use oxytocin ¡ Less vaginal deliveries < 24h
Oral – 25mcg/50mcg vs placebo ¡ Less prolonged labor ¡ Less need oxytocin ¡ Lower CS rate
100 February 21 - 22, 2014 | Vancouver, BC
P L E N A R Y

14-‐01-‐28
12
Misoprostol – Dosing
Vaginal – 25mcg every 4 hours Oral – 50mcg every 4 hours / 25mcg every 2 hours
Oxytocin – can be used 4 hours after the last dose
Misoprostol vs Foley
Adenji (2005) ¡ RCT, 96 women, 50mcg vaginal vs Foley
Reached favorable cervix (Bishop ≥ 6) faster Lower use oxytocin Same induction-delivery time
Afolabi (2005) ¡ RCT, 100 women, 100mcg vaginal vs Foley
Shorter induction-delivery time
Misoprostol / Term PROM
Krupa (2005) – open RCT, 150 women 25mcg vaginal vs expectant ± oxytocin management
¡ Shorter latency period ¡ Shorter recruitment time to delivery ¡ Trends
Lower oxytocin use Lower CS
Study stopped due to lack of funding More studies required
Misoprostol - summary
Safe and effective agent for induction Reduce CS rate in unfavourable cervix Intact membranes only (further studies needed) Not for out-patient use or VBAC Dose
¡ 50mcg oral every 4 hours ¡ 25mcg vaginally every 4 hours
EFM same as PGE2 ¡ 30 minutes after administration ¡ 60 minutes after any tachysystole
Oxytocin 4 hours after the last dose All doses/routes cause more tachysystole Oral route needs more oxytocin but has less tachysystole than
vaginal route
Amniotomy
No studies comparing amniotomy to placebo Used when the cervix is favourable Cochrane 2007 (Howarth)
¡ ARM + oxytocin had more vaginal deliveries < 24h than ARM alone
¡ ARM + oxytocin had less operative vaginal deliveries than placebo
¡ ARM + oxytocin had more PPH and maternal dissatisfaction than vaginal PGs
Oxytocin
Cochrane 2009 (Alfiveric) Oxytocin vs PG for cervical ripening
¡ Increase un-successful vaginal delivery < 24h (70% vs 21%) ¡ Fewer vaginal deliveries (51% vs 35%) ¡ Increase CS (19.1% vs 13.7%), regardless of membrane status
Healthy Mothers and Healthy Babies: New Research and Best Practice Conference 101
P L E N A R Y

14-‐01-‐28
13
Oxytocin
Low dose vs high dose? How high? How fast?
Oxytocin – High vs Low
Studies showing benefit of oxytocin have used one or the other No studies of comparing one dosing regimens Regional variation / local expertise
How much can the fetus tolerate?
Induction of Labor – other agents
Other agents without proven benefit: Castor oil (Kelly, Cochrane 2009– nausea, no benefit Breast stimulation (Kavanagh, Cochrane 2009 –
more women in labor at 72 hours compared to no treatment
Acupuncture (Smith, Cochrane 2009)– no data Homeopathic medications (Cochrane 2010)– not
enough evidence
WHAT ABOUT TERM PROM?
TERM PROM Study
Oxytocin PG
Induction 1258
Expectant 1263
P value Induction 1259
Expectant 1261
P value
Nothing they disliked
74 (5.9%)
17 (13.7%)
<0.001
64 (5.1%)
124 (11.7%)
<0.001
Would repeat in the study
847 (67.3%)
756 (59.9%)
<0.001
837 (66.5%)
746 (59.2%)
<0.001
Women preference – induction vs expectant/ oxytocin and PG
Conclusion – women preferred induction with oxytocin or PG vs expectant Hannah, NEJM, 1996
WHAT ABOUT TERM PROM +GBS?
102 February 21 - 22, 2014 | Vancouver, BC
P L E N A R Y
14-‐01-‐28
14
TERM PROM Study
5041 women GBS culture at time of PROM (no universal
screening) IV oxytocin vs PGE2 gel q 6h Less GBS disease in oxytocin induction group than
PGE2 induction + either expectant group Inadequate prophylaxis for both groups
¡ 23% induction group and 28% in expectant (4 days later) group
Hannah, AJOG, 1997
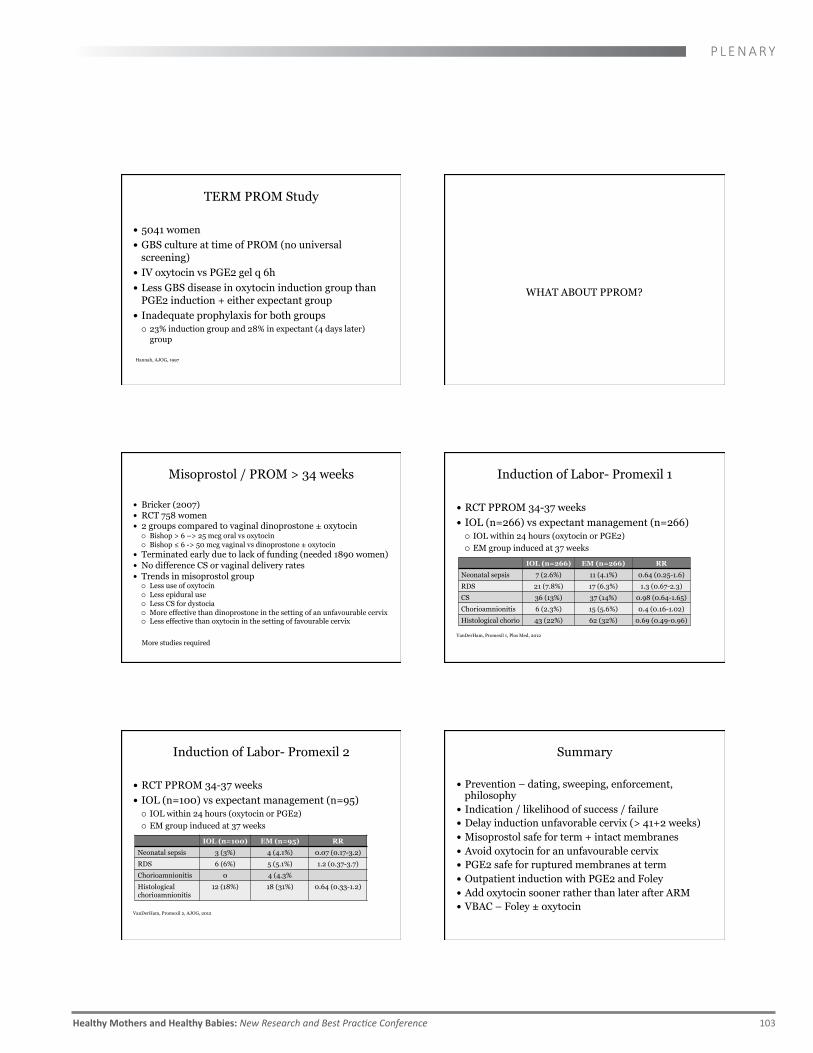
WHAT ABOUT PPROM?
Misoprostol / PROM > 34 weeks
Bricker (2007) RCT 758 women 2 groups compared to vaginal dinoprostone ± oxytocin
¡ Bishop > 6 –> 25 mcg oral vs oxytocin ¡ Bishop ≤ 6 -> 50 mcg vaginal vs dinoprostone ± oxytocin
Terminated early due to lack of funding (needed 1890 women) No difference CS or vaginal delivery rates Trends in misoprostol group
¡ Less use of oxytocin ¡ Less epidural use ¡ Less CS for dystocia ¡ More effective than dinoprostone in the setting of an unfavourable cervix ¡ Less effective than oxytocin in the setting of favourable cervix
More studies required
Induction of Labor- Promexil 1
RCT PPROM 34-37 weeks IOL (n=266) vs expectant management (n=266)
¡ IOL within 24 hours (oxytocin or PGE2) ¡ EM group induced at 37 weeks IOL (n=266) EM (n=266) RR
Neonatal sepsis 7 (2.6%) 11 (4.1%) 0.64 (0.25-1.6)
RDS 21 (7.8%) 17 (6.3%) 1.3 (0.67-2.3)
CS 36 (13%) 37 (14%) 0.98 (0.64-1.65)
Chorioamnionitis 6 (2.3%) 15 (5.6%) 0.4 (0.16-1.02)
Histological chorio 43 (22%) 62 (32%) 0.69 (0.49-0.96)
VanDerHam, Promexil 1, Plos Med, 2012
Induction of Labor- Promexil 2
RCT PPROM 34-37 weeks IOL (n=100) vs expectant management (n=95)
¡ IOL within 24 hours (oxytocin or PGE2) ¡ EM group induced at 37 weeks IOL (n=100) EM (n=95) RR
Neonatal sepsis 3 (3%) 4 (4.1%) 0.07 (0.17-3.2)
RDS 6 (6%) 5 (5.1%) 1.2 (0.37-3.7)
Chorioamnionitis 0 4 (4.3%
Histological chorioamnionitis
12 (18%) 18 (31%) 0.64 (0.33-1.2)
VanDerHam, Promexil 2, AJOG, 2012
Summary
Prevention – dating, sweeping, enforcement, philosophy
Indication / likelihood of success / failure Delay induction unfavorable cervix (> 41+2 weeks) Misoprostol safe for term + intact membranes Avoid oxytocin for an unfavourable cervix PGE2 safe for ruptured membranes at term Outpatient induction with PGE2 and Foley Add oxytocin sooner rather than later after ARM VBAC – Foley ± oxytocin
Healthy Mothers and Healthy Babies: New Research and Best Practice Conference 103
P L E N A R Y

14-‐01-‐28
15
Term – unfavourable cervix
Preferred Acceptable Contra-indicated
Mechanical Amniotomy PGE2 and PGE1 VBAC
PGE2
Oxytocin (high presentation with risk of prolapse)
PGE1 (oral=vaginal)
Intact membranes
Preferred Acceptable Contra-indicated
PGE2 (GBS -) Oxytocin PGE1
Oxytocin (GBS+) PGE2 (GBS+) ?
Mechanical
Ruptured membranes
Term – Favourable cervix
Preferred Acceptable Contra-indicated
Amniotomy =/- oxytocin Oxytocin (high presentation with risk of prolapse)
PGE2 and PGE1 VBAC
PGE2
PGE1 (oral=vaginal)
Intact membranes
Preferred Acceptable Contra-indicated
Oxytocin PGE2 (GBS+) ? PGE1
Ruptured membranes
REFERENCES
Leduc, Berringer, Lee, Dy : Induction of Labor, SOGC, Clinical Practice Guidelines, JOGC, September 2013 Health Canada, CIHI BORN (Better Outcomes Registry and Network) Database GülmezogluAM,CrowtherCA,MiddletonP,HeatleyE.Inductionoflabourforimprovingbirthoutcomesforwomenator beyond term. Cochrane Database of Systematic Reviews 2012, Issue 6. Eikelder et al; Induction of Labor with a Foley catheter or oral misoprostol: the PROBAAT-II study, a multicenter randomised controlled trial; BMC Preg and Childbirth, 2013, 13:67 Jozwiak et al; Foley catheter versus vaginal prostaglandin E2 gel for induction of labour at term (PROBAAT trial): an open-label, randomised controlled trial, Lancet2011;378:2095–103 Jozwiak et al, Foley catheter or prostaglandin E2 inserts for induction of labour at term: an open-label randomized controlled trial (PROBAAT-P trial) and systematic review of literature European J Obstet & Gynecol and Reproductive Biology 170 (2013) 137–145 Jozwiak et al, Foley Catheter versus Vaginal Misoprostol: Randomized Controlled Trial (PROBAAT-M Study) and Systematic Review and Meta-Analysis of Literature, AJOG, 2013 Henry et al, Outpatient Foley catheter versus inpatient prostaglandin E2 gel for induction of labour: a randomised trial, BMC Pregnancy and Childbirth 2013, 13:25 Ayaz, Maternal and neonatal outcomes following additional doses of vaginal prostaglandin E2 for induction of labour: a retrospective cohort study, European Journal of Obstetrics & Gynecology and Reproductive Biology 170 (2013) 364–367 Haas, Safety of labor induction with prostaglandin E2 in grandmultiparous women, The Journal of Maternal-Fetal and Neonatal Medicine, 2013; 26(1): 49–51
REFERENCES
VanderHam, Induction of labour versus expectant management in women with preterm prelabour rupture of membranes between 34 and 37 weeks (the PPROMEXIL-trial), BMC Pregnancy and Childbirth 2007, 7:11 Van der Ham DP, Vijgen SMC, Nijhuis JG, van Beek JJ, Opmeer BC, et al. (2012) Induction of Labor versus Expectant Management in Women with Preterm Prelabor Rupture of Membranes between 34 and 37 Weeks: A Randomized Controlled Trial. PLoS Med 9(4) van der Ham DP, van der Heyden JL, Opmeer BC, et al. Management of late-preterm premature rupture of membranes: the PPROMEXIL-2 trial. Am J Obstet Gynecol 2012;207:276.e1-10. All other references can be found in the 2013 SOGC Induction of labor Guidelines
104 February 21 - 22, 2014 | Vancouver, BC
P L E N A R Y

168 February 21 - 22, 2014 | Vancouver, BC
P L E N A R Y
Plenary Classifying Caesarean Section Rates and Perinatal Outcome Michael Robson
Classification systems in medicine Classification systems are needed in medicine to organise crude data and information into useful information so that clinical care can be improved. Each classification system in medicine has its own purpose. They are based on the identification of different concepts that may each have several parameters. Different permutations of these parameters and their systematic arrangement result in specific groups or categories that share some defined property feature or quality. Principles of classification systems The purpose of the classification system determines the structure of the classification. The main groups of the classification need to be robust enough to be unlikely to need changes over time and universal in nature so it can be used anywhere in the world with minimal resource . The groups or categories of the classification need to be prospectively identifiable so that outcome can be improved in those same patients in the future. The groups or categories must be mutually exclusive, totally inclusive and clinically relevant. The classification system must be simple to understand and easy to implement. Ideally the classification should be self validating as well so that potential discrepancies can be spotted by merely looking at the table. Classification systems can only be useful if the data or information being collected and analysed by the classification system fulfils the principles of information collection. The information needs to be useful, it needs to be carefully defined, it needs to be accurately collected, and it needs to be timely and available1. The last requirement will be the discipline of the users, who only by sticking to a standard system will ensure the system’s success. Current classification systems used for caesarean sections and perinatal outcome There is no accepted classification system2,3. There have been many descriptive studies but no classification system, which fit the principles, described above and has been used to make changes in specific prospective groups of women. Caesarean section rates have been analysed by comparing overall rates, by indication for caesarean section, by sub-‐groups of women and by primary and repeat caesarean section rates. They all have their disadvantages4. The ten group classification of caesarean sections The purpose of this classification5 was by using the principles described above to make possible comparisons of all maternal and fetal outcomes and variables of which caesarean section rate is but one, over time in one unit and between different units6,7,8,9,10,11,12. This would then allow the possibility of reducing the caesarean section rate13,14,15. The obstetric concepts, with their parameters, used to group and categorise the women were the category of the pregnancy, the previous obstetric record of the woman, the course of labour and delivery and the gestational age of the pregnancy. From these concepts and their parameters 10 groups were formed. The indications for Caesarean section should be specifically defined within each group of women because the definition and the management may vary in each group. The classification in Table 1 is a recommended method for classifying Caesarean sections, which fit the above requirements. It is being successfully used. Each of the 10 groups can be further subdivided when indicated. There are four suggested ways of analysing the initial data. In the first column the number of caesarean sections in each group is shown over the total number of women in that group. In the second group the relative sizes of the groups are shown. In the third column the caesarean section rate in each group is shown. Lastly in the fourth column the relative contribution of each group to the total caesarean section rate is shown.
Healthy Mothers and Healthy Babies: New Research and Best Practice Conference 169
P L E N A R Y
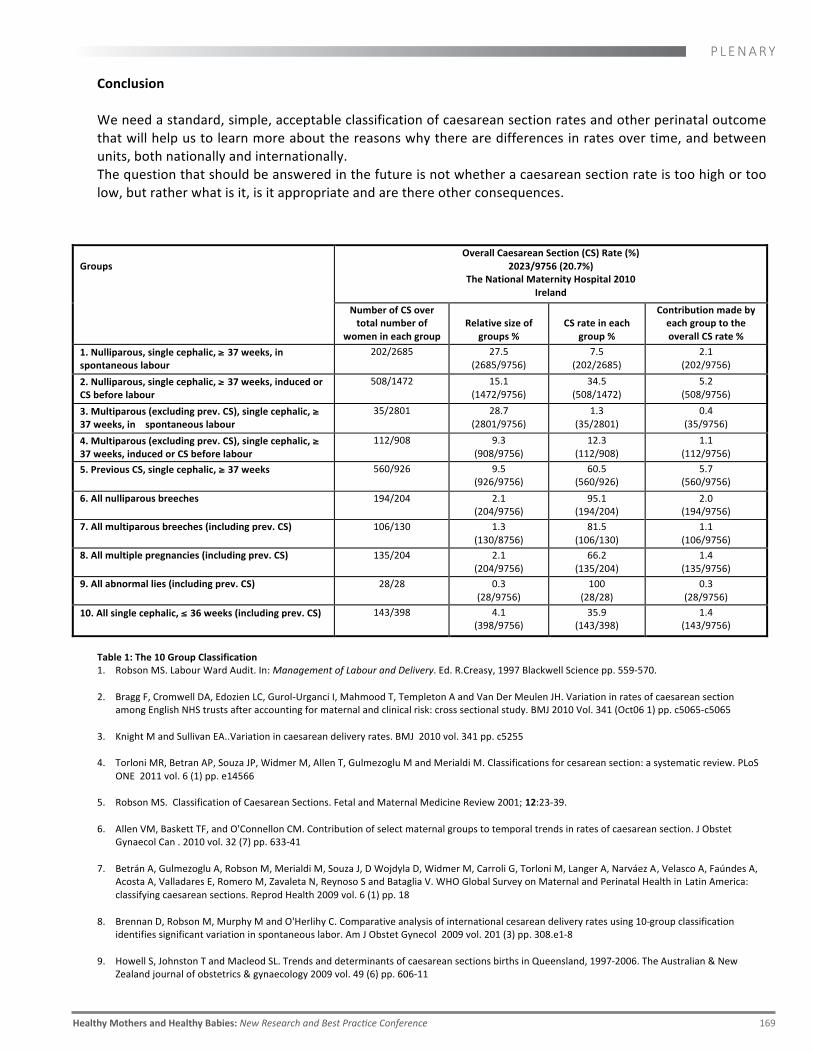
Conclusion We need a standard, simple, acceptable classification of caesarean section rates and other perinatal outcome that will help us to learn more about the reasons why there are differences in rates over time, and between units, both nationally and internationally. The question that should be answered in the future is not whether a caesarean section rate is too high or too low, but rather what is it, is it appropriate and are there other consequences.
Groups
Overall Caesarean Section (CS) Rate (%) 2023/9756 (20.7%)
The National Maternity Hospital 2010 Ireland
Number of CS over total number of
women in each group
Relative size of
groups %
CS rate in each
group %
Contribution made by each group to the overall CS rate %
1. Nulliparous, single cephalic, ≥ 37 weeks, in spontaneous labour
202/2685 27.5 (2685/9756)
7.5 (202/2685)
2.1 (202/9756)
2. Nulliparous, single cephalic, ≥ 37 weeks, induced or CS before labour
508/1472 15.1 (1472/9756)
34.5 (508/1472)
5.2 (508/9756)
3. Multiparous (excluding prev. CS), single cephalic, ≥ 37 weeks, in spontaneous labour
35/2801 28.7 (2801/9756)
1.3 (35/2801)
0.4 (35/9756)
4. Multiparous (excluding prev. CS), single cephalic, ≥ 37 weeks, induced or CS before labour
112/908 9.3 (908/9756)
12.3 (112/908)
1.1 (112/9756)
5. Previous CS, single cephalic, ≥ 37 weeks 560/926 9.5 (926/9756)
60.5 (560/926)
5.7 (560/9756)
6. All nulliparous breeches 194/204 2.1 (204/9756)
95.1 (194/204)
2.0 (194/9756)
7. All multiparous breeches (including prev. CS) 106/130 1.3 (130/8756)
81.5 (106/130)
1.1 (106/9756)
8. All multiple pregnancies (including prev. CS) 135/204 2.1 (204/9756)
66.2 (135/204)
1.4 (135/9756)
9. All abnormal lies (including prev. CS) 28/28 0.3 (28/9756)
100 (28/28)
0.3 (28/9756)
10. All single cephalic, ≤ 36 weeks (including prev. CS) 143/398 4.1 (398/9756)
35.9 (143/398)
1.4 (143/9756)
Table 1: The 10 Group Classification 1. Robson MS. Labour Ward Audit. In: Management of Labour and Delivery. Ed. R.Creasy, 1997 Blackwell Science pp. 559-‐570. 2. Bragg F, Cromwell DA, Edozien LC, Gurol-‐Urganci I, Mahmood T, Templeton A and Van Der Meulen JH. Variation in rates of caesarean section
among English NHS trusts after accounting for maternal and clinical risk: cross sectional study. BMJ 2010 Vol. 341 (Oct06 1) pp. c5065-‐c5065 3. Knight M and Sullivan EA..Variation in caesarean delivery rates. BMJ 2010 vol. 341 pp. c5255 4. Torloni MR, Betran AP, Souza JP, Widmer M, Allen T, Gulmezoglu M and Merialdi M. Classifications for cesarean section: a systematic review. PLoS
ONE 2011 vol. 6 (1) pp. e14566 5. Robson MS. Classification of Caesarean Sections. Fetal and Maternal Medicine Review 2001; 12:23-‐39. 6. Allen VM, Baskett TF, and O'Connellon CM. Contribution of select maternal groups to temporal trends in rates of caesarean section. J Obstet
Gynaecol Can . 2010 vol. 32 (7) pp. 633-‐41 7. Betrán A, Gulmezoglu A, Robson M, Merialdi M, Souza J, D Wojdyla D, Widmer M, Carroli G, Torloni M, Langer A, Narváez A, Velasco A, Faúndes A,
Acosta A, Valladares E, Romero M, Zavaleta N, Reynoso S and Bataglia V. WHO Global Survey on Maternal and Perinatal Health in Latin America: classifying caesarean sections. Reprod Health 2009 vol. 6 (1) pp. 18
8. Brennan D, Robson M, Murphy M and O'Herlihy C. Comparative analysis of international cesarean delivery rates using 10-‐group classification
identifies significant variation in spontaneous labor. Am J Obstet Gynecol 2009 vol. 201 (3) pp. 308.e1-‐8 9. Howell S, Johnston T and Macleod SL. Trends and determinants of caesarean sections births in Queensland, 1997-‐2006. The Australian & New
Zealand journal of obstetrics & gynaecology 2009 vol. 49 (6) pp. 606-‐11

170 February 21 - 22, 2014 | Vancouver, BC
P L E N A R Y Classification systems in medicine Classification systems are needed in medicine to organise crude data and information into useful information so that clinical care can be improved. Each classification system in medicine has its own purpose. They are based on the identification of different concepts that may each have several parameters. Different permutations of these parameters and their systematic arrangement result in specific groups or categories that share some defined property feature or quality. Principles of classification systems The purpose of the classification system determines the structure of the classification. The main groups of the classification need to be robust enough to be unlikely to need changes over time and universal in nature so it can be used anywhere in the world with minimal resource . The groups or categories of the classification need to be prospectively identifiable so that outcome can be improved in those same patients in the future. The groups or categories must be mutually exclusive, totally inclusive and clinically relevant. The classification system must be simple to understand and easy to implement. Ideally the classification should be self validating as well so that potential discrepancies can be spotted by merely looking at the table. Classification systems can only be useful if the data or information being collected and analysed by the classification system fulfils the principles of information collection. The information needs to be useful, it needs to be carefully defined, it needs to be accurately collected, and it needs to be timely and available1. The last requirement will be the discipline of the users, who only by sticking to a standard system will ensure the system’s success. Current classification systems used for caesarean sections and perinatal outcome There is no accepted classification system2,3. There have been many descriptive studies but no classification system, which fit the principles, described above and has been used to make changes in specific prospective groups of women. Caesarean section rates have been analysed by comparing overall rates, by indication for caesarean section, by sub-‐groups of women and by primary and repeat caesarean section rates. They all have their disadvantages4. The ten group classification of caesarean sections The purpose of this classification5 was by using the principles described above to make possible comparisons of all maternal and fetal outcomes and variables of which caesarean section rate is but one, over time in one unit and between different units6,7,8,9,10,11,12. This would then allow the possibility of reducing the caesarean section rate13,14,15. The obstetric concepts, with their parameters, used to group and categorise the women were the category of the pregnancy, the previous obstetric record of the woman, the course of labour and delivery and the gestational age of the pregnancy. From these concepts and their parameters 10 groups were formed. The indications for Caesarean section should be specifically defined within each group of women because the definition and the management may vary in each group. The classification in Table 1 is a recommended method for classifying Caesarean sections, which fit the above requirements. It is being successfully used. Each of the 10 groups can be further subdivided when indicated. There are four suggested ways of analysing the initial data. In the first column the number of caesarean sections in each group is shown over the total number of women in that group. In the second group the relative sizes of the groups are shown. In the third column the caesarean section rate in each group is shown. Lastly in the fourth column the relative contribution of each group to the total caesarean section rate is shown.