healthprofile glasgow 25082012 - results.urhis.euresults.urhis.eu/profiles/healthprofile_glasgow...
TRANSCRIPT
Taking cities to a healthier future
Health Profile:
Glasgow, United Kingdom
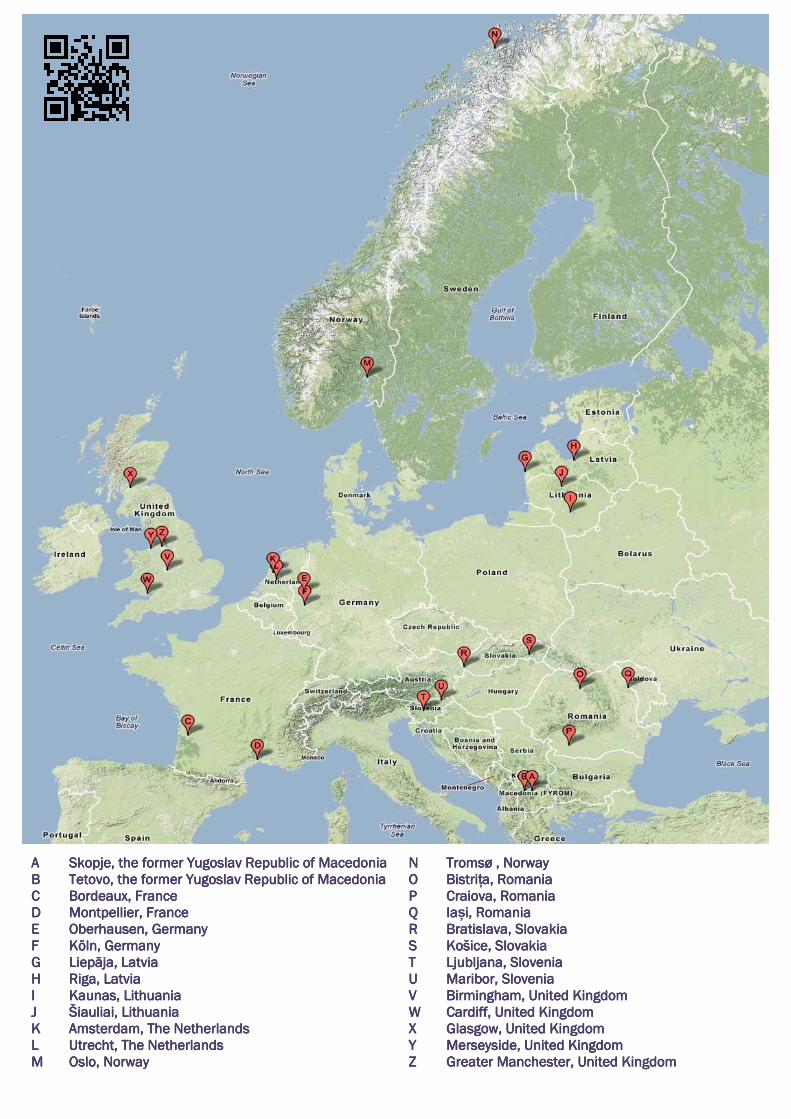
AAAA Skopje, the former Yugoslav Republic of MacedoniaSkopje, the former Yugoslav Republic of MacedoniaSkopje, the former Yugoslav Republic of MacedoniaSkopje, the former Yugoslav Republic of Macedonia BBBB Tetovo, the former Yugoslav Republic of MacedoniaTetovo, the former Yugoslav Republic of MacedoniaTetovo, the former Yugoslav Republic of MacedoniaTetovo, the former Yugoslav Republic of Macedonia CCCC Bordeaux, FranceBordeaux, FranceBordeaux, FranceBordeaux, France DDDD Montpellier, FranceMontpellier, FranceMontpellier, FranceMontpellier, France EEEE Oberhausen, GermanyOberhausen, GermanyOberhausen, GermanyOberhausen, Germany FFFF KölnKölnKölnKöln, , , , GermanyGermanyGermanyGermany GGGG Liepāja, LatviaLiepāja, LatviaLiepāja, LatviaLiepāja, Latvia HHHH Riga, LatviaRiga, LatviaRiga, LatviaRiga, Latvia IIII Kaunas, LithuaniaKaunas, LithuaniaKaunas, LithuaniaKaunas, Lithuania JJJJ Šiauliai, LithuaniaŠiauliai, LithuaniaŠiauliai, LithuaniaŠiauliai, Lithuania KKKK Amsterdam, The NetherlandsAmsterdam, The NetherlandsAmsterdam, The NetherlandsAmsterdam, The Netherlands LLLL Utrecht, The NetherlandsUtrecht, The NetherlandsUtrecht, The NetherlandsUtrecht, The Netherlands MMMM Oslo, NorwayOslo, NorwayOslo, NorwayOslo, Norway
NNNN TromsTromsTromsTromsø ø ø ø , Norway, Norway, Norway, Norway OOOO BistriBistriBistriBistrița, Romaniaa, Romaniaa, Romaniaa, Romania PPPP Craiova, RomaniaCraiova, RomaniaCraiova, RomaniaCraiova, Romania QQQQ IaIaIaIași, Romaniai, Romaniai, Romaniai, Romania RRRR Bratislava, SlovakiaBratislava, SlovakiaBratislava, SlovakiaBratislava, Slovakia SSSS Košice, Košice, Košice, Košice, SlovakiaSlovakiaSlovakiaSlovakia TTTT Ljubljana, SloveniaLjubljana, SloveniaLjubljana, SloveniaLjubljana, Slovenia UUUU Maribor, SloveniaMaribor, SloveniaMaribor, SloveniaMaribor, Slovenia VVVV Birmingham, United KingdomBirmingham, United KingdomBirmingham, United KingdomBirmingham, United Kingdom WWWW Cardiff, United KingdomCardiff, United KingdomCardiff, United KingdomCardiff, United Kingdom XXXX Glasgow, United KingdomGlasgow, United KingdomGlasgow, United KingdomGlasgow, United Kingdom YYYY Merseyside, United KingdomMerseyside, United KingdomMerseyside, United KingdomMerseyside, United Kingdom ZZZZ Greater Manchester, United KingdomGreater Manchester, United KingdomGreater Manchester, United KingdomGreater Manchester, United Kingdom

http://results.urhis.eu 1
Glasgow is one of the urban areas chosen for EURO-URHIS 2 (European Urban Health Indicator System Part 2), a project that aims to identify health problems in urban areas. The EURO-URHIS 2 project describes health and health determinants specific to urban areas in Europe, covering cities in North, East, South, and West Europe. This project may add to information that is already locally available, in that it is the first study to enable reliable comparisons of health status between different cities in Europe. Policy makers can use the information to prioritise topics for urban health policy and for interventions in an evidence-based way. EURO-URHIS 2 gathered information by collecting data from routinely available registration data, and by conducting youth and adult surveys at the end of 2010. In total, data from 26 urban areas in Europe were available for between-city comparisons and benchmarking. The routinely available registration data relate to the most recently available year (2006-2008). The youth survey was a school-based survey of 14-16 year olds. In Glasgow, 296 students completed a valid questionnaire. Because of a very low response rate in the adult survey in Glasgow, these results are not included in the health profile. More detailed information on the justification of methods and instruments that were used, as well as response rates, selection of cities and indicators, and statistical methodology, can be found on our websites: www.urhis.eu and http://results.urhis.eu. The websites also provide data from other participating urban areas and comparisons between specific cities can be made.
This health profile describes the health situation and associated This health profile describes the health situation and associated This health profile describes the health situation and associated This health profile describes the health situation and associated health determinants in Glasgowhealth determinants in Glasgowhealth determinants in Glasgowhealth determinants in Glasgow compared with those observed compared with those observed compared with those observed compared with those observed
in other European urban areas.in other European urban areas.in other European urban areas.in other European urban areas.
Heavy episodic drinking and smoking in Glasgow youth occur Heavy episodic drinking and smoking in Glasgow youth occur Heavy episodic drinking and smoking in Glasgow youth occur Heavy episodic drinking and smoking in Glasgow youth occur as often as in other EUROas often as in other EUROas often as in other EUROas often as in other EURO----URHIS 2 cities.URHIS 2 cities.URHIS 2 cities.URHIS 2 cities.
AllAllAllAll----cause mortality in both males and females is higher in Glasgow compared to cause mortality in both males and females is higher in Glasgow compared to cause mortality in both males and females is higher in Glasgow compared to cause mortality in both males and females is higher in Glasgow compared to other EUROother EUROother EUROother EURO----URHIS 2 cities. Mortality from malignant neoplasms and from diseases URHIS 2 cities. Mortality from malignant neoplasms and from diseases URHIS 2 cities. Mortality from malignant neoplasms and from diseases URHIS 2 cities. Mortality from malignant neoplasms and from diseases
of the respiratory system is substantially higher than the overall EUROof the respiratory system is substantially higher than the overall EUROof the respiratory system is substantially higher than the overall EUROof the respiratory system is substantially higher than the overall EURO----URHIS 2 mean. URHIS 2 mean. URHIS 2 mean. URHIS 2 mean. Mortality from diseases of the circulatory system does not differ.Mortality from diseases of the circulatory system does not differ.Mortality from diseases of the circulatory system does not differ.Mortality from diseases of the circulatory system does not differ.
DISCLAIMERDISCLAIMERDISCLAIMERDISCLAIMER To achieve maximum quality of the data, all instruments used were based on knowledge of earlier studies and expert consultations, and were piloted,
validated, and optimised. The survey questionnaires of EURO-URHIS 2 were based on already existing, validated instruments; selected indicators were as little
culturally sensitive as possible. Questionnaires were translated in the local language(s) and, for validation purposes, back-translated into English. Youth
survey response rates were generally very high. In the adult survey, a minimum response rate of 30% was required to be included for benchmarking. Despite all our efforts, and as in any survey, the point estimates for certain health indicators in your urban area may deviate from other estimates, and may not be
comparable to other local information due to differences in study methodology and indicator definitions. If you would like further information regarding the
methodology, please see our websites: http://www.urhis.eu and http://results.urhis.eu.
The graphs in this health profile show the health status of the urban area compared to other EURO-URHIS 2 urban areas. The whiskers represent the lowest and highest value within the EURO-URHIS 2 project on a scale of 0 to 100%. The grey bar represents the 25th, 50th, and 75th percentile. The urban area value is shown as a diamond, which is blue when the value is not statistically significantly different from the EURO-URHIS 2 mean and red when the difference is statistically significant (at the 5% level).
75th 50th 25th Lowest in EURO-
URHIS 2 Urban area value
Highest in EURO-URHIS
2
not statistically significantly different from EURO-URHIS 2 mean
statistically significantly different from EURO-URHIS 2 mean
0% 20% 40% 60% 80% 100%
Figure 1. Age distributionFigure 1. Age distributionFigure 1. Age distributionFigure 1. Age distribution
Differences in health status may possibly be explained by age. Figure 1 shows the age distribution in Glasgow compared to the other EURO-URHIS 2 urban areas.
8 6 4 2 0 2 4 6 8
0-45-9
10-1415-1920-2425-2930-3435-3940-4445-4950-5455-5960-6465-6970-7475-7980-84>84
Percentage of total population
Age
band
% male % female EURO-URHIS 2 population
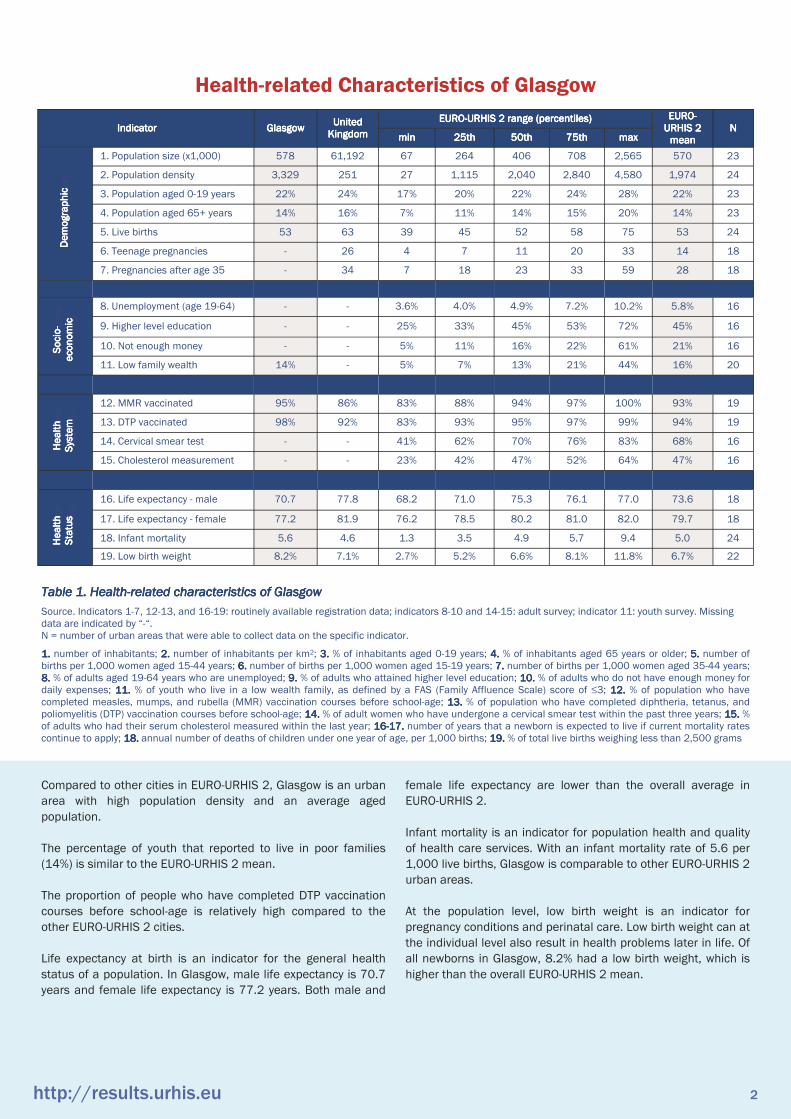
Table 1. HealthTable 1. HealthTable 1. HealthTable 1. Health----related characteristics of Glasgowrelated characteristics of Glasgowrelated characteristics of Glasgowrelated characteristics of Glasgow
Source. Indicators 1-7, 12-13, and 16-19: routinely available registration data; indicators 8-10 and 14-15: adult survey; indicator 11: youth survey. Missing data are indicated by “-“. N = number of urban areas that were able to collect data on the specific indicator.
1.1.1.1. number of inhabitants; 2.2.2.2. number of inhabitants per km2; 3.3.3.3. % of inhabitants aged 0-19 years; 4.4.4.4. % of inhabitants aged 65 years or older; 5.5.5.5. number of births per 1,000 women aged 15-44 years; 6.6.6.6. number of births per 1,000 women aged 15-19 years; 7.7.7.7. number of births per 1,000 women aged 35-44 years; 8.8.8.8. % of adults aged 19-64 years who are unemployed; 9.9.9.9. % of adults who attained higher level education; 10.10.10.10. % of adults who do not have enough money for daily expenses; 11.11.11.11. % of youth who live in a low wealth family, as defined by a FAS (Family Affluence Scale) score of ≤3; 12.12.12.12. % of population who have completed measles, mumps, and rubella (MMR) vaccination courses before school-age; 13.13.13.13. % of population who have completed diphtheria, tetanus, and poliomyelitis (DTP) vaccination courses before school-age; 14.14.14.14. % of adult women who have undergone a cervical smear test within the past three years; 15.15.15.15. % of adults who had their serum cholesterol measured within the last year; 16161616----17.17.17.17. number of years that a newborn is expected to live if current mortality rates continue to apply; 18.18.18.18. annual number of deaths of children under one year of age, per 1,000 births; 19.19.19.19. % of total live births weighing less than 2,500 grams
Health-related Characteristics of Glasgow
IndicatorIndicatorIndicatorIndicator GlasgowGlasgowGlasgowGlasgow United United United United
KingdomKingdomKingdomKingdom
EUROEUROEUROEURO----URHIS 2 range (percentiles)URHIS 2 range (percentiles)URHIS 2 range (percentiles)URHIS 2 range (percentiles) EUROEUROEUROEURO----URHIS 2 URHIS 2 URHIS 2 URHIS 2 meanmeanmeanmean
NNNN minminminmin 25th25th25th25th 50th50th50th50th 75th75th75th75th maxmaxmaxmax
Dem
ographic
1. Population size (x1,000) 578 61,192 67 264 406 708 2,565 570 23
2. Population density 3,329 251 27 1,115 2,040 2,840 4,580 1,974 24
3. Population aged 0-19 years 22% 24% 17% 20% 22% 24% 28% 22% 23
4. Population aged 65+ years 14% 16% 7% 11% 14% 15% 20% 14% 23
5. Live births 53 63 39 45 52 58 75 53 24
6. Teenage pregnancies - 26 4 7 11 20 33 14 18
7. Pregnancies after age 35 - 34 7 18 23 33 59 28 18
Socio-
econom
ic
8. Unemployment (age 19-64) - - 3.6% 4.0% 4.9% 7.2% 10.2% 5.8% 16
9. Higher level education - - 25% 33% 45% 53% 72% 45% 16
10. Not enough money - - 5% 11% 16% 22% 61% 21% 16
11. Low family wealth 14% - 5% 7% 13% 21% 44% 16% 20
Hea
lth
system
12. MMR vaccinated 95% 86% 83% 88% 94% 97% 100% 93% 19
13. DTP vaccinated 98% 92% 83% 93% 95% 97% 99% 94% 19
14. Cervical smear test - - 41% 62% 70% 76% 83% 68% 16
15. Cholesterol measurement - - 23% 42% 47% 52% 64% 47% 16
Hea
lth
statu
s
16. Life expectancy - male 70.7 77.8 68.2 71.0 75.3 76.1 77.0 73.6 18
17. Life expectancy - female 77.2 81.9 76.2 78.5 80.2 81.0 82.0 79.7 18
18. Infant mortality 5.6 4.6 1.3 3.5 4.9 5.7 9.4 5.0 24 19. Low birth weight 8.2% 7.1% 2.7% 5.2% 6.6% 8.1% 11.8% 6.7% 22
Dem
ogra
phic
Dem
ogra
phic
Dem
ogra
phic
Dem
ogra
phic
Soc
ioSoc
ioSoc
ioSoc
io-- --
eco
nom
iceco
nom
iceco
nom
iceco
nom
ic
Health
Health
Health
Health
Sys
tem
Sys
tem
Sys
tem
Sys
tem
Health
Health
Health
Health
Statu
sStatu
sStatu
sStatu
s
Compared to other cities in EURO-URHIS 2, Glasgow is an urban area with high population density and an average aged population. The percentage of youth that reported to live in poor families (14%) is similar to the EURO-URHIS 2 mean. The proportion of people who have completed DTP vaccination courses before school-age is relatively high compared to the other EURO-URHIS 2 cities. Life expectancy at birth is an indicator for the general health status of a population. In Glasgow, male life expectancy is 70.7 years and female life expectancy is 77.2 years. Both male and
female life expectancy are lower than the overall average in EURO-URHIS 2. Infant mortality is an indicator for population health and quality of health care services. With an infant mortality rate of 5.6 per 1,000 live births, Glasgow is comparable to other EURO-URHIS 2 urban areas. At the population level, low birth weight is an indicator for pregnancy conditions and perinatal care. Low birth weight can at the individual level also result in health problems later in life. Of all newborns in Glasgow, 8.2% had a low birth weight, which is higher than the overall EURO-URHIS 2 mean.
http://results.urhis.eu 2

http://results.urhis.eu 5
Table 2 gives an overview of the health status and determinants in Glasgow youth, as reported from the survey. Self-perceived health is a measure of adolescent well-being. 86% of youth in Glasgow perceived their health to be (very) good or excellent, which is significantly lower than the overall EURO-URHIS 2 proportion. In Glasgow, a comparable proportion of youth were identified with an elevated risk of psychological problems (21%), compared to the overall EURO-URHIS 2 proportion. Low back pain was reported less often. Childhood obesity is related to a higher risk of obesity, disability, and premature death later in life. Physical activity can contribute to maintaining a healthy weight and preventing the occurrence
of chronic conditions. Furthermore, physical activity is associated with psychological benefits and with a better school performance in young people. The proportion of youth who reported participation in vigorous physical activity for two or more hours per week is similar in Glasgow (48%), compared to the overall EURO-URHIS 2 proportion. A healthy diet can lower the risk of obesity. Regular consumption of fruit and vegetables occurs less frequently in Glasgow than in other EURO-URHIS 2 urban areas. Initiation of smoking and drinking alcohol at a young age is a strong predictor of smoking during adulthood and of later problems with alcohol.
Health Status and Determinants in Youth
YOUTH HEALTH STATUS
IndicatorIndicatorIndicatorIndicator
EUROEUROEUROEURO----URHIS 2 range (percentiles)URHIS 2 range (percentiles)URHIS 2 range (percentiles)URHIS 2 range (percentiles) EUROEUROEUROEURO----URHIS 2URHIS 2URHIS 2URHIS 2 meanmeanmeanmean
NNNN 0%0%0%0% 50%50%50%50% 100%100%100%100%
Health status
1. Good self-perceived health 86% 92% 20
2. Elevated risk of psychological problems 21% 20% 20
3. Psychosomatic symptoms 9% 10% 20
4. Low back pain 33% 42% 20
Lifestyle
fac-tors
5. Overweight and obesity - 13% 15
6. Physical activity ≥2 hours/week 48% 50% 20
7. Regular fruit consumption 35% 49% 20
8. Regular vegetable/salad consumption 44% 52% 20
9. Regular tooth brushing 74% 72% 20
10. Frequently watching television 64% 60% 20
11. Daily smoking 9% 12% 20
12. First smoking ≤13 years 20% 24% 20
13. Heavy episodic drinking 29% 33% 20
14. First alcohol ≤13 years 44% 53% 19
15. Ever used cannabis 24% 16% 20
16. Unprotected sexual intercourse 6% 4% 20
17. Crime in area 55% 35% 20
18. Involved in traffic accident 5% 7% 18 19. Being bullied 3% 7% 20
Lifestyle Factor
sLifestyle Factor
sLifestyle Factor
sLifestyle Factor
s Health Statu
sHealth Statu
sHealth Statu
sHealth Statu
s
Table 2. Health status and determinants in youth (14Table 2. Health status and determinants in youth (14Table 2. Health status and determinants in youth (14Table 2. Health status and determinants in youth (14----16 years)16 years)16 years)16 years)
Source. Indicators 1-19: youth survey. Missing data are indicated by “-“. N = number of urban areas that were able to collect data on the specific indicator.
1.1.1.1. % of youth who perceive their health as good, very good, or excellent; 2222. % of youth with an overall Strengths and Difficulties Questionnaire (SDQ) score of 20 or higher; 3.3.3.3. % of youth who reported a lot of headaches, stomach aches, or sickness during the past six months; 4.4.4.4. % of youth who experienced low back pain during the past month; 5.5.5.5. % of youth overweight or obese according to the international BMI cut-offs; 6.6.6.6. % of youth who participate in vigorous physical activity for more than two hours per week in their free time; 7.7.7.7. % of youth who eat fruit on most days of the week; 8.8.8.8. % of youth who eat vegetables and/or salads on most days of the week; 9.9.9.9. % of youth who brush their teeth more than once a day; 10.10.10.10. % of youth who watch television for more than two hours on weekdays; 11.11.11.11. % of youth who smoke tobacco every day; 12.12.12.12. % of youth who reported first smoking at ≤13 years; 13.13.13.13. % of youth who drank five or more units of alcohol on one occasion during the past 30 days; 14.14.14.14. % of youth who reported first drinking alcohol at ≤13 years; 15.15.15.15. % of youth who ever used cannabis; 16.16.16.16. % of the total youth population who did not use a condom the last time they had sexual intercourse; 17. 17. 17. 17. % of youth who reported presence of crime, violence, or vandalism in the area where they live; 18.18.18.18. % of youth who had a road traffic accident resulting in injury over the past 12 months; 19.19.19.19. % of youth who have been bullied at least twice in the past couple of months
http://results.urhis.eu 3
Enviro
nEnviro
nEnviro
nEnviro
n-- --
men
tmen
tmen
tmen
t
GlasgowGlasgowGlasgowGlasgow

The health status of a population can be assessed by using a number of parameters, such as those referring to acute and chronic disease, mortality, psychological well-being, and self-perceived health. Table 3 shows the overall health status among adults in Glasgow, compared to other cities in Europe. The results show that in Glasgow the incidence of tuberculosis is
similar to the overall average in all EURO-URHIS 2 urban areas. Both in males and females, all-cause mortality is higher than in other cities. Also mortality from malignant neoplasms and from diseases of the respiratory system are substantially higher.
Table 3. Morbidity and mortalityTable 3. Morbidity and mortalityTable 3. Morbidity and mortalityTable 3. Morbidity and mortality
Source. Indicators 1-14: routinely available registration data. Missing data are indicated by “-“. * Country level data include HIV incidence only. N = number of urban areas that were able to collect data on the specific indicator.
1111----4.4.4.4. Number of newly diagnosed cases with a specific disease per 100,000 persons per year; 5555----6. 6. 6. 6. All-cause mortality rate per 100,000 persons per year (standardised on European population); 7777----14.14.14.14. Mortality rate due to a specific cause per 100,000 persons per year (standardised on European population)
IndicatorIndicatorIndicatorIndicator GlasgowGlasgowGlasgowGlasgow United United United United
KingdomKingdomKingdomKingdom
EUROEUROEUROEURO----URHIS 2 range (percentiles)URHIS 2 range (percentiles)URHIS 2 range (percentiles)URHIS 2 range (percentiles) EUROEUROEUROEURO----URHIS URHIS URHIS URHIS
2 2 2 2 meanmeanmeanmean
NNNN minminminmin 25th25th25th25th 50th50th50th50th 75th75th75th75th
Morbidity
1. HIV/AIDS incidence - male 6 16* 2 6 8 23 71 16 19
2. HIV/AIDS incidence - female 2 9* 0 2 6 12 16 7 19
3. Tuberculosis incidence 16 14 5 11 17 39 153 33 22
4. Lung cancer incidence - 66 29 42 55 62 103 54 13
Mortality
5. All-cause mortality - male 1,199 729 654 752 834 1,014 1,426 919 19
6. All-cause mortality - female 821 510 362 495 542 640 821 560 19
7. Malignant neoplasms - male 336 216 195 230 245 258 336 250 22
8. Malignant neoplasms - female 232 154 114 143 153 162 232 154 22
9. Diseases of the circulatory system - male 365 247 154 227 298 456 676 353 22
10. Diseases of the circulatory system - female 244 156 91 147 199 299 406 220 22
11. Diseases of the respiratory system - male 158 89 32 55 62 80 158 72 22
12. Diseases of the respiratory system - female 120 64 12 21 36 50 120 43 22
13. Transport accidents 4 6 1 3 5 11 16 7 21
14. Suicide and intentional harm 14 7 4 8 11 15 29 12 22
maxmaxmaxmax
Mor
bidity
Mor
bidity
Mor
bidity
Mor
bidity
Mor
tality
Mor
tality
Mor
tality
Mor
tality
http://results.urhis.eu 4
ADULT HEALTH STATUS
The proportion of youth in Glasgow who smoke daily (9%) is similar to the overall EURO-URHIS 2 proportion. Drinking alcohol at the age of 13 or younger occurs significantly less often in Glasgow than in other EURO-URHIS 2 cities. Heavy episodic drinking of five or more units of alcohol on one occasion was reported as often in Glasgow (29%) compared to the total EURO-URHIS 2 population. Regular cannabis use in young people can lead to impaired
cognitive development. 24% of youth in Glasgow have ever used cannabis, which is higher than the overall EURO-URHIS 2 proportion. Neighbourhood crime, violence, or vandalism was significantly more often reported by youth in Glasgow (55%) compared to other cities. The proportion of youth who were victims of bullying in the past couple of months was significantly lower compared to the other urban areas in EURO-URHIS 2.

BeneficiariesBeneficiariesBeneficiariesBeneficiaries The University of Manchester; Municipal Health Service Utrecht; University of Liverpool; The Iuliu Hatieganu University of Medicine & Pharmacy Epidemiology Department; The Norwegian Institute of Public Health; Municipal Health Service Amsterdam; Kaunas University of Medicine; Regional Public Health and Health Promotion Centre (Slovenia); Institute of Health and Work, North Rhine-Westphalia; Slovak Public Health Association; Hacettepe University, Department of Public Health; North West Regional Health Brussels Office; Latvian Public Health Agency; South East European University; National Federation of Regional Health Observatories; Pham Ngoc Thach University of Medicine
Local EUROLocal EUROLocal EUROLocal EURO----URHIS 2 representative in Glasgow: URHIS 2 representative in Glasgow: URHIS 2 representative in Glasgow: URHIS 2 representative in Glasgow:
Dr Arpana Verma Manchester Academic Health Sciences Centre
University of Manchester
[email protected] +44 (0)161 275 5206
The research leading to these results has received funding from the European Union's Seventh Framework Programme (FP7/2007-2013) under grant agreement no 223711
© EURO-URHIS 2, August 2012 Municipal Health Service Utrecht, The Netherlands
Design by Nicola Dale