health workforce policies in oecd countries - right jobs, right skills, right places: chart set
TRANSCRIPT

Health Workforce Policies in OECD Countries
Right Jobs, Right Skills, Right Places
Released on March 15, 2016 http://www.oecd.org/health/health-workforce-policies-in-oecd-countries-9789264239517-en.htm
Note: Chapter 3 and Chapter 6 have benefited from financial support from the
European Commission. The contents of these chapters are the sole responsibility of the
OECD and can in no way be taken to reflect the views of the European Union.
20
19
1616
1514
1413 13 13 13
13 1312
12 1111 11 11
10 10
9 8 8
77
77 6 6
66
5
4
3
0
2
4
6
8
10
12
14
16
18
20
2014 2000%
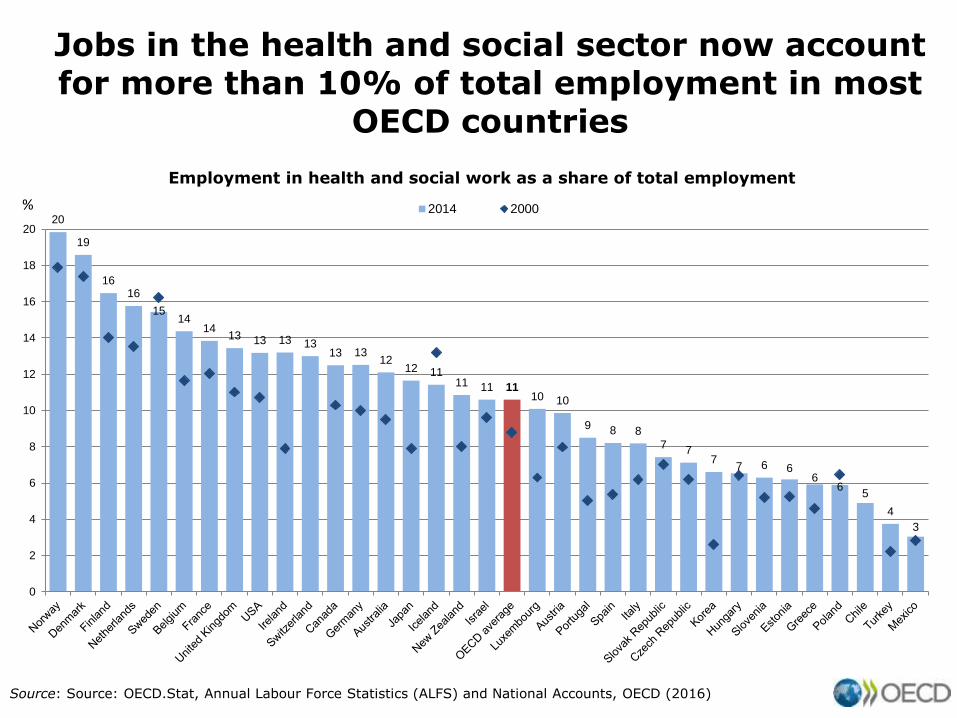
Jobs in the health and social sector now account for more than 10% of total employment in most
OECD countries
Source: Source: OECD.Stat, Annual Labour Force Statistics (ALFS) and National Accounts, OECD (2016)
Employment in health and social work as a share of total employment

Rising numbers of health workers mean that the “inflows” have exceeded the “outflows”

The number of doctors has increased in nearly all OECD countries since 2000
1. Data include not only doctors providing direct care to patients, but also those working in the health sector as managers, educators, researchers, etc. (adding another 5-10% of doctors).
2. Data refer to all doctors licensed to practice (resulting in a large over-estimation of the number of practising doctors in Portugal, of around 30%).
Source: Health Workforce Policies in OECD Countries: Right Jobs, Right Skills, Right Places; OECD (2016)
Strong increase in countries that had low numbers, but also in some that already had high numbers
1.8 1.9 2
.2
2.2 2.2 2.3 2
.6
2.6 2.6 2.7 2.8 2.8
2.8 3.0 3.0 3.2 3.3
3.3 3.3
3.3 3.4
3.4 3.4 3.6
3.6 3.7 3.8 3.9 4.0
4.0
4.1 4.3 4.3
5.0
6.3
0
1
2
3
4
5
6
72013 (or nearest year) 2000
Per 1 000 populationPractising doctors per 1 000 population

25
30
35
40
45
50
55
60
1995 1996 1997 1998 1999 2000 2001 2002 2003 2004 2005 2006 2007 2008 2009 2010 2011 2012 2013 2014
Australia Belgium France Germany Netherlands United Kingdom OECD%
But the share of generalists has come down, limiting access to primary care
Note: Generalists include general practitioners (‘family doctors’) and other generalists (non-specialists). Source: Health Workforce Policies in OECD Countries: Right Jobs, Right Skills, Right Places; OECD (2016)
Only one in three doctors now in OECD countries are generalists

The number of doctors also varies widely across regions in each country
Note: Each observation (point) represents a territorial level 2 region (for example, region in France, Länder in Germany or State in the United States) in each country. The data for Chile relate to 2009 and do not reflect the increase in the number of physicians since then. Source: Health Workforce Policies in OECD Countries: Right Jobs, Right Skills, Right Places; OECD (2016)
Physician density, by Territorial Level 2 regions, 2013
Australia
Austria
Belgium
Canada
Chile
Czech Rep.
Denmark
Estonia
Finland
France
Germany
Greece
Hungary
Israel
Italy
Japan
Korea
Luxembourg
Mexico
Netherlands
New Zealand
Norway
Poland
Portugal
Slovak Rep.
Slovenia
Spain
Sweden
Switzerland
Turkey
United Kingdom
United States
0 1 2 3 4 5 6 7 8 9 10
Density per 1 000 population
Vienna
Brussels
Prague
Athens Region
Lisbon
Bratislava
Washington, D.C.
Helsinki
Copenhagen Region
Mexico city

Key policy priorities relate to achieving better geographic distribution and mix of doctors
* The Netherlands is the only country that did not indicate any particular issue about physician supply. Source: Health Workforce Policies in OECD Countries: Right Jobs, Right Skills, Right Places; OECD (2016)
Issues related to physician supply, based on 31 OECD country responses, 2012
0
5
10
15
20
25
30
No issueidentified*
Maintaining thecurrent level of
physician supply
Meetingincreased
demand forservices
Maintainingshare of GPs
Shortages ofcertain specialty
areas
Mal-distributionof physician
supply
Number of countries

The number of nurses has also increased in nearly all OECD countries since 2000
1. Data include not only nurses providing direct care to patients, but also those working as managers, educators, researchers, etc. 2. Chile reports all nurses who are licensed to practice (less than one-third are professional nurses with a university degree). 3. Austria reports only nurses employed in hospital.
Source: Health Workforce Policies in OECD Countries: Right Jobs, Right Skills, Right Places; OECD (2016)
1.8 2
.6 3.6
4.9 5.1
5.2
5.3 5.6 5.8 6.1
6.1
6.2 6.4
7.9 8.0 8.2
8.3 9
.1 9.4
9.5
9.5 10
.0
10.5
11.1
11
.2
11.5
11.9
12.1
12.4
13.0 14.1 1
5.5 16
.3
16.7
17.4
0
3
6
9
12
15
18
2013 (or nearest year) 2000
Per 1 000 populationPractising nurses per 1 000 population

Changes in domestic education and training capacity
(numerus clausus policies)
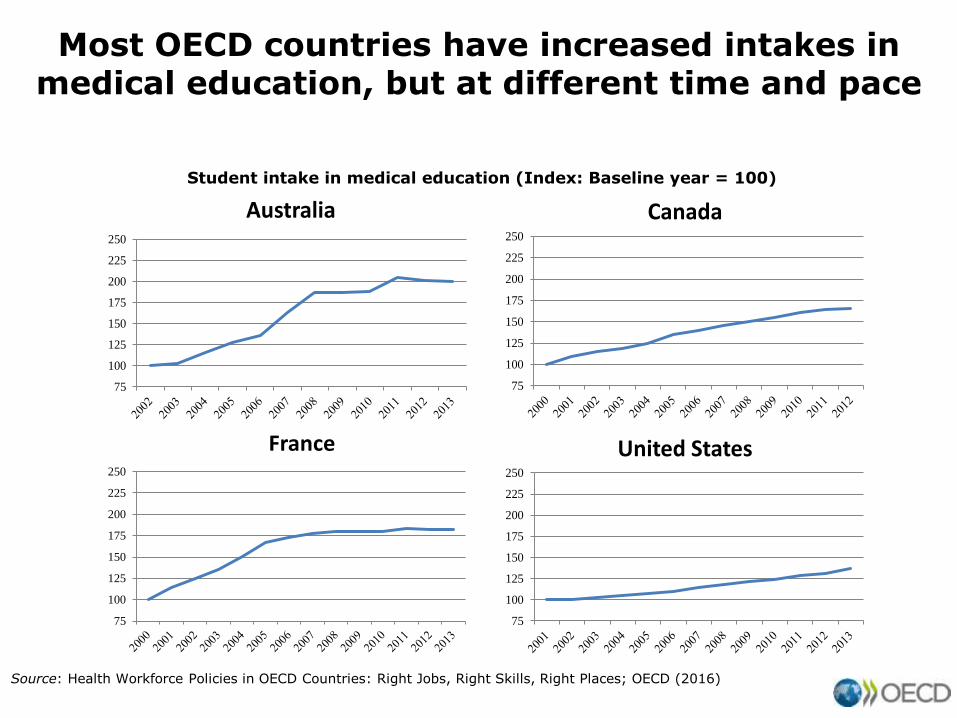
Most OECD countries have increased intakes in medical education, but at different time and pace
Source: Health Workforce Policies in OECD Countries: Right Jobs, Right Skills, Right Places; OECD (2016)
75
100
125
150
175
200
225
250
France
75
100
125
150
175
200
225
250
Australia
75
100
125
150
175
200
225
250
Canada
75
100
125
150
175
200
225
250
United States
Student intake in medical education (Index: Baseline year = 100)

The increase in student intakes has led to growing numbers of new medical graduates
Source: OECD Health at a Glance 2015
Number of medical graduates has more than doubled in Australia and doubled in the UK since 2000
Source: OECD Health Statistics 2015, DOI
Non-European countries European countries
Nordic countries Central and Eastern European Countries
50
100
150
200
250
Australia CanadaJapan United States
Index (2000=100)
50
100
150
200
250
France GermanyNetherlands United Kingdom
Index (2000=100)
50
100
150
200
250
Finland Norway Sweden
Index (2000=100)
50
100
150
200
250
Czech Republic Hungary
Poland Slovak Republic
Index (2000=100)

Some countries are trying to steer medical graduates into general medicine training
Source: Health Workforce Policies in OECD Countries: Right Jobs, Right Skills, Right Places; OECD (2016)
But it has not always been easy to attract a sufficient number of students to fill all training places
Canada France
0
500
1,000
1,500
2,000
2,500
3,000
3,500
4,000
4,500
General Medicine (available) Specialisations (available)
General Medicine (filled) Specialisations (filled)
0
250
500
750
1,000
1,250
1,500
1,750
2,000
Family medicine Other Specialisations

48% 44% 40% 37%27% 27%
52% 56% 60% 63%73% 73%
0%
10%
20%
30%
40%
50%
60%
70%
80%
90%
100%
General medicine Other specialisations
The share of students admitted in general medicine varies across countries between 25% to 50%
Note: In the United States, general medicine includes students admitted to both family medicine and internal medicine. Source: Health Workforce Policies in OECD Countries: Right Jobs, Right Skills, Right Places; OECD (2016)
Share of students admitted in general medicine and other specialisations, 2013 (or nearest year)
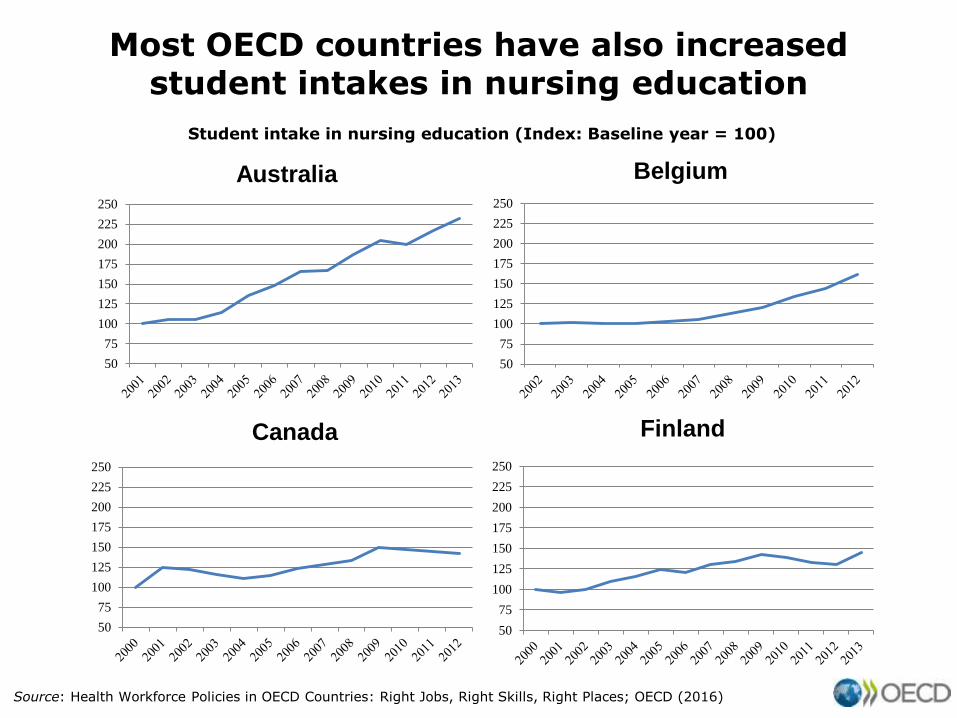
Most OECD countries have also increased student intakes in nursing education
Source: Health Workforce Policies in OECD Countries: Right Jobs, Right Skills, Right Places; OECD (2016)
Student intake in nursing education (Index: Baseline year = 100)
50
75
100
125
150
175
200
225
250
Australia
50
75
100
125
150
175
200
225
250
Canada
50
75
100
125
150
175
200
225
250
Belgium
50
75
100
125
150
175
200
225
250
Finland

The increase in student intakes has led to growing numbers of nursing graduates, particularly in the USA
Source: OECD Health at a Glance 2015
Evolution in the number of nursing graduates
50
100
150
200
Denmark Finland
Norway Switzerland
Index (2003=100)
50
100
150
200
France Germany
Japan United States
Index (2003=100)

The nursing workforce outlook in the USA has changed greatly: From projected shortages to
projected surpluses
In 2004: US Department of Health and Human Services
projected a shortage of almost one million registered nurses
by 2020 (if student admission had remained at their 2001 level)
In 2014: US Department of Health and Human Services
projected a surplus of 340 000 registered nurses by 2025 (if
student admission remains at their 2013 level)
0
50
100
150
200
250
300
350
400Nurse practitioner (admissions)
0
2,000
4,000
6,000
8,000
10,000
12,000
14,000
16,000Nurse practitioner (graduates)
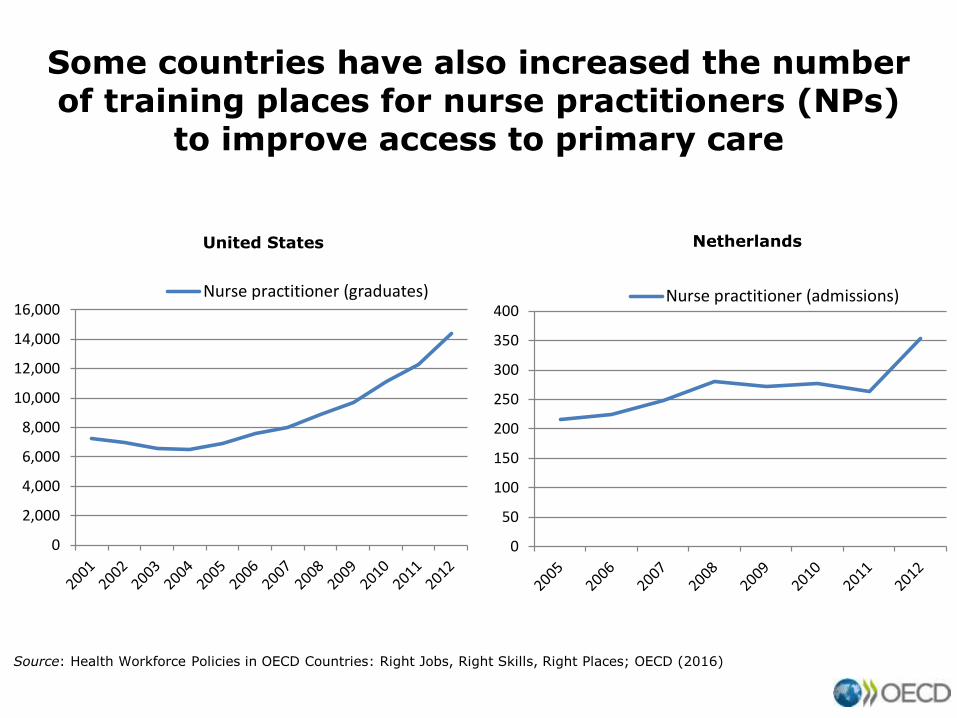
Some countries have also increased the number of training places for nurse practitioners (NPs)
to improve access to primary care
Source: Health Workforce Policies in OECD Countries: Right Jobs, Right Skills, Right Places; OECD (2016)
United States Netherlands

International migration of health workers

19
The share of foreign-trained doctors varies widely across OECD countries
Share of foreign-trained doctors in OECD countries, 2013 (or nearest year)
1. In Germany and Spain, the data is based on nationality (or place of birth in Spain), not on the place of training. Source: OECD Health at a Glance 2015

20
The share of foreign-trained nurses is lower than foreign-trained doctors (but the absolute number
is higher)
Share of foreign-trained nurses in OECD countries, 2013 (or nearest year)
1. Data for some regions in Spain relate to foreign nationality or place of birth, not the place of training. Source: OECD Health at a Glance 2015

The main origin country of foreign-trained doctors in the two main destination countries is India
Source: OECD Health at a Glance 2015
United States, 2013 United Kingdom, 2014

Doctors
0
4 000
8 000
12 000
16 000
20 000
24 000
2001 2002 2003 2004 2005 2006 2007 2008 2009 2010 2011 2012 2013 2014
Number Domestic graduates Foreign-trained
Nurses
0
20 000
40 000
60 000
80 000
100 000
120 000
140 000
160 000
2001 2002 2003 2004 2005 2006 2007 2008 2009 2010 2011 2012 2013 2014
Number Domestic graduates Foreign-trained
The number of domestic graduates exceeds the inflows of foreign-trained doctors and nurses in
the US and the UK
Source: Health Workforce Policies in OECD Countries: Right Jobs, Right Skills, Right Places; OECD (2016)
United States
Sources: UK Graduate Output 1991/92 to 2012/13, Health and
Doctors
0
2 000
4 000
6 000
8 000
10 000
12 000
14 000
16 000
2000 2001 2002 2003 2004 2005 2006 2007 2008 2009 2010 2011 2012 2013 2014
Number Domestic graduates Foreign-trained
Nurses
0
5 000
10 000
15 000
20 000
25 000
30 000
2002 2003 2004 2005 2006 2007 2008 2009 2010 2011 2012 2013 2014
Number Domestic graduates Foreign-trained
United Kingdom

Skills use and skills mismatch in the
health sector

Two types of skills mismatch in health sector: under-skilling and over-skilling
Source: Health Workforce Policies in OECD Countries: Right Jobs, Right Skills, Right Places; OECD (2016)

More than 75% of doctors and nurses report being over-skilled for some of the tasks they do
Note: Others = workers in other technical and professional occupations (ISCO 2 and 3). The figure depicts percentage responses with the associated 95% confidence interval. Source: Health Workforce Policies in OECD Countries: Right Jobs, Right Skills, Right Places; OECD (2016)
0%
10%
20%
30%
40%
50%
60%
70%
80%
90%
100%
Physicians Nurses Others
Reported over-skilling by physicians, nurses and other occupations, PIAAC Survey, 2011-12

At same time, 50% of doctors and 40% of nurses report being under-skilled for some tasks
Note: Others = workers in other technical and professional occupations (ISCO 2 and 3). The figure depicts percentage responses with the associated 95% confidence interval. Source: Health Workforce Policies in OECD Countries: Right Jobs, Right Skills, Right Places; OECD (2016)
0%
10%
20%
30%
40%
50%
60%
Physicians Nurses Others
Reported under-skilling by physicians, nurses and other occupations, PIAAC Survey, 2011-12

1 11.08
0.58
1.98
0.48
0
0.5
1
1.5
2
Overskilled Underskilled
Lower than bachelor's degree
Bachelor or equivalent
Master or equivalent
Highly-qualified nurses are much more likely to report being over-skilled, suggesting a
waste in human capital
Source: Health Workforce Policies in OECD Countries: Right Jobs, Right Skills, Right Places; OECD (2016)
Skills mismatch among nurses by level of education, PIAAC, 2011-12 (Multinomial logistic regression, odds ratios)

The way forward
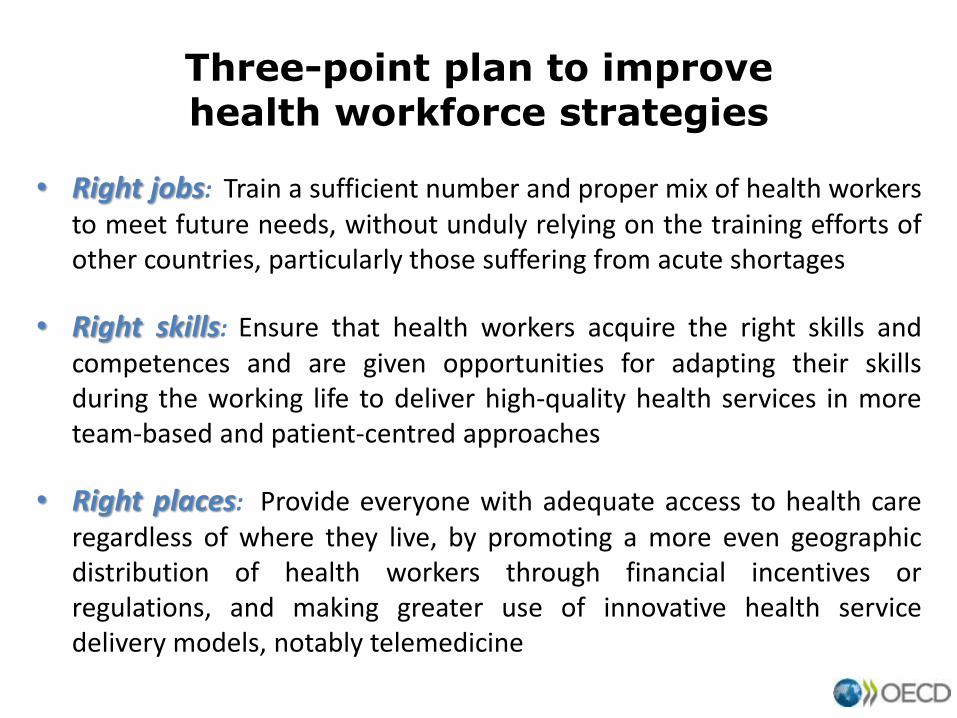
Three-point plan to improve health workforce strategies
• Right jobs: Train a sufficient number and proper mix of health workers to meet future needs, without unduly relying on the training efforts of other countries, particularly those suffering from acute shortages
• Right skills: Ensure that health workers acquire the right skills and competences and are given opportunities for adapting their skills during the working life to deliver high-quality health services in more team-based and patient-centred approaches
• Right places: Provide everyone with adequate access to health care regardless of where they live, by promoting a more even geographic distribution of health workers through financial incentives or regulations, and making greater use of innovative health service delivery models, notably telemedicine
More information
http://www.oecd.org/health/health-workforce-policies-in-oecd-countries-9789264239517-en.htm
@OECD_Social