health & wellness in america - global wellness · pdf filenielsen/nmi health &...
TRANSCRIPT

1 HEALTH & WELLNESS IN AMERICA 2014
+
H E A LT H & W E L L N E S S I N A M E R I C A AUGUST 2014
PART 1: THE CONSUMER PERSPECTIVE
+

2 HEALTH & WELLNESS IN AMERICA 2014
+
READER’S NOTE
Given the ongoing importance of health and wellness as a prevailing consumer force,
Nielsen and Natural Marketing Institute (NMI) are collaborating to uncover the major
food and beverage trends influencing this burgeoning marketplace. The result is the
Nielsen/NMI Health & Wellness in America series, a three-part report covering the ever-
expanding health and wellness sector.
Each white paper in the series addresses a different perspective on health and wellness:
HEALTH & WELLNESS IN AMERICA 2014
PART 1. THE CONSUMER PERSPECTIVE
By Sherry Frey, Vice President, Nielsen Perishables Group
and Steve French, Managing Partner, Natural Marketing Institute (NMI)
PART 1 PART 2 PART 3THE CONSUMER
PERSPECTIVE
THE
MARKETPLACE
TRENDS AND
OPPORTUNITIES
A profile of the health
and wellness consumer
including a detailed
segmentation analysis,
a look at consumer
health aspirations,
purchase behavior and
opportunistic marketing
strategies.
A snapshot of the
growing and dynamic
health and wellness
market including size,
potential, growth rates
and retail trends driving
expansion.
A look at specific trends
for manufacturers and
retailers to capitalize on
and recommendations
for those businesses
that want to engage
consumers to activate
against emerging health
and wellness trends.

3Copyright © 2014 The Nielsen Company I Natural Marketing Institute (NMI), 2014. All rights reserved.
+
ADDRESSING KEY QUESTIONS• What unmet needs do consumers have about health and
wellness and how do they impact their buying habits?
• Consumers say they want to be healthy, but do they follow
through on their knowledge and wellness aspirations?
• Do consumers look at food and beverages based on the
promotion of positives or the absence of negatives to achieve
wellness?
• Are all consumers the same? What health and wellness
marketing strategies and approaches work best for specific
consumer segments?
KEY FINDINGS• Consumers aspire to better health and healthier eating, but half
admit that healthy eating is a challenge, especially in the face of
rising food costs.
• The desire to achieve an improved quality of life drives
consumers to pursue specific health and wellness behaviors,
such as consuming healthy foods or reading package labels.
• Consumer segmentation is vital to understanding the health and
wellness market and developing effective marketing strategies.
• When it comes to unmet consumer nutrient needs, fiber tops
the list, followed by vitamins/minerals (in general), calcium,
antioxidants and Omega-3s.
• The number of consumers who proactively use food as a means
to manage specific health issues is on the rise.
• Opportunities exist to educate consumers on nutrition, with
40 percent expressing confusion over nutritional labeling
on packages; manufacturers and retailers alike need to provide
consumers with easy-to-understand and transparent nutritional
information.

4 HEALTH & WELLNESS IN AMERICA 2014
+
The idea of pursuing health and wellness in a holistic way
has clearly caught the fancy of the American public. What
was once solely the purview of health evangelists has now
become a mainstream topic of conversation. Turn on the
television, log on to the Internet and you’ll hear experts
from Dr. Oz and Dr. Phil to Dr. Weil espousing the benefits
of eating healthy.
Despite the plethora of health and wellness topics in
the media and the popularity of yoga, juice cleanses and
CrossFit training, more than one-third of American adults
are still obese according to the Centers for Disease Control
and Prevention.i This paper investigates how consumers
access and integrate available health and wellness
information and how that translates into lifestyle changes
and purchase behaviors.
WHAT SHOULD
WE KNOW ABOUT
CONSUMERS
KNOWLEDGE IS KING
Consumers’ desire to understand, learn about, and take ownership of health and nutrition
HEALTHY ASPIRATIONS
Interaction between consumer desire for a healthy lifestyle and whether behaviors match attitudes
NOT ONE SIZE FITS ALL
Population diversity and differences in purchase behavior across defined consumer segments
FOOD AS MEDICINE
Usage of fortified foods, functionalfoods and beverages, and understanding benefits
4 KEY THEMES PROVIDE THE
FOUNDATION TO OUR CONSUMER
PERSPECTIVE ON HEALTH AND
WELLNESS
5Copyright © 2014 The Nielsen Company I Natural Marketing Institute (NMI), 2014. All rights reserved.
+
KNOWLEDGE IS KING
Consumers express a high degree of awareness regarding health and
wellness in their daily activities. According to the Harris Poll, three-
quarters of U.S. adults act on that awareness, taking into account the
value of fresh foods (89%), fiber and whole grains (81% each) when
shopping.ii
Americans also demonstrate an understanding of how to manage their
diet for optimal health. More than 70 percent of U.S. adults stress the
importance of protein (83%), healthy fat and whole grains (81% each)
and calories (80%) when contemplating how to manage their diet and
weight.iii
CONSUMERS SEEK OUT INFORMATION ABOUT HEALTH AND
NUTRITION TO QUENCH THEIR THIRST FOR UNDERSTANDING,
TO TAKE CONTROL OF THEIR HEALTH, AND TO ULTIMATELY
IMPROVE THE QUALITY OF THEIR LIVES.
MANUFACTURERS AND RETAILERS CAN PROVIDE MEANINGFUL
SOLUTIONS BY COALESCING AROUND ACCESSIBLE, EASY TO
UNDERSTAND AND TRANSPARENT NUTRITIONAL INFORMATION
THAT ADDRESSES UNMET CONSUMER NEEDS AND DESIRES.
THEME 1

6 HEALTH & WELLNESS IN AMERICA 2014
+
2009 (n=5,607)2013 (n=3,015)
% GENERAL POPULATION INDICATING THEY WANT MORE OF THE FOLLOWING
ORGANIC INGREDIENTS
22%
23%
CAFFEINE
4%
9%
SOY
14%
9%
VITAMIN D
53%
53%
ANTIOXIDANTS
61%
56%
PROTEIN
49%
54%
CALCIUM
58%
57%58%
FIBER
61% 59%
57%
VITAMINS/MINERALS
PROBIOTICS
26%
33%
SUPERFRUITS (E.G.,
POMEGRANATE, ACAI)
38%
30%
56%
50%
OMEGA 3s
Source: Natural Marketing Institute, all rights reserved
7Copyright © 2014 The Nielsen Company I Natural Marketing Institute (NMI), 2014. All rights reserved.
+
More than half of respondents in an NMI study want more fiber,
vitamins/minerals, calcium, antioxidants, protein and Vitamin D in their
diet. While nutrients such as protein, organic ingredients and probiotics
have gained popularity, other elements such as soy and superfruits
declined during the 2009-2013 period, perhaps as a wide array of
foods and beverages now include these nutrients as availability has
skyrocketed.
INGREDIENT PREFERENCE VARIES BY AGE GROUP
Baby Boomers, born in the 1946-1964 period, now control more than 70
percent of U.S. disposable income and drive much of the demand for
healthy productsiv. Fiber, at 62 percent, is the ingredient this age cohort
“wants more of ”, followed by antioxidants, heart-healthy ingredients and
vitamins/minerals at 57 percent each, with Omega-3s and Vitamin D at
56 percent each, calcium at 54 percent and whole grains at 53 percent.v
Millennials, those born between 1977 and 1995, have similar ingredient
preferences compared to their Boomer cohorts, albeit in a different order
and at lower levels. For example, the top three Millennial ingredients
they want more of are calcium, vitamins/minerals and fiber at 38 percent
each. All three nutrients also make an appearance on the Boomer “most
wanted” list, although they are at higher incidence rates.vi There appears to
be a degree of cross-pollination between health-conscious Boomers and
their Millennial children, further enhanced by the increased availability
of foods and beverages containing healthy ingredients.
Meanwhile, some relative newcomers on the ingredient scene are
demonstrating universal interest across all age cohorts: Omega-3 fatty
acids for heart and brain health, superfruits such as pomegranates
(more antioxidant power than green tea)vii and acai berries, and
probiotics for digestive health and allergies.viii
THE IMPORTANCE OF LABELS
Simply put, consumers are often confused. Between the Food and Drug
Administration Nutrition Facts label design, the Grocery Manufacturers
Association Facts Up Front initiative, and the multiple proprietary
nutrition label and shelf tag systems at retail, shoppers are not quite
sure what to use as a reliable guideline.ix
8 HEALTH & WELLNESS IN AMERICA 2014
+
Thanks to a holistic emphasis on wellness, label data often expands
beyond the scope of ingredients to include processing and growing
information, a trend that started with natural and organic foods and now
includes genetically-modified (GMO) foods. Vermont will require GMO
food labeling beginning in 2016, a move that could be replicated in the
29 other states with pending GMO legislation.x
Despite consumers’ labeling confusion, NMI research shows that
more than half of all U.S. consumers select foods based on both the
ingredient list and nutritional facts panel. Shoppers demonstrate
considerable savvy about ingredient efficacy, both good and bad, and
make their selections appropriately.
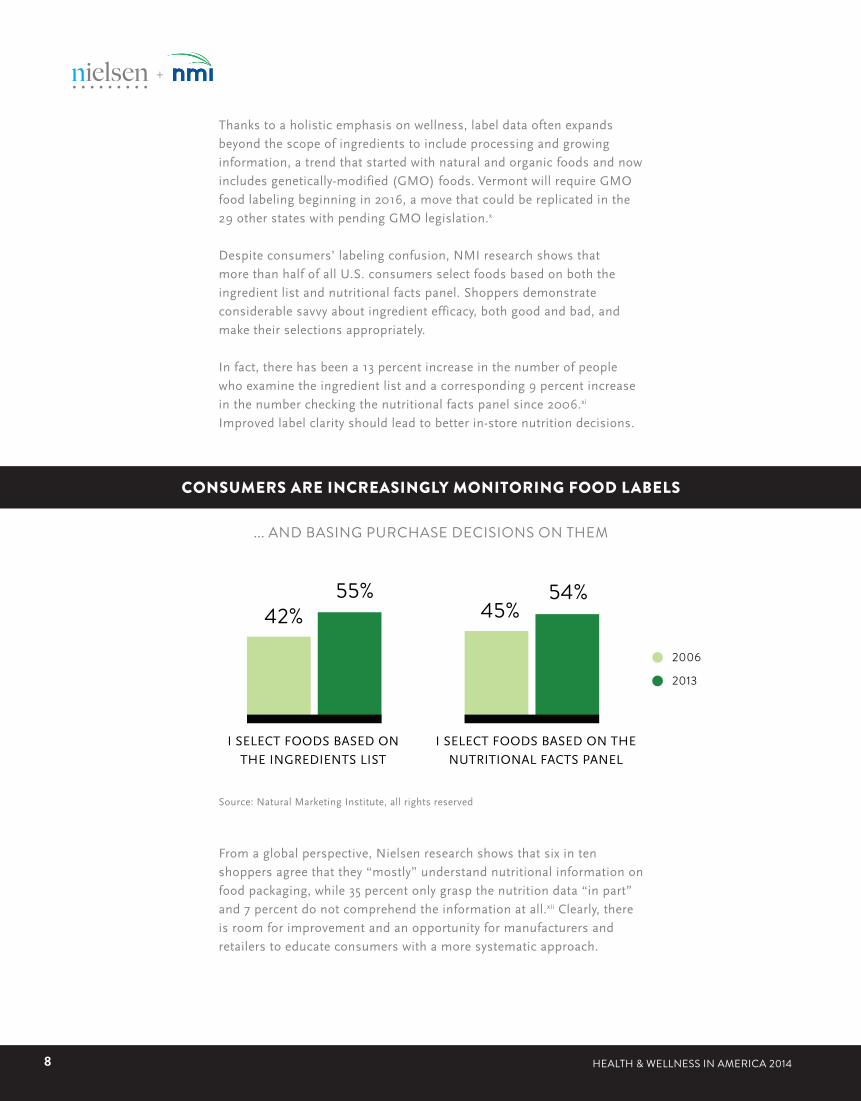
In fact, there has been a 13 percent increase in the number of people
who examine the ingredient list and a corresponding 9 percent increase
in the number checking the nutritional facts panel since 2006.xi
Improved label clarity should lead to better in-store nutrition decisions.
From a global perspective, Nielsen research shows that six in ten
shoppers agree that they “mostly” understand nutritional information on
food packaging, while 35 percent only grasp the nutrition data “in part”
and 7 percent do not comprehend the information at all.xii Clearly, there
is room for improvement and an opportunity for manufacturers and
retailers to educate consumers with a more systematic approach.
... AND BASING PURCHASE DECISIONS ON THEM
I SELECT FOODS BASED ON
THE INGREDIENTS LIST
I SELECT FOODS BASED ON THE
NUTRITIONAL FACTS PANEL
42% 45%55% 54%
2006
2013
Source: Natural Marketing Institute, all rights reserved
CONSUMERS ARE INCREASINGLY MONITORING FOOD LABELS

9Copyright © 2014 The Nielsen Company I Natural Marketing Institute (NMI), 2014. All rights reserved.
+
HEALTHY ASPIRATIONS
A question for the ages: Does knowing convert to doing? It appears
that aspirations are beginning to prompt consumer action on health and
wellness issues. For example, 89 percent of consumers in an online NMI
survey agree that “taking personal responsibility for one’s health is the
best way to stay healthy” (aspiration) while a modest 70 percent say they
are actively “trying to become healthier” (behavior).xiii
Three-quarters of consumers feel they can “manage many health issues
through proper nutrition” (aspiration) while fully half acknowledge “it
can be a challenge to eat healthy” (behavior). These observations are
further validated by ongoing NMI research. Fewer than half of Americans
rating sugar or salt as important to diet and weight management
actually restrict intake of either substance.xiv
CONSUMERS ATTEMPT TO CLOSE THE GAP BETWEEN THEIR
DESIRE TO LIVE A HEALTHY LIFESTYLE AND THE DIFFICULTY OF
ADOPTING WELLNESS PRACTICES, WITH VARYING DEGREES OF
SUCCESS.
MANUFACTURERS AND RETAILERS CAN HELP CLOSE THE
GAP BETWEEN ASPIRATION AND BEHAVIOR BY FOCUSING
ON INTRODUCING EASY AND CONVENIENT SOLUTIONS
AND EXPLORING SPECIFIC HEALTH ISSUES TO AID IN THE
CONSUMER PURCHASE DECISION PROCESS.
THEME 2

10 HEALTH & WELLNESS IN AMERICA 2014
+
ASPIRATIONS BEHAVIORS
Taking personal responsibility for one’s health is the best way to stay healthy
Trying to become healthier*
Feel that I can manage many health issues through proper nutrition
It can be a challenge to eat healthy*
Will take whatever means necessary to control their own health
89%
75%
64%
70%
50%
Agree that they are eating healthier than they used to* 69%
That failure to convert knowledge into action proves true on a global level
as well. In a Nielsen Global Online Survey, fully one-third of shoppers
cognizant of health issues, such as high cholesterol, overweight or heart
concerns, conceded that these health factors had little or no influence on
their grocery selections.xv
CONSUMER DISCONNECT BETWEEN KNOWING AND DOING
The disconnect between the desire to eat right and the practice of sound
nutrition is evident at retail as well. In a Nielsen Global Survey, half of
U.S. consumers said the availability of organic or nutritionally-enhanced
products at grocery had no or next-to-no impact on their
grocery purchases in the last year.
One factor that did have a major impact on food purchase decisions
was inflation. More than half of consumers cited “rising food prices” as
a barrier to healthy eating,xvi and 54 percent of consumers agreed that
“healthy foods are too expensive to eat regularly.”xvii Another consideration
influencing food shopping decisions was taste. Half of consumers agreed
that “…healthy food should taste good, and I am not willing to give up
taste for health.”xviii
All age cohorts, but especially Baby Boomers and Matures, cited weight
maintenance and heart health as the two most important wellness
aspirations. These health-aware population segments also recognized that
achieving those goals requires taking personal responsibility for managing
health through proper nutrition. This finding suggests that advertising and
promotional campaigns emphasizing the personal responsibility angle of
health and wellness could be highly effective with these groups, especially
as satisfaction with America’s healthcare system continues to wane.
Source: Natural Marketing Institute, all rights reserved*Source: Health and Wellness Feb 2014 Survey Results and Insights JR, 471 RESPONDENTS,FEB 2014**Source: HI-Harris-Poll-Eating-Habits-2011-04-27
11Copyright © 2014 The Nielsen Company I Natural Marketing Institute (NMI), 2014. All rights reserved.
+
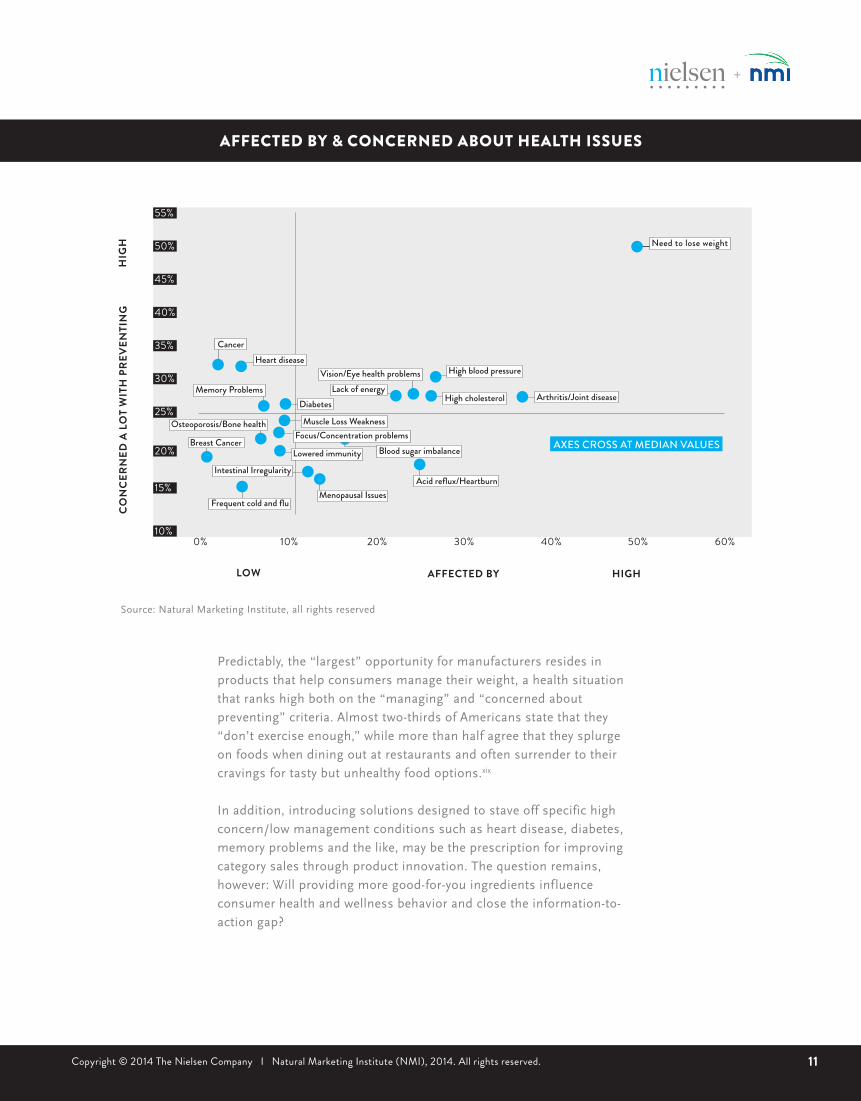
Predictably, the “largest” opportunity for manufacturers resides in
products that help consumers manage their weight, a health situation
that ranks high both on the “managing” and “concerned about
preventing” criteria. Almost two-thirds of Americans state that they
“don’t exercise enough,” while more than half agree that they splurge
on foods when dining out at restaurants and often surrender to their
cravings for tasty but unhealthy food options.xix
In addition, introducing solutions designed to stave off specific high
concern/low management conditions such as heart disease, diabetes,
memory problems and the like, may be the prescription for improving
category sales through product innovation. The question remains,
however: Will providing more good-for-you ingredients influence
consumer health and wellness behavior and close the information-to-
action gap?
AFFECTED BY & CONCERNED ABOUT HEALTH ISSUESC
ON
CE
RN
ED
A L
OT
WIT
H P
RE
VE
NT
ING
HIG
H
LOW AFFECTED BY HIGH
40%
40%
45%
50%
60%50%
35%
30%
30%
25%
20%
20%
15%
10%10%0%
AXES CROSS AT MEDIAN VALUES
Need to lose weight
CancerHeart disease
Memory Problems Lack of energy
Muscle Loss Weakness
Vision/Eye health problems High blood pressure
High cholesterol
Osteoporosis/Bone health
Intestinal Irregularity
Lowered immunity Blood sugar imbalance
Arthritis/Joint disease
Menopausal Issues
Breast Cancer
Frequent cold and fl u
Acid refl ux/Heartburn
55%
Focus/Concentration problems
Diabetes
Source: Natural Marketing Institute, all rights reserved

12 HEALTH & WELLNESS IN AMERICA 2014
+
FOOD AS MEDICINE
When is food more than food? When it is a functional food, it is defined
by the Academy of Nutrition and Dietetics as “a food that provides
additional health benefits that may reduce disease risk and/or promote
good health.”xx
Based on NMI longitudinal consumer data, one-third of American adults
believe that functional foods and beverages can be substituted for
some medicines in their overall health plan.xxi That trend is even more
pronounced among Baby Boomers and Matures.
CONSUMERS ARE GETTING THE MESSAGE THAT “YOU ARE
WHAT YOU EAT” AND ACTIVELY USE FOODS TO ADDRESS OR
FORESTALL HEALTH ISSUES AND MEDICAL CONDITIONS.
MANUFACTURERS AND RETAILERS CAN PROMOTE WELLNESS
BY POSITIONING PRODUCTS THAT INCORPORATE IMPORTANT
HEALTH SOLUTIONS AND EDUCATING THE PUBLIC ABOUT
THEIR ASSOCIATED HEALTH BENEFITS.
THEME 3

13Copyright © 2014 The Nielsen Company I Natural Marketing Institute (NMI), 2014. All rights reserved.
+
2008 2009 2010 2011 2012 2013
% GENERAL POPULATION INDICATING THAT FUNCTIONAL FOODS/BEVERAGES CAN BE USED IN PLACE OF SOME MEDICINES
26% 27% 26% 28% 29% 32%
A PRESCRIPTION FOR HEALTHY EATING
In order to successfully use food as a remedy for what ails them,
consumers first need to understand the benefits derived from specific
nutrients, such as digestive health and probiotics, heart protection and
Omega-3 fatty acids, strong bones and calcium. Protein represents one
example of successful consumer education on the functional food front.
More than half the population now seeks out foods that are high in
protein, with a significantly higher percentage (73 percent) reportedly
consuming high protein food and beverages in the past year.xxii The
accelerant behind protein growth is consumer understanding of the
relationship between protein and its role in weight management, muscle
development, strength and energy.
Source: Natural Marketing Institute, all rights reserved

14 HEALTH & WELLNESS IN AMERICA 2014
+
FORTIFIED FOOD CONSUMPTION REMAINS STRONG
In the years spanning 2005 to 2013, fortified food consumption
remained stable with roughly two-thirds of the general population using
fortified foods or beverages each year. However, consumer willingness to
pay a premium for these fortified products remained virtually constant
over the last six years at only 16 percent.xxiii
Further fueling the fortified food trend is a belief held by 75 percent
of American adults stating, “I can manage many of my health issues
through proper nutrition.” This percentage represents a statistically
significant increase over the last three years.xxiv
While health claims do help sell foods and beverages, only one in five
consumers express a strong preference for them. In fact, health claim
preference is not growing, unlike the preference for other attributes.
However, several population segments remain more responsive than the
average to health claims. These include natural channel shoppers at 29
percent and Millennials at 27 percent.xxv It may well be that consumers
require more specifics supporting health claims, such as benefit details
or scientific proof, to make the claims more attractive.
The fortified and functional food and beverage category has significant
opportunities to expand in two major ways. First, the category can
expand by creating new product formats that incorporate more
traditional but necessary daily nutrients, such as calcium and fiber.
Second, it can expand via fortification opportunities using emerging
nutrients such as phytosterols and probiotics, which are more difficult
to obtain in a typical American diet.

15Copyright © 2014 The Nielsen Company I Natural Marketing Institute (NMI), 2014. All rights reserved.
+
NOT ONE SIZE FITS ALL
The NMI Health and Wellness Segmentation framework identifies five
mutually exclusive consumer segments that are grouped along the lines
of differentiated health attitudes, behavior and psychographics. They
include:
• WELL BEINGS®
• FOOD ACTIVES®
• MAGIC BULLETS®
• FENCE SITTERS®
• EAT, DRINK & BE MERRYS®
ALL CONSUMERS ARE NOT CREATED EQUAL. THEY DIFFER
IN ATTITUDES, PURCHASE BEHAVIOR AND WELLNESS
ORIENTATION, REQUIRING MORE FOCUSED APPROACHES.
MANUFACTURERS AND RETAILERS CAN SELECT HIGH POTENTIAL
SEGMENTS THAT DEMONSTRATE A COMMITMENT OR
WILLINGNESS TO EATING RIGHT AND PROVIDE PRODUCTS AND
MESSAGES THAT ARE TAILORED TO SUCH SEGMENTS.
THEME 4

16 HEALTH & WELLNESS IN AMERICA 2014
+
NMI HEALTH
& WELLNESS
SEGMENTATION
WELL BEINGS®
• Most health pro-active• Leaders & influencers• Most multi-cultural
MAGIC BULLETS®
• No healthy lifestyle commitment
• Managers vs. preventative
EAT, DRINK & BE MERRYS®
• Least health active• Taste over health
FOOD ACTIVES®
• Mainstream healthy• Basics & balance
FENCE SITTERS®
• ‘Wannabe’ healthy• Stressed, want control• Multi-cultural segment
WELL BEINGS comprise 19 percent of the American
population and serve as trend predictors, opinion leaders
and key influencers on health and wellness topics. As
the most health-proactive segment, they record the
highest usage of many healthy foods and beverages. They
demonstrate a concern for the environment and integrate
many health modalities into their lifestyles.
WELL BEINGS, the highest value segment, make the
most shopping trips per household (157) and ring up
the most expensive baskets both per trip ($49.40) and
per household per annum ($7,754).xxvi These consumers
patronize a diverse set of retailers, from convenience
stores to the major grocery banners, with one notable
exception – they frequent Whole Foods Market almost
three times as often as other segments.xxvii Beyond using
WELL BEINGS to monitor upcoming trends, this segment
is continually setting the bar higher regarding their
health. This highly proactive health orientation drives
them to constantly search for the next best solution for
maintaining a healthy lifestyle. They represent a prime
target for leading edge products.
FOOD ACTIVES comprise 18 percent of the population
and can be described as a “mainstream healthy group”–
dedicated to health through healthy eating, managing
weight and exercise based on a more traditional and
balanced outlook toward health and wellness. While they
want inherently healthy foods, that desire is offset by price
sensitivity and late new product adoption.
FOOD ACTIVES shop frequently (153 trips per household),
but are modest spenders with an average basket size of
$45.80 per trip, and an annual basket ring of $7,021 per
household.xxvii FOOD ACTIVES are highly oriented toward
personal responsibility when maintaining their health.
They represent opportunities for companies focused on
naturally nutritious foods and other trends such as clean
label products – a perfect target for fresh, less processed
store perimeter products.
19%
23%
20%
18%
20%

17Copyright © 2014 The Nielsen Company I Natural Marketing Institute (NMI), 2014. All rights reserved.
+
DIVERSITY IN SHOPPERS
Source: Natural Marketing Institute (NMI), U.S. General Population. Nielsen Homescan Panel, Total U.S. – 52 weeks ending 12/28/13
HIGH $ PER TRIPLOW TRIPS PER SHOPPER
FENCE SITTERS®
EAT, DRINK &BE MERRYS®
MAGIC BULLETS®
FOOD ACTIVES®
WELL BEINGS®
HIGH $ PER TRIPHIGH TRIPS PER SHOPPER
LOW $ PER TRIPLOW TRIPS PER SHOPPER
LOW $ PER TRIPHIGH PER SHOPPER
PRICE/ TASTE
BUY BASED ON QUALITY,
NOT PRICE SENSITIVE
$50
$50
$49
$49
$48
$48
$47
$47
$46
$46
$45134 136 138 140 142 144 146 148 150 152 154 156 158
TRIPS PER SHOPPER (ANNUAL)
$ PE
R TR
IP
MAGIC BULLETS comprise 23 percent of the population and prefer
to manage health with “medicine” rather than commit to a healthy
lifestyle via foods/beverages. Reporting the heaviest reliance on both
prescription drugs and supplements, these “conveniently healthy”
consumers nevertheless express concern about and manage their
weight. MAGIC BULLETS tend to address developed health conditions
reactively with a pill, rather than work to prevent them through diet,
exercise and food.
MAGIC BULLETS occupy the middle ground, exhibiting average
shopping frequency and spending patterns, visiting retail channels 151
times per household and spending $46.72 per trip with a total household
basket ring of $7,047 per year.xxix MAGIC BULLETS are a prime target for
products and services which can help them manage their existing health
issues and fill their need for quick and effective solutions. Products
such as functional foods and beverages may provide solutions for their
reactive approach to a healthy lifestyle.

18 HEALTH & WELLNESS IN AMERICA 2014
+
FENCE SITTERS comprise 20 percent of the population and aspire to be
healthy but admit to difficulty of juggling kids and the stresses of daily
life. They tend to jump on the latest health kick without setting clear
goals but look for guidance. This segment is a prime target for easy,
convenient and healthy food solutions.
FENCE SITTERS bring the second most valuable baskets to check-out
($48.01 per trip) but fall to fourth place among the five segments on
the total basket ring per household metric ($6,827) due to the modest
number of shopping trips per household (142).xxx As their name implies,
FENCE SITTERS are health strivers and oftentimes exhibit contradiction
between their attitudes and their behaviors based on their hectic
lifestyle. They want to have healthy behaviors, but sometimes they fall
short – a clear opportunity for companies to provide easy solutions and
guidance.
EAT, DRINK & BE MERRYS comprise 20 percent of the population and
remain indifferent towards healthy eating or initiating most healthy
lifestyle activities. They remain unconcerned about prevention and
when given a choice, they value taste over health benefits when food
shopping. Adding to their barriers, they are price sensitive.
EAT, DRINK & BE MERRYS may be living for the moment, but they
are not spending their money at retail. This segment accounts for the
fewest number of retail shopping trips (137), the lowest individual basket
rings ($45.38) and the lowest annual overall basket ring per household
($6,210).xxxi Regardless of their segment name, EAT, DRINK, & BE
MERRYS can still be a target for some health and wellness categories.
Their healthy behaviors are beginning to enter their consciousness as
they are starting to realize they are not invincible. Taste is still king
for this group, but opportunities exist to engage them with healthier
products – especially within categories which are not typically wellness-
oriented.

19Copyright © 2014 The Nielsen Company I Natural Marketing Institute (NMI), 2014. All rights reserved.
+
DIVERSE CATEGORY DEMAND ACROSS SEGMENTS
SEGMENT PSYCHOGRAPHICS INFLUENCE PURCHASE BEHAVIOR
While the NMI segmentation is based on self-reported attitudes, behavior
and psychographics, it has been validated with actual product purchase
patterns based on actual shopping behavior through Nielsen. As would
be expected, one segment surfaces as the valued health and wellness Super
Consumer: the WELL BEINGS. Their profile stands in stark contrast to the
least health-active group, the EAT, DRINK & BE MERRYS.
As expected from a highly motivated, health-active segment, the
WELL BEINGS’ buying rate over-indexes (meaning they buy more per
household than the average U.S. household) in categories that support
wellness goals such as fresh produce (141), wine (140), perhaps due to
red wine antioxidants, vitamins (124) and bottled water (118).xxxii
At the opposite end of the spectrum sit the EAT, DRINK AND
BE MERRYS. It should come as no surprise that they over-index
in categories that support a carefree lifestyle such as beer (116),
carbonated beverages (115) and tobacco (112).xxxiii
$BUYING RATE INDEX
FRESH PRODUCE 141 104 90 96 80
WINE 140 103 84 88 82
VITAMINS 124 117 105 92 49
BOTTLED WATER 118 92 99 107 88
DRY PASTA 109 99 97 98 99
CANDY 94 103 105 95 97
BEER 86 90 104 100 116
CARBONATED BEVERAGES 76 96 104 101 115
TOBACCO & ACCESSORIES 74 86 116 84 112
WELL
BEINGS
FOOD
ACTIVES
MAGIC
BULLETS
FENCE
SITTERS
EAT, DRINK &
BE MERRYS
WHERE
IS YOUR
CATEGORY
OR BRAND
CONNECTING?
20 HEALTH & WELLNESS IN AMERICA 2014
+
CONCLUSIONS
Health and wellness is growing up, marked by the proliferation of
healthy products and practices which are mainstreaming across
all types of categories and consumers. The consumer pursuit of
personal responsibility is becoming more customized, moving toward
individualized solutions such as food intake mobile apps that facilitate
deeper control into one’s health.
The growth and progression of good-for-you foods and beverages further
reveal how consumers are pushing the envelope in search of better,
healthier and smarter solutions which best fit their lifestyle and specific
needs.
NMI’s Health and Wellness segmentation, along with the integration
across many Nielsen solutions, highlights how consumers approach
health differently and how these health attitudes and behaviors require
different strategies and approaches for manufacturers and retailers. In
the end, the future of health and wellness can no longer support a ‘one-
size-fits-all’ mentality.
The Nielsen/NMI collaboration provides an essential guide when
assessing opportunity analysis, new product development, marketing
communications and overall strategic planning, as it analyzes the
many transformations across consumers and the health and wellness
marketplace.
Regardless of challenges in the health and wellness space, the
motivation to foster strategies for a healthier America is powerful,
because healthier consumers make for a healthier bottom line.

21Copyright © 2014 The Nielsen Company I Natural Marketing Institute (NMI), 2014. All rights reserved.
+
DATA SOURCESNielsen Homescan: Nielsen’s consumer panels monitor shopper
behavior for more than 250,000 households in 25 countries. The
U.S. sample is the largest longitudinal panel representing all-outlet
purchases including both Spanish- and English-speaking Hispanics.
Nielsen panels help marketers understand the why behind the buy to
enhance marketing strategies.
Nielsen Global Online Survey: A series of regular online surveys
conducted with more than 30,000 online consumers covering a range of
timely topics. Nielsen uses a minimum reporting standard of 60 percent
Internet penetration or 10 million online population for survey inclusion.
The Nielsen Global Survey, which includes the Global Consumer
Confidence Index, was established in 2005.
NMI Health & Wellness Trends Database: The industry’s most
comprehensive wellness insight source based on annual research
among general population U.S. consumers. The database began in
1999 and now includes 50,000+ consumers. Results include detailed
evaluations of attitudes, behaviors, and psychographics, among many
other topics across a wide spectrum of market sectors, including CPG,
restaurants, and retail. Annual results are nationally representative of
U.S. households, statistically significant at the 95 percent confidence
level with a sample reliability of +/-1.2 percent.
NMI Health & Wellness Segmentation: A segmentation model that
divides the entire U.S. adult population into one of five mutually-
exclusive segments. Developed in 2001, the model was derived
through a combination of advanced statistics including exploratory
and confirmatory factor analysis, convergent cluster analysis, and
discriminant functions, among other techniques. It has been validated
across multiple industries and global geographies. A typing tool
(algorithm) is used to segment data sets, with an accuracy of 80+
percent.
CONTRIBUTORS
BOB BIRD, Senior Vice President, Nielsen
MARY FENDRICH, Director of Project Management, Natural Marketing Institute
TODD HALE, Senior Vice President, Consumer and Shopper Insights, Nielsen
NAMRATA KUMAR, Delivery Manager, Nielsen
ERIK QUICK, Manager, Consumer & Shopper Analytics, Nielsen
EMILY RIVERA, Client Manager, Nielsen

22 HEALTH & WELLNESS IN AMERICA 2014
+
i “Adult Obesity Facts,” Fact Sheet, Centers for Disease Control and Prevention, March 28, 2014. http://www.cdc. gov/obesity/data/adult.htmlii “Most Americans Are Health-Conscious, But Behavior Varies by Age,” Pres Release, Harris Interactive, April 27, 2011. http://www.harrisinteractive.com/vault/HI-Harris- Poll-Eating-Habits-2011-04-27.pdfiii “Most Americans Are Health-Conscious, But Behavior Varies by Age,” Pres Release, Harris Interactive, April 27, 2011. http://www.harrisinteractive.com/vault/HI-Harris- Poll-Eating-Habits-2011-04-27.pdfiv “Are Baby Boomers an Invisible Gold Mine for Marketers?” Colette Martin, Forbes, August 10, 2012. http://www.forbes.com/sites/work- in-progress/2012/08/10/are-baby-boomers-an-invisible- goldmine-for-marketers/v Natural Marketing Institute 2013 Health & Wellness Trends Databasevi Natural Marketing Institute 2013 Health & Wellness Trends Databasevii “Pomegranate Power,” WebMD. http://www.webmd.com/ food-recipes/features/pomegranate-powerviii “Health Benefits of Taking Probiotics,” The Harvard Medical School Family Health Guide. http://www.health. harvard.edu/fhg/updates/update0905c.shtmlix “Nutrition Facts Food Labels Too Confusing for Most People, FDA Researchers Say,” Reuters, Health, January 24, 2013. http://www.nydailynews.com/life-style/health/ food-labels-confuse-people-fda-study-article-1.1246816x “Vermont Lawmakers Pass GMO Labeling Bill; Governor Expected to Sign,” Associated Press, April 24, 2014. http://www.huffingtonpost.com/2014/04/24/vermont- lawmakers-pass-gmo-labeling-bill_n_5203569.htmlxi Natural Marketing Institute 2013 Health & Wellness Trends Databasexii Nielsen Global Online Survey–Q1 2011xiii Nielsen Health and Wellness Online Survey— February 2014xiv “Most Americans Are Health-Conscious, But Eating Behavior Varies with Age,” Press Release, Harris Interactive, April 27, 2011. http://www.harrisinteractive.com/NewsRoom/ HarrisPolls/tabid/447/ctl/ReadCustom%20Default/ mid/1508/ArticleId/762/Default.aspx
xv Nielsen Global Online Survey—Q1 2012xvi Nielsen Global Online Survey—Q1 2012xvii Natural Marketing Institute 2013 Health & Wellness Trends Databasexviii Natural Marketing Institute 2013 Health & Wellness Trends Databasexix Natural Marketing Institute 2013 Health & Wellness Trends Databasexx “What are Functional Foods?” Plates with a Purpose, Eat Right, Academy of Nutrition and Dietetics. http://www.eatright.org/Public/content. aspx?id=6442472528xxi Natural Marketing Institute 2013 Health & Wellness Trends Databasexxii Natural Marketing Institute 2013 Health & Wellness Trends Databasexxiii Natural Marketing Institute 2013 Health & Wellness Trends Databasexxiv Natural Marketing Institute 2013 Health & Wellness Trends Databasexxv Natural Marketing Institute 2013 Health & Wellness Trends Databasexxvi Nielsen Homescan Panel, Natural Marketing Institute Health & Wellness Segmentationxxvii Nielsen Homescan Panel, Natural Marketing Institute Health & Wellness Segmentationxxviii Nielsen Homescan Panel, Natural Marketing Institute Health &Wellness Segmentationxxix Nielsen Homescan Panel, Natural Marketing Institute Health & Wellness Segmentationxxx Nielsen Homescan Panel, Natural Marketing Institute Health & Wellness Segmentationxxxi Nielsen Homescan Panel, Natural Marketing Institute Health & Wellness Segmentationxxxii Nielsen Homescan Panel, Natural Marketing Institute Health &Wellness Segmentationxxxiii Nielsen Homescan Panel, Natural Marketing Institute Health & Wellness Segmentation
FOOTNOTES
23Copyright © 2014 The Nielsen Company I Natural Marketing Institute (NMI), 2014. All rights reserved.
+
ABOUT NMI
Natural Marketing Institute (NMI) is an international strategic
consulting and market research company specializing in health &
wellness, sustainability and healthy aging. As a leading business
consulting and market research firm, NMI assists a range of Fortune 500
and start-up companies across many types of industries. By utilizing a
diverse mix of proprietary methodologies and comprehensive syndicated
data, NMI provides its clients with insightful market analysis and
strategic planning. For more information, visit www.NMIsolutions.com.
© Natural Marketing Institute (NMI), 2014. All rights reserved.
ABOUT NIELSEN
Nielsen Holdings N.V. (NYSE: NLSN) is a global information and
measurement company with leading market positions in marketing
and consumer information, television and other media measurement,
online intelligence and mobile measurement. Nielsen has a presence in
approximately 100 countries, with headquarters in New York, USA, and
Diemen, the Netherlands.
For more information, visit www.nielsen.com.
Copyright © 2014 The Nielsen Company. All rights reserved. Nielsen and
the Nielsen logo are trademarks or registered trademarks of CZT/ACN
Trademarks, L.L.C. Other product and service names are trademarks or
registered trademarks of their respective companies. 14/7866

24 HEALTH & WELLNESS IN AMERICA 2014
+
24Copyright © 2014 The Nielsen Company
+