health effects of plant bioactive compounds nutrigenomics nutrigenomics approaches approaches
TRANSCRIPT

BlandineBlandineBlandineBlandineBlandineBlandineBlandineBlandine COMTECOMTECOMTECOMTECOMTECOMTECOMTECOMTE
Health effects of plant bioactive compounds Health effects of plant bioactive compounds
NutrigenomicsNutrigenomics approachesapproaches
BlandineBlandineBlandineBlandineBlandineBlandineBlandineBlandine COMTECOMTECOMTECOMTECOMTECOMTECOMTECOMTE
“Innovative Health“Innovative Health--Promoting Food”Promoting Food”International Event on Functional FoodInternational Event on Functional Food
2929thth--3030thth SeptemberSeptember –– BerlinBerlin -- GermanyGermany
“Innovative Health“Innovative Health--Promoting Food”Promoting Food”International Event on Functional FoodInternational Event on Functional Food
2929thth--3030thth SeptemberSeptember –– BerlinBerlin -- GermanyGermany
JUR1019www.clermont.inra.fr/unh/

The Joint Research Unit gathers 150 persons in 10 teams (2 platforms: Metabolic
Exploration Platform (MS) and an animal facility), including a permanent staff of over
50 scientists
The Human Nutrition Unit - JRU1019
INRA
Clermont-Ferrand
Elucidation of key mechanisms involved in
the prevention of aged associated diseases the prevention of aged associated diseases
by nutrients and foods
Impact of micronutrients on cardiovascular disease prevention and
understanding the cellular and molecular mechanisms involved

MetabolicMetabolicStressStress
OxidativeOxidativeStressStressInflammationInflammation
ENERGETIC DENSITY
Metabolic dysfunctionsMetabolic dysfunctionsMetabolic dysfunctionsMetabolic dysfunctions
Cardiovascular diseasesCardiovascular diseasesCardiovascular diseasesCardiovascular diseases
StressStressInflammationInflammation
HomeostaticHomeostaticperturbationsperturbations
Deleterious / preventiveDeleterious / preventiveeffects of nutrientseffects of nutrients
NUTRITIONAL DENSITY

Metabolicphenotypes
GenesEnvironment
LifestyleFood
HomeostasisRisk management
(irreversible?)
Health management
Health
biomarkers
Early / prognostic
Disease biomarkers
Late / diagnostic
Disease biomarkers
Drug intervention
(irreversible)
Dynamics of metabolic phenotypes
Nutritional
intervention
Nutritional
prevention
Macronutrient balance
Diversity bioactives
Interactions between nutrients
Matrix effects
Complex food / Dietary patterns
Adapted from Rezzi et al;
J. Proteome Res. 2007, 6:
513-25

Health effects of bioactive compounds
UTILIZATION OF THE METABOLOMIC APPROACH TO
CHARACTERIZE THE EXPOSURE TO NUTRIENTS AND BIOACTIVES
AND IDENTIFY DIET COMPONENTS/INTERACTIONS RESPONSIBLE
FOR THE EFFECTS
IDENTIFY CARDIOVASCULAR PROTECTIVE EFFECT OF POLYPHENOLS IDENTIFY CARDIOVASCULAR PROTECTIVE EFFECT OF POLYPHENOLS
AT NUTRITIONAL DOSES AND DECIPHER POTENTIAL MOLECULAR
MECHANISMS
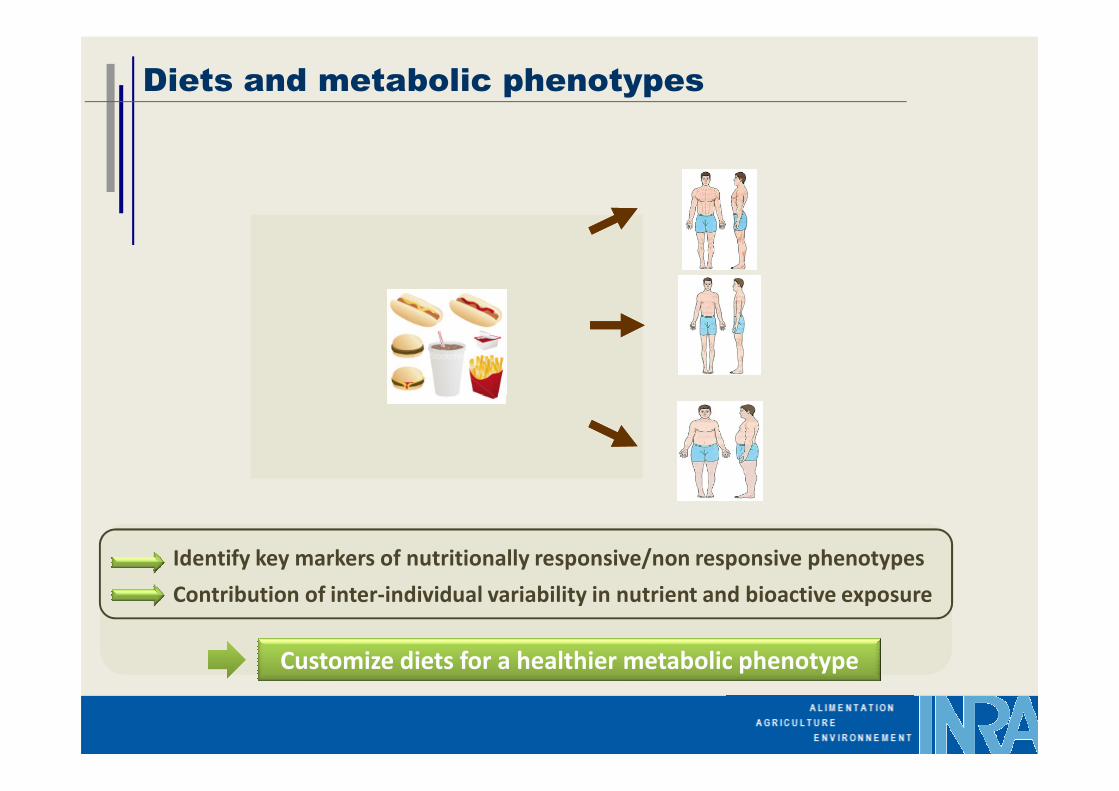
Diets and metabolic phenotypes
Identify metabolic targets
Characterize exposure to nutrients and bioactives for each diet
Identify diet components/interactions responsible for the effects
Identify key markers of nutritionally responsive/non responsive phenotypes
Contribution of inter-individual variability in nutrient and bioactive exposure
Customize diets for a healthier metabolic phenotype

Food metabolome: all metabolites directly coming the digestion and metabolism of
food components
Absorption
Metabolism
Excretion
N
N
O
O
O O
OH OH
OMeMeO
NO S O
O
O
O
OH
COOH
OHOH
OHOH
CO
OH
OH
OH
OH
OHOH
CO
O
O O
O
OHOH
OH
OH
OH
OH
CO
CO
O
O
O
OH
OH
OC
OH
OH
OHOH
OH
OHOC
CO
O
O
OO
OH
OH
OHOH
OHOH
COOC
O O
CO
4
OH
OH
OH
OH
OH
O
H
OH
OH
O
O
Dietary patterns
Food metabolome
OOH
OH
OH
OH
OH
+
S
O
SO
OHOH
OH
OH
OMe
COOH
OH
OO
OHOHOH
OH
O
OHOH
OHO
OH
OHOH
NH
CH3H
H
CH3
HH
HO
CH3
CH3
H
H
O
OH
OO
OHSpecific signatures
of food intake
Foods
MetabolomiqueHigh resolution Mass spectrometry
Manach et al., Mol Nutr Food Res 2009
Biomarkers of intake for specific foods & dietary patterns
Extensive phenotyping of dietary exposures, including phytochemicals
Identification of new bioactives

Controled intervention study, one single dose
0
10
20
t[2]
MJ0MJ0
0-6
0-6
0-6
0-6
6-12h
6-12h
12-N
MJ1
MJ1
MJ1
MJ0MJ0
MJ0
MJ0
0-6
0-6
0-6
0-6
6-12h
6-12h
6-12h6-12h
12-N
12-N
12-N
12-N
MJ1
MJ1
MJ1
MJ1
MJ0
MJ0MJ0
MJ0
0-60-60-60-6
6-12h6-12h
6-12h
6-12h12-N
12-N
12-NMJ1
MJ1
MJ1
MJ1
ORGRCO
0-6h
6-12h
12h-night
1st urine d1
1st urine d0 0-6h
6-12h
Score plot PCA ORANGE JUICE
GRAPEFRUIT JUICE
CONTROL DRINKCONTROL DRINK
Biomarkers of citrus intake PNRA-AGRUVASC
One month controled intervention study
-2000
0
2000
4000
6000
8000
10000
t[2
]
J30
J30
J30
J30
J30J30
J30
J30
J30
J30
J30
J30
J30
J30
J30
J30
J30
J30
J30 J30
J30
J30
J30J30
J30
J30
J30
J30
J30
J30
J30
J30J30
J30
J30
J30
J30
J30
J30
J30J30
J30
Score plot PLSDA
24 volunteers
600 ml/d Orange juice / Control drink
Free feeding, cross-over study, morning urine spot D30
-20
-10
-20 -10 0 10 20 30
t[1]
MJ0
MJ0
0-6
6-12h
6-12h12-N
12-N
12-N12-N
MJ1
MJ0 6-12h12-N
1st urine d01st urine d1
6-12h
12h-night -8000
-6000
-4000
-8000 -7000 -6000 -5000 -4000 -3000 -2000 -1000 0 1000 2000 3000 4000 5000 6000 7000 8000
t[1]
J30
J30 J30
J30
J30
J30
Good discrimination of citrus consumption by urinary metabolites
1,089 significant ions & not intense
after juice consumptions of citrus juice
57 significant ions & more intense after
orange juice consumption

The approach in the SU.VI.MAX2 cohort
The SU.VI.MAX2 cohort (6,850 M & F; 55-70 y.o.)
FFQ between 2007 & 09
+ 6 24h recalls between
1994-2002 (SU.VI.MAX1)
40 LOW citrus consumers<1.5 g/day; median=0.9 g/d
40 HIGH citrus consumers>25 g/day; median=45.7 g/d
Biobank
Coll. S. Hercberg, P. Galan,
UREN, Inserm/INRA/CNAM/Paris 13
Biobank(Urine spot 2007-2008)
1/2 dilution; UPLC- ESI positive mode - (QToF)MS
Scan mode m/z 70-1000, 26 min gradientMarkerlynx
One way ANOVA:
167 significant ions/citrus consumption (P-value<0.05)
LC-QToF metabolomics analysis
Multivariance statistical analyses868 detected ions

-10
-5
0
5
10
15
t[2
] 12816H
13214H
13245H
13280H
17774H
13374H
13413H13435H
13457H
13862H13890H
13934H
13950H
15244H
15445H
15817H
15893H
15935H
16355H
16375H
16405H
16472H
16518H16701H
16725H
16772H16774H
16895H
17159H
17190H
17209H
13911H
17316H
17328H17469H17477H
17544H17580H
17870H
11864L12521L
12585L
12675L
12756L
13144L
13150L
13204L
15230L13483L
13735L
13766L
13910L
13962L
14274L
14517L
15398L
15420L
15554L15656L
15884L
16387L16467L16543L
16550L
16751L
16886L16947L
16987L
17006L
17049L
17291L
17396L
17472L
17536L
17735L17753L
17877L
17934L
OSC-PLS (Log Pareto)
Discrimination of citrus consumption in the
SU.VI.MAX2 cohort
Very good discrimination of
the high vs low citrus
consumers
Q2Cum = 0.84
OSC-PLS Loading plot
0.06
0.08
[email protected]@1.3147.042@9
[email protected]@[email protected]@5.1 [email protected]
[email protected]@[email protected]
[email protected]@10.6
Ions with a
high VIP
-20
-15
-10
-15 -14 -13 -12 -11 -10 -9 -8 -7 -6 -5 -4 -3 -2 -1 0 1 2 3 4 5 6 7 8 9 10 11 12 13 14 15
t[1]
15836HHigh consumers
Low consumers
Selection of the ions to identify biomarkers of citrus consumptionVIP PLS >1.5 or P-value AVOVA <0.001 & more intense if citrus consumption
23 ions
-0.12
-0.10
-0.08
-0.06
-0.04
-0.02
-0.00
0.02
0.04
0.06
-0.09 -0.08 -0.07 -0.06 -0.05 -0.04 -0.03 -0.02 -0.01 -0.00 0.01 0.02 0.03 0.04 0.05 0.06 0.07 0.08 0.09 0.10 0.11 0.12 0.13 0.14 0.15
w*c
[2]
w *c[1]
111.019@22
111.043@6
112.017@22
[email protected]@11.9
[email protected]@16.8
[email protected]@[email protected]
[email protected]@[email protected]
129.052@6
130.061@11
[email protected]@[email protected] [email protected]
139.986@22
147.042@9
[email protected]@17.7
151.035@7
153.038@2
[email protected]@22.9
170.058@11
[email protected] [email protected]
176.07@11
[email protected]@[email protected]
181.07@1
[email protected] [email protected]
[email protected] [email protected]
[email protected]@22.1
[email protected] [email protected]
190.049@8
192.065@8
[email protected] [email protected]
202.111@5
209.118@15
211.06@6
[email protected]@[email protected]
219.16@12
225.113@9
226.085@7
[email protected]@12.1
229.139@11
[email protected]@19.6
231.071@5
[email protected]@12.9
[email protected] [email protected]
[email protected]@10.6
251.129@15
[email protected]@10.5
256.119@2
256.13@6
257.114@3
[email protected]@11.3
258.118@3
261.119@9
[email protected]@11.8
274.095@6
[email protected]@11.1
279.133@9
286.121@9
[email protected]@18.8
[email protected]@19.6
300.108@2
300.218@11
304.129@9
[email protected]@18.3
304.231@16
[email protected]@17.6
[email protected]@19.6
[email protected]@11.4
[email protected]@10.4
[email protected] [email protected]@8.5
316.249@12
[email protected]@[email protected]
[email protected]@11.1
[email protected]@18.8
[email protected]@17.6
[email protected] [email protected]
[email protected]@[email protected]
340.103@9
341.172@8
[email protected]@[email protected]
[email protected] [email protected]
[email protected]@11.8
[email protected]@16.1
[email protected]@17.3
368.259@18
[email protected]@[email protected]
393.3@22
[email protected]@22.2
399.31@19
[email protected]@12.9
[email protected]@13.7 [email protected]
431.065@6
[email protected] [email protected]@0.5
[email protected]@21.4
452.192@11
[email protected]@22.9
[email protected] [email protected]
459.138@9
[email protected]@11.5
475.405@22
[email protected]@10.7
[email protected]@11.7
[email protected] [email protected]
[email protected]@21.9 [email protected]
875.363@6
95.013@4

Identification strategy
Metabolites Known + predicted by
�1 700 entries with
224 known phytomicronutriments+
DB of citrus phytomicronutrientsmetabolites
(Lhasa Ltd)
Analysis of the mass spectra%
1 0 0
R A M O R 0 -6 4 7 5 (1 4 .0 3 3 ) C m (4 7 4 :4 7 6 -4 6 8 :4 7 1 ) 1 : T O F M S E S + 8 .7 0 e 33 6 9.0 4 1 4
8 6 9 7
3 4 7 .0 91 62 6 9 4
3 1 1.0 8 0 31 8 2 31 5 3 .0 9 4 6
1 64 9
7 1 5 .1 5 1 32 8 4 8
3 7 0 .0 6 4 516 0 6
[2M+H]++Na
+Na
-H2O -glucuronide
Hypothesis – Plausibility Analysis (/literature)
�1 700 entries with monoisotopic masses
LTQ-OrbitrapTM: Monoisotopic mass +
MS/MS spectra + UV-Vis spectrum
Standard analysis if available��������
��������
m /z1 5 0 1 7 5 2 0 0 2 2 5 2 5 0 2 7 5 3 0 0 3 2 5 3 5 0 3 7 5 4 0 0 4 2 5 4 5 0 4 7 5 5 0 0 5 2 5 5 5 0 5 7 5 6 0 0 6 2 5 6 5 0 6 7 5 7 0 0
0
26 5 .0 8 4 04 0 4
1 7 1 .1 0 2 032 7
3 1 2 .0 9 5735 5
6 9 3 .18 2 95 4 0
3 7 1 .0 7 8 63 3 8

Validation - identification of the Ion 144.097: Proline Betaine
Retention time
MS/MS Monoisotopic mass
Standard UrineLTQ-Orbitrap
Already identified as a biomarker of citrus consumption
AJCN 2010, 92:436-43

Biomarker identifications
IONS Identification P-Value ANSSD Rang ANSSD P-Value Agruvasc1 Rang Agruvasc1
[email protected] Unknown C6H10O3N 1.33E-12 2 1.50E-03 224
[email protected] Proline betaine 9.21E-07 3 4.13E-07 42
[email protected] Adduct Na 347 1.97E-06 4 5.72E-05 96
[email protected] Several Hypotheses 3.28E-06 6 3.96E-12 11
[email protected] Hesp 3'gluc (fragment) 2.25E-05 8 8.30E-07 50
[email protected] Several hypotheses 3.62E-05 9 3.30E-03 248
[email protected] Hydroxyproline betaine (tentative) 1.43E-04 12 1.00E-02 313
[email protected] Unknown C8H9O3 1.83E-04 13 3.26E-04 148
[email protected] Several Hypotheses 3.68E-04 14 2.75E-07 33
H L
05
00
01
00
00
15
00
0
Boxplot [email protected]
H L
05
00
01
00
00
15
00
0
Boxplot [email protected]
50
00
Boxplot [email protected]
50
00
Boxplot [email protected]
20
00
30
00
40
00
Boxplot [email protected]
20
00
30
00
40
00
Boxplot [email protected]
H L
05
00
10
00
15
00
Boxplot [email protected]
H L
05
00
10
00
15
00
Boxplot [email protected]
[email protected] Naringenin 4'-gluc (fragment) 6.50E-04 15 1.67E-04 131
[email protected] Several hypotheses 3.64E-03 18 1.73E-11 14
[email protected] Naringenin 7-gluc 1.49E-02 22 6.42E-07 47
H L
01
00
02
00
03
00
04
00
0
H L
01
00
02
00
03
00
04
00
0
H L
01
00
0
H L
01
00
0
Coherent hypotheses with the Orbitrap mass measurement
But difficult validation (no available standards and low biological concentrations)
All the most discriminating ions were also present in the short term controlled study Agruvasc
But not in the lowest p-values

2,000 food phytomicronutrimentsClassification
Internet database on food phytomicronutriments and their metabolites in human
Literature
Composition tables
In silico prediction of
metabolism
PhytoMetaBank
ClassificationKnown metabolitesIn silico predicted metabolitesFood sources
Physical & chemical data (logP, …)
Spectral data (monoisotopic mass…)
Links to other databases
Experimental data
MS/MS, UV…Collect / prediction of
physical & chemical data
Open online database

Health effects of bioactive compounds
IDENTIFY CARDIOVASCULAR PROTECTIVE EFFECT OF POLYPHENOLS
UTILIZATION OF THE METABOLOMIC APPROACH TO
CHARACTERIZE THE EXPOSURE TO NUTRIENTS AND BIOACTIVES
AND IDENTIFY DIET COMPONENTS/INTERACTIONS RESPONSIBLE
FOR THE EFFECTS
IDENTIFY CARDIOVASCULAR PROTECTIVE EFFECT OF POLYPHENOLS
AT NUTRITIONAL DOSES AND DECIPHER POTENTIAL MOLECULAR
MECHANISMS

Polyphenols and health
�� PhytomicronutrientsPhytomicronutrients, most abundant dietary antioxidants, most abundant dietary antioxidants
(Guilland et al., 1986; Kühnau, 1976)
12
0 250 500 750 1000
Vitamin C
Polyphenols
Consumption (mg/day)
Vitamin E
Carotenoids
90
1000
5
R° R3R3 RH
.
Free radical scavenger in vivo?
Phenolic acids (Hydroxybenzoic and Hydroxycinnamic acids)
Flavonoids (Flavanols, flavones, flavanones, isoflavones…)
Lignans
Stilbenes
Cereals
Other Vegetables Beverages
Wine, coffee, the, chocolate…
Fruits
7 % 8 % 11 % 33 % 41 %R°
R1
O
R2
R3
OH
R1R2
R3 RH
.
* In plasma: polyphenols ≈ 1µM
Cardiovascular protective properties are not related to direct anti-
oxidant effects

Polyphenols and cardiovascular diseases
- Inverse association between flavanons intake and CHD mortality
(Arts and Hollman, 2005)
(Mink et al., 2007)
- Beneficial effect of flavonoids consumption on CVDs
(coronary artery disease risk and stroke risk)
Epidemiological studies
Clinical trials
Meta-analysis: flavonoid- rich food & beverages: tea, cocoa, soyaMeta-analysis: flavonoid- rich food & beverages: tea, cocoa, soya
Improvement of: � Systolic and diastolic blood pressure
� Endothelial function (Hooper et al., 2008)
Animal studies
- Reduction of atherosclerotic lesions upon consumption of tea
extracts, wine, pomegranate juice, grapes in apoE-/- mice model
(Furhman et al., 2005)
(Hayek et al., 1997)

Human Intervention Studies
Flavonoid rich foods / isolated
compoundsEx: Orange juice / Hesperidin
Protective effects and molecular mechanisms
Animal studies
apoE -/- mice
Polyphenol supplementation at
nutritional doses- catechin
- curcumin
In vitro studies
Polyphenol metabolites
at nutritional doses
Ex: Flavanones metabolites
HUVECs
Dietary polyphenols and cardiovascular function
- Assessment of vascular
function(FMD by echodoppler,
microvascular function by PAT
index, microvascular reactivity by
LD imaging coupled to
iontophoresis, arterial compliance)
- Systemic markers of
cardiovascular risk
- Gene expression analyses
(transcriptome study)
- Histomorphometry of aorta
- Biochemical parameters
- Gene expression analyses
(transcriptome study)
- miRNA expression profiling
- Immunohistochemistry
- curcumin
- anthocyanidin
- naringenin
- Adhesion of monocytes
- Proliferation of HUVEC
- Target gene expression
analyses (LDTArrays)
- Migration of HUVEC
(wound healing test)
- Transendothelial migration
of monocytes

Identification of potential molecular targets
ERK1/2 ERK5 JNK1/2/3 p38MAPK
Transcription factor
MEK1/2 MEK5 MKK4/7 MKK3/6MAPKK
Gene expression
A-Raf, c-Raf
Mos
MEKK 2
MEKK 3MEKK 1, 4
ASK
MLK3
TAKMAPKKK
MAPK signaling pathway
p65 p50
IκB
P P
p65 p50
IκB
p65 p50
P P
IκB
NF-κB signaling pathway
Phosphorylation of IκB by IKK
Degradation of IκB by proteosome
Liberation of NFκB complex
Transcription factormiRNA
Decrease in atherosclerotic lesion development
in vivo using nutritional doses A
Atherosclerotic
lesions
Control Polyphenol
Cell adhesion / transendothelial
migration
Modification of gene expression in aorta
Bioinformatics analysis

n=2 X 20n=2 X 20n=2 X 20n=2 X 20
*N=20 / group
*Models :
- Apo E-/-
- C57Bl/6J on high fat
high cholesterol diet
*6 week-old
- Control diet
- Polyphenol (0.02%)
i) catechin
ii) naringin
iii) anthocyanidins
iv) curcumin
16 weeks
Lipid, inflammation and
antioxidant parameters in
plasma
Lipid parameters in liver
Lipid deposit in aortic root by
histomorphometry
Gene expression analysis
in aorta
CatechinCatechin AnthocyaninsAnthocyanins NaringinNaringin
Experimental approach
CatechinCatechin
10
10,5
11
11,5
12
12,5
13
control catechinMe
an
ath
ero
scle
rosi
s le
sio
ne
d a
rea
(%
)
32%
5,5
6
6,5
7
7,5
8
8,5
control curcumin
Me
an
ath
ero
scle
rosi
s le
sio
ne
d a
rea
(%
)
CurcuminCurcumin
26%
8
9
10
11
12
control anthocyanidins from
blueberrey
Me
an
ath
ero
scle
rosi
s le
sio
ne
d a
rea
(%
)
AnthocyaninsAnthocyanins
15%
7000
8000
9000
10000
11000
12000
control naringeninMe
an
ath
ero
scle
rosi
s le
sio
ne
d a
rea
(µ
m²)
NaringinNaringin
25%
Auclair S., et al. 2009. Atherosclerosis. 204(2):e21-7
Mauray A, et al. 2009. J Agric Food Chem. 57:11106-11.
Chanet C, et al. 2011. J Nutr Biochem Epub 2011 Jun 16.
Coban et al. Under revision in Mol Nut Food Res
Consumption at nutritional doses resulted in a significant reduction of lipid
deposits in aorta, independently to changes in plasma lipid levels or
antioxidant capacity

Common pathways
Nutrigenomic analysis: global (transcriptomics) or targeted approaches
Molecular mechanisms of action of bioactives
Curcumin reduces macrophage number in
the atherosclerotic lesion by 30%,
possibly related with modification in
gene expression
Macrophage quantification in aortic roots
(immunohistochemistry)
Aorta gene expression (transcriptomics)
Hierarchical clustering of
pathway profiles
Auclair S., et al. 2009. Atherosclerosis. 204(2):e21-7
Mauray A, et al. 2009. J Agric Food Chem. 57:11106-11.
Chanet C, et al. 2011. J Nutr Biochem Epub 2011 Jun 16.
Coban et al. Under revision in Mol Nut Food Res
- Polyphenols modulate gene expression in aorta
- Functional analysis revealed a cluster of common pathways
related to cell-cell adhesion, cell junctions, focal adhesion, and
cell cytoskeleton that are related to transendothelial migration
Curcumin Control
X 40
Me
rge
pro
pid
ium
io
did
eM
ac-
3
X 40
X 40
X 40
X 40
X 40
(immunohistochemistry)

Phytomicronutrients of citrus fruits
1) Identification and synthesis of polyphenol metabolites:
HO
OH
O
O
O
OCO2Na
OH
OHHO
Blood
sample
LC MS/MS analysis:
Identification of
circulating metabolites
Chemical synthesis of
circulating metabolites
Grapefruit juice
Bioactive-glucuronides
Bioactive-sulfates
. . . . . . .
Polyphenol metabolites on cellular activity
circulating metabolitesOrange juice
exposition to metabolites Exposition to TNFα
Monocyte added
Crystal violet staining
HUVECHUVEC
U937U937
- Image capture
- Count of monocytes adhering to HUVEC
2) Monocyte to endothelial adhesion assay:
Met1 Met2 Met3
* *
0
20
40
60
80
100
120
140
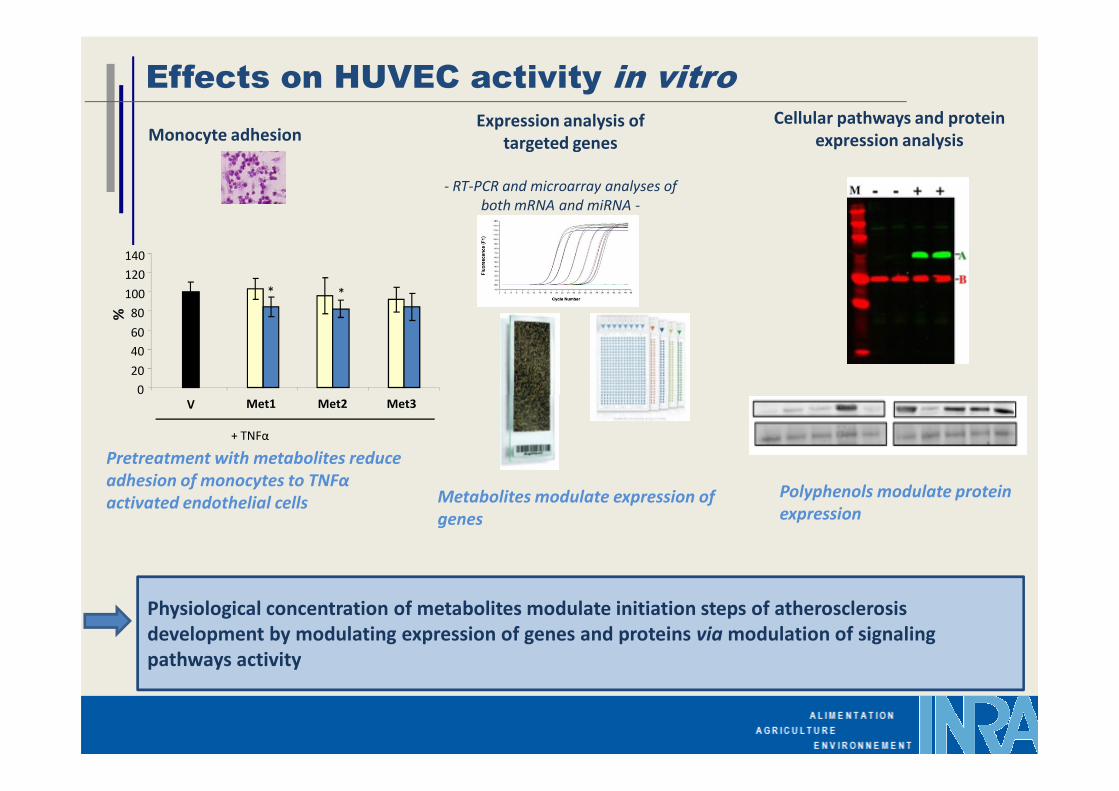
Monocyte adhesionExpression analysis of
targeted genes
- RT-PCR and microarray analyses of
both mRNA and miRNA -
Cellular pathways and protein
expression analysis
Effects on HUVEC activity in vitro%
Met1 Met2 Met3V
+ TNFα
0
Pretreatment with metabolites reduce
adhesion of monocytes to TNFα
activated endothelial cells Metabolites modulate expression of
genes
Polyphenols modulate protein
expression
Physiological concentration of metabolites modulate initiation steps of atherosclerosis
development by modulating expression of genes and proteins via modulation of signaling
pathways activity

A: 500 ml/d of orange juice
B: 500 ml/d of an isocaloric control drink + 1 placebo capsule
C: 500 ml/d of an isocaloric control drink + 1 capsule filled with 292 mg Hesperidin
Microvascular reactivity measurement using
laser Doppler coupled to Iontophoresis
Functional & Systemic measurements
Role of hesperidin in the effects of orange juice?
A, B or C Wash Out A, B or C A, B or CWash Out
4 weeks 4 weeks 4 weeks
Inclusion
Peripheral Arteriel Tonometry Flow mediated dilatation (FMD)
Morand C, et al. 2011. Am J Clin Nutr. Jan;93(1):73-80
A one month consumption of orange
juice, or pure Hesperidin, induced a
significant decrease in diastolic blood
pressure.
Orange juice and Hesperidin ingestion
significantly improved postprandial
microvascular endothelial reactivity.

Many of these genes
Orange juice
3,422 genes
933
649810
1,030
137
100
Hesperidin
1,819 genes
Up regulated genes
Down regulated genes
Number of differentially
expressed genes in leukocytes
Microarray analysis:
1,582 genes are differentially
expressed by orange juice and
Role of hesperidin in the effects of orange juice?
Heat-map of atherosclerosis-related gene expression
Many of these genes
are implicated in
chemotaxis, adhesion,
infiltration and lipid
transport:
suggesting lower
recruitment and
infiltration of
circulating cells to
vascular wall and lower
lipid accumulation.
expressed by orange juice and
hesperidin consumption
Milenkovic et al in press, PloS ONE

CONCLUSION
�������� The identification of the discriminating molecules is the bottleneck of the
metabolomic approach. Regarding the Food metabolome it is related to the low
��������The best found biomarkers are in part different from those found in controlled
intervention studies.
Food consumption biomarkers
(cohorts)
Exposition to metabolites of
phytomicronutriments
(interventions)
vs
?
�������� The metabolomic approach allows to identify biomarkers of food consumption
directly in cohort studies.
��������metabolomic approach. Regarding the Food metabolome it is related to the low
concentrations in biofluids, of the lack of knowledge in databases and the
absence of standards.
Potential cellular and molecular targets have been identified.��������
�������� Polyphenols present cardiovascular preventive properties, their bioactive effects
are mediated by their capacity to modulate expression of genes.

Estelle PUJOS-GUILLOTJean-François MARTINBernard LYANFrank GIACOMONIJean-Louis SEBEDIOMarie-Laure BAYLECharlotte JOLYDaniel CESAIRE
Financial supports: Agruvasc,
Claudine MANACHDragan MILENKOVICAndré MAZURChristine MORANDSergio POLAKOFMercedes QUINTANAAugustin SCALBERT
Bruno CHABANASAudrey CHANEYSylvain CLAUDEDilek COBANJane HUBERT
UMR1019-Unit of Human Nutrition
ANR Agruvasc
Serge HERCBERG
Pilar GALAN
UREN, Inserm/INRA/
CNAM/Paris 13
Acknowledgments
Dominique BAYLECatherine BESSONMarie-Anne VERNY
Financial supports: Agruvasc,
Programme ANSSD2010 AlimH INRA
Citrus Dpt, Florida State, USA
ANR Agruvasc
Post-doc 1 an disponible. Projet ANR PhenoMeNep
Cathy BENNETAU-PELISSERO, ENITA Bordeaux
Annie BERARD, CHU Bordeaux

Thank you for your attentionThank you for your attentionThank you for your attentionThank you for your attention