headquarter services in the global integration of production
TRANSCRIPT

1
Headquarter Services in the Global Integration of Production†
Marilyn Ibarra-Caton1
Raymond J. Mataloni Jr.2
December 22, 2016
† The analysis of firm level data on the operations of U.S. multinational enterprises was conducted under
arrangements that maintained legal confidentiality requirements. 1 Former research economist at U.S. Bureau of Economic Analysis, 4600 Silver Hill Road, Washington, DC 20233
2 Corresponding author: U.S. Bureau of Economic Analysis, 4600 Silver Hill Road, Washington, DC 20233,

2
Abstract
This study examines knowledge management within multinational enterprises (MNEs) by
analyzing whether greater interdependence of production between U.S. parent firms and their
foreign subsidiaries increases the provision of headquarter (HQ) services from the home country.
The findings suggest that U.S. parents provide more assistance to their foreign subsidiaries that
are linked in a global value chain than to those that are not involved in production sharing. This
study builds on the earlier studies of the relationship between intra-MNE product flows and
knowledge flows in multiple ways. First, it separately examines the relationship for high-tech
and low-tech manufacturing industries, and finds that knowledge services from HQ that could be
combined with knowledge of the subsidiary, such as R&D services, are primarily associated with
production sharing with subsidiaries in high-tech manufacturing industries, which are assumed to
be more technologically capable. Likewise, it finds that knowledge services from HQ that might
be considered to be more passively received from the parent, such as industrial-type maintenance
and design, are primarily associated with subsidiaries in low-tech manufacturing industries,
which are assumed to be less technologically capable. Second, this study is the first one, to our
knowledge, that gauges intra-firm knowledge flows using dollar-denominated measures of HQ
services provided by parents to their subsidiaries.
Keywords: headquarters, international trade, global value chain, knowledge, services

3
1. Introduction
The role of multinational enterprises (MNEs) in the U.S. economy has grown over the
last four decades. The MNE share of U.S. receipts from foreign persons, representing intra-
MNE exports and profits earned on sales abroad by U.S. MNEs, has grown from 30 percent in
1982 to 36 percent in 2014, and the MNE share of U.S. payments to foreign persons has grown
from 27 percent to 32 percent (chart 1). The rising importance of MNEs in U.S. international
transactions partly reflects the rising complexity of these transactions, such as the rise of global
value chains (GVCs) and corporate inversions. These new models of production and ownership
present new opportunities for globally-engaged firms to create value by tailoring their activities
and corporate structure to the local economic endowments and institutional settings, but
maintaining MNE ownership in these contexts can be critical. In the case of GVCs, organizing
production within the firm can overcome the risks, such as conflicting goals and added
transactions costs, that can be associated with a value chain comprised of unaffiliated firms. In
the case of corporate inversions, ownership is essential to realizing the associated tax advantages.
The rising scope and complexity of MNE operations can also create opportunities for the
headquarters of the MNE to add value to the firm by leveraging the economic endowments of the
headquarters (HQ) location. In the case of U.S. MNEs, the HQ is often situated in a location that
is conducive to skill-intensive activities, such as a cluster of innovation, and/or a labor market
abundant in highly-skilled workers. This study explores the connection between the provision of
skill intensive HQ services by the U.S. parent company to its foreign subsidiaries and whether or
not the parent and the subsidiary are linked in a GVC. The findings suggest that GVC linkages
create demand by the foreign subsidiaries for skill-intensive HQ services from the parent, but

4
that the specific type of service demanded is related to the role of the foreign subsidiary in the
GVC.
According to Craig and Mudambi (2013), a GVC exists when the various stages of a
firm’s production process are “disaggregated and dispersed across national borders” so that each
activity occurs in “the most efficient global location.” In some cases, these production
efficiencies take advantage of stark differences in economic endowments in two countries such
as when a good is designed in the United States to take advantage of the relative abundance of
skilled labor, and then assembled in a less developed foreign country to take advantage of the
relative abundance of manual labor. In other cases, these production efficiencies take advantage
of subtle differences in economic endowments in two countries, such as when the creativity and
talent of engineers at foreign subsidiaries is combined with those of engineers at the HQ design
lab to jointly design a new product. These examples also illustrate how intra-MNE knowledge
flows can differ in complexity. The first example is a discrete vertical flow of knowledge from
the parent to the subsidiary whereas the second example is a horizontal flow of knowledge
between the parent and the subsidiary. Craig and Mudambi note that management of the GVC
must be concerned with both the appropriate roles of the different players (specialization) and
keeping them focused on a shared purpose (orchestration).
The role of HQ in the MNE is a topic in need of further study, particularly with the rise of
GVCs over the last several decades. Parmigiani and Holloway (2011, p. 457) note that “the
impact of corporate parents has been understudied.” The topic is particularly underexplored with
respect to MNEs. Menz et al. (2015) note that much of the HQ research that has been done tends
to treat the operations of the parent firm and foreign subsidiaries as ‘independent nodes’
ignoring, in particular, ‘bi-directional relationships,’ such as shared production and shared
5
product design. Shared production is particularly relevant in the context of GVCs, where we
might expect to see high levels of intrafirm product flows representing intermediate goods going
from the parent to its foreign subsidiaries and finished goods returning to parent. Along with
these product flows, we might expect to see intrafirm knowledge flows, such as intellectual
property, as parents either provide or collaborate on new product designs. Despite the rise of
GVCs, there are only a small number of empirical studies of the relationship between product
flows and knowledge flows within MNEs (Gupta & Govindarajan (2000), Harving and
Noorderhaven (2006), and Berry (2014)).
Like those empirical studies, we find that manufacturing subsidiaries that are engaged in
production sharing with their parent tend to rely more on HQ services from the parent than those
that are not. We also build on the existing literature by separately examining the relationship for
high-tech and low-tech manufacturing industries, and we find that services that could suggest
more participation with the parent, such as R&D services, are primarily associated with
production sharing with technologically capable subsidiaries, represented by high-tech
manufacturing industries. Likewise, we find that the services that might be considered to be
more passively received, such as industrial-type maintenance and design, are primarily
associated with less technologically capable subsidiaries, represented by low-tech manufacturing
industries. In addition to contributing to this under researched aspect of MNE activity, this study
may be among the first to measure intra-firm knowledge flows using dollar-denominated
measures of HQ services provided by parents to their subsidiaries.
2. Related Literature and Hypotheses

6
This study is focused on the comparative advantage, or specialization, aspect of parent
transfers of knowledge to subsidiaries, but others have examined the orchestration role of parents
in the internal distribution of knowledge within the MNE. Foss (1997) recognizes the role of the
parent in managing the flow of shared knowledge within the organization to exploit the strategic
flexibility that comes from the ability to collaborate outside of the structure of formal contracts.
The law of comparative advantage suggests that the various units of the organization in different
geographic locations will perform certain tasks and solve certain problems more efficiently than
other units. Foss argues that the parent can add value by ‘building, maintaining, and leveraging’
those capabilities. Moreover, he argues that many of these intrafirm transfers of knowledge
would be difficult or impossible to contract between independent firms so that the ability to
transfer knowledge informally gives HQ-managed multi-unit organizations a strategic flexibility
that confers on them a competitive edge over single unit organizations. Poppo (2003) and
Sengul and Gimeno (2013) apply this logic to the generation of knowledge within the
corporation, arguing that the occasional lack of shared purpose for subsidiaries creates an
opportunity for the parent to add value by centralizing the allocation of knowledge at HQ.
Dellestrand and Kappen (2012) observe that the parent, by virtue of its global view of the firm,
can facilitate knowledge transfers between subsidiaries that otherwise might not have occurred
because of the geographic, cultural, linguistic, or institutional distance between them.
Many studies of the transfer of knowledge within MNEs emphasize the risks associated
with these transactions. Ciabuschi, Forsgren, and Martin (2011) observe that there are strong
tendencies, from a bounded rationality perspective, that can prevent a parent firm from providing
its subsidiaries with the right knowledge at the right time. Makino, Isobe, and Chan (2004)
suggest that attributes of a subsidiary’s host country, such as its natural comparative advantage,

7
the competitive advantages of its firms, or its institutions can contribute to the success or failure
of knowledge transfer from parent to subsidiary.
Other studies have examined internal and external factors that can affect the ability of HQ
to add value to the organization. Goold et al. (1994) argue that HQ managers have an
information disadvantage relative to local managers that comes from being less close to the day-
to-day operations and from having to split their attention across the various units of the
organization. Under these circumstances, they argue, HQ managers run the risk of destroying,
rather than creating, value for the organization by essentially ‘flying blind.’ The authors offer
several conditions under which HQ managers can add value, including possessing unique skills,
management processes, or other abilities. A second factor that can detract from the ability of HQ
managers to add value is favoritism, in which senior managers allocate resources to units based
on social connections with local managers rather than based on need, which Duchin and Sosyura
(2013) find to occur with corporate financing. Nell and Ambos (2013) identify a third factor that
can detract from the ability of HQ managers to add value, which is a lack of embeddedness, or
overlapping relationships with the local suppliers and customers of the local unit, that limits their
ability to detect or to realize profitable opportunities.
The need for HQ support of subsidiary operations may be especially great for GVCs
because of the increased internal and external complexity of the firm’s operating environment.
When organizing its production within a GVC, the firm must allocate the various stages of the
production process (e.g. design, assembly, and marketing) both geographically and across
internal and external providers. Mudambi (2008) maintains that firms engaged in GVCs should
internalize parts of the production and distribution processes that create and appropriate the most
value, but outsource everything else. Antras and Chor (2013) add another consideration, which

8
is the upstreamness or downstreamness of the production process, noting the risks of outsourcing
can be greater for an upstream process than for a downstream process because of the potential for
opportunistic behavior by suppliers is greater. Ciabuschi, Dellestrand, and Holm (2012) note that
optimizing along those many dimensions and ensuring that the pieces of the production process
fit together smoothly is not an easy task and suggests a need for more active management from
HQ.
The role of HQ within GVCs will tend to reflect the comparative advantages arising from
resources in the home country. According to Galbraith (1990), part of the operation of GVCs
involves the transfer of ‘technological bundles’ between facilities, particularly for high-
technology manufacturing operations. Those technological bundles, according to Kummerle
(1999), tend to be created through R&D conducted at HQ, in part, because MNEs in knowledge-
intensive industries often establish their HQs in geographic clusters of innovation specific to
their industries. This tendency is consistent with Mudambi (2008) and Collis et al. (2007) who
find that strategy of the firm determines the proper roles of HQ, which can include value-creating
functions related to the development, allocation, and deployment of proprietary assets, including
intellectual property. These findings suggest a larger role for HQ of MNEs engaged in GVCs
because of the comparative advantage of parents in producing knowledge assets and because of
the additional administrative burden of orchestrating knowledge and product flows within a
GVC.
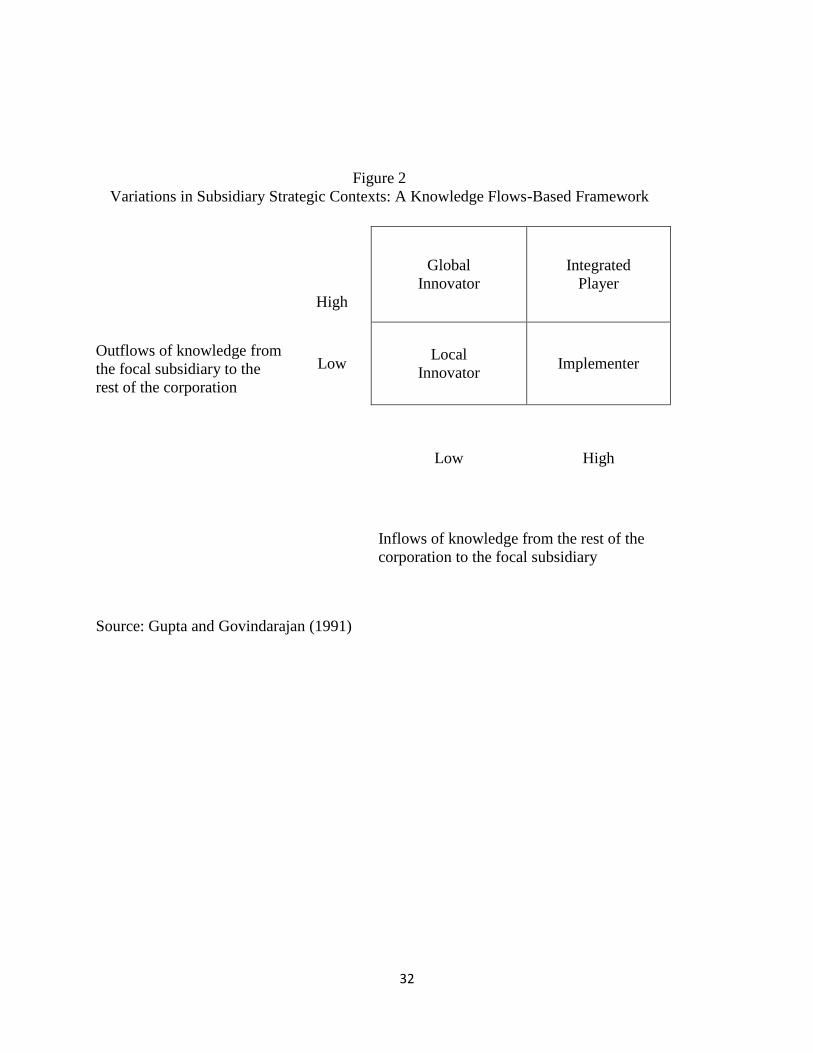
The combination of product flows and knowledge flows within the GVC can be
described within the theoretical framework of Gupta and Govindarajan (1991). The authors
classify intra-MNE transactions in knowledge and capital in two dimensions: the magnitude of
the transactions, which is measured by the volume of intra-firm transactions; and the direction of
9
the transactions, which is measured by whether the subsidiary is the sender or receiver. As
shown in figure 2, based on these criteria, they define four subsidiary roles: the global innovator,
the integrated player, the implementer, and the local innovator. In this framework: two types of
subsidiaries receive a high volume of knowledge inflows from the rest of the organization:
integrated players and implementers. The key difference between these two categories is that
integrated players both send knowledge to, and receive knowledge from, the rest of the
organization whereas implementers passively receive knowledge from the rest of the
organization.
In a subsequent study (Gupta and Govindarajan (2000)), the authors empirically test the
determinants of the direction and magnitude of knowledge flows in MNEs and find that the
knowledge flows from a parent to a subsidiary are a positive function of six measures: (1) the
formal mechanisms for knowledge sharing (e.g. liaison personnel, task forces, and permanent
committees), (2) the networking that occurs when presidents of subsidiaries are involved in
vertical socialization mechanisms with the HQ, (3) whether the subsidiary manager’s bonuses
are determined solely by performance of the subsidiary, (4) a lower level of economic
development in the host country than that of the parent country, (5) a relatively low level of
autonomy of the subsidiaries, (6) the subsidiary being established as a greenfield operation rather
than an acquisition.
Another empirical test and extension of the Gupta and Govindarajan typology of
subsidiary roles is presented in Harzing and Noorderhaven (2006), who find that different
subsidiary roles are associated with different control mechanisms and product flows. For
integrated player and implementer subsidiaries, the authors expect and find that higher
knowledge inflows from the HQ are associated with higher levels of internal product inflows.

10
This pattern is expected, for example, because the HQ may be specialized in knowledge
intensive activities, such as design, whereas the subsidiary is specialized in labor intensive
activities, such as assembly. The authors find empirical support for this hypothesis. They posit
an opposite pattern for product outflows from subsidiaries to HQ on the assumption that a large
portion of product outflows would go to external customers. Nevertheless, they do not find
empirical support for this hypothesis.
Berry (2014) explores the connection between intrafirm product flows and knowledge
flows by focusing on the determinants of innovations within U.S. MNEs. By combining data on
patents jointly issued by parents and subsidiaries with data on production sharing within U.S.
MNEs, she finds a positive correlation between those two activities, which she ascribes to the
strong relationships that are formed when parents and subsidiaries engage in joint production.
The specialization aspect of the parent’s role in a GVC suggests that the relationship
between knowledge flows and product flows within GVCs are related to the comparative
advantages of the parents and subsidiaries. One of the defining features of GVCs is the
exchange of intermediate and finished goods between parents and subsidiaries. Because of the
functional specialization that occurs within GVCs, and because of the relative abundance of
skilled labor in the United States, we expect parents to specialize in knowledge-intensive
activities that are complementary to those of their subsidiaries. This general tendency, along
with the tendency for parents to be located in clusters of innovation, leads us to expect that
parents will specialize primarily in functions related to intellectual-property, such as research and
development (R&D). Combining the goal of specialization within GVCs with the goal of
orchestration of appropriate roles, outlined by Gupta and Govindarajan (1991)’s typology, one
might characterize implementer subsidiaries in GVCs as those that receive intermediate inputs

11
from their parents that are used along with product designs and other knowledge from the parent
to produce semi-finished or finished goods that are shipped back to the parent. One might
characterize integrated player subsidiaries as those that receive intermediate inputs from their
parents that are used along with a combination of innovative ideas from HQ and from the
subsidiary itself to produce semi-finished or finished goods that are shipped back to the parent.
Therefore we posit:
Hypothesis 1. Manufacturing subsidiaries that are engaged in production sharing with their
parents will receive more HQ services than other subsidiaries.
Hypothesis 2: The HQ services provided by parents to subsidiaries engaged with them in
production sharing will be concentrated in intellectual-property-related functions.
3. Empirical Framework
The unit of analysis is the U.S. parent firm i which may transfer its HQ services flows to its
foreign subsidiaries located in host country j in year t. The basic empirical model of HQ services
flows is:
HQShareijt = α0 + αn+ αt + B1ProductionSharingijt+ B2Xjt + B3Employmentijt +
B4Wageijt + B5Age ijt + B6R&D Expenditureijt + B7AffiliatedRoyaltyPaymentsijt +
B8AffiliatedRoyaltyReciptsijt + B9AffiliatedSalesijt + B10Multiijt + B11ParentSalesit
+ B12RegionalHQijt + εijt
where the dependent variable HQShareijt is a measure of the subsidiary’s reliance on the HQ
services flows from the parent i measured as the ratio of the parents’ HQ services to the total
sales of the foreign subsidiary in country j at time t. The independent variable Production
Sharingijt is meant to capture the two-way trade that often occurs in GVCs and is calculated as the sum
of U.S. exports of goods shipped by parents to subsidiaries and U.S. imports of goods shipped by
subsidiaries to parents expressed as a share of total subsidiary sales.
12
The control variables include Xjt , which is a vector of four host country characteristics,
some of which can vary over time. These include three gravity-model type variables: the level of
gross domestic product (GDP) in the host economy and measures of the geographic and
linguistic distance between the home country and the foreign host country. Geographic distance
is measured as the distance between New York City, the most populous city in the United States
and the most populous city in the foreign host country. Giroud (2013) finds that distance from
HQ inhibits investment by the multi-unit U.S. firms in their domestic plants, in part, because
distance limits the amount of face-to-face interaction between parents and subsidiaries.
Linguistic distance is measured by a dummy variable that equals one if the country’s official
language is English. The last host country control variable is a dummy variable that indicates
whether or not the host country is a tax haven.3 The inclusion of this variable is intended as a
robustness check on the reliability of the geographic allocation of the dependent variable data
and is not intended to control for the local institutional environment faced by subsidiaries.
The remaining independent variables are control variables that are meant to capture
aspects of the MNE operations that could affect HQ service flows from the parent.
Employmentijt is the total employment by the firm’s foreign subsidiaries in the host country, and
is included because one might expect larger subsidiaries to receive more HQ services. Wageijt is
the average wage paid to workers in a firm’s foreign subsidiaries in the host country. This
variable is a proxy for the average level of worker skill at the subsidiary, but the direction of its
impact is theoretically ambiguous. On the one hand, a lower level of worker skill would suggest
3 This study uses Hines and Rice (1990) to identify the following countries as tax havens: Andorra, Anguilla,
Antigua and Barbuda, Aruba, Bahamas, Bahrain, Barbados, Belize, Bermuda, British Virgin Islands, Cook Islands,
Cyprus, Dominica, Gibraltar, Grenada, Hong Kong, Ireland, Jordan, Lebanon, Liberia, Liechtenstein, Luxembourg,
Macao, Maldives, Malta, Mauritius, Monaco, Montserrat, Nauru, Netherlands Antilles, Panama, Saint Kitts and
Nevis, Saint Lucia, Saint Vincent and the Grenadines, San Marino, Seychelles, Singapore, Switzerland, Tonga,
Turks and Caicos Islands, and Vanuatu.

13
a need to rely on the HQ for knowledge-intensive tasks. On the other hand, a higher of level of
worker skill increases the subsidiary’s ability to absorb knowledge provided by the HQ. Age ijt
measures the age of the foreign subsidiary by the number of years that it has been in the Bureau
of Economic Analysis (BEA) dataset from 1983 to 2014. Nell and Ambos (2013) find that
younger subsidiaries tend to profit more from HQ support than older subsidiaries, which they
interpret as subsidiaries going through a temporary period of heavy dependence on HQ. R&D
Expenditureijt is the R&D intensity of the foreign subsidiaries, measured by the ratio of the
subsidiaries’ R&D expenditure to their total sales, which serves as a measure of the
technological capability of subsidiaries. Multiijt is a dummy variable that is one if the firm has
multiple foreign subsidiaries in the host country, which is included to determine if the empirical
results are affected by the practical necessity to aggregate all foreign subsidiaries of a firm in a
single host country.
The next three independent variables measure the subsidiaries’ interaction with other
subsidiaries of the parent and thus pertain to the Gupta and Govindarajan (1991) typology.
AffiliatedRoyaltyPaymentsijt gauges the propensity of the foreign subsidiaries to receive
knowledge from other subsidiaries and is measured the ratio of subsidiary royalty payments to
other subsidiaries to total sales by the paying subsidiaries. AffiliatedRoyaltyReceiptsijt gauges the
propensity of the foreign subsidiaries to provide knowledge to other subsidiaries and is measured
the ratio of subsidiary royalty receipts to other subsidiaries to total sales by the receiving
subsidiaries. Both of these royalty-related variables are available for only two years of the study
period (2009 and 2014) because this item is collected only on BEA quinquennial benchmark
surveys of U.S. direct investment abroad. To preserve the panel nature of the dataset, the 2009
14
values are extended backwards to 2006 and interpolated forward to 2014. AffiliatedSalesijt
gauges the propensity of the foreign subsidiaries to sell their output to other subsidiaries.
The control variable ParentSalesit measures sales by the parent company and serves as a
proxy for the size of the parent and therefore for the size of its resource endowment that the
parent can share with its subsidiaries. The control variable RegionalHQijt is a dummy variable
indicating whether the MNE maintains a regional headquarters in the geographic region of the
reference subsidiary. It is assumed that resources from regional HQ might substitute for
resources from the parent. Unfortunately the data supporting the study provide very few details
on these flows, lacking, for example, information on the recipient of the flows, and therefore this
control is limited to a dummy variable.
The data supporting the dependent variable allow for a more granular examination of
knowledge flows between HQ and subsidiaries than most prior studies. Gupta and Govindarajan
(2000) based their analysis on seven categories of knowledge flows: 1) marketing know-how, 2)
distribution know-how, 3) packaging design/technology, 4) product designs, 5) process designs,
6) purchasing know-how, and 7) management systems and practices. Harzing and Noorderhaven
(2006) based their analysis on four of these seven categories of knowledge flows. The data
supporting this study cover twelve categories of HQ services: accounting, advertising, computer
and data processing; database and other information; industrial engineering; education and
testing, engineering; rights related to industrial processes (industrial processes); legal;
maintenance; management; and R&D. Also, unlike most other studies, which require survey
respondents to subjectively rank the intensity of knowledge flows from HQ using a Likert scale,
the data supporting this study measure HQ service charges paid by subsidiaries to their parents
that are denominated in U.S. dollars.

15
The empirical framework also accounts for unobserved heterogeneity that can
simultaneously affect the dependent and independent variables by including four digit NAICS
industry of parent (αn) and year (αt) fixed effects and by clustering standard errors by firm.
4. Data
The empirical analysis is based on firm-level data from the BE-120 Benchmark and BE-
125 Quarterly Survey of Transactions in Selected Services and Intellectual Property with Foreign
Persons and the BE-10 Benchmark and BE-11 Annual Surveys of U.S. Direct Investment
Abroad collected by the BEA.4 Data from the BE-125 survey on sales of HQ services by parent
to subsidiaries are used to measure the parents’ provision of HQ services to their subsidiaries.
The BE-10/11 survey data on sales of goods by subsidiaries by destination are used to measure
production sharing. The ability to conduct research using linked records from these two surveys
was facilitated by the creation of a bridge between the company identification numbers created
by Barefoot and Koncz-Bruner (2012). To support this study, the BE-125 survey data from
2006-2014 provide data for U.S. intrafirm exports of twelve broad service types: accounting,
advertising, computer and data processing, database and other information, industrial
engineering, education and testing, engineering, rights related to industrial processes, legal
services, maintenance, management, and R&D. These types of services share the common
characteristics that they are high value business activities with large investments in human
capital and significant strategic potential (Mudambi and Venzin 2010).
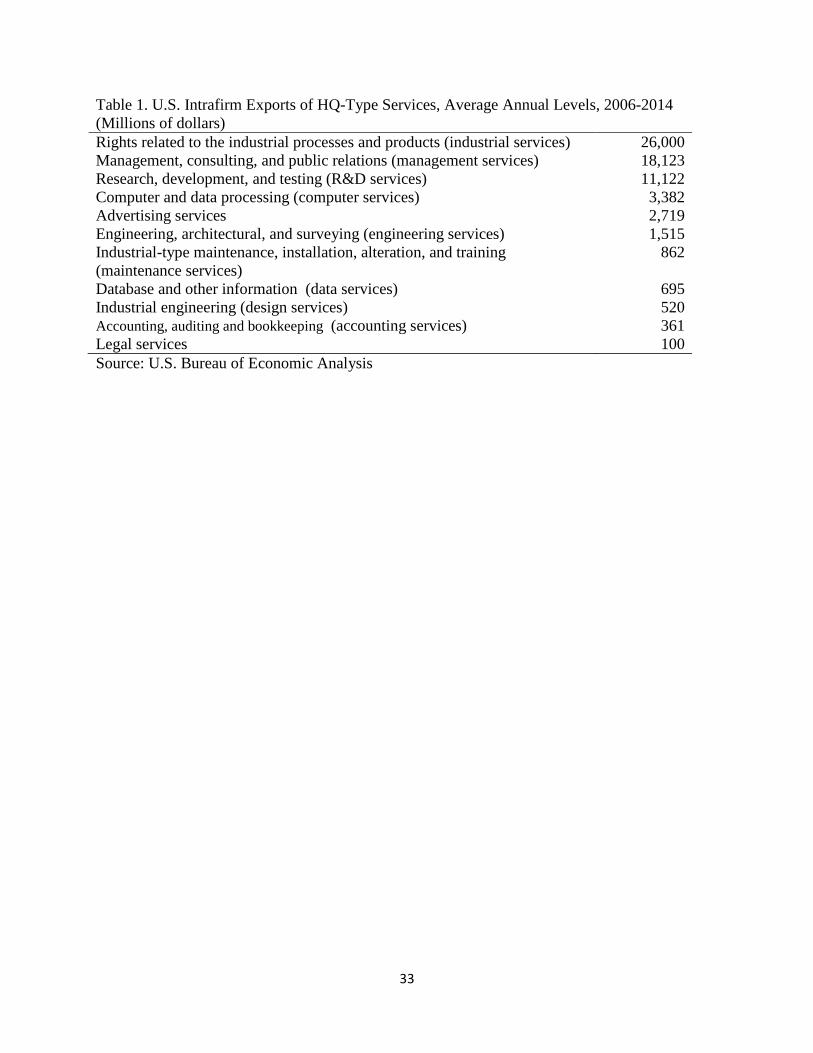
Table 1 presents a summary of the intrafirm U.S. exports of these individual services over
the study period, 2006-2014. The top three types of HQ services exported in those years were
4 To assist in the construction of the U.S. international transactions accounts, the BE-10/BE-11 data are collected
based on the geographic residence, rather than the geographic ownership, of the parent company. Therefore, its
coverage includes parents that are, in turn, foreign-owned. A common example would be a foreign-owned U.S. auto
producer that owns subsidiaries in Canada and Mexico as part of their North American value chain. U.S. MNEs that
are ultimately foreign-owned have been excluded from this study to allow for a consistent definition of HQ.

16
rights related to industrial processes and products (hereafter, industrial services), management,
consulting, and public relations services (management services), and research, development, and
testing services (R&D services). These three service types together accounted for over 80
percent, on average, of U.S. exports of HQ-type services in 2006-2014. The remaining HQ
services types are maintenance, installation, alteration, and training services (maintenance
services), engineering, architectural, and surveying services (engineering services), computer and
data processing services (computer services), legal services, advertising services, database and
other information services (data services), industrial engineering services (design services),
education and training services (education services), and accounting, auditing and bookkeeping
services (accounting services).
Table 2 provides a description of all the variables used in the models. Gross domestic
product (GDP) data come from the World Bank's World Development Indicator series. Data on
geographic distance and linguistic distance are from CEPII.5 The tax haven dummy variable is
based on Hines and Rice (1990). The regional HQ dummy variable is based on a variety of
sources. The preferred information source is the parent firm’s 10-K filing to the U.S. Securities
and Exchange Commission. In the case of private companies, and companies that do not
disclose information on their regional HQ in their 10-K reports, Web searches were used to
obtain the information.6 All other data are from the BEA.
While the data sources for the independent variables are widely used in the literature, the
data for the dependent variable is not. These statistics are reported to BEA on the BE-120
5 Data from the Centre for Prospective Studies and International Information are available on the CEPII web page at
http://www.cepii.fr/CEPII/en/bdd_modele/presentation.asp?id=19.
6 The Web searches involved searching for the combination of the firm name and the words “European
headquarters” and “Asian headquarters.” These two regions account for the overwhelming majority of regional HQ
locations, based on the information that was found in corporate 10-K reports.

17
benchmark and BE-125 quarterly Surveys of Transactions in Selected Services and Intellectual
Property with Foreign Persons. Responses to these surveys by U.S. firms importing or exporting
services are mandatory under the International Investment and Trade in Services Survey Act,
which was originally passed in 1976 and then expanded to cover trade in services in 1984.7
Benchmark surveys are conducted every five years. They have lower reporting thresholds than
the sample surveys and usually are more detailed in terms of the items covered. For periods not
covered by a benchmark survey, estimates for data reported only on the benchmark survey are
derived by extrapolating forward the data reported on the benchmark survey based on growth in
the data reported on the sample surveys. In accordance with international standards for balance
of payments accounting, the service transactions are recorded against the immediate foreign
counterparty which, in the case of a foreign subsidiary, would be the first foreign subsidiary to
make payment for services it receives from its parent (U.S. export) or receive payment for
services it provides to its parent (U.S. import). In cases of foreign subsidiaries that are indirectly
owned by other foreign subsidiaries, therefore, any indirect payments for HQ services that are
made through foreign subsidiaries in other countries will be misattributed for the purposes of this
study. A tax haven dummy variable is included in the regression analysis to control for the
possibility that MNEs may have an incentive to pass payments through subsidiaries in those
countries.
Some of the BEA survey records were averaged or excluded from the analysis for
conceptual or practical reasons. The data sample was restricted to MNEs classified in
manufacturing because the study is concerned with the relationship between product flows and
knowledge flows. The combination of the direct investment and trade in services surveys
7 A brief history and overview of BEA’s trade in services statistics program is available in the appendix to Whichard
and Borga (2002). Battaglia and Sondheimer (2013) provide an update to the overview.

18
resulted in the loss of within-host-country industry detail for subsidiaries. The BEA data on
direct investment are reported at the firm-country-industry level, whereas the BEA data on trade
in services are reported at only the firm-country-level. Therefore, the direct investment records
were collapsed to the firm-country-year level to facilitate linking with the trade data. To help
ensure the relevance of the results, data items that were estimated by BEA rather than reported
by the survey respondents themselves were excluded from the analysis. Likewise because firm
sales can sometimes take unusually low values that are not indicative of normal operations, for
example, during start-up periods, the upper tails of the sales-denominated variables were
winsorized at the 99.8 percent level.
5. Empirical Results
This section examines the relationship between a subsidiary’s engagement in production
sharing with its parent and its provision of HQ services. The results are presented in two parts.
Section 5.1 estimates the empirical model for all HQ services combined without distinguishing
by the type of HQ service. Section 5.2 granulates the results by ten of the twelve types of HQ
services. The equations are estimated on a balanced panel of manufacturing subsidiaries using a
Tobit model, which accounts for the censored nature of HQ services data in that many
subsidiaries receive no HQ services directly from their parents.
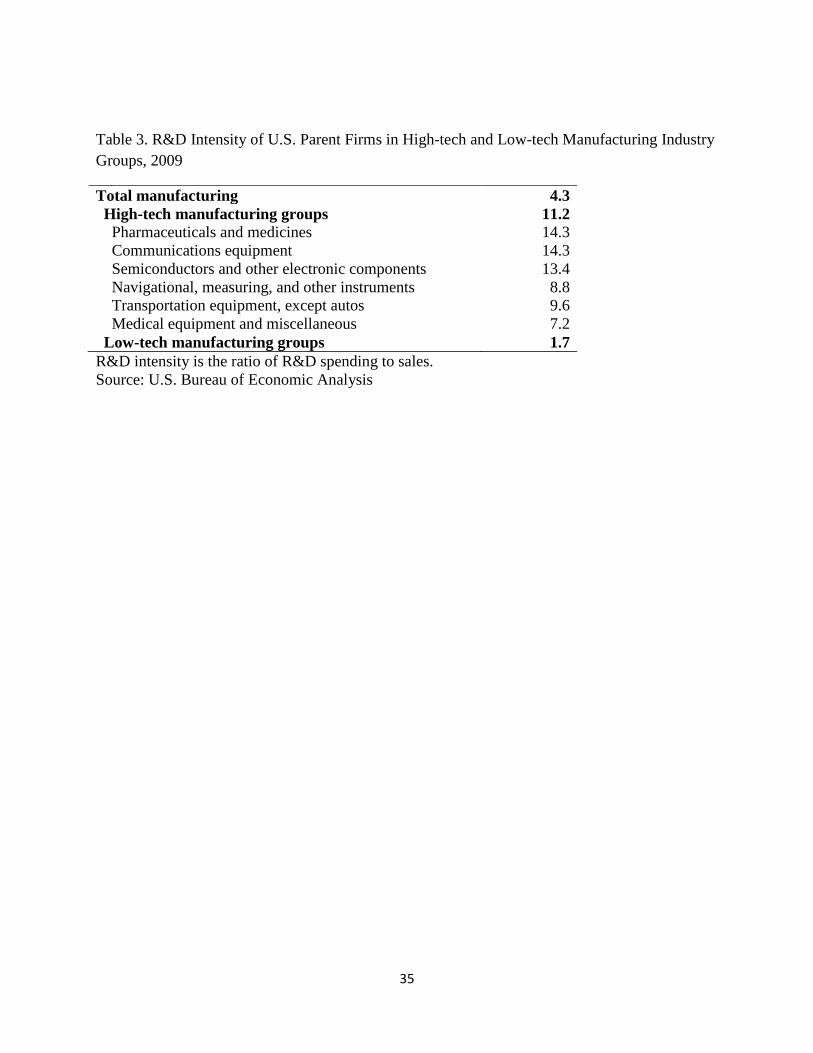
The empirical results are also split along the lines of high-tech and low-tech industry
groups. This distinction is based on the R&D-intensity of parent firms, as measured by R&D
expenditures to sales. As shown in table 3, the R&D intensity of parent firms in high-tech
industry groups (11.2 percent) is over six times greater than that of parent firms in low-tech
industry groups (1.7 percent). The high-tech/low-tech split allows us to explore heterogeneity in
the results by industry and is an appropriate dimension on which to split the sample given this
19
study’s emphasis on knowledge flows. The nature of the industry is intended to serve as a proxy
for the level of technical ability of the subsidiary and to imply something about its position in the
Gupta and Govindarajan typology.
5.1 Aggregate Results
Table 4 shows the empirical results in which the dependent variable HQShare covers all
types of HQ services. Consistent with hypothesis 1, subsidiaries that are engaged in production
sharing with their parent tend to receive more HQ services than those that are not. The
coefficient estimates suggest that a one-percentage-point increase in production sharing would be
associated with a 0.17 percentage-point increase in HQ services for all subsidiaries combined.
The result is much stronger for subsidiaries in high-tech manufacturing industries (0.33 percent)
than for subsidiaries in low-tech manufacturing industries (0.06 percent).
The greater impact on subsidiaries in high-tech industries may reflect several factors.
First, these industries offer more of an opportunity for production sharing of the integrated player
type identified in Berry (2014), in which parents and subsidiaries engage in joint product
development and integrated manufacturing. Second, subsidiaries in high-tech industries may
have a greater absorptive capacity than subsidiaries in low-tech industries, which is consistent
with the positive coefficients on subsidiary Wage and subsidiary R&D Expenditure. Finally, the
group of high-tech industries contains many industries in which production is technologically
and geographically separable (Jones and Kierzkowski (2001)).
Another interesting result is the positive coefficient on AffiliatedRoyaltyPayments, which
suggests that subsidiaries engaged in production sharing tend to obtain knowledge from other
subsidiaries within the MNE as well as from the parent.
5.2 Results by Type of Headquarter Service
20
Empirical results by high-tech and low-tech manufacturing industry groups could be
obtained only for the top three types of HQ services: Rights related to industrial processes and
products; management, consulting, and public relations; and research, development and testing
services. For the other nine HQ service types, results could be obtained only for subsidiaries in
all manufacturing industries combined for seven service types, and no results could be obtained
for two service types, because of the relatively small number of data observations on the
dependent variable.
The results for industrial processes and products shown in table 5 suggest that a one-
percentage-point increase in production sharing would be associated with a 0.07 percentage-
point increase in this type of HQ services for all subsidiaries combined, and a 0.06 percentage-
point increase for subsidiaries in low-tech manufacturing. No significant effect is detected for
subsidiaries in high-tech manufacturing. This pattern may reflect the types of services covered
by this category8, which could be associated with off-the-shelf technologies that implementer-
type subsidiaries passively adopt. The insignificant coefficient on R&D expenditure is
consistent with the expectation that integrated player subsidiaries would not receive a large
volume of this type of HQ service.
The results for management, consulting, and public relations services shown in table 6
are statistically significant for all subsidiaries combined, and for subsidiaries in hi-tech and low-
tech manufacturing, but the economic significance of these coefficients is lower than that of
other HQ service types. The services covered by this category are intended to cover charges for
overall overhead and stewardship by HQ, although respondents to the BEA surveys are
instructed to use the more specific categories whenever possible. There is also an incentive for
8 License fees, royalties, and other fees received or paid for the use, sale, or purchase of intellectual property,
including patents, trade secrets, and other proprietary rights, that are used in connection with, or related to, the
production of goods, and “maintenance” fees paid to foreign governments for the continuation of patent rights
21
firms to assign specific services to HQ service charges because general overhead charges tend to
attract the attention of tax authorities (Plesner Rossing and Rhode (2010)). This incentive might
be particularly large with respect to subsidiaries engaged in production sharing with their parents
because those relationships might receive additional scrutiny from tax authorities.
The results for research, development, and testing services shown in table 7 suggest that a
one-percentage-point increase in production sharing would be associated with a 0.06 percentage-
point increase in this type of HQ services for all subsidiaries combined, a 0.13 percentage-point
increase for subsidiaries in high-tech manufacturing, and a 0.02 percentage-point increase for
subsidiaries in low-tech manufacturing. The much stronger result for high-tech manufacturing
would be consistent with subsidiaries in this industry group being comprised of both integrated
players, which is suggested by the large and significant coefficients on Wage, R&D Expenditure,
and AffiliatedRoyaltyReceipts, and implementers, which is suggested by the large and significant
coefficient on AffiliatedRoyaltyPayments.
The results for seven of the remaining nine HQ service types are shown in table 8. These
results are not disaggregated by high-tech and low-tech industries because the Tobit model failed
to converge for one or both of these groups, most likely because of the small number of
uncensored observations. Results for two of the nine service types, design services and
maintenance are statistically and economically significant and are consistent with hypothesis 1.
Design services include ‘engineering services related to the design of movable products,
including product design services.’ Consistent with this definition, it appears that less
technically capable subsidiaries, possibly implementer subsidiaries, tend to receive this type of
HQ service, as evidenced by the insignificance of the coefficients on Wage, R&D Expenditure
and AffiliatedRoyaltyReceipts. Maintenance services include ‘maintenance services primarily to

22
machinery and equipment’ and ‘installation and training services include only installation,
startup, and training services provided by a manufacturer in connection with the sale of a good.’
These types of services might also be expected to be associated with a passive receiver of
knowledge assets from the parent firm, which is consistent with the insignificance of the
coefficients on R&D Expenditure, AffiliatedRoyaltyReceipts, and Wage.
6. Discussion and conclusions
The empirical results in this study support and extend earlier empirical tests of the Gupta
and Govindarajan (1991) framework for understanding intra-MNE knowledge flows. Consistent
with Gupta and Govindarajan (2000), this study finds that HQ services provided by the parent to
its subsidiaries are positively related to production sharing, which is a formal mechanism for
knowledge sharing within the organization. Harzing and Noorderhaven (2006) find the same
positive relationship between subsidiaries knowledge inflows and product inflows from the HQ,
but they hypothesized an opposite relationship between knowledge inflows and product outflows
to HQ, which was not supported by their results. The measure of production sharing used in this
study, which covers both product inflows from the parent and product outflows to the parent,
reflects the roundtrip nature of trade in intermediate goods. Its positive significance with respect
to HQ services helps to explain Harzing and Noorderhaven’s unexpected result. Consistent with
Berry (2014), we find that production sharing is related to R&D services from the parent,
particularly for high-technology manufacturing industries.
This study builds on the earlier studies of the relationship between intra-MNE product
flows and knowledge flows in multiple ways. First, it separately examines the relationship for
high-tech and low-tech manufacturing industries, and find that knowledge services from HQ that
could be combined with knowledge of the subsidiary, such as R&D services, are primarily

23
associated with production sharing with subsidiaries in high-tech manufacturing industries,
which are presumed to be more technologically capable. Likewise, it finds that the knowledge
services from HQ that might be considered to be more passively received from the parent, such
as industrial-type maintenance and design, are primarily associated with subsidiaries in low-tech
manufacturing industries, which are presumed to be less technologically capable. Second, this
study is the first one, to our knowledge, that gauges intra-firm knowledge flows using dollar-
denominated measures of HQ services provided by parents to their subsidiaries.
The quantitative data used to measure HQ services in this study are arguably more
objective than those typically used in the literature, but they are less-than-perfect measures.
Most empirical studies of the provision of headquarters support are based on qualitative rankings
of the level of support based on a Likert scale and are usually based on a small sample of firms.
In contrast, our dollar-based HQ service charges are based on mandatory surveys conducted by
the BEA covering the universe of U.S. firms that export or import services. However, there are
at least two possible issues with the reliability of these data. The first one relates to the ability of
BEA to collect all of the relevant data. Feketekuty (1988) describes the problem this way:
Collecting information from individual producers or consumers of services is
difficult because the government first has to identify the producers of services
who might have sold services to foreigners and the consumers of services who
might have purchased services from foreigners. The government then has to
persuade all firms and individuals that buy services from foreigners or sell
services to foreigners to maintain detailed records of the transactions.
Feketekuty’s first concern is probably not very serious for this study because the data are limited
to MNEs and those firms are relatively small in number and BEA has decades of experience in
collecting mandatory survey data from them. His second concern, availability of detailed
recordkeeping, is potentially more of a concern. Another possible limitation of the BEA data,
noted in the preceding section, is that tax considerations undoubtedly affect how firms account

24
for intrafirm HQ services. The study tries to control for these effects by including a dummy
variable for tax havens. As an additional robustness check, the regressions for all manufacturing
subsidiaries combined were estimated excluding subsidiaries in tax haven countries, for total HQ
services, and for each of the twelve individual types of HQ services. Compared to the results for
the full country sample, the coefficients on the main explanatory variable of interest,
ProductionSharing for the non-tax-haven country sample are similar in magnitude and as to
whether or not they are statistically significant.
A possible concern with the research design of this study is the assumption that the U.S.
parent firm represents the primary HQ of the MNE. Baaij et al. (2015) observe an increasing
tendency among Dutch MNEs to “hollow out” the parent firm by moving core HQ functions to
more favorable geographic locations. However, the incentive for U.S. MNEs to relocate HQ
functions to other countries is probably much weaker than that for Dutch MNEs because of the
large size and wealth of the U.S. economy and because of the abundance of strategic resources,
such as world-class financial markets, skilled workers, and business services. It should also be
noted that U.S. parent firms continue to account for the great majority of the operations of U.S.
MNEs. In 2014, they accounted for more than 80 percent of worldwide R&D by U.S. MNEs,
although the share has declined by a few percentage points over the last decade.9 Baaij and
Slangen (2013) note that it is becoming increasingly common for MNEs to establish regional HQ
in addition to their HQ in the home country, in part, to overcome the liability of distance. A
regional HQ dummy variable is included in the statistical analysis to control somewhat for this
possibility.
Another possible concern with the research design of this study involves the direction of
causality. This study has framed the question as one of headquarters searching for subsidiaries
9 Based on statistics in table A1of Scott (2016)
25
that will receive HQ services. This framework is consistent with the conventional definition of a
GVC in which the parent orchestrates the production process, defining the roles of the units in
the production chain and determining which units will provide goods and services to other units.
Conversely, it may be the case that the subsidiaries themselves are searching for other units
within the MNE from which to source knowledge inputs. This direction of causality seems most
plausible for technologically capable subsidiaries that are engaging in joint product development
with other units in the MNE. This study offers no formal tests of the direction of causality, but
one fact that is consistent with its framing of the question is that R&D service imports from the
parent are only weakly correlated with royalty payments to other subsidiaries, suggesting no
strong complementary or substitutive relationship exists between those variables.10
Future related research might explore the effect of these product and knowledge linkages
on firm performance. The broad evidence suggests that production is generally evolving toward
a more globally disaggregated structure, but that does not imply that sharing knowledge and
production with foreign subsidiaries is always rational MNE behavior. Ocasio (1997) posits that
organizational resources tend to be directed to the focus of attention, which, in turn, tends to be
directed toward structural relationships, such as a product development team or a buyer-supplier
relationship. It may be that sharing knowledge with subsidiaries connected in a GVC is a wise
use of resources, as the law of comparative advantage suggests, or it may be that some of these
transfers occur for less intentional reasons.
Other areas for future research might include updating this study as data for more years
of the BEA data become available, adding additional control variables, and performing parallel
tests of the quantitative and qualitative measures of the provision of HQ services. It is
10
The correlation coefficients are 0.08 for subsidiaries in all manufacturing industries, 0.14 for subsidiaries in high-
tech manufacturing industries, and -0.01 for subsidiaries in low-tech manufacturing industries.

26
unfortunate that not every type of HQ services could be explored separately for high-tech and
low-tech manufacturing industries. The inability of the model to converge for those services is
probably related to the small number of uncensored observations. Perhaps, in the foreseeable
future, BEA will have collected enough data to support this analysis for these service types.
Another dimension worth exploring is the nature of the innovations of subsidiaries that are
engaged in collaborative product development with their parents. Knowing whether these tend
to be incremental innovations geared toward adapting products for the local market or
breakthough innovations that enhance the performance of other units in the MNE would enhance
our knowledge of where subsidiaries fit in the Gupta and Govindarajan (1991) framework.

27
Acknowledgements
We would like to thank the editors and the two anonymous referees for insightful comments and
suggestions. This study also benefitted from comments received at several conferences: Heather
Berry and other participants at a George Washington University International Business Research
Seminar, Nickolas Zolas and other participants at the Second Annual BEA-Census Research
Workshop, and Ram Mudambi and other participants at the 3rd annual International Business
and Economic Geography (iBEGIN) conference at Temple University.

28
References
Antras, P. and Chor, D. (2013). “Organizing the global value chain.” Econometrica 81(6), 2127–
2204.
Baaij, M. G., & Slangen, A. H. (2013). “The role of headquarters–subsidiary geographic distance
in strategic decisions by spatially disaggregated headquarters.” Journal of International Business
Studies, 44(9), 941-952.
Baaij, M. G., Mom, T. J., Van den Bosch, F. A., & Volberda, H. W. (2015). “Why do
multinational corporations relocate core parts of their corporate headquarters abroad?” Long
Range Planning, 48(1), 46-58.
Barefoot, K. and Koncz-Bruner, J. (2012). “A profile of U.S. exporters and importers of
services.” Survey of Current Business (June 2012): 92(6), 66-87.
Battaglia, D. and Sondheimer, J. (2013). “A guide to BEA’s services surveys.” available on the
web at: <http://www.bea.gov/surveys/pdf/surveysu.pdf>.
Berry, H. (2014). “Global integration and innovation: multicountry knowledge generation within
MNCs.” Strategic Management Journal 35: 869-890.
Ciabuschi, F., Forsgren, M., & Martín, O. M. (2011). “Rationality vs ignorance: The role of
MNE headquarters in subsidiaries’ innovation processes.” Journal of International Business
Studies, 42(7), 958-970.
Ciabuschi, F., Dellestrand, H. and Holm, U. (2012). “The role of headquarters in the
contemporary MNC.” Journal of International Management 18: 212-223.
Collis, D., Young, D., and Goold, M. (2007). “The size, structure, and performance of corporate
headquarters.” Strategic Management Journal 28, 383-405.
Craig, T. D., and Mudambi, R. (2013). “Global value chains.” iBegin White Paper. Temple
University.
Dellestrand, H., and Kappen, P. (2012). “The effects of spatial and contextual factors on
headquarters resource allocation to MNE subsidiaries.” Journal of International Business Studies
43(3): 219-243.
Duchin, R., Sosyura, D. (2013). “Divisional managers and internal capital markets." The Journal
of Finance 68(2): 387-429.
Feketekuty, G. (1988). International trade in services: an overview and blueprint for
negotiations, Cambridge, MA: Ballinger Publishing Company.

29
Foss, N. J. (1997). “On the rationales of corporate headquarters.” Industrial and Corporate
Change, 6(2), 313-338.
Giroud, X. (2013). “Proximity and investment: evidence from plant-level data.” Quarterly
Journal of Economics 128(2): 861-915.
Goold, M., Campbell, A., and Alexander, M. (1994). “How corporate parents add value to the
stand-alone performance of their businesses.” Business Strategy Review, 5(4): 33-55.
Gupta, A., and Govindarajan, V. (1991). “Knowledge flows and the structure of control within
multinational corporations.” The Academy of Management Review, 16, 768-792.
Gupta, A. and Govindarajan, V. (2000). “Knowledge flows within multinational corporations.”
Strategic Management Journal, 21: 473-496.
Harzing, A. and Noorderhaven, N. (2006). “Knowledge flows in MNCs: an empirical test and
extension of Gupta and Govindarajan’s typology of subsidiary role.” International Business
Review, 15, 195-214.
Hines, J.R. Jr., and Rice, E.R., (1990). “Fiscal paradise: foreign tax havens and American
businesses.” Quarterly Journal of Economics, 109, 149-182.
Hossiso, K. W. (2017) “An ownership-based framework of the U.S. current account, 2004-
2015,” Survey of Current Business, 97(1).
Jones, R. and Kierzkowski, H. (2001). “A framework for fragmentation.” in Fragmentation:
New Production Patterns in the World Economy Arndt. S. and Kierzkowski, H. eds. Oxford
University Press
Kummerle, W. (1999) “The drivers of foreign direct investment into research and development:
an empirical investigation.” Journal of International Business Studies, 30(1), 1-24.
Los, B. , Timmer, M. and De Vries, G. (2014). “The demand for skills, 1995-2008: a global
supply chain perspective,” OECD Economics Department Working Papers No. 1141.
Makino, S., Isobe, T., & Chan, C. M. (2004). “Does country matter?.” Strategic Management
Journal, 25(10), 1027-1043.
Menz, M., Kunisch, S., and Collis, D. (2015). “The corporate headquarters in the contemporary
corporation: advancing a multimarket firm perspective.” The Academy of Management Annals
9(1): 633-714.
Mudambi, R. (2008). “Location, control and innovation in knowledge-intensive industries.”
Journal of Economic Geography, 8, 699-725.

30
Mudambi, R. and Venzin, M. (2010). “The strategic nexus of offshoring and outsourcing
decisions.” Journal of Management Studies, 47, 1510-1533.
Nell, P. and Ambos, B. (2013). “Parenting advantage in the MNC: an embeddedness perspective
on the value added by headquarters.” Strategic Management Journal 34(9): 1086-1103.
Ocasio, W. (1997). “Towards an attention-based view of the firm.” Strategic Management
Journal, 187-206.
Parmigiani, A., and Holloway, S. (2011). “Actions speak louder than modes: antecedents and
implications of parent implementation capabilities on business unit performance.” Strategic
Management Journal 32(5): 457-485.
Plesner Rossing, C. and Rhode C. (2010). “Overhead cost allocation changes in a transfer pricing
tax compliant multinational enterprise.” Management Accounting Research 21: 199-216.
Poppo, L. (2003). “The visible hands of hierarchy within the m-form: an empirical test of
corporate parenting of internal product exchanges.” Journal of Management Studies 40(2): 403-
430.
Scott, Sarah P. (2016). “Activities of U.S. multinational enterprises in the United States and
abroad: preliminary results from the 2014 benchmark survey.” Survey of Current Business,
96(12).
Sengul, M., & Gimeno, J. (2013). “Constrained delegation limiting subsidiaries’ decision rights
and resources in firms that compete across multiple industries.” Administrative Science
Quarterly, 58(3), 420-471.
Whichard, O. and Borga, M. (2002). “Selected issues in the measurement of U.S. international
services.” Survey of Current Business, 82(6), 36-56.

31
32
Figure 2
Variations in Subsidiary Strategic Contexts: A Knowledge Flows-Based Framework
Outflows of knowledge from
the focal subsidiary to the
rest of the corporation
High
Global
Innovator
Integrated
Player
Low Local
Innovator Implementer
Low High
Inflows of knowledge from the rest of the
corporation to the focal subsidiary
Source: Gupta and Govindarajan (1991)
33
Table 1. U.S. Intrafirm Exports of HQ-Type Services, Average Annual Levels, 2006-2014
(Millions of dollars)
Rights related to the industrial processes and products (industrial services) 26,000
Management, consulting, and public relations (management services) 18,123
Research, development, and testing (R&D services) 11,122
Computer and data processing (computer services) 3,382
Advertising services 2,719
Engineering, architectural, and surveying (engineering services) 1,515
Industrial-type maintenance, installation, alteration, and training
(maintenance services)
862
Database and other information (data services) 695
Industrial engineering (design services) 520
Accounting, auditing and bookkeeping (accounting services) 361
Legal services 100
Source: U.S. Bureau of Economic Analysis

34
Table 2. Description of Variables
Variable Description Unit of measure Source
HQ Services
Accounting Accounting, auditing and bookkeeping services
Subsidiary
payments as a
share of total
subsidiary sales
(fractional
decimal)
BEA
Advertising Advertising services
Computer Computer and data processing services
Data Database and other information services
Design Industrial engineering services
Education Education and training services
Engineering Engineering, architectural, and surveying services
HQ services All headquarter services
Industrial Rights related to the industrial processes and products
Legal Legal services
Maintenance Industrial-type maintenance, installation, alteration, and
training services
Management Management, consulting, and public relations services
R&D Research, development, and testing services
Other variables
Affiliated royalty
payments
Payments for royalty and license fees to other
subsidiaries as a share of sales11
fractional decimal BEA
Affiliated royalty
receipts
Receipts of royalty and license fees from other
subsidiaries as a share of sales6 fractional decimal BEA
Affiliated sales Sales by subsidiary to other subsidiaries as a share of
sales fractional decimal BEA
Age Number of years subsidiary has been in the BEA
universe from 1983 to 2014 integer BEA
Distance Shortest distance between most populous cities of the
two countries log (kilometers) CEPII
Employment Subsidiary employment in the host country log (headcount) BEA
GDP Gross domestic product of the host country log ($ millions) World Bank
Language Dummy variable indicating that the host country’s
official language is English binary (0/1) CEPII
Multi An indicator variable that is one if the firm has multiple
foreign subsidiaries in the country binary (0/1) BEA
Parent sales Sales by the U.S. parent company Log ($ thousands) BEA
Production sharing
Ratio of subsidiary’s shipments of goods to, and
shipments of goods from, the parent to total subsidiary
sales
fractional decimal BEA
R&D expenditure Subsidiary R&D expenditures as a share of sales fractional decimal BEA
Regional HQ
Dummy variable for presence of a regional HQ binary (0/1)
SEC
or Web
search
Tax haven Dummy variable indicating that the host country is a tax
haven binary (0/1)
Hines and
Rice (1990)
Wage Average wage paid to subsidiary workers Log (annual
wage) BEA
BEA U.S. Bureau of Economic Analysis
CEPII Centre for Prospective Studies and International Information
SEC U.S. Securities and Exchange Commission
11
These variables are observed only in 2009 and 2014; the values for other years are interpolated.
35
Table 3. R&D Intensity of U.S. Parent Firms in High-tech and Low-tech Manufacturing Industry
Groups, 2009
Total manufacturing 4.3
High-tech manufacturing groups 11.2
Pharmaceuticals and medicines 14.3
Communications equipment 14.3
Semiconductors and other electronic components 13.4
Navigational, measuring, and other instruments 8.8
Transportation equipment, except autos 9.6
Medical equipment and miscellaneous 7.2
Low-tech manufacturing groups 1.7
R&D intensity is the ratio of R&D spending to sales.
Source: U.S. Bureau of Economic Analysis

36
Table 4. Tobit Panel Regression Results: Determinants of Subsidiary Purchases of all HQ
Services as a Share of Subsidiary Sales
All
manufacturing
industries
High-tech
manufacturing
industries
Low-tech
manufacturing
industries
Production sharing 0.172*** 0.333*** 0.055***
(0.056) (0.117) (0.017)
Employment 0.011* 0.037 0.003
(0.006) (0.028) (0.004)
Wage 0.005 0.124** -0.000
(0.009) (0.052) (0.006)
R&D expenditure 0.624 1.476* 0.282
(0.454) (0.755) (0.310)
Language 0.029 0.142 0.021
(0.018) (0.104) (0.014)
GDP 0.025*** 0.083* 0.018***
(0.009) (0.044) (0.005)
Tax haven 0.021 0.256** -0.001
(0.025) (0.128) (0.015)
Multi 0.026** 0.118* 0.024***
(0.012) (0.067) (0.009)
Age 0.001 -0.000 0.000
(0.002) (0.009) (0.001)
Distance 0.024** 0.005 0.017**
(0.010) (0.047) (0.007)
Affiliated royalty receipts 0.184** 0.120 0.103
(0.075) (0.115) (0.085)
Affiliated royalty payments 0.562*** 0.395* 0.679**
(0.132) (0.205) (0.288)
Affiliated sales 0.071*** 0.250** 0.033**
Parent sales
Regional HQ
(0.025)
0.052***
(0.017)
0.020
(0.023)
(0.111)
0.161***
(0.047)
0.126*
(0.076)
(0.017)
0.016*
(0.008)
-0.010
(0.014)
Observations, total 7,252 1,819 5,448
Observations, uncensored 4,313 1,120 3,119
Log likelihood -1,075 -1,453 1,053
p<0.01, *** p<0.05, ** p<0.10, *
Regressions include industry and year fixed effects.
Clustered standard errors are shown in parentheses, where clustering is by firm.

37
Table 5. Tobit Panel Regression Results: Determinants of Subsidiary Purchases of Rights
Related to Industrial Processes and Products from HQ as a Share of Subsidiary Sales
p<0.01, *** p<0.05, ** p<0.10, *
Regressions include industry and year fixed effects.
Clustered standard errors are shown in parentheses, where clustering is by firm.
All
manufacturing
industries
High-tech
manufacturing
industries
Low-tech
manufacturing
industries
Production sharing 0.074*** 0.072 0.063***
(0.025) (0.048) (0.021)
Employment 0.025*** 0.018 0.022**
(0.008) (0.020) (0.009)
Wage 0.019** 0.098* 0.011
(0.009) (0.058) (0.009)
R&D expenditure -0.203 0.445 -0.436
(0.248) (0.302) (0.452)
Language 0.030 0.118 0.017
(0.023) (0.104) (0.022)
GDP 0.031*** 0.116* 0.024***
(0.009) (0.064) (0.009)
Tax haven 0.039 0.328* -0.002
(0.025) (0.174) (0.026)
Multi 0.012 0.059 0.009
(0.013) (0.048) (0.014)
Age 0.001 -0.004 0.001
(0.002) (0.008) (0.001)
Distance 0.019 -0.003 0.021*
(0.012) (0.034) (0.012)
Affiliated royalty receipts 0.048 -0.010 -0.074
(0.062) (0.079) (0.193)
Affiliated royalty payments 0.311*** 0.254** 1.064***
(0.101) (0.125) (0.411)
Affiliated sales 0.047 0.175 0.022
Parent sales
Regional HQ
(0.030)
0.026*
(0.015)
-0.008
(0.023)
(0.124)
0.116*
(0.069)
-0.099
(0.087)
(0.024)
0.009
(0.011)
0.008
(0.023)
Observations, total 7,252 1,819 5,448
Observations, uncensored 2,495 806 1,719
Log likelihood -842 -876 -411

38
Table 6. Tobit Panel Regression Results: Determinants of Subsidiary Purchases of Management,
Consulting, and Public Relations Services from HQ as a Share of Subsidiary Sales
p<0.01, *** p<0.05, ** p<0.10, *
Regressions include industry and year fixed effects.
Clustered standard errors are shown in parentheses, where clustering is by firm.
All
manufacturing
industries
High-tech
manufacturing
industries
Low-tech
manufacturing
industries
Production sharing 0.020*** 0.044** 0.012**
(0.006) (0.018) (0.005)
Employment -0.000 0.003 -0.001
(0.001) (0.005) (0.001)
Wage 0.002 0.016 -0.002
(0.002) (0.013) (0.002)
R&D expenditure 0.125** 0.183 0.283**
(0.063) (0.150) (0.128)
Language 0.011*** 0.027 0.010**
(0.004) (0.017) (0.004)
GDP 0.003** -0.003 0.004***
(0.001) (0.008) (0.001)
Tax haven -0.001 0.008 -0.005
(0.005) (0.027) (0.004)
Multi 0.016*** 0.032** 0.013***
(0.003) (0.016) (0.003)
Age -0.000 -0.006** -0.000
(0.000) (0.002) (0.000)
Distance 0.005*** 0.010 0.003
(0.002) (0.009) (0.002)
Affiliated royalty receipts 0.037*** 0.058*** 0.033
(0.011) (0.022) (0.050)
Affiliated royalty payments 0.087** 0.016 0.015
(0.040) (0.043) (0.066)
Affiliated sales 0.016*** 0.032* 0.010**
Parent sales
Regional HQ
(0.006)
0.004
(0.003)
0.001
(0.005)
(0.018)
0.004
(0.013)
0.008
(0.027)
(0.005)
0.003
(0.003)
-0.002
(0.005)
Observations, total 7,252 1,819 5,448
Observations, uncensored 2,286 491 1,792
Log likelihood 2,155 -113 2,322

39
Table 7. Tobit Panel Regression Results: Determinants of Subsidiary Purchases of Research,
Development, and Testing Services from HQ as a Share of Subsidiary Sales
p<0.01, *** p<0.05, ** p<0.10, *
Regressions include industry and year fixed effects.
Clustered standard errors are shown in parentheses, where clustering is by firm.
All
manufacturing
industries
High-tech
manufacturing
industries
Low-tech
manufacturing
industries
Production sharing 0.064*** 0.130* 0.022***
(0.022) (0.068) (0.006)
Employment 0.004 0.043 -0.000
(0.003) (0.027) (0.002)
Wage 0.010 0.083* 0.000
(0.008) (0.048) (0.004)
R&D expenditure 0.290* 0.542* 0.260
(0.161) (0.292) (0.202)
Language 0.012 -0.009 -0.001
(0.010) (0.045) (0.005)
GDP 0.008** 0.039 0.007**
(0.004) (0.030) (0.003)
Tax haven 0.044 0.250 0.005
(0.028) (0.159) (0.010)
Multi 0.020* 0.033 0.009
(0.011) (0.044) (0.006)
Age -0.000 -0.006 -0.000
(0.001) (0.005) (0.001)
Distance 0.005 -0.069 0.006**
(0.007) (0.051) (0.003)
Affiliated royalty receipts 0.186** 0.286** 0.055
(0.090) (0.114) (0.059)
Affiliated royalty payments 0.330** 0.294* -0.089
(0.152) (0.161) (0.086)
Affiliated sales 0.047*** 0.225** 0.015*
Parent sales
Regional HQ
(0.018)
0.011
(0.009)
0.010
(0.017)
(0.104)
0.005
(0.023)
0.117***
(0.044)
(0.008)
0.003
(0.005)
-0.016**
(0.008)
Observations, total 7,252 1,819 5,448
Observations, uncensored 1,245 374 891
Log likelihood -86 -380 841

40
Table 8. Tobit Panel Regression Results: Determinants of Subsidiary Purchases of Selected HQ
Services from HQ as a Share of Subsidiary Sales, All Manufacturing Industries
Accounting
services
Advertising
services
Computer
services
Production sharing 0.004** n.a. 0.009***
(0.002) (0.003)
Employment 0.001 0.001
(0.000) (0.001)
Wage 0.002 0.001
(0.001) (0.001)
R&D expenditure -0.388** -0.062
(0.154) (0.043)
Language -0.001 0.004**
(0.001) (0.002)
GDP 0.000 0.003**
(0.000) (0.001)
Tax haven -0.003* -0.002
(0.001) (0.002)
Multi 0.005*** 0.001
(0.002) (0.002)
Age -0.000 0.000
(0.000) (0.000)
Distance 0.001 0.003**
(0.001) (0.001)
Affiliated royalty receipts 0.007 -0.011
(0.006) (0.008)
Affiliated royalty payments -0.001 0.027**
(0.011) (0.013)
Affiliated sales -0.002 0.004
Parent sales
Regional HQ
(0.001)
0.001
(0.001)
0.003
(0.003)
(0.003)
0.006***
(0.002)
-0.007**
(0.004)
Observations, total 7,252 7,252
Observations, uncensored 311 1,737
Log likelihood 616 2,915
p<0.01, *** p<0.05, ** p<0.10, *
n.a. Not available. Model did not converge.
Regressions include industry and year fixed effects.
Clustered standard errors are shown in parentheses, where clustering is by firm.
(Table continues on next page.)

41
Table 8. Tobit Panel Regression Results: Determinants of Subsidiary Purchases of Selected HQ
Services from HQ as a Share of Subsidiary Sales, All Manufacturing Industries
Data
services
Design
services
Education
services
Production sharing n.a. 0.139*** 0.001***
(0.050) (0.000)
Employment 0.005 0.000
(0.008) (0.000)
Wage 0.009 0.000***
(0.011) (0.000)
R&D expenditure 0.794 0.001
(0.489) (0.003)
Language -0.009 -0.000
(0.026) (0.000)
GDP 0.030 0.000
(0.018) (0.000)
Tax haven -0.099*** -0.000**
(0.032) (0.000)
Multi 0.040 0.000
(0.025) (0.000)
Age 0.003 0.000
(0.002) (0.000)
Distance 0.026 0.000
(0.020) (0.000)
Affiliated royalty receipts -0.040 -0.002
(0.087) (0.001)
Affiliated royalty payments 0.203* -0.000
(0.104) (0.002)
Affiliated sales -0.039 -0.000*
Parent sales
Regional HQ
(0.044)
0.087**
(0.039)
0.028
(0.047)
(0.000)
0.000***
(0.000)
0.000
(0.000)
Observations, total 7,252 7,252
Observations, uncensored 529 246
Log likelihood -356 956
p<0.01, *** p<0.05, ** p<0.10, *
n.a. Not available. Model did not converge.
Regressions include industry and year fixed effects.
Clustered standard errors are shown in parentheses, where clustering is by firm.
(Table continues on next page.)

42
Table 8. Tobit Panel Regression Results: Determinants of Subsidiary Purchases of Selected HQ
Services from HQ as a Share of Subsidiary Sales, All Manufacturing Industries
Engineering
services
Legal
services
Maintenance
services
Production sharing 0.018** 0.000*** 0.141**
(0.008) (0.000) (0.057)
Employment 0.000 0.000** 0.009
(0.002) (0.000) (0.006)
Wage 0.015*** 0.000*** 0.020
(0.002) (0.000) (0.013)
R&D expenditure -0.058 -0.014*** 0.666
(0.107) (0.005) (0.546)
Language -0.001 0.000 0.021
(0.005) (0.000) (0.024)
GDP 0.007** 0.000* 0.041**
(0.003) (0.000) (0.021)
Tax haven -0.011*** -0.000 0.019
(0.004) (0.000) (0.041)
Multi 0.007 0.000* 0.078**
(0.005) (0.000) (0.031)
Age 0.001* -0.000** -0.001
(0.001) (0.000) (0.004)
Distance 0.012*** 0.000 0.029*
(0.004) (0.000) (0.015)
Affiliated royalty receipts -0.007 -0.000 -0.030
(0.019) (0.000) (0.061)
Affiliated royalty payments 0.012 -0.001 -0.209
(0.021) (0.001) (0.134)
Affiliated sales -0.010** -0.000 -0.037
Parent sales
Regional HQ
(0.004)
0.017*
(0.009)
-0.021**
(0.008)
(0.000)
-0.000
(0.000)
0.000**
(0.000)
(0.042)
0.111***
(0.034)
-0.010
(0.042)
Observations, total 7,252 7,252 7,252
Observations, uncensored 367 171 562
Log likelihood 369 669 -373
p<0.01, *** p<0.05, ** p<0.10, *
Regressions include industry and year fixed effects.
Clustered standard errors are shown in parentheses, where clustering is by firm.