he mathematics educator - university of...
TRANSCRIPT

____ THE ____________
_____ MATHEMATICS ___
________ EDUCATOR _____ Volume 21 Number 1
Summer 2011 MATHEMATICS EDUCATION STUDENT ASSOCIATION
THE UNIVERSITY OF GEORGIA

Editorial Staff
Editors
Allyson Thrasher
Catherine Ulrich
Associate Editors
Zandra de Araujo
Amber G. Candela
Tonya DeGeorge
Erik D. Jacobson
Kevin LaForest David R. Liss, III
Laura Lowe
Patty Anne Wagner
Advisor
Dorothy Y. White
MESA Officers
2011-2012
President
Tonya DeGeorge
Vice-President
Shawn Broderick
Secretary
Jenny Johnson
Treasurer
Patty Anne Wagner
NCTM
Representative
Clayton N. Kitchings
Colloquium Chair
Ronnachai Panapoi
A Note from the Editors
Dear TME readers,
On behalf of the editorial staff and the Mathematics Education Student Association
at The University of Georgia, I am happy to share with you the first issue of the 21st
volume of The Mathematics Educator. As we embark on the second decade of TME,
this issue gives our readers both a view into some up-and-coming trends in
mathematics education and harkens back to the roots of our field. In lieu of a
traditional editorial, as our opening article, we present the first English-language
publication of an interview of George Pólya, captured by his former student Jeremy
Kilpatrick. In the interview, Kilpatrick delves into the ideas of one of our field’s early
prominent leaders, introducing us to Pólya's ideas about the nature of mathematical
thinking and ability. The remaining articles in this issue highlight current trends in
preservice mathematics teacher education: using technology to enrich preservice
teachers’ mathematical learning, developing curricula for building preservice teacher
understanding of statistics, and exploring what preservice secondary teachers value in
their undergraduate mathematics courses.
More specifically, José N. Contreras offers a description of how he used
Geometer’s Sketchpad (GSP) to help preservice teachers discover geometric theorems,
develop proofs for those theorems, and deepen conceptual understanding by exploring
connections between theorems. He explains the different functions GSP served in
facilitating his students’ understanding. Hollylynne and Todd Lee provide an inside
view of how they used research to inform curricular revisions in their article,
“Enhancing Prospective Teachers’ Coordination of Center and Spread.” They provide
an excellent model of how to analyze and refine the development of mathematical
themes in curricular materials. Finally, Lee Fothergill adds to the on-going debates
about what mathematics teachers need to know. He examines perceptions about the
content of calculus courses for preservice teachers among both student teachers and
mathematics department faculty, and he finds some interesting areas of agreement.
Publishing TME requires the help of many people: authors, editors, and faculty
advisors. But the backbone of our journal is no doubt our reviewers who provide the
first critical feedback on submitted manuscripts and often receive far more requests for
reviews than acknowledgement of their work. At the conclusion of this issue, Katy and
I offer the tireless reviewers for this issue a long-overdue thanks. We hope that you
enjoy this issue and share it with your colleagues.
Allyson Hallman Thrasher
Catherine Ulrich
105 Aderhold Hall [email protected] The University of Georgia www.ugamesa.org Athens, GA 30602-7124
About the cover: Graph by Kylie Wagner, rendered in Illustrator by Jeff Sawhill A predictive model can be fitted to the random variable y by minimizing the vertical distance between the fitted line and observed
y-values. We can calculate the probability of y occurring within a certain distance of the predicted y-values by using a series of
normal curves; where the mean of the curve is equal to the predicted y-values. This three-dimensional graph of the error
distribution of a regression line more accurately captures this probability function than the two-dimensional diagram (shown in the
upper left corner of cover).
This publication is supported by the College of Education at The University of Georgia

____________THE ________________
___________MATHEMATICS________
______________EDUCATOR ____________
An Official Publication of
The Mathematics Education Student Association
The University of Georgia
Summer 2011 Volume 21 Number 1
Table of Contents
3 A Look Back…. Pólya on Mathematical Abilities JEREMY KILPATRICK 11 Using Technology to Unify Geometric Theorems About the Power of
a Point JOSÉ N. CONTRERAS 23 Aspects of Calculus for Preservice Teachers LEE FOTHERGILL 33 Enhancing Prospective Teachers’ Coordination of Center and Spread:
A Window Into Teacher Education Material Development HOLLYLYNNE S. LEE & J. TODD LEE
48 A Note to Reviewers 49 Submission Guidelines 51 Subscription form
© 2011 Mathematics Education Student Association
All Rights Reserved


The Mathematics Educator
2011, Vol. 21, No. 1, 3-8
3
Dr. Jeremy Kilpatrick is Regents Professor of Mathematics
Education at The University of Georgia. His research interests
include mathematics curricula, research in mathematics education,
and the history of both.
A Look Back…
Pólya on Mathematical Abilities1
Jeremy Kilpatrick
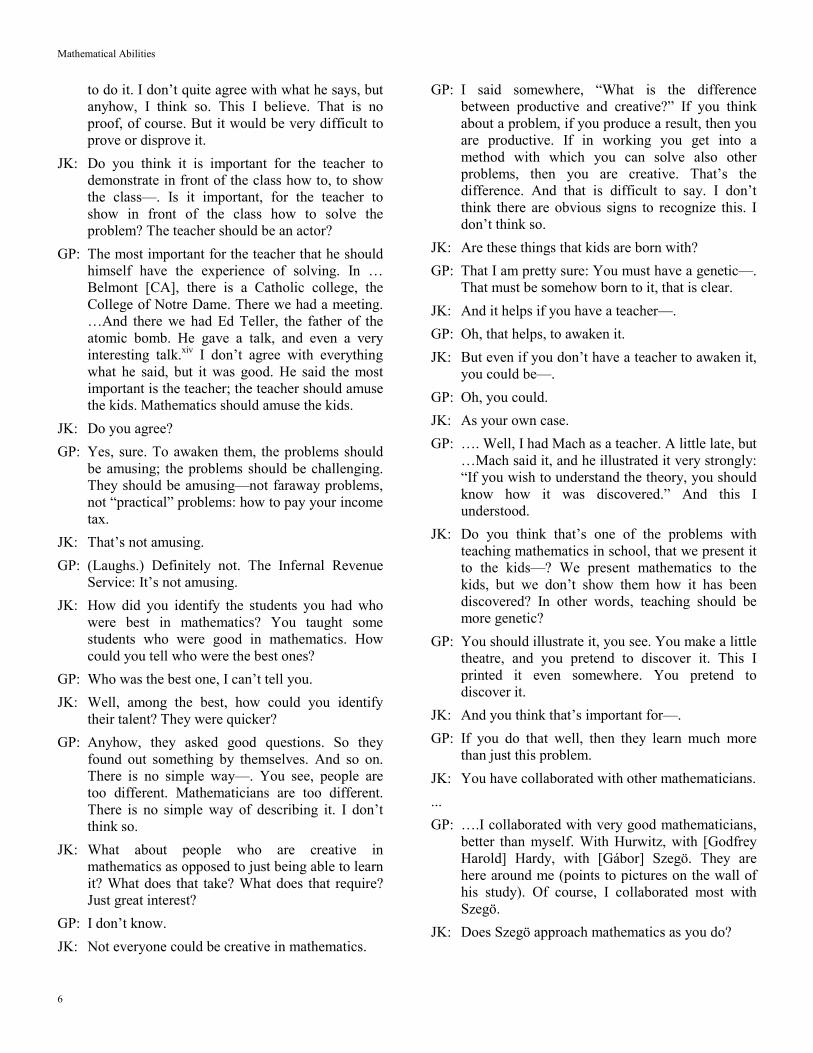
In April 1978, I interviewed George Pólya about his views on mathematical abilities. I was in California for
the annual meeting of the National Council of Teachers of Mathematics in San Diego and arranged to stop by
Pólya’s house in Palo Alto after the meeting to discuss his views on mathematical abilities as well as the articles
on mathematics education to be included in his collected papers (Rota, Reynolds, & Shortt, 1984). The
following article is abridged from that interview and focuses on mathematical abilities.
For me, the most unexpected feature of the interview was that although Pólya had obviously reflected
throughout his long life on the question of how he and others do mathematics, he had apparently not given
much thought previously to the abilities they were drawing on when they did it. Nonetheless, Pólya’s wit and
charm come through clearly as he patiently struggles with his former student’s awkward questions.
JK: What are the qualities that you think make
someone capable in mathematics? In other words,
what are the mental abilities that distinguish
someone who is capable in mathematics from
someone who is not so capable?
GP: I couldn’t give you a good description, you see. I
never made any clear ideas about that. Moreover,
there are so many different kinds of
mathematicians.
JK: What different kinds?
GP: Well, I wrote a little article about it once where I
mentioned Emmy Noether.i I made a joke about it.
She was for generalization; I was for
specialization.
….
JK: Do you think it’s important to have good spatial
ability to be a mathematician?
GP: To a certain extent, yes, but that’s also so
different. Hadamard tells about—. Do you know
the book of [Jacques] Hadamard?ii
JK: Yes, I know the book
GP: If he were here, he would give you much better
answers—anyway, more answers. He thinks
sometimes you are the “auditive” type, or you are
the “visual” type. And he himself is more an
auditive type. I don’t know. It certainly helps,
especially—. There is Jean Pedersen;iii she
certainly has spatial ability.
JK: What about memory? Do you think
mathematicians have a special memory? For
mathematical things?
GP: Yes, sure.
JK: Do you have to have a very good memory?
GP: Well, sure, for everything. Horace says in the Ars
Poetica, “Mendacem oportet esse memorem”iv—
my Latin still works a little. He says, “A liar must
have a good memory.” A poet is a liar. He invents
everything. He must very well remember what he
did before. So a good memory, that is necessary
for everything.
JK: A specially organized memory? Do you think
mathematicians have a memory that is organized
in a different way?
GP: Yes, exactly. What is organized? I find, you see,
the general terms in which you could describe it,
they are either lacking or they are vague.
JK: I can see that. But people have tried to—. Well,
one question is whether mathematicians have
certain special kinds of abilities, or they just have
ordinary abilities, but they apply them to
mathematics.
1 This interview is abridged from the original transcript, which is available in Portuguese from Guimarães, H. (2010). Jeremy
Kilpatrick: entrevista a George Pólya [Jeremy Kilpatrick: interview with George Pólya]. Quadrante, 19(2), 103–119.

Mathematical Abilities
4
GP: The second is probably a little better. No one is
completely true, but the second is better. For
instance, I can tell you, I have a pretty good
memory—. Anyhow, for the mathematics I did, I
have a pretty good memory. Well, now it goes
downhill like the rest of it, but I could remember
pretty much everything what I did. Not what other
people did. …But I have also a good memory for
poetry and a good memory for jokes. So it is not
specialized for numbers. I have a good memory
for poetry, but I recall it so: It comes often; I
recall it, in between, for any reason or without
reason. I just ask you whether you know German.
Because I recall something very pretty what
Schiller said about it.
JK: And you recall the whole thing?
GP: There are just two lines. He describes very well
what he—. I will tell it to you in German. It is
very good German. He means it probably for
poetry, or possibly, he was also a historian—he
wrote history. But it is good for mathematics. I
say it in German:
Nur Beharrung führt zum Ziel,
Nur die Fülle führt zur Klarheit,
Und im Abgrund wohnt die Wahrheit.v
He said, “Only—.” Ah, “Beharrung”—how do
you say it? “Who always—.”
Well, now, I have four languages; it’s very
difficult to find the right—. “Beharrung.” So, if
you are working all the time in the same direction,
you must go ahead all the time. “Nur die Fülle”—
if you know many things, keep together—”führt
zur Klarheit”—then you may be clear. If your
knowledge is based on many things. “Und im
Abgrund wohnt”—and the truth is in the deep.
You can say the same thing about mathematics,
but Schiller certainly meant it for poetry or for
history, and not for mathematics. …
….
JK: But different mathematicians have different
strengths and weaknesses.
GP: Different people have different strengths and
weaknesses.
JK: What are your strengths and weaknesses as a
mathematician?
GP: ….. I like to go down to something tangible. And
I start from something tangible. From some
physics, or even from some everyday things. …. I
say the same thing about—have you read it?—
about Emmy Noether.vi
JK: Yes, I’ve read the paper.
GP: So there are two kinds of monkeys: up monkeys
and down monkeys.
JK: And you’re a down monkey.
GP: I’m a down monkey, and she was an up monkey.
They are different; so are people.
JK: What were the parts of mathematics that you had
the most difficulty understanding?
GP: I don’t know. Perhaps, well, oh, I appreciate—.
It’s not the difficulty of understanding. For
instance, I appreciate foundations, but I couldn’t
work on it.
JK: Why not?
GP: Not my line, you see.
JK: Because it deals with generalization? Because it’s
too general?
GP: Well—.
JK: Too abstract?
GP: It cannot be expressed in words, you see. It is
simply not my line. Oh, I admit it is important,
but I just couldn’t work on it. It was very, very
fortunate, you see. ….[David] Hilbert came to
visit Hurwitz in Zurich. He was very old, you see.
He felt …he needs a good assistant. And there
were proposed two: [Paul] Bernays and myself.
It’s a great luck that they have chosen Bernays
and not me. Because I was not good for
foundations, and Bernays was excellent, you see.
They wrote the book: Bernays, Hilbert, and
[Wilhelm] Ackermann.vii It is hundred percent
written by Bernays. Of whose thought, I don’t
know. By Hilbert, you see, maybe it was
organized, probably. And it is enormous luck for
science and for myself that I was not chosen, you
see. It would have been, of course, in a way, it
would have been very flattering to be an assistant,
but it was much better not to be.
JK: Let’s talk about problem solving. Where did the
rules and heuristic methods that are in How to
Solve It,viii where did those come from? What’s
the source?
GP: This I gave in print. ….This is, I think, my first
paper about problem solving.ix And this is told in
detail here in the first lines. I had a kid, a stupid
kid to prepare for a high school examination. And

Jeremy Kilpatrick
5
I wished to explain him some—. Almost this
problem.x And I couldn’t do it. And the evening I
sat down, and I invented that [representation]. So
that was the starting of my explicit interest in
problem solving.
JK: So, trying to teach him, you came up with these
questions.
GP: No, no, that came afterwards, you see. But just the
main thing, the representation by a graph. I didn’t
know the word graph, and so on, but I invented
this representation. Then I made it better. I made a
geometric figure. ….And that was the beginning
of my explicit interest.
Implicitly, I was probably interested before. I
was also interested: How did people discover it?
And then Mach, Ernst Mach, he said, “To
understand a theory, you must know—. It is really
understood if you know how people discovered
it.” I read his book,xi and this influenced me
enormously. This brought me from philosophy to
physics. …..
JK: The graph came before your questions or your
suggestions like, “What is the unknown?” “Can
you draw a figure?”
GP: Oh, yes. The graph came first. Then I was also
very much interested by Descartes. By the
Regulae.xii
JK: The Rules, yes.
...
GP: ….. Oh, have you seen the number of the Journal
of Graph Theory? …..
JK: No, I haven’t seen that.
GP: There are two articles in it.xiii The first, by
Harary—I don’t have a reprint. And the other, by
Albert Pfluger. I don’t know whether you know
who he is.
JK: No.
...
GP: …He was a student. He made his Ph.D. with me. I
knew him, his daughter, and so on, and so on.
JK: And he tells the story.
GP: And he pretty much describes the story.
….
JK: When you solve problems, do you use your
advice from How to Solve It? Consciously?
GP: Yes. Well, even more than that. ….I had the rules,
and I tried it out on myself. So, for instance, I
edited the works of Hurwitz. ….He had a
mathematical diary, and it is beautifully written,
you see. It is written very comp1ete1y—not just
scribb1ed, but clearly written, well-formulated,
you see—where he describes what he thought of:
sometimes his conversations; sometimes what he
read. And then I thought about editing it, you see.
And so, I found among others, this problem which
falls me to … this [Pólya] Counting Method, you
see. And I chose this counting method just to
check my own rules. Whether my own rules
would work. …
…
GP: ….. And this problem of Hurwitz, it was just good
for that. Obviously an interesting problem
because Hurwitz and Cayley had worked on it,
and [it is] connected essentially with chemistry.
That I like, you see: connected with something
important and with the practice. But, on the other
hand, very little preliminary knowledge is
needed.….
JK: Yes.
…
JK: Some people say that they cannot use the rules.
Or that—.
GP: Well, that’s okay. People are different. People are
different.
JK: Do you think it’s possible to develop somebody’s
ability to solve problems?
GP: I think so.
...
GP: Well, I think it is not so much “develop” as it is
“awaken,” I would say.
JK: It’s there.
GP: It is somewhere there. If there is nothing there,
you cannot—. But you can awaken it, you see. A
good teacher, and so on, a good opportunity to
awaken it, you see. Well, my own case—. I had
obviously some probability for it, but it was
awakened very lately. I would have been probably
a much better mathematician if I had had in the
gymnasium a good teacher. It can be awakened—
this I think so. This may be too optimistic—. I
think even [with] my rules can a teacher, a good
teacher emphasizing a little my questions can help
awaken it. Alan Schoenfeld has some ideas how
Mathematical Abilities
6
to do it. I don’t quite agree with what he says, but
anyhow, I think so. This I believe. That is no
proof, of course. But it would be very difficult to
prove or disprove it.
JK: Do you think it is important for the teacher to
demonstrate in front of the class how to, to show
the class—. Is it important, for the teacher to
show in front of the class how to solve the
problem? The teacher should be an actor?
GP: The most important for the teacher that he should
himself have the experience of solving. In …
Belmont [CA], there is a Catholic college, the
College of Notre Dame. There we had a meeting.
…And there we had Ed Teller, the father of the
atomic bomb. He gave a talk, and even a very
interesting talk.xiv I don’t agree with everything
what he said, but it was good. He said the most
important is the teacher; the teacher should amuse
the kids. Mathematics should amuse the kids.
JK: Do you agree?
GP: Yes, sure. To awaken them, the problems should
be amusing; the problems should be challenging.
They should be amusing—not faraway problems,
not “practical” problems: how to pay your income
tax.
JK: That’s not amusing.
GP: (Laughs.) Definitely not. The Infernal Revenue
Service: It’s not amusing.
JK: How did you identify the students you had who
were best in mathematics? You taught some
students who were good in mathematics. How
could you tell who were the best ones?
GP: Who was the best one, I can’t tell you.
JK: Well, among the best, how could you identify
their talent? They were quicker?
GP: Anyhow, they asked good questions. So they
found out something by themselves. And so on.
There is no simple way—. You see, people are
too different. Mathematicians are too different.
There is no simple way of describing it. I don’t
think so.
JK: What about people who are creative in
mathematics as opposed to just being able to learn
it? What does that take? What does that require?
Just great interest?
GP: I don’t know.
JK: Not everyone could be creative in mathematics.
GP: I said somewhere, “What is the difference
between productive and creative?” If you think
about a problem, if you produce a result, then you
are productive. If in working you get into a
method with which you can solve also other
problems, then you are creative. That’s the
difference. And that is difficult to say. I don’t
think there are obvious signs to recognize this. I
don’t think so.
JK: Are these things that kids are born with?
GP: That I am pretty sure: You must have a genetic—.
That must be somehow born to it, that is clear.
JK: And it helps if you have a teacher—.
GP: Oh, that helps, to awaken it.
JK: But even if you don’t have a teacher to awaken it,
you could be—.
GP: Oh, you could.
JK: As your own case.
GP: …. Well, I had Mach as a teacher. A little late, but
…Mach said it, and he illustrated it very strongly:
“If you wish to understand the theory, you should
know how it was discovered.” And this I
understood.
JK: Do you think that’s one of the problems with
teaching mathematics in school, that we present it
to the kids—? We present mathematics to the
kids, but we don’t show them how it has been
discovered? In other words, teaching should be
more genetic?
GP: You should illustrate it, you see. You make a little
theatre, and you pretend to discover it. This I
printed it even somewhere. You pretend to
discover it.
JK: And you think that’s important for—.
GP: If you do that well, then they learn much more
than just this problem.
JK: You have collaborated with other mathematicians.
...
GP: ….I collaborated with very good mathematicians,
better than myself. With Hurwitz, with [Godfrey
Harold] Hardy, with [Gábor] Szegö. They are
here around me (points to pictures on the wall of
his study). Of course, I collaborated most with
Szegö.
JK: Does Szegö approach mathematics as you do?

Jeremy Kilpatrick
7
GP: Well, on the contrary—we were to some extent
complementary.
JK: How?
GP: For instance, he is an excellent calculator; he is
excellent at calculating.
JK: And you’re not so good?
GP: Oh, I am not so bad, but he—. Anyhow, we
somehow complemented each other. He knew
some subjects, for instance, he knew polynomials
better than me. About Legendre, and so on. We
somehow—. Our interests were sufficiently
similar, but also sufficiently different, and I
couldn’t enumerate all the points, but it was more
complementing. We had, of course, some very
similar interests, but also different. Also, similar
backgrounds. We were both students of [Leopold]
Fejér, and so on, but—.
JK: What kind of a teacher was Fejér?
GP: Oh, he was very good, very good. I scarcely had a
class by him, but I talked with him a lot. He was
excellent. Oh, this is printed somewhere; I have
an obituary of Fejér, where I tell about this.xv He
could tell so good stories.
….
JK: When you work on mathematics, when you try to
do mathematics or solve a problem, do you find
the advice to let the problem go for awhile and—
is that good advice?
GP: Not before I did something.
JK: [You need to] try a little. Have you ever had the
experience of having a solution come to you in
the unconscious?
GP: Oh, yes, sure. There is even—. “Waiting for the
good wind”—this is a usual expression.
JK: Have you had the experience?
GP: I don’t know by whom I heard it, but I didn’t
invent it, I am sure. So, if you are a sailor—not if
you have a boat with a machine, but if you have a
sailing boat—then you have to wait for the good
wind. So, “waiting for the good wind”—I didn’t
invent this expression; that must be somehow
traditional in English.
JK: People like Poincare and others tell—.
GP: And that is waiting. Sleep on your problem. That
is international. It is said in all languages.
JK: Have you had the experience of waking up with a
solution?
GP: Oh, yes, now and then. Even this I describe
somewhere in one of my papers.
JK: It came that way to you.
GP: But very seldom. And I heard it from Hurwitz the
same. You wake up with a solution, but it is just
phantasmagoria.
JK: It’s not really a solution?
GP: It doesn’t; it is not so. It happened very seldom.
That really I wake up with a solution that was so.
A simple thing is in the Inequalities, one solution
for the—. It is mentioned, I think, in one of my
late papers.xvi (Gets paper.)
...
GP: ….. But once or twice—once I remember it
definitely happened; I really dreamt it correctly. I
just had to write it out, the details, in the morning.
And Hurwitz had the same, I heard. I’m pretty
sure it is described there.
JK: Do you draw a lot of figures when you work on
problems?
GP: Sometimes, yes. Oh, I draw a lot of figures.
Sometimes very carefully.
JK: Even when the problem doesn’t require a figure?
GP: Sure. It may be a beginning of the idea. That you
come to a figure which is connected with the
problem.
…
GP: [The conversation turns back to the talk by Teller]
But it was good that somebody told it to the
teachers. Especially that the main thing of the
teacher should be the interest; he should amuse.
He should convince the kids that mathematics is
amusing.
JK: How can the kids ever learn mathematical skills,
then?
GP: They will learn it. If he plays Nim, he will learn to
make additions very quickly. And learn to
combine things, and so on. Teller is surely a much
greater scientist, and by the way, Teller is not
only that. You know there was a mathematical
competition in Hungary.xvii
JK: Yes.
GP: Teller won this competition as a kid. So he knows
it, when he talks about learning mathematics,

Mathematical Abilities
8
about the mathematics at high school age, he has
real experience, first-rate experience. But Jean
Pedersen, who is a very successful teacher, goes
to high schools, or they come to the University of
Santa Clara. And she shows the kids how to make
models. Then they are anxious to make models.
And once she photographed each kid with the
model he made. So that is also something. That is
also a mathematical occupation. They learn
geometric figures, and so on. “Learning starts by
seeing and doing”—this I also quote
somewhere.xviii
REFERENCES
Descartes, R. (1701). Regulae ad directionem ingenii (Rules for the
direction of the mind). In Des-Cartes Opuscula posthuma,
physica & mathematica. Amsterdam, The Netherlands: P. & J.
Blaeu.
Hadamard, J. (1945). The psychology of invention in the
mathematical field. Princeton, NJ: Princeton University Press.
Harary, F. (1977). Homage to George Pólya. Journal of Graph
Theory, 1, 289-290.
Hardy, G. H., Littlewood, J. E., & Pólya, G. (1934). Inequalities.
Cambridge, England: Cambridge University Press.
Hilbert, D., & Ackermann, H. (1928). Grundzüge der theoretischen
Logik [Principles of mathematical logic]. Berlin, Germany:
Springer.
Hilbert, D., & Bernays, P. (1934. Grundlagen der Mathematik
[Foundations of mathematics] (Vol. 1). Berlin, Germany:
Springer.
Hilbert, D., & Bernays, P. (1939). Grundlagen der Mathematik
[Foundations of mathematics] (Vol. 2). Berlin, Germany:
Springer.
Mach, E. (1883). Die Mechanik in ihrer Entwicklung [The science
of mechanics]. Leipzig, Germany: Brockhaus.
Pfluger, A. (1977). George Pólya. Journal of Graph Theory, 1,
291–294.
Pólya, G. (1919). Geometrische Darstellung einer Gedankenkette
[Geometrical representation of a chain of thought].
Schweizerische Pädagogische Zeitschrift, 2, 53–63.
Pólya, G. (1957). How to solve it. Princeton, NJ: Princeton
University Press.
Pólya, G. (1961), Leopold Fejér. Journal of the London
Mathematical Society, 36, 501–506.
Pólya, G. (1969). Some mathematicians I have known. American
Mathematical Monthly, 76, 746–753.
Pólya. G. (1970). Two incidents. In T. Dalenius, G. Karlsson, & S.
Malmquist (Eds.), Scientists at work: Festschrift in honour of
Herman Wold (pp. 165–168). Stockholm: Almqvist &
Wiksell.
Pólya, G. (1981). Mathematical discovery: On understanding,
learning and teaching problem solving (Combined ed.). New
York, NY: Wiley.
Pólya, G. (1984). A story with a moral. In G.-C. Rota, M. C.
Reynolds, & R. M. Shortt (Eds.), George Pólya: Collected
papers (Vol. 4: Probability; combinatorics; teaching and
learning in mathematics, p. 595). Cambridge, MA: MIT Press.
(Reprinted from Mathematical Gazette, 57, 86–87, 1973)
Rota, G.-C., Reynolds, M. C., & Shortt, R. M. (Eds.). (1984).
George Pólya: Collected papers (Vol. 4: Probability;
combinatorics; teaching and learning in mathematics).
Cambridge, MA: MIT Press.
Schiller, F. von. (1796). Sprüche des Konfucius. In F. von Schiller
(Ed.), Musen-Almanach für das Jahr 1796 [Muses Almanac
for 1976] (pp. 39–47). Neustrelitz, Germany: Michaelis.
i Pólya, 1973/1984. ii Hadamard, 1945.
iii Professor of mathematics at Santa Clara University.
iv The quotation actually comes from Quintilian (De
Institutione Oratoria, IV. ii). v “Naught but firmness gains the prize, Naught but fullness
makes us wise, Buried deep, truth ever lies!” (Schiller,
1796). vi Polya, 1973/1984.
vii Hilbert & Ackermann, 1928; Hilbert & Bernays, 1934,
1939. viii Pólya, 1957.
ix Pólya, 1919. The improved representation can be found in
Mathematical Discovery (Pólya, 1981, Vol. 2, p. 9) and
inside the front cover of Vol. 2 of the original edition. x The problem is to find the volume of a right pyramid with
square base given the altitude and the lengths of the sides of
the upper and lower bases (see Polya, 1981, Vol. 2, p. 2). xi Mach, 1883.
xii Descartes, 1701.
xiii Harary, 1977; Pfluger, 1977.
xivxiv At the February 1978 meeting of the Northern
California Section of the Mathematical Association of
America, held at the College of Notre Dame, Edward
Teller’s talk was entitled “The New (?) Math.” xv Pólya, 1961. See also Pólya, 1969.
xvi It was the proof of the inequality between the arithmetic
and geometric means given in Hardy, Littlewood, and Polya,
1934, p. 103. See Pólya, 1970. xvii
The Eötvös Competition. xviii
Pólya, 1981, Vol. 2, p. 103. Pólya’s paraphrase of Kant:
“Learning begins with action and perception.”

The Mathematics Educator
2011, Vol. 21, No. 1
9

The Mathematics Educator
2011, Vol. 21, No. 1
10

The Mathematics Educator
2011, Vol. 21, No. 1, 11–21
11
Using Technology to Unify Geometric Theorems About the Power of a Point
José N. Contreras
In this article, I describe a classroom investigation in which a group of prospective secondary mathematics
teachers discovered theorems related to the power of a point using The Geometer’s Sketchpad (GSP). The
power of a point is defines as follows: Let P be a fixed point coplanar with a circle. If line PA is a secant line
that intersects the circle at points A and B, then PA·PB is a constant called the power of P with respect to the
circle. In the investigation, the students discovered and unified the four theorems associated with the power of a
point: the secant-secant theorem, the secant-tangent theorem, the tangent-tangent theorem, and the chord-chord
theorem. In our journey the students and I also discovered two kinds of proofs that can be adapted to prove each
of the four theorems. As teacher educators, we need to design learning tasks for future teachers that deepen their
understanding of the content they are likely to teach. Having a profound understanding of a mathematical idea
involves seeing the connectedness of mathematical ideas. By discovering and unifying the power-of-a-point
theorems and proofs, these future teachers experienced what it means to understand a mathematical theorem
deeply. GSP was an instrumental pedagogical tool that facilitated and supported the investigation in three main
ways: as a management tool, motivational tool, and cognitive tool.
The judicious use of technology enhances the
teaching and learning of mathematics. Technology
frees the user from performing repetitive and
computational tasks, and thus, it allows more time for
action and reflection. As a consequence, when students
use technology as a cognitive tool, they develop a
deeper understanding of mathematical concepts,
patterns, and relationships (Battista, 2007; Clements,
Sarama, Yelland, & Glass, 2008; Hollebrands, 2007;
Hollebrands, Conner, & Smith, 2010; Hollebrands,
Laborde, & Sträβer, 2008; Hoyles & Healy, 1999;
Hoyles & Jones, 1998; Koedinger, 1998; Laborde,
1998; Laborde, Kynigos, Hollebrands, & Sträβer,
2006).
For example, Battista (2007) describes how two
fifth graders constructed meaning for a spatial property
of rectangles--each of the four angles of a rectangle
measures 90°--within the Shape Makers environment
(Battista, 1998), a GSP microworld for investigating
geometric shapes. In their review of research on
learning and teaching geometry within interactive
geometry software (IGS) environments, Clements,
Sarama, Yelland, and Glass (2008) concluded that IGS
“can be beneficial to students in their development of
understandings of geometric shapes and figures” (p.
131). Similarly, research reviewed by Hollebrands,
Conner, and Smith (2010) suggests that IGS
environments “enable students to abstract general
properties and relationships among geometric figures”
(p. 325).
IGS such as The Geometer’s Sketchpad (GSP)
(Jackiw, 2001) and Cabri Geometry II (Laborde &
Bellemain, 1994) are powerful instructional technology
tools. IGS allows the user to construct dynamic figures
that can be manipulated or moved without altering the
mathematical nature of the geometric figure. This
feature allows the user to quickly generate many
examples of a geometric diagram. This feature is in
marked contrast to the static nature of textbook and
paper-and-pencil illustrations. A diagram that can be
resized by dragging flexible points also motivates the
user to investigate invariant geometric relationships.
As a result of motivation, action, and reflection,
students construct a more powerful abstraction of
mathematical concepts (Battista, 1999).
This article describes a classroom activity in which
a group of 13 prospective secondary mathematics
teachers (hereafter referred to as students) investigated
the power of a point with GSP. My objective was to
guide my students to discover and unify several
geometric theorems related to the power of a point.
The power of a point is defined as follows: Let P be a
fixed point coplanar with a circle. If PA is a secant
line that intersects the circle at points A and B, then
Dr. José N. Contreras, [email protected], teaches mathematics
and mathematics education courses at Ball State University. He is
particularly interested in integrating problem posing, problem
solving, technology, history, and realistic mathematics education in
teaching and teacher education.

Technology to Unify Power of Point Theorems
12
PA·PB is a constant called the power of with respect to
the circle.
The Classroom Setting
The students were enrolled in my college geometry
class for secondary mathematics teachers. The
textbook I used was Geometry: A Problem-Solving
Approach with Applications (Musser & Trimpe, 1994).
All of my students had completed the calculus
sequence, discrete mathematics, and linear algebra. In
addition, by this point in the course, my students were
proficient using GSP, as they had employed it to
complete several tasks involving constructing
geometric figures (e.g., centroid of a triangle, squares,
etc.), detecting patterns, and making conjectures. We
conducted our power of a point investigation in the
computer lab where each student had access to a
computer with GSP. To facilitate and manage the
investigation more efficiently and accurately, I
provided students with geometric files relevant to the
investigation. I had my laptop computer connected to
an LCD projector.
Starting the Investigation: Discovering the Power of
a Point
We began our investigation with the problem
shown in Figure 1.
Find the value of PD in the configuration below
where 60.1=PA cm, 50.1=PC cm, 30.3=PB cm.
Justify your method.
C
A
P
B
D
Figure 1. The initial problem.
Some students used the proportion 50.160.1
30.3 PD= or one
of its equivalent forms, others said that they did not
remember how to do this type of problem, while a third
group claimed that they had never seen a problem like
that before. I then asked students to open the “power of
a point” file to investigate this problem using GSP. I
had hoped for students to attempt to discover the
general relationship. A few students quickly used the
measurement capabilities of GSP to find or verify their
solution. When they realized that their solution was
incorrect, they concluded that their proposed
relationship 50.160.1
30.3 PD= did not hold. Another student
reached this conclusion by noticing that dragging point
B changed PA, PB, and PA
PB, but did not influence PC
and PD. Therefore, the proportion PD
PC
PA
PB= did not
hold. The measurement and dragging capabilities of
GSP allowed students to disconfirm their initial
conjectures.
After confirming that dragging point B changed PA
and PB, I told them that a hidden quantity involving
only PA and PB remained constant and challenged
them to find it. Some students tried PA+PB and
PB–PA. One of the first students who discovered that
PA·PB remains constant said, “I can’t believe it. PA·PB
remains the same no matter where points A and B are.”
Other students verified this hypothesis by dragging
point B and calculating PA·PB (see Figure 2). One
student was puzzled because she noticed that PB
increases in some instances but the product remained
the same. Another student said, “Yes, but PA
decreases. When one number increases the other
decreases. So they balance each other.” At this time I
mentioned that the constant PA·PB is called the power
of point P, P(P), with respect to the circle. In this case,
the computational and dynamic capacities of GSP
allowed some students to discover that PA·PB remains
invariant regardless of where points A and B are
located in the circle.
Continuing the Investigation: An Unanticipated
Discovery
As we did with other investigations involving GSP,
we systematically tested our conjecture for different
circles and points. To test our power-of-a point
conjecture for a given circle, we dragged point P and
then point B to verify that PA·PB is constant. Students
also noticed that for a given circle, the farther point P
was from it, the greater its power. A couple of students
also dragged the point controlling the radius of the
circle and noticed that the radius influenced the power
of a point as well. I had originally planned to just test
our conjecture for different points and different circles,
but our systematic testing led us to investigate an
unexpected conjecture related to how both the length
of the radius (r) of the circle, and the distance from P
to the center (O) of the circle impacted its power.

José N. Contreras
13
60.1=PA cm 30.3=PB cm 50.1=PC cm
30.5=⋅PBCPA cm2
C
A
P
B
D
44.1=PA cm 68.3=PB cm 50.1=PC cm
30.5=⋅PBCPA cm2
C
A
P
B
D
Figure 2. PA·PB seems to be constant for a given point P and circle.
I hid the product PA·PB on my GSP sketch and
asked students to predict the behavior of the power of
point P as I increased the radius of the circle from 0
with both its center O and point P fixed. A student
claimed that the power of the point would remain
constant because PB increases and PA decreases.
Another student refuted this explanation saying that the
power would decrease because PB increases but PA
approaches zero and becomes zero when the circle
goes through P. The second student added that the
power would increase as the radius of the circle
increased “beyond P”. Students confirmed this
conjecture on their GSP sketches. At this time, it
occurred to me to ask students for the maximum value
of the power of the point when the point is still in the
exterior of the circle (i.e., the radius of the circle is less
than PO). Some students provided a numerical value
while others argued that the maximum value did not
exist because PA, PB, and PB·PA disappear when the
circle becomes a point. One student said that we could
still consider a point as a circle of radius zero, and
another student mentioned that a point could be
considered as the limiting case of a circle when the
radius approaches zero. However, most students in the
class agreed that a point is not a circle because the
radius has to be greater than zero. I then asked students
to consider what conception would be more helpful or
convenient to describe the behavior of PA·PB. We then
formulated the following conjecture:
Let P be a fixed point and C a circle with fixed
center O but variable radius r. As the radius of the
circle increases from zero, the power of the point
with respect to C
a) decreases from a maximum, the square of the
distance from the point to the center of the
circle (when the radius of the circle is zero), to
zero (when the circle contains P) as the radius
increases from 0 to OP.
b) increases from zero without limit as the radius
increases without limit from OP (P is an
interior point).
At this point, I wanted to investigate the
relationship between the power of a point and the
radius of a circle. Since I knew my students were not
familiar with the graphing capabilities of GSP, I asked
them to use pencil and paper to sketch a graph of the
power of a point as a function of the radius. While they
did this, I constructed the graph in GSP using the trace
feature. I asked students how we could conveniently
position a circle in the coordinate plane to simplify the
computations. One student suggested putting the center
of the circle at the origin and points P, A, and B on the
x-axis. This student provided the table shown (see
Figure 3) for the point P whose coordinates were (2,
0). Other students constructed similar tables using the
same or different coordinates for point P.
P(P)
0 2(2) = 4
1 3(1) = 3
2 4(0) = 0
3 5(1) = 5
4 6(2) = 12
5 7(3) = 21
Figure 3. Student-constructed table examining the
relationship between radius of a circle and power of

Technology to Unify Power of Point Theorems
14
point.
All students agreed with the GSP graph (see Figure
4) since it looked like their sketches, and that the first
piece of the graph seemed to be a parabolic arc. To
better visualize the nature of the second piece of the
graph, I changed the scale of the y-axis. Notice that the
circle is not shown on the second graph. We
conjectured that the graph appeared to be two pieces of
parabolic arcs.
As we tried to make sense of the table in Figure 3
and the graphs in Figure 4, we generalized the pattern
depending on whether P is an exterior or an interior
point as:
P(P) = (2 + r)(2 – r) = 4 – 2r
or
(r + 2)(r – 2) = 2r – 4.
I then asked students for the geometric interpretation of
the number 2 in this formula. After some reflection and
discussion, students realized that 2 was the distance
from the point P to the origin, which is the center of the
circle O. Therefore we could rewrite our equations as:
P(P) = PA·PB = (OP – r)(OP + r) = OP2 – r
2
and
P(P) = r2 – OP
2 .
when P is exterior to the circle and when P is interior
to the circle, respectively. Since my objective for this
activity was to unify theorems related to the power of a
point, I asked the students, “How can these two graphs
be unified? How we can have one parabolic arc instead
of two pieces?” In a previous activity we had unified
the theorems related to the measures of angles formed
by secant lines when the vertex of an angle is an is an
exterior point and when the vertex is an interior point
by considering directed arcs, so it was natural for a
student to suggest using directed distances. Another
student said that using directed distances could “flip”
the second piece across the x-axis. The first student
inferred from the graph that we could unify the two
formulas by considering the power of an exterior point
to be positive and the power of an interior point to be
negative. In order to do this, we needed to consider PA.
and PB as directed distances, similar to directed arcs.
As a result, we obtained the graph displayed in Figure
5. The equation of this graph is P(P) = 22 rOP − .
I was particularly delighted that we had also
discovered a formula for the power of a point in terms
of its distance to the center of the circle and the radius.
The interactive, graphing, and dynamic capabilities of
GSP motivated us to follow our intuitions and test the
resulting conjectures. It minimized the managerial and
logistic difficulties of performing this part of the
investigation with paper and pencil.
4
3
2
1
1
2
2 2 4
PA·PB = 2.18 cm2
OA = 1.33 cm
PB = 3.32 cm
PA = 0.66 cm
B
AO
E
P
40
30
20
10
10
2 4 6O
P
Figure 4. The power of a point as a function of the radius of the circle.
66.0=PA cm
32.3=PB cm
18.2=⋅PBPA cm2
33.1=OA cm

José N. Contreras
15
4
2
-2
OP2-OA2 = 3.04 cm2
OP = 2.01 cm
OA = 1.00 cm
B
O
P
A
Figure 5. The unified graph of the power of a point
as a function of the radius of the circle.
Continuing the Investigation: Establishing the
Secant-Secant Theorem
After these unexpected but productive digressions,
we came back to our original problem. Two students
admitted that they did not know how to use PA·PB to
find PD. After I dragged point B around the circle
hoping that these students could see the connection that
PA·PB = PC·PD because PA·PB is a constant, only one
student still failed to see the connection. A classmate
provided the following explanation: “PA times PB is a
constant no matter where points A and B are. So if A =
C and B = D we have that PA·PB = PC·PD.” The
student computed the product PC·PD to see the
pattern. After we established the relationship PA·PB =
PC·PD, I asked the class how we could prove it. Since
nobody provided any hint or suggestion about how to
prove the relationship, I suggested rewriting PA·PB =
PC·PD in another way. Some students suggested
rewriting PA·PB = PC·PD asPB
PD
PC
PA= . This
prompted one student to suggest using similar
triangles. Several students immediately proved the
equality by using the AA similarity theorem to prove
∆APD ~ ∆CPB (see Figure 6), and one student shared
his proof with the rest of the class.
By proving that PA·PB = PC·PD for arbitrary B
and D on the circle, we established that PA·PB is a
constant for a particular exterior point of a given circle.
We then formulated the corresponding theorems in the
following terms:
C
A
P
B
D
Figure 6. ∆APD ~ ∆CPB.
(i) The secant-secant theorem: Let P be an
exterior point of a circle. If two secants PA
and PC intersect the circle at points A, B, C,
and D, respectively (see Figure 6), then
PA·PB = PC·PD.
(ii) P is an exterior point and PA is a secant of a
circle. If the secant PA to the circle intersects
the circle at points A and B, then PA·PB is a
constant. This constant is called the power of
P with respect to the circle.
GSP allowed students to dynamically manipulate
and interact with the power of a point, an abstract
object, in a “hands-on” manner. By moving points
along the circle, they gained experience with one of the
representations of the power of a point.
Modifying the Secant-Secant Theorem: The
Tangent-Secant Theorem
Since my goal was to formulate theorems related to
the secant-secant theorem, I asked students what other
theorems could be generated from this theorem. The
class listed the following possible cases to consider:
1. P is on the exterior
2. One secant and one tangent
3. Two tangents
4. P is on the circle
5. P is in the interior of the circle
We then proceeded to investigate the case when P
is an exterior point of a circle, one line is a secant, and
the other is a tangent. With my computer, I illustrated
the situation as D approaches C (see Figure 7a) and
01.2=OP cm
00.31=OA cm
04.322 =⋅OAOP cm2

Technology to Unify Power of Point Theorems
16
asked students to predict the relationship PA·PB =
PC·PD when line PC (or PD ) is a tangent line to the
circle. Most students predicted that PA·PB = 2PC (or
2PD ). To further test their conjecture, I had my
students open a file containing a pre-constructed
configuration to illustrate the “secant-tangent” situation
(see Figure 7b). After testing our conjecture for several
cases by dragging point P and varying the size of the
circle (see Figure 7c), students were confident that the
conjecture was true and, therefore, that we could prove
it.
Since ∆APD approaches ∆APC (see Figures 7a and
7b), I was expecting students would use the similarity
of ∆APC and ∆CPB to prove the tangent-secant
conjecture. However, only two students thought of
using the fact that ∆APC ~ ∆CPB (see Figure 8a) to
prove our conjecture. Since I wanted to unify the two
theorems (the secant-secant theorem and the tangent-
secant theorem), I illustrated on my computer how, as
line PC approaches a tangent line, ∆APD approaches
∆APC (see Figure 8b). All students were able to justify
that ∆APC ~ ∆CPB by the AA similarity theorem and
derived the tangent-secant relationship. Initially two
students measured angles ACP∠ and CBP∠ to
convince themselves that those angles are congruent.
Eventually both of them “saw” why they are
congruent: By the inscribed angle theorem
( )⌢
ACCBPm21=∠ and, by the semi-inscribed angle
theorem, ( )⌢
ACACPm21=∠ . We formulated our
theorems as follows:
(iii) The tangent-secant theorem: Let P be an
exterior point of a circle. If a secant PA and
a tangent PC intersect the circle at points A,
B, and C, respectively, then PA·PB = 2PC .
(iv) If P is an exterior point and PA is a tangent
line of a circle with point of tangency A, then
the power of the point is = 2PA .
C
A
P
B
D
A
C
P
B
A
C
P
B
(a) (b) (c)
Figure. 7: Discovering the tangent-secant theorem.
A
C
P
B
C
A
P
B
D
(a) (b)
Figure 8. ∆APD approaches to ∆APC as C and D get closer.
96.0=PA cm
47.2=PB cm
36.2=⋅PBPA cm2
09.1=PA cm 42.2=⋅PBPA cm2
22.2=PB cm 42.22 =PC cm2
56.1=PC cm

José N. Contreras
17
The dynamic geometry environment facilitated our
examination of what varied and what remained
invariant as one secant line approached and eventually
became a tangent line. Students gained experience with
a second representation of the power of a point. They
were also able to see similarities and differences
between the new proof and the proof for the secant-
secant theorem.
Modifying the Secant-Secant Theorem: The
Tangent-Tangent Theorem
Our next task was to investigate the case when
both lines are tangent (see Figure 9a). I asked students
to conjecture a new relationship by applying our
knowledge of the power of a point to Figure 9a. One
student said that PA = PC but he was unable to explain
the connection between this relationship and the
tangent-secant theorem. He could only say that the
figure suggests such a relationship. As a hint, I used
the tangent-secant configuration, dragging point B until
it got close to point A (see Figure 9b), and asked
students what would happen when PA becomes a
tangent. After some reflection, two students were able
to deduce that PA = PC. One of the arguments was as
follows: By the secant-tangent theorem, P(P) = 2PA
and P(P) = 2PA , so 2PA = 2PC . After taking the
square root of both expressions, we got PA = PC. We
formulated our theorem as follows:
(v) Let P be an exterior point of a circle. If PA
and PC are tangent lines to the circle, with
tangency points A and C, then PA = PC (see
Figure 9a).
To illustrate the interconnectedness of these
mathematical theorems, I challenged my students to
find as many additional proofs as they could that
PCPA = . As a group, students provided two more
proofs, which refer to the diagram in Figure 10.
C
A
P
A
C
P
B
(a) (b)
Figure. 9: Discovering the tangent-tangent theorem.
C
A
OP
Figure 10. Diagram students used to prove PCPA =
Sketch of proof 1. Since lines PA and PBC are
tangent lines, they are perpendicular to the radii that go
through their points of tangency. Therefore, triangles
∆AOP and ∆COP are right triangles. Since AO = CO
(by definition of a circle), ∆AOP ≅ ∆COP by the
Hypotenuse-Leg congruence criterion. As a
consequence, AP = CP.
Sketch of proof 2: As in proof 1, ∠OAP and
∠OCP are right angles. In addition AO = CO. Since O
is equidistant from the sides of ∠APC, it belongs to its
angle bisector. Therefore, PCO is the angle bisector of
∠APC, which means that CPOAPO ∠≅∠ . We
conclude that ∆AOP ≅ ∆COP by the AAS congruence
criterion. By definition of congruent triangles,
CPAP = .
O
A
P
A
P
C
C
Technology to Unify Power of Point Theorems
18
Since one of my objectives was to unify the
theorems related to the power of a point, I asked
students to prove that PA = PC by modifying the proof
for the tangent-secant theorem. Since ∆APC ~ ∆CPB
and points A and B collapse into one point, all of the
students were able to see that ∆APC ~ ∆CPA. Some
students established that 22 PCPA = using the
proportionPA
PC
CP
AP= , another established directly that
PCPA = using the proportion 1==CA
AC
CP
AP, and
others used the fact that ∆APC ≅ ∆CPA by the ASA
congruence criterion. Finally, following my
suggestion, the class proved that PCPA = using the
converse of the isosceles triangle theorem since
∠PAC ≅∠PCA.
C
A
P
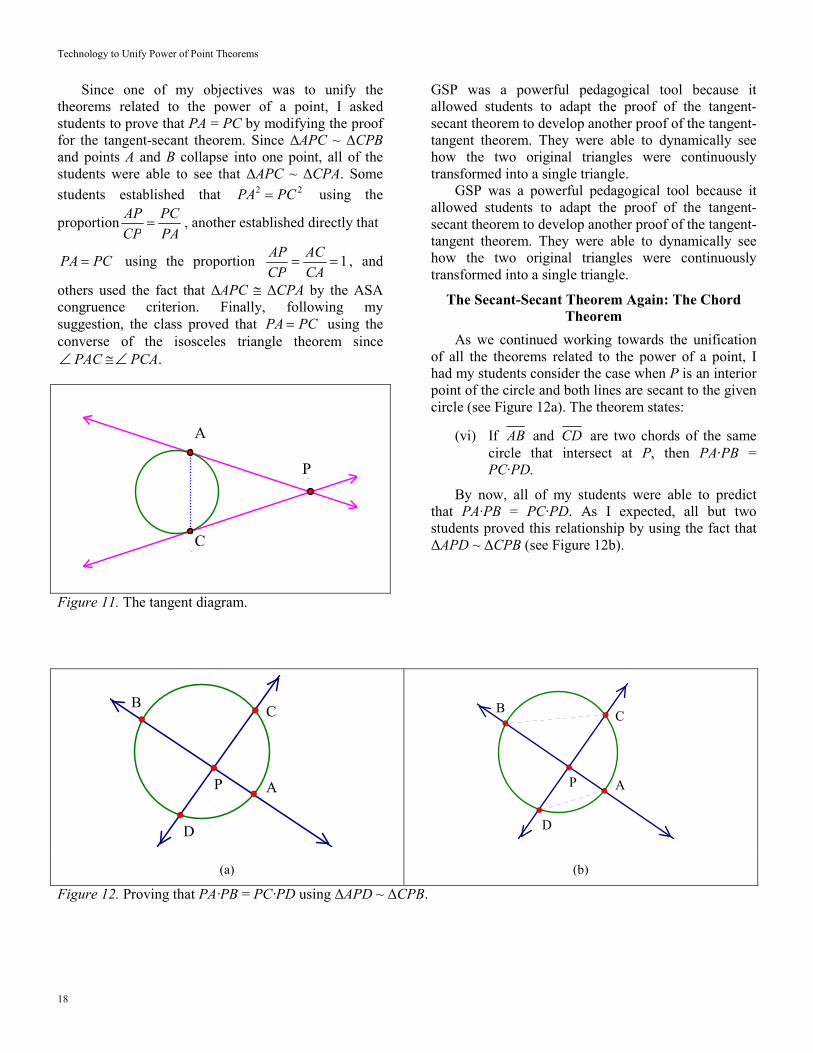
Figure 11. The tangent diagram.
GSP was a powerful pedagogical tool because it
allowed students to adapt the proof of the tangent-
secant theorem to develop another proof of the tangent-
tangent theorem. They were able to dynamically see
how the two original triangles were continuously
transformed into a single triangle.
GSP was a powerful pedagogical tool because it
allowed students to adapt the proof of the tangent-
secant theorem to develop another proof of the tangent-
tangent theorem. They were able to dynamically see
how the two original triangles were continuously
transformed into a single triangle.
The Secant-Secant Theorem Again: The Chord
Theorem
As we continued working towards the unification
of all the theorems related to the power of a point, I
had my students consider the case when P is an interior
point of the circle and both lines are secant to the given
circle (see Figure 12a). The theorem states:
(vi) If AB and CD are two chords of the same
circle that intersect at P, then PA·PB =
PC·PD.
By now, all of my students were able to predict
that PA·PB = PC·PD. As I expected, all but two
students proved this relationship by using the fact that
∆APD ~ ∆CPB (see Figure 12b).
C
AP
B
D
C
AP
B
D
(a) (b)
Figure 12. Proving that PA·PB = PC·PD using ∆APD ~ ∆CPB.
A
P
C

José N. Contreras
19
The Investigation Concludes: The Unification and
Another Discovery
At this point, the investigation took another
unexpected turn: Two students proved the power-of-a-
point relationship using triangles ∆ACP and ∆DBP
(see Figure 13a). At that time, it occurred to me that
this proof could be extended to the other cases, so I
challenged the class to adapt the proof to the other
situations. While there were no changes for the
tangent-secant theorem and the tangent-tangent
theorem, all of my students were challenged by the
secant-secant theorem (see Figure 13b).
Some students argued that the proof could not be
adapted to the secant-secant theorem because triangles
∆ACP and ∆DBP did not look similar. I myself was
not sure whether triangles ∆ACP and ∆DBP were
similar. Based on visual clues, one student thought that
BDPACP ∆∆ ~ , but another student refuted her
proposition because lines AC and BD are not
necessarily parallel. To investigate whether triangles
∆ACP and ∆DBP were similar, we measured their
angles and, to our surprise, we found that
DBPACP ∠≅∠ and ∠CAP ≅ ∠BDP. Our next task
was to explain these congruencies. After some
reflection and discussion, and without my guidance, a
student concluded that ∠CAP ≅ ∠BDP if and only if
°=∠+∠ 180)()( CABmBDPm . Since we had not
proved that angles ∠BDP and ∠CAB are
supplementary, I challenged the class to prove their
claim. Some students were able to prove the claim
using the inscribed angle theorem as follows:
°==
+=∠+∠
° 180
)()()()(
2360
21
21
⌢⌢
BDCmCABmCABmBDPm
We stated our theorem as follows:
(vii) The opposite angles of a cyclic quadrilateral
are supplementary.
C
A
P
B
D
C
A
P
B
D
(a) (b)
Figure 13. Triangles ∆ACP and ∆DBP support our theorems.
We concluded our investigation of the power of the
point by combining our theorems into one theorem that
we called the power-of-the-point theorem:
(viii) Let C be a circle and P be any point not on
the circle. If two different lines PA and PC
intersect the circle at points A and B, and C
and D, respectively, then PA·PB = PC·PD.
In addition, we came back to our formula for the
power of a point in terms of its distance to the center of
the circle and the radius of the circle:
(ix) The power of a point with respect to a circle
with center O and radius r is 22 rOP − .
GSP was instrumental in investigating the
possibility of developing a second proof for the secant-
secant theorem based on two triangles that did not look
similar to us at first sight. GSP motivated us to
question our initial impression that the triangles are
non-similar and to go beyond empirical evidence to
justify mathematically why those two triangles are
similar.
We then discussed why textbooks presented the
four theorems (secant-secant, secant-tangent, tangent-
tangent, and chord-chord) separately if they could be
stated as a single theorem. My goal was to help my
students recognize that our knowledge of a
mathematical theorem deepens as we discover or come
to know the new relationships or patterns that emerge

Technology to Unify Power of Point Theorems
20
in special cases of a theorem. If we do not make
explicit that the four theorems can be unified, we tend
to learn each one as a separate, compartmentalized
theorem. As a consequence, we may fail to remember
one case (e.g., the tangent-secant case) even when we
know another case (e.g., the secant-secant case).
Discussion and Conclusion
In the power of the point investigation, we used the
power of the dynamic, dragging, computational,
graphing, and measurement features of GSP to
discover and unify several theorems related to the
power of a point. We all discovered some theorems.
my students, under my guidance, discovered the main
theorems related to the power of a point and the
supplementary property of the opposite angles of a
cyclic quadrilateral, and I discovered alongside my
students the formula of the power of a point in terms of
both the distance from the point to the center of the
circle and the length of the radius of the circle. In
addition, we unified the five main power-of-a point
theorems. As I have shown, GSP was an essential
pedagogical tool that was instrumental in our
investigation.
I used GSP as a pedagogical tool in three main
ways: as a management tool, a motivational tool, and a
cognitive tool (Peressini & Knuth, 2005). As a
management tool, GSP allowed us to perform the
investigation more efficiently and accurately avoiding
computational errors and imprecise drawings and
measurements associated with lengthy paper and pencil
constructions needed to examine multiple examples.
As a motivational tool, GSP enhanced our dispositions
to perform the investigation. The dynamic and
interactive capabilities of GSP allowed us to follow our
intuitions, question our predispositions, and test the
resulting conjectures easily and accurately. As a
cognitive tool, GSP provided an environment in which
all of us were active in the process of learning the
concepts and procedures at hand. We were able to
actively represent and manipulate this abstract
geometric object in a hands-on mode. As we
experienced first hand the meaning of the power of a
point, we reflected on the factors that influenced its
behavior. As a result of our actions and reflections, we
constructed a more powerful abstraction of this
concept, and, thus, we developed a deeper
understanding of it.
Understanding the unification of the four theorems
is important from both pedagogical and mathematical
perspectives. From a pedagogical point of view,
understanding the relationships among different
representations of mathematical theorems and concepts
helps us to generate the special cases, to remember the
different forms that a theorem can take, to reduce the
amount of information that must be remembered, to
facilitate transfer to new problem situations, and to
believe that mathematics is a cohesive body of
knowledge (Hiebert & Carpenter, 1992). From a
mathematical point of view, doing mathematics
involves discovering special relationships as well as
unifying known theorems. Even concepts that are
apparently different can be unified when examined
from another viewpoint. For example, from the
perspective of inversion theory, lines and circles are
the same type of geometric objects. Yet, from a
Euclidean point of view, the circles and lines are
absolutely different geometric entities. In our case, the
power of a point P with respect to a circle with center
O and radius r is the product of two directed distances
from P to any two points A and B of the circle with
which it is collinear. By allowing A = B, the theorem is
transformed into useful instances from which we
derive special and useful corollaries. By considering
the case when points P, A, B and O are collinear, we
obtain another useful instance of the theorem (i.e.,
P(P) = 22 rOP − ).
In this mathematical investigation, students
experienced learning mathematical concepts with a
specific piece of technology. They were engaged in the
process of constructing mathematical knowledge by
discovering and justifying their conjectures and
making sense of classmates’ explanations. They
justified their conjectures not only with the
technological tool (i.e., testing a conjecture for several
instances), but also with mathematical theory (i.e.,
justifying why a conjecture is plausible and proving
that a theorem is true). By learning mathematical
concepts within technology environments, these future
teachers further developed not only specific content
knowledge but also their conceptions about the nature
of mathematical activity and their pedagogical ideas
about learning mathematics with technology. They
deepened their knowledge of the connections among
the various special cases of the secant-secant theorem.
They experienced that doing mathematics involves
formulating and testing conjectures and
generalizations, as well as discovering and proving
theorems. From a pedagogical point of view, these
future teachers experienced what it means to teach and
learn mathematics within IGS environments. The
students take a more active role in their own learning
under the guidance of the teacher whose main
responsibility becomes facilitating. Making
connections among mathematical ideas is a powerful

José N. Contreras
21
tool for prospective teachers’ learning that they can
transfer to their own teaching practice.
REFERENCES
Battista, M. (1998). Shape makers: Developing geometric
reasoning with the Geometer’s Sketchpad. Berkely, CA: Key
Curriculum Press.
Battista, M. (1999). The mathematical miseducation of Americaʼs
youth. Phi Delta Kappan, 80, 424–433.
Battista, M. (2007). Learning with understanding: Principles and
processes in the construction of meaning for geometric ideas.
In W. G. Martin & M. E. Strutchens (Eds.), The Learning of
Mathematics, 69th Yearbook of the National Council of
Teachers of Mathematics (pp. 65–79). Reston, VA: National
Council of Teachers of Mathematics.
Clements, D. H., Sarama, J., Yelland, N. J., & Glass, B. (2008).
Learning and teaching geometry with computers in the
elementary and middle school. In M. K. Heid & G. H. Blume
(Eds.), Research on technology and the teaching and learning
of mathematics: Vol. 1. Research syntheses (pp. 109–154).
Charlotte, NC: Information Age.
Hiebert, J., & Carpenter, T. P. (1992). Learning and teaching with
understanding. In D. A. Grouws (Ed.), Handbook of research
on mathematics teaching and learning (pp. 65–97). Reston,
VA: National Council of Teachers of Mathematics.
Hollebrands, K. (2007). The role of a dynamic software program
for geometry in the strategies high school mathematics
students employ. Journal for Research in Mathematics
Education, 38,164–192.
Hollebrands, K., Conner, A., & Smith, R. C. (2010). The nature of
arguments provided by college geometry students with access
to technology while solving problems. Journal for Research in
Mathematics Education, 41, 324–350.
Hollebrands, K., Laborde, C., & Sträβer, R. (2008). Technology
and the learning of geometry at the secondary level. In M. K.
Heid & G. H. Blume (Eds.), Research on technology and the
teaching and learning of mathematics: Vol. 1. Research
syntheses (pp. 155–206). Charlotte, NC: Information Age.
Hoyles, C., & Healy, L. (1999). Linking informal argumentation
with formal proof through computer-integrated teaching
experiments. In O. Zaslavsky (Ed.), Proceedings of the 23rd
conference of the International Group for the Psychology of
Mathematics Education (pp. 105–112.) Haifa, Israel:
Technion.
Hoyles, C., & Jones, K. (1998). Proof in dynamic geometry
contexts. In C. Mammana & V. Villani (Eds.), Perspectives on
the teaching of geometry for the 21st century: An ICMI study
(pp. 121–128). Dordrecht, The Netherlands: Kluwer.
Jackiw, N. (2001). The Geometer’s Sketchpad. Software. (4.0).
Emeryville, CA: KCP Technologies.
Koedinger, K. (1998). Conjecturing and argumentation in high
school geometry students. In R. Lehrer & D. Chazan (Eds.),
Designing learning environments for developing
understanding of geometry and space (pp. 319–347).
Mahwah, NJ: LEA.
Laborde, C. (1998). Visual phenomena in the teaching/learning of
geometry in a computer-based environment. In C. Mammana
& V. Villani (Eds.), Perspectives on the teaching of geometry
for the 21st century: An ICMI study (pp. 113–121). Dordrecht,
The Netherlands: Kluwer.
Laborde, C., Kynigos, C., Hollebrands, K., & Sträβer, R. (2006).
Teaching and learning geometry with technology. In A.
Gutiérrez & P. Boero (Eds.), Handbook of research on the
psychology of mathematics education: Past, present, and
future (pp. 275–304). Rotterdam, The Netherlands: Sense.
Laborde, J., & Bellemain, F. (1994). Cabri Geometry II. Dallas,
TX: Texas Instruments.
Peressini, D. D., & Kuth, E. J. (2005). The role of technology in
representing mathematical problem situations and concepts. In
W. J. Masalski (Ed.), Technology-supported mathematics
learning environments, 67th Yearbook of the National Council
of Teachers of Mathematics (pp. 277–290). Reston, VA:
National Council of Teachers of Mathematics.
Musser, G. L., & Trimpe, L. E. (1994). College geometry: A
problem-solving approach with applications. New York, NY:
Macmillan.

The Mathematics Educator
2011, Vol. 21, No. 1
22

The Mathematics Educator
2011, Vol. 21, No. 1, 23–31
23
Aspects of Calculus for Preservice Teachers
Lee Fothergill
The purpose of this study was to compare the perspectives of faculty members who had experience teaching
undergraduate calculus and preservice teachers who had recently completed student teaching in regards to a first
semester undergraduate calculus course. An online survey was created and sent to recent student teachers and
college mathematics faculty members who had experience teaching a first semester calculus course to help
determine the aspects of calculus that they deemed most important in the teaching of calculus to pre-service
mathematics teachers. Faculty members with experience teaching at the secondary level, faculty members
without experience teaching at the secondary level, and recent student teachers’ survey results were compared
and there were some notable differences between the groups. The aspect that was ranked the highest among all
groups was problem solving which is consistent with the views of major mathematical organizations, such as
the Mathematical Association of America (MAA) and National Council of Teachers of Mathematics (NCTM).
While all groups’ views were similar and consistent with research, recent student teachers’ responses suggest
that when preparing future teachers in undergraduate calculus, more emphasis should be placed on connections
to the secondary curriculum and applications in technology.
Since Calculus is an undergraduate entry-level
course for many fields of study, instruction is
generally not geared toward preservice
mathematics teachers. This raises the question
whether this type of learning environment is
conducive to the preparation of a secondary
mathematics teacher. Originally a doctoral
dissertation (Fothergill, 2006), this study examines
mathematics faculty and student teacher responses
to a survey designed to obtain their perceptions of
a theoretical first-semester undergraduate calculus
course specifically designed for preservice
secondary mathematics teachers. While many
aspects of student understanding of calculus have
been researched, this study examines the aspects
to be emphasized in an undergraduate calculus
course designed for preparing preservice
mathematics teachers.
Background
According to the United States Department of
Education (2000), the demand for certified
mathematics teachers is growing at a quicker rate
than the supply. Moreover, Brakke (2000) argued
that to increase the interest in the mathematics
field, higher education must help improve the
quality of K-12 mathematics education programs.
The National Research Council (NRC, 1989)
stated, “No reform of mathematics education is
possible unless it begins with the revitalization of
undergraduate mathematics in both curriculum
and teaching style” (p. 39). While reform in
undergraduate mathematics has started, it has not
gone far enough to incorporate the needs of
preservice mathematics teachers.
As stated by Ferrini-Mundy and Findell
(2001) and Clemens (2001) mathematics faculty
ignored the needs of the preservice mathematics
teachers who were becoming an increasing part of
their department. Though mathematics faculty
focus on mathematics content, Wu (2011) claimed
that they should also focus on the professional
development of future teachers. According to a
RAND Corporation funded Mathematical Study
Panel (Ball, 2003), preservice mathematics
teachers should be prepared for teaching which is
completely different from preparing students to
conduct mathematical research. The report did not
advocate less rigor; instead, it suggested that
preservice teachers needed preparation for the
specific mathematical demands they will face in
the K-12 classroom.
Dr. Lee Fothergill joined the division of Mathematics and
Computer Science at Mount Saint Mary College in Newburgh, NY
following ten years of classroom teaching at the secondary level.
His research interests include the role that mathematics faculty
have in teacher preparation and the connection between
undergraduate and secondary mathematics curricula.

Calculus for Preservice Teachers
24
The Conference Board of Mathematical Sciences
Report (2001) stated that the mathematics department
is partially responsible for the education of
mathematics teachers. Similarly, the NRC (2001)
recommended that mathematics departments assume
greater responsibility for offering courses that provide
preservice mathematics teachers with appropriate
content that is taught using the kinds of pedagogical
approaches that preservice mathematics teachers
should model in their own classrooms. Papick (2011)
suggested the need for specialized courses for future
teachers that address the connection of mathematical
ideas to the topics that are taught in K-12 mathematics
classrooms. According to Bell, Wilson, Higgins and
McCoach (2011), professional development for
inservice teachers has been shown to include
illustrations of pedagogy and connections across
mathematics concepts which lead to growth in
mathematical knowledge for teaching; therefore
undergraduate courses that reflect these qualities
should be available for preservice teachers.
Rationale
With calculus being the capstone course for
mathematics studied at the secondary level, it is
important that preservice teachers have a strong
mathematical teaching knowledge of calculus.
Although not all preservice teachers will teach calculus
at the high school level, it is still imperative that they
understand how the content they are responsible for
teaching relates to their students’ further study in
mathematics. The U.S. Department of Education
(2000, 2002) stated that highly qualified teachers need
to have a deep understanding of subject matter to be
successful in the classroom. This requires developing
teachers who are independent learners who can read,
write, and communicate mathematics. It can be argued
that a teacher with these qualities will be more
confident in making curriculum decisions. Since
calculus is often a preservice teacher’s first college
mathematics course, it is reasonable to study how we
can improve the teaching of calculus to influence the
preparation of preservice mathematics teachers.
The purpose of this study is to explore the
perspectives regarding aspects of calculus that
mathematics faculty and student teachers deem
important and, therefore, that should be
emphasized in an undergraduate calculus course
for preservice teachers. The study was based on
the following questions:
1. What aspects of a calculus course do
undergraduate professors deem most important
when preparing preservice mathematics
teachers?
2. What aspects of calculus do student teachers
deem most important in preparing them to
teach at the secondary level?
Methods
Both faculty and recent student teachers responded
to a survey to rank aspects of calculus they deemed
most important to the undergraduate mathematics
preparation of preservice teachers. Faculty members
who had experience teaching undergraduate calculus
were chosen for the study. In addition, some had
experience teaching secondary mathematics, but this
was not one of the study selection criteria. Recent
student teachers’ perspectives are of interest because,
with their fresh experience in the classroom, and not so
distant experience in a calculus course, they can
discern how their calculus course helped or did not
help them in becoming a secondary mathematics
teacher. Therefore, they can give insightful
recommendations for a calculus course designed
specifically for secondary education mathematics
students.
Survey Development
Recommendations from major mathematical
organizations were used to determine aspects of
calculus that should be emphasized and included in the
survey. The Mathematics Education of Teachers, a
Conference Board of Mathematical Sciences (CBMS)
report (2001), gives specific recommendations for the
mathematical content and pedagogy for the preparation
of secondary school mathematics teachers. It gives the
most detailed outline of the college-level mathematics
that secondary school teachers should be studying and
recommends that preservice teachers’ undergraduate
study should develop:
1. Deep understanding of the fundamental
mathematical ideas in grades 9-12 curricula
and strong technical skills for application of
those ideas.
2. Knowledge of the mathematical
understandings and skills that students acquire
in their elementary and middle school
experiences, and how they affect learning in
high school.
3. Knowledge of mathematics that students are
likely to encounter when they leave high

Lee Fothergill
25
school for collegiate study, vocational training,
or employment.
4. Mathematical maturity and attitudes that will
enable and encourage continued growth of
knowledge in the subject and its teaching. (p.
122)
The report summarizes the benefits of the study of
calculus for preservice secondary level mathematics
teachers, recommending that first year mathematics
education majors take calculus because:
Calculus instructors can provide a useful
perspective for future high school teachers by
giving more explicit attention to the way that
general formulations about functions are used to
express and reason about key ideas throughout
calculus. Its central concepts, the derivative and
the integral, are conceptually rich functions. (p.
133)
More generally, the report suggests the following
goals for the study of mathematics: developing
mathematical maturity, understanding functions, and
having a deep understanding of mathematical ideas and
the skills needed to apply those ideas.
This CBMS report (2001) is aligned with the
National Council of Teachers of Mathematics (NCTM)
standards (2000) and the Undergraduate Programs and
Courses in the Mathematical Sciences 2004 CUPM
Curriculum Guide (Barker, Bressoud, Epp, Ganter,
Haver, & Pollatsek). The NCTM process standards
(2000) include problem solving, reasoning and proof,
connections within and outside mathematics, and
representations of functions. The CUPM curriculum
guide, which helps mathematics departments in
designing undergraduate curricula, recommends
making connections, developing mathematical
thinking, and using a variety of technological tools as
goals for undergraduate calculus. These
recommendations together with trends in calculus
textbooks (Stewart, 2003; Strauss, 2002), informed the
list of aspects that should be used when teaching
calculus to preservice teachers. The survey included
the following aspects:
• proof writing skills using formal definitions
and theorems;
• mathematical reasoning and problem solving
skills;
• strengthen the students’ algebraic skills;
visualization of functions and multiple
representations of functions;
• mathematical maturity and prepares students
for upper-level mathematics;
• mathematical-based technology skills (i.e.
graphing calculator and calculus based
software programs);
• connection between undergraduate
mathematics and high school mathematics
curriculum; and
• application to fields outside of mathematics
Both the faculty and pre-service teacher survey obtained demographics such as professional
backgrounds, gender, years of experience, and highest
degree obtained, as well as opinions about what aspects
of calculus they considered important when teaching
calculus to preservice teachers. The survey student
teachers asked them to rank the top three aspects of an
undergraduate calculus course that would be most
beneficial to pre-service mathematics teachers. In
addition, the student teachers were asked open-ended
questions about their experience in calculus and how it
related to their first teaching experience. Faculty
participants’ survey asked them to rank in order of
importance what they thought were the top three
aspects of calculus that help preservice teachers
become effective educators of secondary school
mathematics. Both faculty and student teacher
participants were asked to give any suggestions for the
creation of a calculus course for preservice teachers.
Participants and Data Collection
The online survey was sent via e-mail to
mathematics departments’ faculty members from four-
year colleges and universities in the United States that
were randomly selected from a list maintained by
University of Texas at Austin (2005). Colleges were
chosen at random and then all faculty from the
institution was emailed. The e-mail explicitly
requested faculty members that had experience
teaching undergraduate calculus to complete the online
survey. However, since the survey was sent to all
faculty members, it was inevitable that faculty
members without experience teaching calculus were
contacted.
Less than ten percent of the fifteen hundred faculty
members responded, which can be partially attributed
to the likelihood that many of the faculty members that
were e-mailed did not fit the survey criteria. Although
the low response rate could impact the validity and
reliability of the study, the response rate is much
higher if we disregard faculty members who were

Calculus for Preservice Teachers
26
invited to participate but did not meet survey criteria.
Hence, these responses can provide useful information
in regard to aspects of calculus that future and current
educators deem important.
Former student teachers who had completed
student teaching within the last year were sent an
online survey. Using the University of Texas at
Austin’s (2005) website, the researcher chose schools
at random and emailed college representatives from
either mathematics or education departments at over
300 four-year colleges and universities in the United
States. The college representative consisted of one of
the following: a mathematics department chairperson,
mathematics education chairperson, secondary
education chairperson, or student teacher supervisor. In
some instances, more than one representative was e-
mailed from each school. The email asked the college
representative to forward the online survey link to
secondary mathematics education students who
completed their student teaching practicum in the past
year. The response rate cannot be determined because
college representatives did not report how many recent
student teacher received the survey link and each
school has a different number of mathematics
education students each year.
Data Analysis
The aspects of calculus that faculty and student
teachers ranked the highest most often were identified
as the aspects that should be emphasized when
teaching calculus to future mathematics teachers. For
each aspect the percentage of respondents ranking it
first, second, or third most important was calculated.
To investigate potential differences, responses from
faculty with secondary teaching experience were
compared against those without such experience.
Lastly, responses from faculty with and without
secondary teaching experience were compared with
student teacher responses.
Results
The 114 faculty respondents consisted of 88 males
and 26 females, with a mean of 20.1 years teaching
experience. Eighty-five faculty members did not have
experience teaching at the secondary level, while
twenty-nine did have experience. Fifty-seven student teachers responded with 17 being male and 40 female.
Faculty Members
Figures 1 and 2 illustrate the overall results of the
online survey given to faculty members.
Overwhelmingly, problem solving received the highest
number of responses with 68 out of 114, approximately
60%, of the faculty members choosing it as the most
important aspect of calculus that should be emphasized
in a calculus course designed for preservice
mathematics teachers. Visualization of functions and
applications outside of mathematics were also
frequently selected. The aspects that received the least
number of responses were technology skills, proof
writing skills, and connection to the HS curriculum.
0.0%
10.0%
20.0%
30.0%
40.0%
50.0%
60.0%
70.0%
Proof Writing
Skills
Problem
Solving
Algebraic
Skills
Visualization
of Functions
Mathematical
Maturity
Technology
Skills
Connection to
HS
Curriculum
Applications
Outside of
Mathematics
Figure 1. Faculty Members percentage of (n = 114)1st,
2nd, and 3rd ranked aspects.
0
20
40
60
80
100
120
Proof Writing
Skills
Problem
Solving
Algebraic
Skills
Visualization
of Functions
Mathematical
Maturity
Technology
Skills
Connection to
HS
Curriculum
Applications
Outside of
Mathematics
Figure 2. Faculty members (n = 114) 1st, 2nd, and 3rd ranked aspects.
The examiner combined all first, second, and third
ranked responses selected for each aspect as shown in
chart 2. For clarity, problem solving received 68, 20,
and 15 responses respectively for first, second, and
third ranking; therefore, problem solving received a
combined response of 104 out of 114 faculty members.
Problem solving had the most combined responses
with approximately 91% of the faculty members
choosing this aspect as one of their top three that they
believe should be emphasized in a calculus course for
1st
2nd
3rd
1st
2nd
3rd

Lee Fothergill
27
preservice mathematics teachers. Visualization of
functions and applications outside the mathematics
curriculum were other top combined responses,
approximately 61% and 56% respectively.
Recent Student Teachers
Figures 3 and 4 illustrate their responses were
similar to faculty with problem solving, visualization of
functions, and applications outside of mathematics
being the aspects of calculus they most often deemed
important. A notable difference was that so few of the
recent student teachers considered proof writing skills
important; only four ranked it among their top three.
0.0%
5.0%
10.0%
15.0%
20.0%
25.0%
30.0%
35.0%
40.0%
Proof Writing
Skills
Problem
Solving
Algebraic
Skills
Visualization
of Functions
Mathematical
Maturity
Technology
Skills
Connection to
HS
Curriculum
Applications
Outside of
Mathematics
Figure 3. Student teachers percentage of (n = 57)1st, 2nd, and 3rd ranked aspects.
0
5
10
15
20
25
30
35
40
45
50
Proof Writing
Skills
Problem
Solving
Algebraic
Skills
Visualization
of Functions
Mathematical
Maturity
Technology
Skills
Connection to
HS
Curriculum
Applications
Outside of
Mathematics
Figure 4. Student teachers (n = 57)1st, 2nd, and 3rd ranked aspects.
Faculty Members With and Without Experience Teaching at the Secondary Level
To investigate possible differences in their
perspectives, the author then divided the faculty
members into two categories: faculty members with
experience teaching at the secondary level and without
experience teaching at the secondary level, hereafter
referred to as faculty with experience and faculty
without experience. The faculty member with no
experience teaching at the secondary level consisted of
68 males and 17 females and had a mean of 20.8 years
experience teaching calculus. The faculty members that
had experience teaching at the secondary level
consisted of 20 males and 9 females, with a mean of
18.1 years experience teaching calculus. Problem solving was chosen by both groups as an
important aspect to emphasize when teaching calculus
to preservice mathematics teachers (see Figure 5). The
chart demonstrates that 92.9% of the faculty without
experience teaching at the secondary level and 86.2%
of the faculty with experience teaching at the
secondary level had selected problem solving as one of
their top three aspects of calculus. Faculty members
with experience had a higher percentage of responses
in visualization of functions, algebra skills, technology
skills, connections to the high school curriculum, and
mathematical maturity as compared to faculty
members without experience. The greatest difference
occurred in the category of visualization of function;
72.4% of faculty with experience had this aspect in
their top three, but only 56.5% faculty without
experience listed it in their top three. It should also be
noted that 10.3% of faculty with experience thought
that connection to high school curriculum was the most
important aspect, whereas not one faculty member
without experience chose that as the most important
aspect.
0.0%
10.0%
20.0%
30.0%
40.0%
50.0%
60.0%
70.0%
80.0%
90.0%
100.0%
Proof Writing
Skills
Problem
Solving
Algebraic
Skills
Visualization
of Functions
Mathematical
Maturity
Technology
Skills
Connection to
HS
Curriculum
Applications
Outside of
Mathematics
Figure 5. Faculty members with (n = 29) and without
(n = 85) teaching experience at the secondary level,
combined 1st, 2nd, and 3rd rankings.
Faculty without experience
Faculty with experience
1st
2nd
3rd
1st
2nd
3rd

Calculus for Preservice Teachers
28
Faculty Members vs. Student Teachers
Figure 6 compares the results of all three groups.
While some aspects seem to have similar results, one
aspect that demonstrated a difference in perceptions
between faculty members with and without experience
and the student teachers was connection to the high
school curriculum. Connection to high school
curriculum was chosen by 8.2% of faculty members
without experience teaching at the secondary level as
one of their top three aspects. Student teachers had
more than doubled the percentage of faculty members
without experience with 17.5% of them choosing the
connection to the high school curriculum as an
important aspect.
Technology skills were chosen by 4.7% of the
faculty members without experience at the secondary
level as one of their top three aspects. In contrast,
10.3% of faculty members with experience put
technology skills as one of their top three aspects more
than doubling that of faculty members without
experience. Moreover, 21.1% of student teachers put
technology skills into their top three aspects making
this percentage four times higher than that of faculty
members without experience.
0.0%
10.0%
20.0%
30.0%
40.0%
50.0%
60.0%
70.0%
80.0%
90.0%
100.0%
Proof Writing
Skills
Problem
Solving
Algebraic
Skills
Visualization
of Functions
Mathematical
Maturity
Technology
Skills
Connection to
HS
Curriculum
Applications
Outside of
Mathematics
Figure 6. Faculty members with (n = 29) and without
(n = 85) teaching experience at the secondary level and
student teachers combined 1st, 2nd, and 3rd rankings.
Discussion
It is interesting to note that faculty and student
teachers agreed with the highest five aspects to be
emphasized in a calculus course designed for
preservice secondary mathematics teachers (see Table
1). With major mathematics affiliations such as the
MAA and NCTM promoting problem solving, it is no
surprise that problem solving was ranked by both the
faculty members and student teachers as the most
important aspect to be emphasized in a first semester
undergraduate calculus course designed for preservice
mathematics teachers.
However, an argument can be made that
undergraduate calculus is not meeting all the needs of
prospective secondary mathematics teachers. While
student teacher perceptions agreed with the faculty’s in
most aspects, student teachers ranked technology skills
and connections to secondary curriculum higher than
did faculty. Since faculty perceptions differ from the
student teachers in these aspects, faculty members may
not be meeting these needs. These results indicate that
preservice teachers value making connections to the
mathematics they will be teaching and that to better
meet their needs college should put greater emphasis
on making connections to the secondary curriculum
and technology in their coursework for preservice
teachers.
Table 1
Comparison of Faculty and Student Teacher Top Three Responses Combined
Faculty
Student
teachers
1. Problem solving 91.2% 77.2%
2. Visualization of functions 60.5% 65.0%
3. Applications outside of
mathematics 56.1% 43.9%
4. Mathematical maturity 37.7% 36.8%
5. Algebraic skills 28.1% 31.6%
6. and 7. Proof writing skills 14.0% 7.0%
7. Connections to HS curriculum 9.6% 17.5%
7 and 6. Technology skills 6.1% 21.1%
Recommendations
A first calculus course can provide an initial
training ground for preservice teachers. It may benefit
colleges with a large secondary mathematics education
population to develop a calculus course designed
specifically for preservice mathematics teachers, so
that vertical connections can be made between high
school and college level mathematics. This can provide
prospective teachers with content knowledge, as well
Faculty without experience
Faculty with experience
Student teachers

Lee Fothergill
29
as pedagogical knowledge that can be used in their
future secondary teaching.
There are many connections that can be made
while teaching calculus to preservice teachers and
these connections need to be explicit. When taught at
the secondary level, logarithmic functions may seem
an abstract concept with limited application. Hence,
when teaching logarithmic differentiation to preservice
teachers, the instructor can make explicit reference to
logarithmic functions and rules of logarithmic
expressions taught at the secondary level. The process
of finding the n-th derivative of the sine function is
similar to finding the value of i to the n-th power, a
common part of algebra in secondary mathematics
curriculum. The instructor can use the derivative to
connect the concept of finding a relative minimum or
maximum value of a function to the concept of finding
the derivation of the formula for the axis of symmetry
of a parabola.
Calculus is the culminating course of high school
mathematics; therefore, preservice teachers should
have a deep understanding of this content. As the
instructors for this course, mathematics faculty
members have a responsibility for preparing future
teachers. Mathematics faculty members teaching
calculus to future teachers should be teaching in a way
that meets the needs of their students and helps them
develop as professional educators.
Limitations & Further Research
While this study suggests that there are
differences in perspectives on calculus between faculty
members and future teachers, further research is still
needed. One might argue that student teachers may not
have enough experience to connect what they learned
in a calculus course to the high school curriculum.
Student teachers have a somewhat limited experience
at the secondary level and their student teaching
experiences can vary greatly. Some may say it is too
early in their teaching career to make judgments about
what is needed in a calculus course for preservice
teachers. On the other hand, the student teachers’
responses mostly matched the faculty responses and
established research, lending credence to their
perceptions of their learning needs. In future studies
one might include more experienced inservice teachers
who are more familiar with what makes teachers
successful and who are better able to reflect on their
learning of calculus. Further research could also
include how other undergraduate courses, required for
preservice teachers, such as linear algebra, abstract
algebra, and geometry could be modified to benefit
them.
REFERENCES
Ball, D. L. (2003). Mathematical proficiency for all students:
Toward a strategic research and development program in
mathematics education. Santa Monica, CA: RAND
Corporation.
Barker, W., Bressoud, D., Epp, S.,Ganter, S., Haver, B.,&
Pollatsek, H. (2004). Undergraduate programs and courses in
the mathematical sciences: CUPM curriculum guide 2004.
Washington, DC: MAA
Bell, C., Wilson, S., Higgins, T., & McCoach, D. (2011).
Measuring the effects of professional development on teacher
knowledge: The case of developing mathematical ideas.
Journal for the Research in Mathematics Education, 41, 497–
512.
Brakke, D. F. (2000). Higher education and its responsibility to K-
12 schools – the essential pipeline for future scientists,
mathematicians, and engineers. AWIS Magazine, 29, 32–33.
Clemens, H. (2001). The mathematics-intensive undergraduate
major. In CUPM discussion papers about mathematics and the
mathematical sciences in 2010: What should students know?
(pp. 21–30). Washington, DC: Mathematical Association of
America.
Conference Board of the Mathematical Sciences. (2001). The
mathematical education of teachers. Providence, RI &
Washington, DC: American Mathematical Society and
Mathematical Association of America.
Ferrini-Mundy, J., & Findell, B. R. (2001). The mathematical
education of prospective teachers of secondary school
mathematics: Old assumptions, new challenges. In CUPM
discussion papers about mathematics and the mathematical
sciences in 2010: What should students know? (pp. 31–41).
Washington, DC: Mathematical Association of America
Fothergill, Lee. (2006). Calculus for preservice teachers: Faculty
members' and student teachers' perceptions. Un published
doctoral Ddissertation), Teachers College Columbia
University, New York.
National Council of Teachers of Mathematics. (2000). Principles
and standards for school mathematics. Reston, VA: Author.
National Research Council. (2001). Educating teachers of science,
mathematics, and technology: New practices for the new
millennium. Washington, DC: National Academy Press.
National Research Council. (1989). Everybody counts: A Report to
the Nation on the Future of Mathematics Education.
Washington, DC: National Academy Press.
Papick, Ira. J. (2011). Strengthening the mathematical content
knowledge of middle and secondary school mathematics
teachers. Notices of the American Mathematical Society, 58,
389–392.
Stewart, J. (2003). Calculus: Early transcendentals (5th ed.).
Brooks/Cole: Pacific Grove, CA.
Strauss, M., Bradley, G., & Smith, K. (2002). Calculus (3rd ed.).
Upper Saddle River, NJ: Prentice Hall.
Triesman, U. (1992). Studying students studying calculus: A look
at the lives of minority mathematics students in college.
College Mathematics Journal, 23, 362–372.

Calculus for Preservice Teachers
30
The University of Texas at Austin, (2005). Universities: by state.
Retrieved from
http://www.utexas.edu/world/univ/state/.
U. S. Department of Education. (2000). Before it's too late: A
report to the nation from The National Commission on
Mathematics and Science Teaching for the 21st Century.
Retrieved from http://www.ed.gov/americacounts/glenn/
U.S. Department of Education, Office of Postsecondary Education
(2002). Meeting the highly qualified teachers challenge: The
secretary's annual report on teacher quality. Washington, DC.
Wu, H. (2011). The mis-education of mathematics teachers.
Notices of the American Mathematical Society, 58, 372–383.

Lee Fothergill
31
APPENDIX
Faculty Member Survey
Gender: M or F Years teaching Calculus: __________
Do you have experience teaching at the secondary level? : _________
Highest Degree Earned: _________
Please rank the following statements about aspects of calculus that you believe helps pre-service teachers become
effective educators of secondary school mathematics. Please put 1 next to the most important, 2 next to the second
most important, and 3 next to the third most important.
____ Calculus helps to develop proof writing skills using formal definitions and theorems.
____ Calculus helps to develop mathematical reasoning and problem solving skills.
____ Calculus strengthens the students’ algebraic skills.
____ Calculus helps develop an understanding and visualization of functions and multiple representations of
functions.
____ Calculus builds mathematical maturity and prepares students for upper-level mathematics.
____ Calculus facilitates the development of mathematical-based technology skills (i.e. graphing calculator and
calculus based software programs).
____ Calculus demonstrates a connection between undergraduate mathematics and high school mathematics
curriculum.
____ Calculus provides insight into its application to fields outside of mathematics.
Please indicate any other aspect that you believe help pre-service teachers.
Do you feel your answers would differ, if asked about non-mathematics education majors?
Student Teachers Survey
Gender: ______
Please rank the following statements about aspects of calculus that you believe helps pre-service teachers become
effective educators of secondary school mathematics. Please put 1 next to the most important, 2 next to the second
most important, and 3 next to the third most important.
____ Calculus helps to develop proof writing skills using formal definitions and theorems.
____ Calculus helps to develop mathematical reasoning and problem solving skills.
____ Calculus strengthens the students’ algebraic skills.
____ Calculus helps develop an understanding and visualization of functions and multiple representations of
functions.
____ Calculus builds mathematical maturity and prepares students for upper-level mathematics.
____ Calculus facilitates the development of mathematical-based technology skills (i.e. graphing calculator and
calculus based software programs).
____ Calculus demonstrates a connection between undergraduate mathematics and high school mathematics
curriculum.
Please indicate any other aspect that you believe help pre-service teachers.

The Mathematics Educator
2011, Vol. 21, No. 1
32

The Mathematics Educator
2011, Vol. 21, No. 1, 33–47
33
1 The work on this curriculum development and research was supported by the National Science Foundation under Grant No.
DUE 0442319 and DUE 0817253 awarded to North Carolina State University. Any opinions, findings, and conclusions or
recommendations expressed herein are those of the authors and do not necessarily reflect the views of the National Science
Foundation. More information about the project and materials can be found at http://ptmt.fi.ncsu.edu.
Enhancing Prospective Teachers’ Coordination of Center and Spread: A Window into Teacher Education Material
Development1
Hollylynne S. Lee & J. Todd Lee
This paper describes a development and evaluation process used to create teacher education materials that help
prepare middle and secondary mathematics teachers to teach data analysis and probability concepts with
technology tools. One aspect of statistical reasoning needed for teaching is the ability to coordinate
understandings of center and spread. The materials attempt to foster such coordination by emphasizing
reasoning about intervals of data rather than a single focus on a point estimate (e.g., measure of center). We take
a close look at several different data sources across multiple implementation semesters to examine prospective
mathematics teachers’ ability to reason with center and spread in a coordinated way. We also look at the
prospective teachers’ ability to apply their understandings in pedagogical tasks. Our analysis illustrates the
difficulty in both achieving this understanding and transferring it to teaching practices. We provide examples of
how results were used to revise the materials and address issues of implementation by mathematics teacher
educators.
Data analysis, statistics, and probability are
becoming more important components in middle and
high school mathematics curricula (National Council
of Teachers of Mathematics, 2000; Franklin et al.,
2005). Therefore, university teacher educators are
challenged with how to best prepare prospective
mathematics teachers to teach these concepts. The
challenge is exacerbated by the fact that many of these
prospective teachers have not had meaningful
opportunities to develop an understanding of pivotal
statistical and probabilistic ideas (e.g., Stohl, 2005).
Although simulation and data analysis tools—graphing
calculators, spreadsheets, Fathom, TinkerPlots,
Probability Explorer—may be available in K-12
classrooms, there is a need for high quality teacher
education curriculum materials. Such curriculum
materials can help teacher educators become
comfortable with and incorporate tools for teaching
probability and data analysis. These teacher education
curricula need to primarily aim for prospective teachers
to develop a specific type of knowledge related to
statistics that includes a deeper understanding of: (a)
data analysis and probability concepts, (b) technology
tools that can be used to study those concepts, and (c)
pedagogical issues that arise when teaching students
these concepts using technology (Lee & Hollebrands,
2008b; Lesser & Groth, 2008).
The authors of this paper are part of a team
engaged in a teacher education materials development
project, funded by the National Science Foundation, to
create units of course materials—modules with about
18-20 hours of class materials with additional
assignments—to integrate technology and pedagogy
instruction in various mathematical contexts. The
project intends to create three modules that could be
distributed separately and used in mathematics
education methods courses, mathematics or statistics
content courses for teachers, or professional
development workshops focused on using technology
to teach mathematics and statistics. The modules are
not designed for teachers to use directly with their
students. Rather, the developers anticipate that after
using the materials teachers will have the knowledge
needed to create their own technology-based activities.
The three modules will focus on the teaching and
Dr. Hollylynne Stohl Lee is an Associate Professor of Mathematics
Education at North Carolina State University. Her research
interests include the teaching and learning of probability and
statistics with technology.
Dr. J. Todd Lee is a Professor of Mathematics at Elon University.
He is interested in undergraduate mathematics education,
including the probability and statistics learning of pre-service
teachers.

Coordination of Center and Spread
34
learning of data analysis and probability, geometry,
and algebra.
The first module focuses on learning to teach data
analysis and probability with technology tools,
including TinkerPlots, Fathom, spreadsheets, and
graphing calculators (Lee, Hollebrands, & Wilson,
2010). This module is designed to support a broad
audience of prospective secondary teachers. For many
prospective teachers, engaging in statistical thinking is
a different process than that which they have been
engaged in teaching and learning mathematics (e.g.,
delMas, 2004). Thus, it is important to engage
prospective teachers as active learners and doers of
statistics. The module incorporates several big ideas
that can support teachers as they learn to teach data
analysis and probability: engaging in exploratory data
analysis; attending to distributions; conceptually
coordinating center and spread in data and probability
contexts; and developing an understanding of, and
disposition towards, statistical thinking as different
from mathematical thinking. For this paper, we focus
solely on one of these big ideas as we discuss the
material development process using the following
guiding question: How can we use technology tools to
enhance prospective mathematics teachers’
coordination of center and spread? We analyzed
several forms of data to revise the teacher education
materials. The results provide insight into ways
prospective mathematics teachers may reason about
center and spread in a coordinated way.
Why Focus on Coordinating Center and Spread?
Coordinating measures of center and spread has
been identified as a central reasoning process for
engaging in statistical reasoning (e.g., Friel, O’Connor,
& Mamer, 2006; Garfield, 2002; Shaughnessy, 2006).
In particular, Garfield (2002) noted that part of
reasoning about statistical measures is “knowing why a
good summary of data includes a measure of center as
well as a measure of spread and why summaries of
center and spread can be useful for comparing data
sets” (Types of Correct and Incorrect Statistical
Reasoning section, para. 11).
Single-point indicators, used as a center of a
distribution of data (e.g., mean or median) or as an
expected value of a probability distribution, have been
over-privileged in both mathematics curricula
(Shaughnessy, 2006) and statistical research methods
(Capraro, 2004). When used with samples, single-point
central indicators may not be accurate signals of what
is likely an underlying noisy process (Konold &
Pollatsek, 2002). Many others argue that attending to
variation is critical to developing an understanding of
samples and sampling distributions (e.g., Franklin et al,
2005; Reading & Shaughnessy, 2004; Saldanha &
Thompson, 2002; Shaughnessy, 2006).
Understanding variability, both within a single
sample and across multiple samples, can be fostered
through attending to intervals: Intervals embody both
central tendency and spread of a data set (Reading &
Shaughnessy, 2004). Attending to intervals aligns well
with the many voices of concern in professional
communities on the limitation of null hypothesis
significance testing, which rely on single-point p-
values. For example, the medical industry has taken
major moves toward examining and reporting data
through alternative tools, confidence intervals being
foremost (Gardner & Altman, 1986; International
Committee of Medical Journal Editors, 1997). Other
areas, such as psychology, ecology, and research in
mathematics education, are also moving in this
direction (Capraro, 2004; Fidler, 2006).
When describing expected outcomes of a random
process, interval thinking can make for a powerful,
informative paradigm shift away from single-point
estimates. Statistics education researchers have
advocated this shift in focus (e.g., Reading &
Shaughnessy, 2000, 2004; Watson, Callingham, &
Kelly, 2007). For example, in a fair coin context,
describing the number of heads that may occur when
tossing a coin 30 times is better described as “typically
about 12 to 18 heads” rather than “we expect 15
heads.” The latter statement does not acknowledge the
variation that could occur. As Reading and
Shaughnessy (2000, 2004) have noted, many students
will initially provide single point values in tasks asking
for expectations from a random process, but this is
likely related to the common use of such questions as
“‘What is the is the probability that …?’ Probability
questions just beg students to provide a point-value
response and thus tend to mask the issue of the
variation that can occur if experiments are repeated”
(p. 208, Reading & Shaughnessy, 2004). Explicitly
asking for an interval estimate may illicit a classroom
conversation that focuses students’ attention on
variation.
Prospective and practicing teachers have
demonstrated difficulties similar to middle and high
school aged students in the following areas:
considering spread of a data set as related to a measure
of center (Makar & Confrey, 2005), appropriately
accounting for variation from an expected value
(Leavy, 2010), and a tendency to have single-point
value expectations in probability contexts (Canada,
2006). Thus, there is evidence to suggest mathematics

Hollylynne S. Lee & J. Todd Lee
35
educators should help prospective teachers develop an
understanding of center and spread that can allow them
and their students to reason appropriately about
intervals in data and chance contexts. The aim of our
materials development and evaluation efforts reported
in this paper is to document one attempt to foster such
reasoning and to reflect upon how the evaluative
results informed improving the materials and
suggestions for future research.
Design Elements in Data Analysis and Probability
Module
From 2005 to 2009, the Data Analysis and
Probability module materials for prospective secondary
and middle mathematics teachers were developed,
piloted, and revised several times. To facilitate
understanding of measures of center and spread in a
coordinated way, Lee et al. (2010) attempted to do the
following:
1. Emphasize the theme of center and spread
throughout each chapter in the material, with the
coordination between the two explicitly discussed
and emphasized through focused questions
covering both content and pedagogical issues.
2. Use dynamic technology tools to explore this
coordination.
3. Place the preference for intervals above that of
single-point values even if the construction of
these intervals is reliant upon measures of center
and spread.
Lee et al., with consultation from the advisory board
and a content expert, attempted to attend to these
elements, along with other design elements aimed at
developing prospective teachers’ understanding of data
analysis and probability, technology issues, and
appropriate pedagogical strategies. A discussion of the
design of the entire module as it focuses on developing
technological pedagogical content knowledge for
statistics is discussed in Lee and Hollebrands (2008a,
2008b).
Methods
The project team followed curricular design and
research method cycles as proposed by Clements
(2007), including many iterations of classroom field-
testing with prospective teachers, analysis of field-
testing data, and subsequent revisions to materials. Our
primary research site, a university in the Southeast
region of the US, has consistently implemented the
module in a course focused on teaching mathematics
with technology serving third- and fourth-year middle
and secondary prospective teachers and beginning
graduate students who need experience using
technology. A typical class has between 13 and 19
students. In Fall 2005, during the five-week data
analysis and probability module, the instructor used the
pre-existing curriculum for the course to serve as a
comparison group to the subsequent semesters. The
students took a pretest and posttest designed to assess
content, pedagogical, and technology knowledge
related to data analysis and probability.
In each of the subsequent semesters from 2006-
2007, the same instructor as in Fall 2005 taught a draft
of the five-week Data Analysis and Probability module
from our textbook (Lee et al., 2010) with a request that
the curriculum be followed as closely as possible. In
addition, the module was implemented in a section of
the course taught by a different instructor, one of the
authors of the textbook, in Spring 2007. During the
first two semesters of implementation, class sessions
were videotaped and several students were
interviewed. In the first three semesters of
implementation, written work was collected from
students and pre- and post-tests were given. Since
2007, many other instructors have used the materials at
institutions across the US and improvements and slight
modifications were made based on instructor and
student feedback, with final publication in 2010 (Lee et
al.).
For this study, we are using several sources of data
for our analysis of how prospective teachers may be
developing a conceptual coordination between center
and spread in data and probability contexts, with a
particular focus on interval reasoning. Our data sources
include: (a) examples of text material from the module,
(b) a video episode from the first semester of
implementation in which prospective teachers are
discussing tasks concerning probability simulations, (c)
prospective teachers’ work on a pedagogical task, and
(d) results from the content questions on the pre- and
post-tests across the comparison and implementation
semesters through Spring 2007.
Analysis and Results
We discuss the analysis and results according to
the four data sources we examined. In each section we
describe the analysis processes used and the associated
results.
Emphasis in Materials: Opportunities to Learn
To begin our analysis, we closely examined the
most recent version of the text materials for
opportunities for prospective teachers to develop a
coordinated conceptualization between center and

Coordination of Center and Spread
36
spread. The materials begin by helping prospective
teachers informally build and understand measures of
center and spread in the context of comparing
distributions of data (Chapter 1) and then explore a
video of how middle grades students compare
distributions (Chapter 2).
In Chapter 3, prospective teachers consider more
deeply how deviations from a mean are
used to compute measures such as variation and
standard deviation. In Chapter 4, the materials build
from this notion in a univariate context to help students
consider measures of variation in a bivariate context
when modeling with a least squares line. The focus on
spread and useful intervals in a distribution continues
in Chapters 5 and 6 where prospective teachers are
asked to describe distributions of data collected from
simulations, particularly attending to variation from
expected values within a sample, and variation of
results across samples. These last two chapters help
prospective teachers realize that smaller sample sizes
are more likely to have results that vary considerably
from expected outcomes, while larger sample sizes
tend to decrease this observed variation.
We only considered places in the text materials
where the authors had made an explicit reference to
these concepts in a coordinated way as opportunities
for prospective teachers to develop a conceptualization
of coordinating center and spread. We closely
examined the text materials to identify instances where
there was an explicit emphasis placed on coordinating
center and spread in (a) the written text and technology
screenshots, (b) content and technology tasks, and (c)
pedagogical tasks. One researcher initially coded each
instance throughout the textbook, the researchers then
conferred about each coded instance to ensure that both
agreed that an instance was legitimate. We tallied the
final agreed-upon instances in each chapter as
displayed in Table 1. We also specifically marked
those instances addressing coordinating center and
spread that placed special emphasis on promoting
interval reasoning as displayed in Table 1. For an
example of instances coded as focused on interval
reasoning, see Table 2. The point of this content
analysis was to identify where and how often the
authors of the materials had actually provided
opportunities for prospective teachers to coordinate
center and spread and engage in reasoning about
intervals. This analysis could also point out apparent
gaps where opportunities may have been missed to the
author team.
As seen in Table 1, every chapter contained
content and technology tasks as well pedagogical tasks
that emphasized the coordination of center and spread.
This coordination was discussed in the text along with
any diagrams and technology screenshots in all but
Chapter 2 (which is a video case with minimal text),
with slightly heavier emphases in Chapters 4 and 5.
Chapters 5 and 6 have the most content and technology
tasks focused on coordinating center and spread. Of
particular importance is that an explicit focus on
interval reasoning only appears in Chapter 1, 5, and 6,
with Chapter 5 containing a particularly strong
emphasis. Although evidence suggests the design of
the materials provides opportunities to build
understanding of center and spread throughout,
attention to this in the early versions of the materials is
uneven, particularly in terms of emphasizing interval
reasoning.
Table 1
Instances in Module of Coordinating Center and Spread
Instances of coordinating center and spread
Text
Content &
technology. task
Pedagogical
task
Percent of
instances with
focus on interval
reasoning
Ch 1: Center, Spread, & Comparing Data Sets 3 5 2 50%
Ch 2: Analyzing Students’ Comparison of Two Distributions using
TinkerPlots
0 2 2 0%
Ch 3: Analyzing Data with Fathom 2 5 3 0%
Ch 4: Analyzing Bivariate Data with Fathom 5 3 3 0%
Ch 5: Designing and Using Probability Simulations 4 13 4 76%
Ch 6: Using Data Analysis and Probability Simulations to
Investigate Male Birth Ratios
1 15 1 59%

Hollylynne S. Lee & J. Todd Lee
37
Table 2
Examples of Instances in Materials Coded as Opportunities to Coordinate Center and Spread and Promote Interval
Reasoning
Written text and screenshots Content and technology tasks Pedagogical tasks
Students may attend to clumps and gaps in
the distribution or may notice elements of
symmetry and peaks. Students often
intuitively think of a “typical” or “average”
observation as one that falls within a modal
clump…Use the divider tool to mark off an
interval on the graph where the data appear
to be clumped.
(Chapter 1, Section 3, p. 11)
Q17: Use the Divider tool and the Reference
tool to highlight a clump of data that is
“typical” and a particular value that seems to
represent a “typical” salary. Justify why your
clump and value are typical. (Chapter 1,
Section 3, p. 13)
Q19: How can the use of the dividers to
partition the data set into separate regions be
useful for students in analyzing the spread,
center and shape of a distribution? (Chapter
1, Section 3, p. 14)
In our context, we are interested in how
much the proportion of freshmen returning to
Chowan College will vary from the expected
50%. To examine variation from an expected
proportion, it is useful to consider an interval
around 50% that contains most of the sample
proportions.
(Chapter 5, Section 3, p.102)
Q11. Given a 50% estimate for the
probability of retention, out of 500 freshmen,
what is a reasonable interval for the
proportion of freshmen you would expect to
return the following year? Defend your
expectation. (Chapter 5, Section 3, p. 100)
Q16. If we reduced the number of trials to
200 freshmen, what do you anticipate would
happen to the interval of proportions from
the empirical data around the theoretical
probability of 50%? Why? Conduct a few
samples with 200 trials and compare your
results with what you anticipated. (Chapter 5,
Section 3, p. 103)
Q19. Discuss why it might be beneficial to
have students simulate the freshman
retention problem for several samples of
sample size 500, as well as sample sizes of
200 and 999. (Chapter 5, Section 3, p. 103)
[Implied emphasis on interval reasoning
because it is one of the follow-up questions
to Q16.]
Classroom Episode from Chapter 5
Because Chapter 5 contained the largest focus on
coordinating center and spread via interval reasoning,
we analyzed a 2.5 hour session of a class engaging in
Chapter 5 material from the first implementation cycle.
The researchers viewed the class video several times
and critical episodes (Powell, Francisco, & Maher,
2003) were identified as those where prospective
teachers or the teacher educator were discussing
something that had been coded as an “instance” in
Chapter 5 as seen in Table 1. Each critical episode was
then more closely viewed to examine how the
reasoning being verbalized by prospective teachers or
the teacher educator indicated an understanding of
coordinating center and spread and the use of interval
reasoning.
It is not possible to present a detailed analysis of
the entire session; however we present classroom
discussions around several of the interval reasoning
tasks shown in Table 2. Consider the following
question posed in the text materials:
Q11: Given a 50% estimate for the probability
of retention, out of 500 freshmen, what is a
reasonable interval for the proportion of
freshmen you would expect to return the following year? Defend your expectation.
This question follows material on the technical
aspects of using technology to run simple simulations
and how to use these simulations as a model for real
world situations. Immediately prior to Question 11
prospective teachers are asked to write (but not run) the
commands needed on a graphing calculator that would
run multiple simulations of this scenario. In answering
Question 11, several prospective teachers propose three
intervals they considered to be reasonable for how
many freshmen out of 500 they expect to return the
following year at a college with a 50% retention rate;
230-270, 225-275, and 175-325. The teacher educator
asked a prospective teacher to explain his reasoning for

Coordination of Center and Spread
38
the interval 230-270. (T denotes teacher educator and
PT denotes a prospective teacher)
T: Can you tell me why you widened the
range?
PT1: I didn’t, I narrowed it
T: Tell me why you narrowed it
PT1: 500 is a big number. So I thought it
might be close to 50%.
T: So you thought because 500 is a big
number it would be closer to
PT1: Half
T: To half, closer to 50%. So, MPT1
[who proposed an interval of 175-
325], why did you widen the range?
This [pointing to 225-275 on board]
was the first one thrown out, why did
you make it bigger?
PT2: Well it’s all according to how long
you’re going to do the simulation.
T: Out of 500 students how many [slight
pause] what range of students will
return? Do you think it will be exactly
50% return?
PT2: Probably not
T: So for any given year, what range of
students might return, if you have 500
for ever year?
PT2: 175 to 325
T: Ok. So can you tell me why?
PT2: Without knowing anything I wouldn’t
go to a tight range.
T: Because you don’t have enough
information.
PT3: It’s like the coin flips; you have some
high and some low, so it might not fall
into the 225 to 275 interval.
PT4: I’d say it will most likely fall into that
first range, but it’s not a bad idea to be
safe and say it can go either way.
First, all intervals were given in frequencies, rather
than proportions. This is likely an artifact of the
wording of Question 11 during that implementation
cycle. In that version of the materials, the question did
not specifically use the word proportion. All intervals
suggested by the prospective teachers are symmetric
around an expected retention of 250 (50%) of 500
freshmen. Two of the intervals have widths less than
10% of the range, or a maximum variation of 5% from
the mean, while the largest proposed interval 175-325
suggests a variation of ±15%. The smaller intervals
have around 93% and 98% chances of containing the
future retention proportion, while the largest interval
will succeed with an almost mathematical certainty.
While one prospective teacher reasoned that 500 is a
large enough sample to expect values “close” to 50%,
another is much more tentative and casted a wider net
due to an uncertainty about the number of times the
simulation would be run. This prospective teacher, and
the two that responded afterward, may be trying to
capture all possible values, rather than consider a
reasonable interval that would capture most values. Or
they may merely be dealing with the difficulties of
estimating the binomial distribution of 500 trials. Only
one prospective teacher justified an interval by
explicitly reasoning from an expected value, and there
were no justifications. The teacher educator did not
question why the intervals were symmetric about the
expected value. The reasoning of the prospective
teacher is similar to that noticed by Canada (2006) in
his research with prospective elementary teachers.
Canada noted, “almost all of my subjects pointed out
that more samples would widen the overall range,
while very few subjects suggested that more samples
would also tighten the subrange capturing most of the
results” (p. 44).
After about 30 minutes of exploration using a
calculator to run simulations, the teacher educator
asked each prospective teacher to run two simulations
of the “50% retention rate of 500 freshmen” and
compute the proportion of freshmen returning. The
teacher educator collected and displayed this data as a
dot plot in Fathom (Figure 1). This is the second time
during this lesson the teacher educator used Fathom to
collect data from individual’s samples and display
them as a distribution. This teacher educator’s move
was not suggested in the curriculum materials;
however its value in indicating a public record and
display of pooled class data is duly noted and used in
revisions to suggest such a way to display class data in
aggregate form.

Hollylynne S. Lee & J. Todd Lee
39
Retetention
0.42 0.46 0.50 0.54
Freshman Classes Dot Plot
Figure 1. Distribution of 34 sample proportions pooled from class and displayed.
The plot in Figure 1 appears quite typical for what
might occur with 34 samples of 500, with a modal
clump between 0.48 and 0.51. The teacher recalls the
predicted intervals and asks:
T: If we take a look at the distribution of
this data in a graph [displays
distribution in Figure 1], is that kind of
what you would assume? We ran the
simulation of 500 freshman 34 times.
So we notice, we assumed 50%. Are we
around 50%? How many times are we
at 50%?
PT: One
T: Here are your predictions from earlier
on the number of students you might
see in a range [three proposed
intervals]. Our proportion range is about
from 0.44 to 0.53. Think any of these
ranges for the students are too wide or
too narrow…?
The teacher educator immediately drew attention
to the expected value of 50% and variation from that
expectation with comments of “around 50%” and “at
50%.” The conversation shifted as the teacher educator
appeared to draw their attention to the entire range of
proportion values, rather than on a modal clump
around the expected value. It appears that both the
teacher educator and the prospective teachers
interpreted the request for a “reasonable interval” in
the textbook question to mean the range of all sample
proportions likely to occur, or that do occur.
The discussion continued as the teacher educator
had the prospective teachers use an algorithm to
convert the proportion range, which was re-estimated
as 0.43-0.55, to frequencies 215-275 so they could
compare the predicted intervals. They noted the
similarity of the sample range to two of the proposed
intervals, and they noted that the range is not
symmetric around 0.5 and therefore is “not like we
thought” [FPT1]. The teacher educator then focused
the class back on the expected value of 50% and asked
why they did not get more samples with a retention of
50%. One prospective teacher offered a reason related
to a low sample size and another suggested the
graphing calculator’s programming may be flawed.
Another prospective teacher countered the idea:
PT: If it [graphing calculator] is
programmed to act randomly, it is not
going to recognize any particular value.
And it will..., point 5 is the theoretical
value. But the actual values don’t have
to be point 5, they should be close to
point 5, which most of them are.
The teacher educator did not pursue the
conversation about the graphing calculator, but instead
asked a question based on Question 16, as seen in
Table 2, and two questions that follow in the text. We
will use this conversation to consider how students
reason about the relationship between sample size and
variation from the expected center.
T: So let’s say instead of doing 500
freshmen, we would decrease this set to
200. How do you think the range might
differ, or if we increased to 999 how
might the range of proportions be
different?
PT: It would be narrower.
T: Narrower for which way, if we reduced
to 200 or increased to 999?
PT: 999
T: Why do you think it would be
narrower?
PT: The more trials there are, the closer it
will be to the true mean.
T: [Asks students if they agree, about half
the class raise their hand.]
… …. [Other prospective teachers make
similar comments.]
T: If we decrease to 200 trials in each
sample from 500 do you expect the
range to be similar or do you expect it
to be wider or narrower or similar??
PT: Wider. With a smaller sample you will
have more variability.

Coordination of Center and Spread
40
T: So you are going with the idea that a
smaller sample will have more
variability. Does everyone agree or
disagree? [many prospective teachers
say agree].
This episode suggests that at least some
prospective teachers were developing an understanding
of the relationship between the freshman class size and
the variation in the distribution of sample proportions
from repeated samples. This suggests that although
they may have not initially approached the task with an
expectation of an appropriate interval for what might
be typical, many came to reason, through the extended
activity and repeated simulations, that the reasonable
interval widths were affected by sample size. This
again aligns with Canada’s (2006) result that his
instructional intervention helped more of the
prospective elementary teachers consider the role of
sample size as an influence on the variation of results
around the expected value.
It seems as though explicitly asking about intervals
provided opportunities for class discussions that went
beyond the discussion of a single expected value, in
this case 50%. Such an opportunity can help develop
the notion that with random processes comes variation,
and that understanding how things vary can be
developed through reasoning about intervals rather
than merely point-estimates of an expected center
value. However, symmetry may well have been
strongly used due to the retention rate being 50%; it
may be beneficial to incorporate an additional question
using retention rates other than 50%.
Pedagogical Task Following Chapter 5
The ultimate goal of these materials is to develop
prospective teachers’ abilities to design and implement
data analysis and probability lessons that take
advantage of technology. Fortunately, there are many
opportunities within the materials to engage in
pedagogical tasks. One such task followed the
previously described prospective teachers’ work in
Chapter 5. As a follow-up to our examination of the
classroom interactions for Chapter 5, we examined
how these same prospective teachers may have applied
their developing understandings in a pedagogical
situation. The task describes a context in which college
students are able to randomly select from three gifts at
a college bookstore and then asks:
Explain how you would help students use
either the graphing calculator, Excel, or
Probability Explorer to simulate this context.
Explicitly describe what the commands
represent and how the students should
interpret the results. Justify your choice of
technology.
Of particular interest to us was whether
prospective teachers would plan to engage their
students in using large sample sizes, using repeated
sampling, and using proportions rather than
frequencies to report data. We also were interested in
whether they would promote or favor interval
reasoning in lieu of point-value estimates.
Each prospective teacher submitted a written
response to this task. Seventeen documents were
available for analysis. Each response was summarized
with respect to several categories: (a) which
technology was chosen and why, (b) how the tool
would generally be used, (c) what use was made of
sampling and sample size, (d) how representations for
empirical data would be used, and (e) what they want
students to focus on in their interpretation. The
summaries were used to identify patterns across cases
as well as interesting cases.
The majority chose to use a graphing calculator (10
of 17), only 5 of the 17 prospective teachers planned
experiences for their students that incorporated
repeated samples, and only 7 used proportions. In
addition, 10 prospective teachers focused explicitly on
a point estimate, one used both a point and interval
estimate for interpreting a probability, while six of the
responses to the task were not explicit enough to tell
what the prospective teacher intended. Thus, the
majority planned for students to simulate one sample
(sample sizes vary across lessons, but many were less
than 50) and to make a point estimate of the probability
from that sample.
The prospective teachers did not provide much
evidence, during the week immediately following their
discussion of the material in Chapter 5, that they were
able to transfer their developing understandings of
interval reasoning in a probability context to a
pedagogical situation. It seems that, for most, any
progress made during the class discussions did not
have a transference effect into their pedagogy.
Pre- and Post- Tests
Pre- and post-tests were used to create a
quantitative measure that might indicate prospective
teachers’ conceptual changes. The 20 questions
comprising the content section of the pre- and post-
assessment were selected from Garfield (2003) and
other items from the ARTIST database
(http://app.gen.umn.edu/artist/index). These items
assess general statistical reasoning concerning concepts

Hollylynne S. Lee & J. Todd Lee
41
included in the text materials (e.g., coordinating center
and spread, interpreting box plots, interpreting
regression results and correlations). These questions
were administered to the prospective teachers both
before and after the Data Analysis and Probability
module, and the scores were combined pair-wise as
normalized gains. By normalized gains, we mean the
percentage increase of a student’s available
advancement from the pre- to post-test (Hake, 1998).
Figure 2. Distribution of normalized gain scores for each group of prospective teachers.
The Comparison group (n=15) plot shows
normalized gains realized in Fall 2005 using the
traditional curricula for the course, prior to
implementation of the new materials. Compared
against this group are the normalized gains from three
different semesters (four total sections) in which the
materials were implemented. There were major
revisions to the text materials between Implementation
I (n = 18) and II (n = 15), but only minor edits before
Implementation III (n = 32, based on two sections).
However, prospective teachers in the Implementation
III group were the first that used the module as a
textbook for reference in and out of class. Other than
exposure to different curricula, it seems reasonable to
assume that the prospective teachers across all sections
came from the same population.
Visual inspection reveals a distinct increase in
gains in the implementation groups with respect to the
comparison group. The gains seem to translate by more
than 0.10, but we see little change in the amount of
variation in the inter-quartile ranges. This assessment
is in agreement with Monte Carlo permutation tests, n
= 50,000, comparing both means, p = .009, and
medians, p = .006, of the comparison group with those
of the pooled implementations. However, comparing
gains across the whole test is not part of our current
focus in this paper.
Looking at the normalized gain scores for the
entire content subsection of the test obscures the
performance on particular questions. Thus, we selected
and closely examined four questions from the test that
address various aspects of our focus on the
coordination of center and spread and the alternative
use of intervals (see Figure 3). In Table 3, we record
the percentage of students who answered the multiple
choice questions correctly on the pre- and post-test.

Coordination of Center and Spread
42
3. The Springfield Meteorological Center wanted to
determine the accuracy of their weather forecasts.
They searched the records for those days when the
forecaster had reported a 70% chance of rain. They
compared these forecasts to records of whether or
not it actually rained on those particular days. The
forecast of 70% chance of rain can be considered
very accurate if it rained on:
a. 95% - 100% of those days.
b. 85% - 94% of those days.
c. 75% - 84% of those days.
d. 65% - 74% of those days.
e. 55% – 64% of those days.
10. Half of all newborns are girls and half are boys. Hospital A records an average
of 50 births a day. Hospital B records an average of 10 births a day. On a
particular day, which hospital is more likely to record 80% or more female
births?
a. Hospital A (with 50 births a day)
b. Hospital B (with 10 births a day)
c. The two hospitals are equally likely to record such an event.
11. Forty college students participated in a study of the effect of sleep on test scores. Twenty of the students volunteered to stay up all
night studying the night before the test (no-sleep group). The other 20 students (the control group) went to bed by 11:00 pm on the
evening before the test. The test scores for each group are shown on the graph below. Each dot on the graph represents a particular
student’s score. For example, the two dots above 80 in the bottom graph indicate that two students in the sleep group scored 80 on
the test.
Examine the two graphs carefully. From the 6 possible conclusions listed below, choose the one with which you most agree.
a. The no-sleep group did better because none of these students scored below 35 and a student in this group achieved the highest score.
b. The no-sleep group did better because its average appears to be a little higher than the average of the sleep group.
c. There is no difference between the two groups because the range in both groups is the same.
d. There is little difference between the two groups because the difference between their averages is small compared to the
amount of variation in the scores.
e. The sleep group did better because more students in this group scored 80 or above.
f. The sleep group did better because its average appears to be a little higher than the average of the no-sleep group.
15. Each student in a class tossed a penny 50 times and counted the number of heads. Suppose four different classes produce graphs for the
results of their experiment. There is a rumor that in some classes, the students just made up the results of tossing a coin 50 times without
actually doing the experiment. Please select each of the following graphs you believe represents data from actual experiments of flipping a
coin 50 times.
a b.
c. d.
Figure 3. Sample pre- and post-test questions on center, spread, intervals, and variability.

Hollylynne S. Lee & J. Todd Lee
43
Table 3 Correct Response Rates on Four Test Questions.
Comparison
n = 15
Implementation I
n = 18
Implementation II
n = 15
Implementation III
n = 32
Question
Correct
Answer Pre Post Pre Post Pre Post Pre Post
3 d 47% 47% 44% 50% 53% 53% 53% 53%
10 b 40% 80% 44% 89% 33% 80% 38% 66%
11 d 53% 20% 11% 22% 33% 20% 25% 25%
15 b & d 47% 40% 56% 67% 40% 33% 41% 56%
Across all implementation semesters and the
comparison group, prospective teachers made little to
no improvement in their ability to interpret the
accuracy of a 70% probability in data as an interval
around 70% (Question 3, answer d), with only about
half of them correctly choosing the interval. Across all
semesters, there was also little change in prospective
teachers’ ability to recognize the two reasonable
distributions for a distribution of outcomes from
repeated samples of 50 coin tosses (Question 15,
answers b and d). As shown in response to Question 10
(answer b), prospective teachers appeared to improve
their ability to recognize sampling variability with
respect to sample size: They typically became more
likely to recognize that Hospital B, with the smaller
sample size, had a higher probability of having a
percent of female births much higher (80%) than an
expected 50%. Because the comparison group made
similar gains on Question 10 as those who had engaged
in using the new materials, it appears that merely
engaging in learning about data analysis and
probability may be helpful in one’s ability to correctly
respond to that question, regardless of curriculum
material.
For Question 11, there was very little change in the
percent of prospective teachers who correctly chose d
to indicate that there was little difference between the
groups with respect to center and the large spread, and
in fact most chose f, a comparison done only on a
measure of center. It is disappointing that more
prospective teachers did not demonstrate a
coordination of center and spread with this task on the
posttest. It is interesting that in the Comparison group,
about half initially reasoned correctly but that after
instruction the majority chose to make a comparison
based only on a measure of center (see Figure 3).
Perhaps the traditional curriculum placed a greater
emphasis on measures of center and decision-making
based on point estimates.
The main lesson we take from examining these
pre- and post-test questions is that our materials, as
implemented in 2006-2007, did not appear to
substantially help prospective teachers improve their
reasoning about center, spread, and intervals. For
although we realized gains in the overall scores on
statistical reasoning, a close look at four questions
demonstrates little change.
Discussion
How do these results help answer our question
about the task of developing prospective teachers’
ability to use a coordinated view of center and spread?
One design element used by Lee et al. (2010) was the
deliberate and consistent focus on the coordination of
center and spread. The module covers a broad range of
material, written by three authors through many
iterations and reviews from external advisors. Though
the theme of coordination was maintained throughout
the material, the emphasis was found to be quite
inconsistent across chapters in an early version of the
materials. Even more sporadic was the preference of
intervals over point values with half the chapters
excluding this theme. Even though the focus on
intervals and modal clumping was consistent in the
probability/simulation chapters, a few of the relevant
test questions did not indicate any gains beyond those
from general exposure to data and probability. To
ascertain if these themes can strengthen the intuitions
of clumping over point-value intuitions, the message
must be reemphasized throughout the material.

Coordination of Center and Spread
44
Prospective Teachers’ Developing Understandings
Developing a coordinated view of center and
spread, or expectation and variation, as others have
called it (e.g., Watson et al., 2007), is difficult. Watson
and her colleagues found that hardly any students from
ages 8 to14 used reasoning that illustrated a
coordinated perspective on expectation and variation in
interview settings. Although Canada’s (2006)
prospective teachers made gains during his course in
reasoning about intervals, it was not uncommon for the
teachers to still give single point estimates as expected
values. If students have difficulty in coordinating
center and spread, then it is important for both
prospective and in-service teachers to work towards
developing their own coordinated views in data and
chance settings.
There are not many studies that follow the
development of prospective teachers’ understandings
of statistical ideas into teaching practices. Batanero,
Godina, and Roa (2004) found that even when gains in
content knowledge were made during instruction on
probability, prospective teachers still prepared lesson
plans that varied greatly in their attention to important
concepts in probability. Lee and Mojica (2008)
reported that practicing middle school teachers, in a
course on teaching probability and statistics, exhibited
inconsistent understandings of probability ideas from
lessons in their classrooms. Thus, it is not surprising
that in such a short time period the prospective teachers
in our study did not develop their own understandings
in ways they could enact in pedagogical situations.
Leavy (2010) noted that a major challenge in statistics
education of prospective teachers is “the
transformation of subject matter content knowledge
into pedagogical content knowledge” (p. 49). Leavy
also noted in her study that prospective teachers who
were able to demonstrate a reasonably strong
understanding of informal inference, including
accounting for variation from expected outcomes, had
difficulties applying this knowledge to create informal
inference tasks to use with their own students.
Informing Revisions to Materials
In accordance with curriculum development and
research recommendations by Clements (2007), the
results discussed in this paper informed the next
iteration of revisions to the materials. Several questions
were revised throughout the text and additional
discussion points were inserted to help emphasize the
coordination of center and spread and to provide
additional opportunities for interval reasoning. For
example, a major change occurred in Chapter 1 with
regard to the focus on interval reasoning. Consider the
original questions on the left side of Table 4 with those
on the right. Fall 2007 Q17 asks prospective teachers
to simultaneously consider spread and center through
use of the divider and reference tools in TinkerPlots.
However, in recent revisions, the series of questions
was recast and developed into a series that first has the
prospective teachers consider intervals of interest in the
upper 50%, middle 50%, and then something they
deem to be a cluster containing many data points, i.e., a
modal clump. After the experience with intervals, they
are asked to use the reference tool to mark a point
estimate they would consider a “typical” value and to
reason how the shaded interval might have assisted
them. This series of questions puts much more explicit
attention on valuing intervals when describing a
distribution. The authors also added Q25, which
explicitly asks prospective teachers to consider how the
use a specific technology feature (dividers) can assist
students’ reasoning.
Other revisions made throughout the chapters
included minor wording changes that could shift the
focus of attention in answering the question. For
example the Fall 2007 version of Chapter 3 posed the
question:
Q9. By only examining the graphs, what would
you characterize as a typical City mpg for
these automobiles?
This question was revised:
Q9. By only examining the graphs, what would
you characterize as a typical range of City
mpg for these automobiles? [bolding added]
Informing Support for Faculty
Making changes in the text material is not
sufficient. Fidelity of implementation is important for
ensuring prospective teachers have opportunities to
attend to and discuss the major ideas in the materials.
The big statistical ideas in the text (e.g., exploratory
data analysis, distributions, variation, and coordinating
center and spread) need to be made explicit to the
course instructor through different avenues, such as a
facilitator’s guide or faculty professional development.
Such a guide has been developed and is available at
http://ptmt.fi.ncsu.edu. This guide includes discussion
points that should be made explicit by the instructor
and includes continual reference to the main ideas
meant to be emphasized in the materials. The guide,
along with faculty professional development, can
hopefully allow teacher educators to better understand
the intended curriculum and implement the materials

Hollylynne S. Lee & J. Todd Lee
45
with high fidelity. Faculty professional development
efforts have been established through free workshops
held at professional conferences and week-long
summer institutes. Evaluations of the week-long
summer institutes in 2009 and 2010 suggest that the
fifteen participants increased their confidence in their
ability to engage prospective teachers in discussions
about center and spread in a distribution, as well as
randomness, sample size and variability.
Future Directions
For this study, we did not examine other sources of
evidence of prospective teachers’ development of
understanding related to coordinating center and
spread. Such data may include prospective teachers’
responses to a variety of content and pedagogical
questions posed throughout the chapters and perhaps
pedagogical pre- and post-tasks such as interpreting
students’ work, designing tasks for students, creating a
lesson plan. In fact, teacher educators at multiple
institutions have collected sample work from
prospective teachers on tasks from each of the
chapters. Analysis of this data with a focus on
coordinating center and spread may yield additional
findings that can help the field better understand of the
development of prospective teachers’ reasoning about
center and spread.
Prospective teachers’ familiarity with expected
ranges of values, their propensity to use these ideas in
conceptual statistical tasks, and their pedagogical
implementation of coordination of center and spread
are three different phenomena. As shown in this work
and in other literature, the transference from the first of
these to the latter two is problematic. Future versions
of these materials may need to engage prospective
teachers’ further into the use of interval thinking about
expectation and variation in a broader range of
statistical tasks. More importantly, prospective teachers
will need to be more consistently challenged to
consider how to create tasks, pose questions, and
facilitate classroom discussions aimed at engaging
their own students in the coordination of center and
spread.
Table 4 Sample Revisions in Chapter 1 to Better Facilitate Interval Reasoning
Text of Questions in Fall 2007 Text of Questions in Fall 2009
Q16. What do you notice about the distribution of average salaries?
Where are the data clumped? What is the general spread of the
data? How would you describe the shape?
Q17. Use the Divider tool and the Reference tool to highlight a clump
of data that is “typical” and a particular value that seems to
represent a “typical” salary. Justify why you highlighted a
clump and identified a particular value as typical.
Q18. Drag the vertical divider lines to shade the upper half of the
data, which contains approximately 50% of the cases. Which
states are in the upper half of the average salary range? What
factors may contribute to the higher salaries in these states?
Q20. Create a fully separated plot of the Average Teacher Salaries.
Either stack the data vertically or horizontally. What do you
notice about the distribution of average salaries? Where are the
data clumped? What is the general spread of the data? How
would you describe the shape?
Q21. Use the Divider tool to shade the upper half of the data, which
contains approximately 50% of the cases. Which states are in
the upper half of the average salary range? What factors may
contribute to the higher salaries in these states?
Q22. Drag the vertical divider lines to shade the middle half of the
data, which contains approximately 50% of the cases. Describe
the spread of the data in the middle 50%. What might
contribute to this spread?
Q23. Drag the vertical divider lines to highlight a modal clump of
data that is representative of a cluster that contains many data
points. Explain why you chose that range as the modal clump.
Q24. Use the Reference tool to highlight a particular value that seems
to represent a “typical” salary. Justify why you identified a
particular value as typical and how you may have used the
range you identified as a modal clump to assist you.
Q25. How can the use of the dividers to partition the data set into
separate regions be useful for students in analyzing the spread,
center, and shape of the distribution?

Coordination of Center and Spread
46
REFERENCES
Batanero, C., Godino, J. D., & Roa, R. (2004). Training teachers to
teach probability. Journal of Statistics Education 12(1).
Retrieved from
http://www.amstat.org/publications/jse/v12n1/batanero.html
Canada, D. (2006). Elementary preservice teachers’ conception of
variation in a probability context. Statistics Education
Research Journal, 5(1), 36-63. Retrieved from
http://www.stat.auckland.ac.nz/serj
Capraro, R. M. (2004). Statistical significance, effect size
reporting, and confidence intervals: Best reporting strategies.
Journal for Research in Mathematics Education, 35, 57-62.
Clements, D. H. (2007). Curriculum research: Toward a framework
for “research-based curricula”. Journal for Research in
Mathematics Education, 38, 35-70.
delMas, R. C. (2004). A comparison of mathematical and statistical
reasoning. In D. Ben-Zvi & J. Garfield (Eds.), The challenge
of developing statistical literacy, reasoning, and thinking (pp.
79-95). Dordrecht, The Netherlands: Kluwer.
Fidler, F. (2006). Should psychology abandon p-values and teach
CI’s instead? Evidence-based reforms in statistics education.
Proceedings of International Conference on Teaching
Statistics 7 . Retrieved from
http://www.stat.auckland.ac.nz/~iase
Franklin, C., Kader, G., Mewborn, D. S., Moreno, J., Peck, R.,
Perry, M., & Schaeffer, R. (2005). A Curriculum Framework
for K-12 Statistics Education: GAISE report. Alexandria, VA:
American Statistical Association. Retrieved from
http://www.amstat.org/education/gaise
Friel, S., O’Connor, W., & Mamer, J. (2006). More than
“meanmedianmode” and a bar graph: What’s needed to have a
statistics conversation? In G. Burrill (Ed.), Thinking and
reasoning with data and chance: Sixty-eighth yearbook (pp.
117-137). Reston, VA: National Council of Teachers of
Mathematics.
Gardner, M. J., & Altman, D. G. (1986). Confidence intervals
rather than p values: Estimation rather than hypothesis testing.
British Medical Journal (Clinical Research Ed), 292, 746-750.
Garfield, J. B. (2002). The challenge of developing statistical
reasoning. Journal of Statistics Education, 10(3). Retrieved
from
http://www.amstat.org/publications/jse/v10n3/garfield.html
Garfield, J. B. (2003). Assessing statistical reasoning. Statistics
Education Research Journal, 2(1), 22-38. Retrieved from
http://www.stat.auckland.ac.nz/~iase /serj/SERJ2(1).pdf
Hake, R. R. (1998). Interactive-engagement versus traditional
methods: A six-thousand-student survey of mechanics test
data for introductory physics courses. American Journal of
Physics, 66, 64-74.
International Committee of Medical Journal Editors. (1997).
Uniform requirements for manuscripts submitted to
biomedical journals. Annals of Internal Medicine 126 (1), 36-
47, [online] Available at
http://www.annals.org/cgi/content/full/126/1/36.
Konold, C., & Pollatsek, A. (2002). Data analysis as the search for
signals in noisy processes. Journal for Research in
Mathematics Education, 33, 259-289.
Leavy, A. M. (2010). The challenge of preparing preservice
teachers to teach informal inferential reasoning. Statistics
Education Research Journal, 9(1), 46-67, Retrieved from
http://www.stat.auckland.ac.nz/serj.
Lee, H. S., & Hollebrands, K. F. (2008a). Preparing to teach
mathematics with technology: An integrated approach to
developing technological pedagogical content knowledge.
Contemporary Issues in Technology and Teacher Education,
8(4). Retrieved from
http://www.citejournal.org/vol8/iss4/mathematics/article1.cfm
Lee, H. S., & Hollebrands, K. F. (2008b). Preparing to teach data
analysis and probability with technology. In C. Batanero, G.
Burrill, C. Reading, & A. Rossman (Eds.), Joint ICMI/IASE
Study: Teaching Statistics in School Mathematics. Challenges
for Teaching and Teacher Education. Proceedings of the ICMI
Study 18 and 2008 IASE Round Table Conference. Retrieved
from
http://www.ugr.es/~icmi/iase_study/Files/Topic3/T3P4_Lee.p
df
Lee, H. S., Hollebrands, K. F., & Wilson, P. H. (2010). Preparing
to teach mathematics with technology: An integrated
approach to data analysis and probability. Dubuque, IA:
Kendall Hunt.
Lee, H. S., & Mojica, G. F. (2008). Examining teachers’ practices:
In what ways are probabilistic reasoning and statistical
investigations supported? . In C. Batanero, G. Burrill, C.
Reading, & A. Rossman (Eds.), Joint ICMI/IASE study:
Teaching statistics in school sathematics. Challenges for
teaching and teacher education. Proceedings of the ICMI
Study 18 and 2008 IASE Round Table Conference. Retrieved
from
http://www.stat.auckland.ac.nz/~iase/publications/rt08/T2P14
_Lee.pdf.
Lesser, L. M., & Groth, R. (2008). Technological pedagogical
content knowledge in statistics. In Electronic Proceedings of
the Twentieth Annual International Conference on Technology
in Collegiate Mathematics (pp. 148-152).Retrieved from
http://archives.math.utk.edu/ICTCM/VOL20/S118/paper.pdf
Makar, K., & Confrey, J. (2005). “Variation-talk”: Articulating
meaning in statistics. Statistics Education Research Journal,
4(1), 27-54. Retrieved from
http://www.stat.auckland.ac.nz/serj
National Council of Teachers of Mathematics. (2000). Principles
and Standards for School Mathematics. Reston, VA: Author.
Powell, A. B., Francisco, J. M., & Maher, C. A. (2003). An
analytical model for studying the development of learners’
mathematical ideas and reasoning using videotape data.
Journal of Mathematical Behavior, 22, 405-435.
Reading, C., & Shaughnessy, J. M. (2000). Student perceptions of
variation in a sampling situation. In T. Nakahara & M.
Koyama (Eds.), Proceedings of the 24th annual conference of
the International Group for the Psychology of Mathematics
Education (Vol. 4, pp. 89-96). Hiroshima, Japan: Hiroshima
University.
Reading, C., & Shaughnessy, J. M. (2004). Reasoning about
variation. In J. Garfield & D. Ben-Zvi (Eds.), The challenge of
developing statistical literacy, reasoning and thinking (pp.
201-226). Dordrecht, The Netherlands: Kluwer.
Saldanha, L., & Thompson, P. W. (2002). Conceptions of sample
and their relationships to statistical inference. Educational
Studies in Mathematics, 51, 257-270.
Shaughnessy, J. M. (2006). Research on students’ understanding of
some big concepts in statistics. In G. Burrill (Ed.), Thinking

Hollylynne S. Lee & J. Todd Lee
47
and reasoning with data and chance: Sixty-eighth yearbook
(pp. 77-98). Reston, VA: National Council of Teachers of
Mathematics.
Stohl, H. (2005). Probability in teacher education and development.
In G. Jones (Ed.), Exploring probability in school: Challenges
for teaching and learning (pp. 345-366). Dordrecht, The
Netherlands: Kluwer.
Watson, J. M., Callingham, R. A., & Kelly, B. A. (2007). Students’
appreciation of expectation and variation as a foundation for
statistical understanding. Mathematical Thinking and
Learning, 9, 83-130.

48
REVIEWERS FOR THE MATHEMATICS EDUCATOR, VOLUME 21, ISSUE 1
The editorial board of The Mathematics Educator would like to take this opportunity to
recognize the time and expertise our many volunteer reviewers contribute. We have listed below
the reviewers who have helped make the current issue possible through their invaluable advice
for both the editorial board and the contributing authors. Our work would not be possible without
them.
Shawn Broderick
Tonya Brooks
Victor Brunaud-Vega
Amber G. Candela
Zandra DeAraujo
Tonya DeGeorge
Christine Franklin
Brenda King
Ana Kuzle
Kevin LaForest
David R. Liss, III
Laura Lowe
Anne Marie Marshall
Kevin Moore
John Olive
Ronnachai Panapoi
Denise A. Spangler
Patty Anne Wagner
James Wilson
The University of Georgia
Samuel Cartwright
Fort Valley State University
Kelly Edenfield
Kennesaw State University
Ryan Fox
Penn. State, Abington
Brian Gleason
University of New Hampshire
Sibel Kazak
Pamukkale University
Yusuf Koc
Indiana University, Northwest
Terri Kurz
Arizona State University
Mara Martinez
University of Illinois at Chicago
Michael McCallum
Georgia Gwinnett College
Jennifer Mossgrove
Knowles Science Teaching Foundation
Anderson Hassell Norton, III
Virginia Tech
Molade Osibodu
African Leadership Academy
Ginger Rhodes
University of North Carolina, Wilmington
Behnaz Rouhani
Georgia Perimeter College
Kyle Schultz
James Madison University
Susan Sexton Stanton
East Carolina University
Diana Swanagan
Shorter University
If you are interested in becoming a reviewer for The Mathematics Educator, contact the Editors

49
Manuscript Submission Guidelines
The Mathematics Educator (ISSN 1062-9017) is a biannual publication of the Mathematics Education
Student Association (MESA) at The University of Georgia and is abstracted in Zentralblatt für Didaktik der
Mathematik (International Reviews on Mathematical Education). The purpose of the journal is to promote the
interchange of ideas among students, faculty, and alumni of The University of Georgia, as well as the broader
mathematics education community.
The Mathematics Educator presents a variety of viewpoints within a broad spectrum of issues related to mathematics
education. Our editorial board strives to provide a forum for a developing collaboration of mathematics educators at
varying levels of professional experience throughout the field. The work presented should be well conceptualized;
should be theoretically grounded; and should promote the interchange of stimulating, exploratory, and innovative ideas
among learners, teachers, and researchers. The Mathematics Educator encourages the submission of a variety of types
of manuscripts from students and other professionals in mathematics education including:
• reports of research (including experiments, case studies, surveys, and historical studies),
• descriptions of curriculum projects, or classroom experiences;
• literature reviews;
• theoretical analyses;
• critiques of general articles, research reports, books, or software;
• commentaries on research methods in mathematics education;
• commentaries on public policies in mathematics education.
The work must not be previously published except in the case of:
• translations of articles previously published in other languages;
• abstracts of or entire articles that have been published in journals or proceedings that may not be easily
available.
Guidelines for Manuscript Specifications
• Manuscripts should be typed and double-spaced, 12-point Times New Roman font, and a maximum of 25
pages (including references and endnotes). An abstract (not exceeding 250 words) should be included and
references should be listed at the end of the manuscript. The manuscript, abstract, references and any pictures,
tables, or figures should conform to the style specified in the Publication Manual of the American
Psychological Association, 6th Edition.
• An electronic copy is required. The electronic copy must be in Word format and should be submitted via an
email attachment to [email protected]. Pictures, tables, and figures should be embedded in the document and must
be compatible with Word 2007 or later.
• The editors of TME use a blind review process. Therefore, to ensure anonymity during the reviewing process,
no author identification should appear on the manuscript.
• A cover age should be submitted as a separate file and should include the author’s name, affiliation, work
address, telephone number, fax number, and email address.
• If the manuscript is based on dissertation research, a funded project, or a paper presented at a professional
meeting, a footnote on the title page should provide the relevant facts.
To Become a Reviewer
Contact the Editors at [email protected]. Please indicate if you have special interests in reviewing articles that address
certain topics such as curriculum change, student learning, teacher education, or technology.

50

51
The Mathematics Education Student Association is an official affiliate of the National Council of Teachers of Mathematics. MESA is an integral part of The University of Georgia’s mathematics education community and is dedicated to serving all students. Membership is open to all UGA students, as well as other members of the mathematics education community.
Visit MESA online at http://math.coe.uga.edu/Mesa/MESA.html
TME Subscriptions TME is published both online and in print form. The current issue as well as back issues are available online at http://math.coe.uga.edu/tme/tmeonline.html. A paid subscription is required to receive the printed version of The Mathematics Educator. Subscribe now for Volume 21 Issues 1 & 2. You may subscribe online by visiting http://math.coe.uga.edu/Mesa/MESA.html and emailing your shipping address to [email protected]. Alternatively, send a copy of this form, along with the requested information and the subscription fee to
The Mathematics Educator
105 Aderhold Hall The University of Georgia Athens, GA 30602-7124
If you would like to be notified by email when a new issue is available online, please send a request to
___ I wish to subscribe to The Mathematics Educator for Volume 21 (Numbers 1 & 2). ___ I would like a previous issue of TME sent. Please indicate Volume and issue number(s): ___________________ Name Amount Enclosed ________________ subscription: $15/domestic; $30/international each back issue: $7/domestic; $15/international
Address

52


In this Issue,
A Look Back…. Pólya on Mathematical Abilities JEREMY KILPATRICK Using Technology to Unify Geometric Theorems About the Power of a Point JOSÉ N. CONTRERAS Aspects of Calculus for Preservice Teachers LEE FOTHERGILL Enhancing Prospective Teachers’ Coordination of Center and Spread: A Window Into Teacher Education Material Development HOLLYLYNNE S. LEE & J. TODD LEE