hcm urban streets methodologyonlinepubs.trb.org/onlinepubs/webinars/131031.pdf · hcm 2010 does not...
TRANSCRIPT

HCM URBAN STREETS METHODOLOGY OCTOBER 31, 2013
Bicyclist, Pedestrian, and Transit Passenger
1

Instructors
Aaron Elias, P.E.
Engineer
Kittelson & Associates
510-433-8077
Kamala Parks
Senior Planner
Kittelson & Associates
510-433-8081

Learning Objectives
Discuss the impacts of various inputs on the LOS of each mode
Discuss recent case studies of how the methodology has been applied
Agenda
Brief history of HCM multimodal analysis Development of the HCM methodology
Pedestrian LOS model Bicyclist LOS model Transit Passenger LOS model
Case Studies General Plan & Specific Plan Congestion Management Program Traffic Impact Analysis Road Diet Analysis
Q&A

HCM Multimodal History
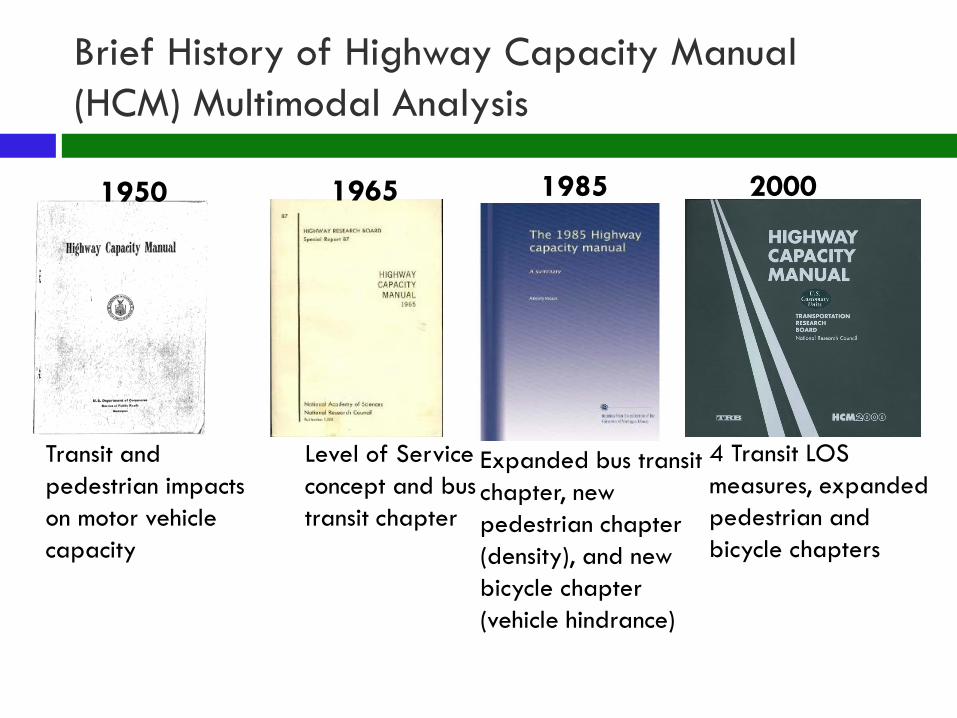
Brief History of Highway Capacity Manual (HCM) Multimodal Analysis
Transit and pedestrian impacts on motor vehicle capacity
Level of Service concept and bus transit chapter
1950 1965 1985
Expanded bus transit chapter, new pedestrian chapter (density), and new bicycle chapter (vehicle hindrance)
4 Transit LOS measures, expanded pedestrian and bicycle chapters
2000
Brief History of Highway Capacity Manual (HCM) Multimodal Analysis
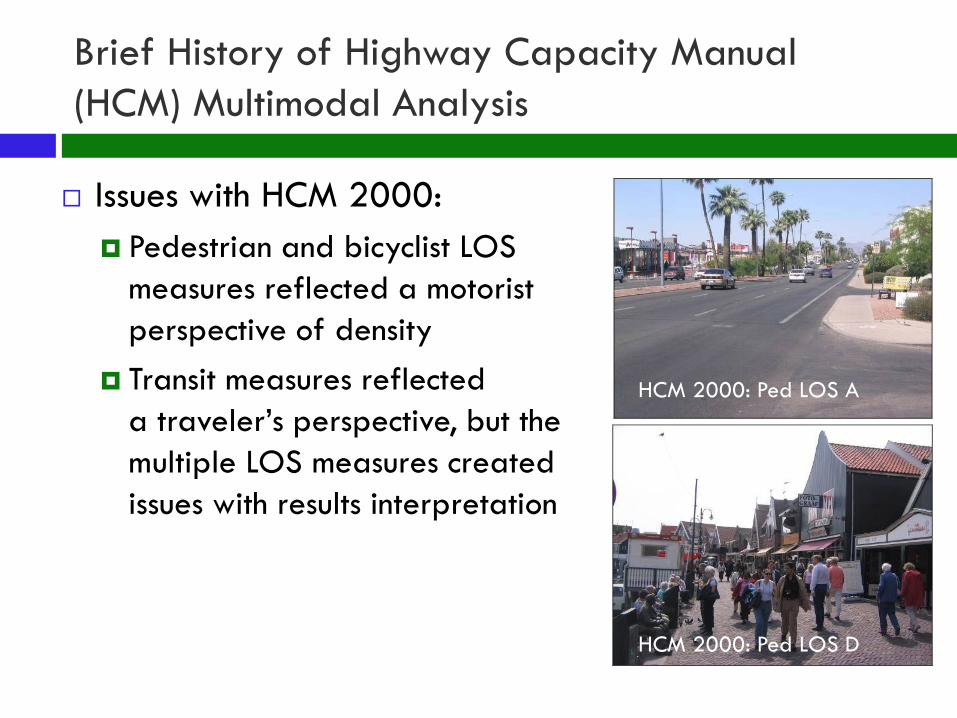
Issues with HCM 2000: Pedestrian and bicyclist LOS
measures reflected a motorist perspective of density
Transit measures reflected a traveler’s perspective, but the multiple LOS measures created issues with results interpretation
HCM 2000: Ped LOS A
HCM 2000: Ped LOS D

HCM 2010 Multimodal Philosophy
Integrate multimodal analysis methods into appropriate chapters Road user perspective No separate bicyclist, pedestrian,
or transit passenger chapters Methodologies for all modes presented
together and intertwined
Encourage software developers to add multimodal analysis features

Methodology Development
Methodology Selection
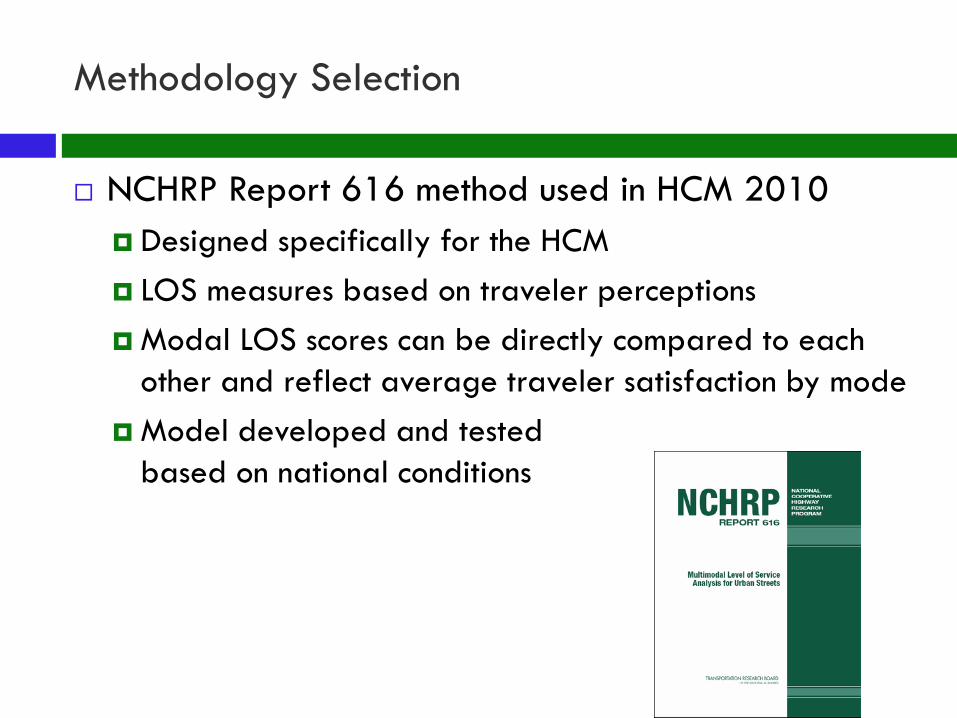
NCHRP Report 616 method used in HCM 2010 Designed specifically for the HCM LOS measures based on traveler perceptions Modal LOS scores can be directly compared to each
other and reflect average traveler satisfaction by mode Model developed and tested
based on national conditions

Methodology Development
Pedestrian, bicyclist, motorist: 90 typical street segments recorded Video labs in four cities around the U.S. 120 Participants rated conditions on an A-F scale

Methodology Development
Transit passenger: Video lab not feasible On-board surveys conducted in 4 cities However, results showed biased results
Final model was based on national traveler response data to changes in transit service quality For example, when service frequency or travel time is
improved, ridership increases

Methodology Characteristics
All models generate an perception score that is generally in the range of 1 to 6 (A to F)
All models have multiple service quality factors as inputs Traditional HCM service measures are based on a
single factor (e.g., delay)
LOS thresholds are the same across models

LOS Score Interpretation
LOS LOS Score A ≤2.00 B >2.00–2.75 C >2.75–3.50 D >3.50–4.25 E >4.25–5.00 F >5.00
Motorist LOS is based on travel speed as a percentage of base free-flow speed instead of on the perception score developed in research

LOS Score Interpretation
LOS is reported individually by mode and direction No combined LOS for the street
Vehicle volumes would typically dominate an LOS weighted by number of travelers
Combined LOS would potentially mask important deficiencies for a given mode
Measures the degree to which urban streets meet the need of all users

Treatment of Safety in Multimodal LOS
HCM 2010 does not explicitly include safety in LOS calculations. Collision history does not affect LOS
However, HCM 2010 does include safety implicitly. Traveler Perceived Safety Speed of traffic Percent heavy vehicles Barriers between sidewalk and street lateral separation between vehicle stream and bicyclists and
pedestrians

Urban Street System Elements: Link
Distance between two signalized intersections Roundabout or all-way STOP could also be an end point
Perception score for bicyclists and pedestrians
link

Urban Street System Elements: Intersection
Signalized intersection, roundabout, or all-way STOP that terminates a link
Intersection scores only for pedestrians and bicyclists
link int.

Urban Street System Elements: Segment
Segment = link + downstream intersection Perception scores available for all modes
Pedestrian/Bicyclist scores based on combination of link, intersection, and additional factor
segment link
int.

Urban Street System Elements: Facility
Facility = 2 or more consecutive segments Perception scores available for all modes
Length-weighted average of the segment scores
segment facility
link int.

Pedestrian LOS

Pedestrian LOS: Links

Pedestrian LOS: Links Model Factors
Factors included:
Outside travel lane width (+)
Bicycle lane/shoulder width (+)
Buffer presence (e.g., on-street parking, street trees) (+)
Sidewalk presence and width (+)
Volume and speed of motor vehicle traffic in outside travel lane (–)
Pedestrian density considered separately
Worse of (density LOS, link LOS score) used in determining overall link LOS

Pedestrian LOS: Signalized Intersections

Pedestrian LOS: Signalized Intersections Model Factors
Factors included:
Permitted left turn and right-turn-on-red volumes (–) Cross-street motor vehicle volumes and speeds (–) Crossing length (–) Average pedestrian delay (–) Right-turn channelizing island presence (+)
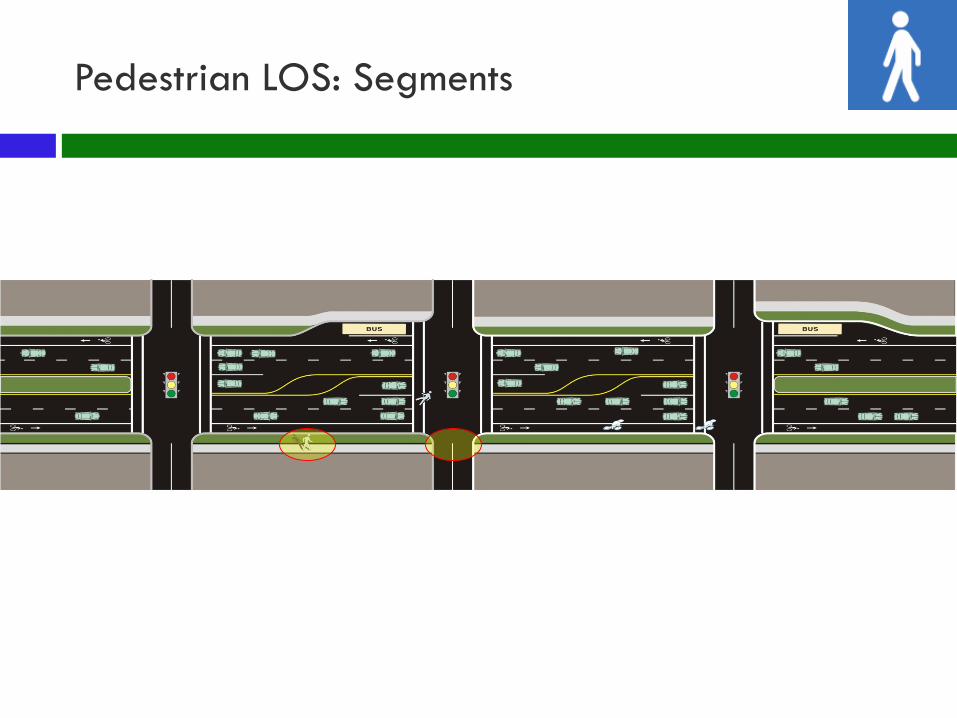
Pedestrian LOS: Segments

Pedestrian LOS: Segments Model Factors
Factors included:
Pedestrian link LOS (+)
Pedestrian intersection LOS (+)
Street-crossing difficulty (–/+)
Delay diverting to signalized crossing
Delay crossing street at legal unsignalized location

Pedestrian LOS: Facility
Length-weighted average of segment LOS scores
Can mask deficiencies in individual segments
Consider also reporting segment LOS score for the worst segment in the facility

Bicyclist LOS

Bicyclist LOS: Links

Bicyclist LOS: Links Model Factors
Factors included:
Volume and speed of traffic in outside travel lane (–)
Heavy vehicle percentage (–)
Pavement condition (+)
Bicycle lane presence (+)
Bicycle lane, shoulder, and outside lane widths (+)
On-street parking utilization (–)

Bicyclist LOS: Signalized Intersections

Bicyclist LOS: Signalized Intersections Model Factors
Factors included:
Width of outside through lane and bicycle lane (+) Cross-street width (–) Vehicle traffic volume in the outside lane (–)

Bicyclist LOS: Segments

Bicyclist LOS: Segments Model Factors
Factors included:
Bicycle link LOS (+)
Bicycle intersection LOS, if signalized (+)
Number of access points on right side (–)
Includes driveways and unsignalized street intersections
Judgment required on how low-volume residential driveways are treated

Bicyclist LOS: Facility
Length-weighted average of segment LOS scores
Can mask deficiencies in individual segments
Consider also reporting segment LOS score for the worst segment in the facility

Transit Passenger LOS

Transit Passenger LOS: Overview
Only segment and facility LOS models
Transit facility LOS is a length-weighted average of segment LOS
“Transit” includes buses, streetcars, and street-running light rail
Three main model components:
Access to transit (pedestrian link LOS)
Wait for transit (frequency)
Riding transit (perceived travel time rate)

Transit Passenger LOS: Perceived Travel Time Components
Factors included:
Actual bus travel speed (+)
Bus stop amenities (+)
Excess wait time due to late bus/train arrival (–)
On-board crowding (–)

San Pablo, California
General Plan Case Study
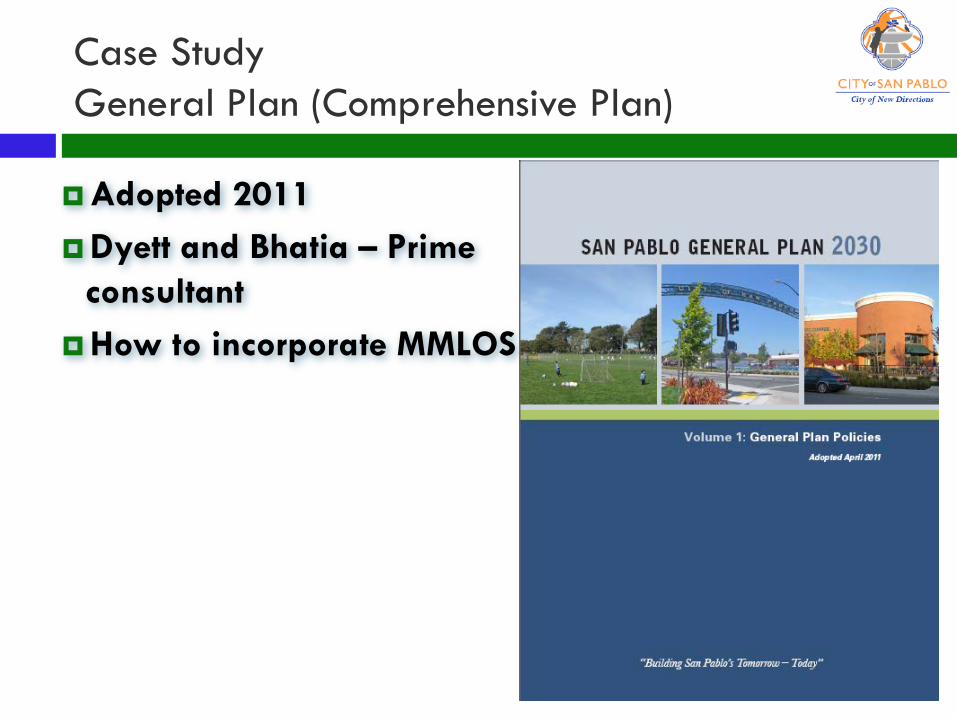
Case Study General Plan (Comprehensive Plan)
Adopted 2011 Dyett and Bhatia – Prime
consultant How to incorporate MMLOS

Case Study General Plan (Comprehensive Plan)
Complete Street general policies Designation of circulation system
Move away from motorist-only perceptions Incorporate more multimodal designations
Source: Dyett and Bhatia

Case Study General Plan (Comprehensive Plan)

Case Study General Plan (Comprehensive Plan)
Prioritization of different street types by mode

Case Study General Plan (Comprehensive Plan)
More robust determination of improvements

Case Study General Plan (Comprehensive Plan)
MMLOS summary of factors for each mode

San Pablo Avenue San Pablo, California
Specific Plan Case Study

Case Study Specific Plan
Adopted 2011 Guide to revitalize in a
sustainable manner MMLOS analysis
Existing 2030 No Project 2030 Specific Plan

Case Study Specific Plan (Sub-Area Plan)
MMLOS Analysis
Score LOS Score LOS Score LOS Score LOS Score LOS Score LOSNorth Existing 1.67 A 3.45 C 2.98 C 1.65 A 3.55 D 3.07 C
2030 No Project 2.11 B 3.49 C 3.08 C 1.78 A 3.61 D 3.19 C2030 Specific Plan 2.07 B 3.18 C 2.84 C 1.76 A 3.29 C 3.04 C
Central Existing 1.08 A 3.50 C 3.06 C 1.10 A 3.49 C 2.96 C2030 No Project 1.22 A 3.54 D 3.15 C 1.27 A 3.55 D 3.07 C2030 Specific Plan 1.20 A 3.48 C 3.03 C 1.23 A 2.95 C 2.83 C
South Existing 0.91 A 4.13 D 2.87 C 0.80 A 3.60 D 2.83 C2030 No Project 1.07 A 4.22 D 2.99 C 1.06 A 3.65 D 2.96 C2030 Specific Plan 1.04 A 3.69 D 2.81 C 1.05 A 3.57 D 2.85 C
AM Peak-Hour
Corridor Section Scenario
Northbound SouthboundTransit
Passenger Bicyclist PedestrianTransit
Passenger Bicyclist Pedestrian
Worse than existingWorse than existing but better than 2030 No ProjectBetter than existing
LegendDowling Associates, Inc., Multi-Modal Level of Service analysis using CompleteStreetsLOS version 2.1.8, November 2010

Case Study General and Specific Plan
Benefits of MMLOS Provided baseline LOS for all travel modes Reasonableness of LOS standards
Tested MMLOS for Specific Plan scenario Multimodal roadway designations Provide guidelines for improvements Inform mitigation requirements Provide an analysis tool

Case Study General and Specific Plan
Lessons Learned MMLOS works well analyzing fixed right-of-way How to allocate space Quantifies trade-offs between modes
Developing policy standards Establish baseline Conduct sketch what-if scenarios May lead to prioritizing specific modes on streets

San Joaquin Council of Governments (SJCOG) Regional Congestion Management Program (RCMP) Update 2012
Congestion Management Program

San Joaquin Council of Governments (SJCOG)
Local jurisdictions 7 incorporated cities San Joaquin County
Federally designated: Extreme non-attainment for ozone Non-attainment for carbon
monoxide Non-attainment for PM 2.5

SJCOG RCMP Update 2012 Multimodal Focus
Updated the CMP transportation network Transit network Bikeway system
Updated the regional data collection program Bicyclist Pedestrian Transit
Developed multimodal objectives and performance measures Designated Multimodal Corridors

Multimodal Corridors 13 designated corridors
No new significance standards
SJCOG provides data to local agencies Baseline HCM 2010 MMLOS
analysis Pedestrian Bicyclist Transit Passenger
Data collection this year
SJCOG RCMP Update 2012

Multimodal Corridors Options given to local agency
SJCOG RCMP Update 2012
RCMP deficiency or
impact identified
• Opt to not widen roadway
Prepare Deficiency Plan
• Identify improvements for other modes
Use MMLOS to analyze
improvements
• Pedestrian • Bicyclist • Transit
Passenger

Multimodal Corridors
SJCOG RCMP Update 2012
System-wide Deficiency Plan
Improvements sanctioned as
regional
Greater weight for funding
Plan submitted in lieu of grant applications

2012 FHWA Certification Review Comments “The system monitoring program seems to be well documented as to how, when and where data
collection activities are performed. The RCMP is multimodal in nature and identifies thirteen corridors applicable to a method to compute multimodal level of service (MMLOS).”
“SJCOG appears to have done a good job in developing a range of performance measures …. They are multimodal in nature which is an important federal requirement.”
“The federal review team found SJCOG’s CMP to be in compliance with Federal regulations.”
SJCOG RCMP Update 2012

Pasadena, California
Development Impact Analysis

Traffic Impact Analysis
Worked with the City of Pasadena to analyze multimodal impacts of a redevelopment project

Traffic Impact Analysis
Impact studies generally only consider auto Pasadena finding it difficult to mitigate certain
areas How might MMLOS provide another tool A recent development project was selected to test
multimodal LOS

Traffic Impact Analysis
Project consisted of:
Generated 4,900 daily trips 289 trips in the AM peak hour 488 trips in the PM peak hour
• 156 room hotel • 38,000 ft2 of dining • 14,000 ft2 retail
• 103,000 ft2 office • 8,000 ft2 of bank

Traffic Impact Analysis

Traffic Impact Analysis

Traffic Impact Analysis
Link results for Colorado Blvd.

Traffic Impact Analysis
Transit Passenger Minimal effect, transit speed slightly slower (-)
Pedestrian LOS slightly worse (-)
Bicyclist Slower auto speeds (+)
Increased volume (-)
Pedestrian More vehicles in lane nearest pedestrians (-)
Slower auto speeds (+)
All impacts minor, volume has only small effect on LOS for non-auto modes

Traffic Impact Analysis Conclusions
Lessons Learned: Multimodal LOS not very sensitive to volume
changes Methodology much better at quantitatively showing
impacts to all four modes resulting from physical attributes such as: Cross section changes (Pedestrians/Bikes) Trees or other buffers (Pedestrians) Pavement condition (Bikes)

Santa Clara County, California
Road Diet Analysis
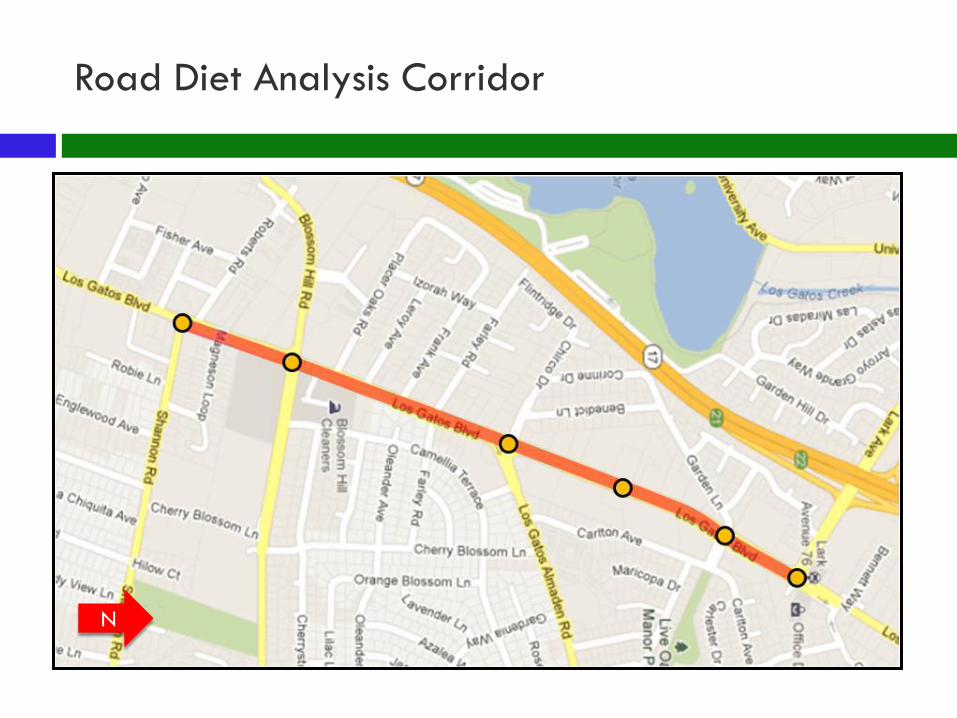
Road Diet Analysis Corridor
Analyzed Shannon Rd. to Lark Ave.
N

Road Diet Analysis Corridor
Possible Road Diet Assumed: Gateway to Lark would maintain lanes but remove parking
Remaining segments reduced from 3 to 2 lanes
Space allocated as follows: 2.5 feet of additional sidewalk (8’ total)
5 feet of buffer with trees
8 feet of parking
5.5 feet of bike lanes

Road Diet Analysis Corridor
Impact on the auto mode
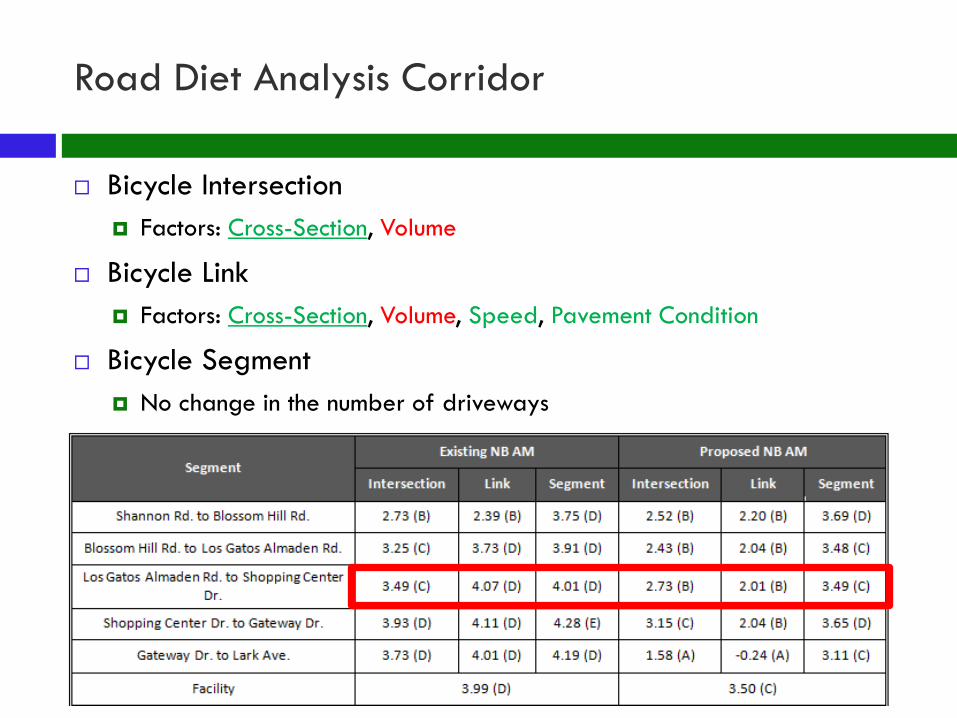
Road Diet Analysis Corridor
Bicycle Intersection Factors: Cross-Section, Volume
Bicycle Link Factors: Cross-Section, Volume, Speed, Pavement Condition
Bicycle Segment No change in the number of driveways

Road Diet Analysis Corridor
Pedestrian Intersection Factors: Cross-Section, Vehicle Volume, Speed, Ped. Delay
Pedestrian Link Factors: Cross-Section, Volume, Speed
Gateway Dr. to Lark Ave. became worse due to parking removal
Pedestrian Segment RCDF – No change from the maximum value

Questions?
• Enter questions/comments in the Question Pod. Your question will be answered in the order it was received.