hazard analysis and risk assessments for industrial
TRANSCRIPT

Hazard Analysis and Risk Assessments for Industrial Processes Using FMEA
and Bow-Tie Methodologies
Islam H. Afefy* Industrial Engineering Department, Faculty of Engineering, Fayoum University, Fayoum, Egypt
(Received: July 23, 2015 / Revised: October 19, 2015 / Accepted: November 2, 2015)
ABSTRACT
Several risk assessment techniques have been presented and investigated in previous research, focusing mainly on the failure mode and effect analysis (FMEA). FMEA can be employed to determine where failures can occur within in-dustrial systems and to assess the impact of such failures. This research proposes a novel methodology for hazard analysis and risk assessments that integrates FMEA with the bow-tie model. The proposed method has been applied and evaluated in a real industrial process, illustrating the effectiveness of the proposed method. Specifically, the bow-tie diagram of the critical equipment in the adopted plant in the case study was built. Safety critical barriers are identi-fied and each of these is assigned to industrial process with an individual responsible. The detection rating to the fail-ure mode and the values of risk priority number (RPN) are calculated. The analysis shows the high values of RPN are 500 and 490 in this process. A global corrective actions are suggested to improve the RPN measure. Further manage-rial insights have been provided. Keywords: Safety, FMEA, RPN, Bow-tie * Corresponding Author, E-mail: [email protected]
1. INTRODUCTION
For any industry processes to be successful, it has become essential to identify and analysis of the hazards types and sources, to assess the associated risks and to bring the risks to an acceptable level. The bow-tie model was applied to large scale industries, for the probabilis-tic assessment of risks of major industrial accidents. Many researches on FMEA have been carried out but still some applied research in the industrial processes field is required so, about explore the successful utiliza-tion of the FMEA technique in the area of manufactur-ing and design in large industrial process scale. Liu et al. (2011) discussed traditional FMEA Using fuzzy eviden-tial reasoning approach and grey theory. A Novel ap-proach for prioritization of failure modes in FMEA us-
ing multi criteria decision making techniques (MCDMT) is discussed by Maheswaran and Logan (Maheswaran and Logan, 2013).
Bow-tie diagram combines fault tree (FT) and event tree (ET) analyses to explore the primary causes and consequences of a critical event (Kahn et al., 2014). The bow-tie diagram has widely been used in risk analysis, reliability engineering and safety assessment presented by Aneziris et al. (2008). Bellamy et al. (2013) intro-duced an application of bow-tie in industrial practice, the “Storybuilder” method, to identify the dominant pat-terns of safety barrier failures, barrier task failures, and underlying management flaws. An evaluation of barrier performance can be achieved with this approach. An im-portant and useful feature is that this barrier analysis helps to identify missing or ill-designed barriers that is a key-
Industrial Engineering & Management Systems Vol 14, No 4, December 2015, pp.379-391 http://dx.doi.org/10.7232/iems.2015.14.4.379ISSN 1598-7248│EISSN 2234-6473│ © 2015 KIIE
Afefy: Industrial Engineering & Management Systems Vol 14, No 4, December 2015, pp.379-391, © 2015 KIIE 380
issue in risk assessment. Kurowicka et al. (2006) gives a detailed account of bow-tie diagram and the barrier func-tions associated with it. A semi-quantitative assessment of occupational risks using bow-tie representation is pre-sented by Celeste and Cristina (2010). They presented and discussed a specific case study, in the shipyard’s technological area of surface treatment and protection, to demonstrate the method’s applicability and usefulness. Techniques to identify and evaluate risks in the process and to decide how to act on them in order to eliminate or reduce them to protect the population and the environ-ment are often mistaken. Summarizing these two cate-gories of techniques, they can distinguish the following general components (Catalin et al., 2013): (1) to identify risks: is the intrinsic presence, observation of what hap-pens. Hazard and operability analysis (HAZOP) method is a method for identifying operational problems associ-ated with the design, maintenance or operation of the safety system. It is an objective process to evaluate the different parts of a given system that provides a system-atic and well-documented potential hazard and (2) risk assessment: their intrinsic presence, previous experience, codes of practice use the method hazard analysis (HAZAN) estimation method used to assess hazards to decide how to take action to eliminate or reduce the risk.
From all the above, it is apparent that bow-tie me-thodology represents a step forward in the current state of the art concerning the management of risks, including those associated with occupational safety. This is the context in which the authors equated the use of the qualitative bow-tie diagram in combination with a ma-trix approach, based on accident statistics of the activity under analysis. To demonstrate the proposed methodol-ogy for hazard and risk assessments analyses, this paper describes an application case in a large industrial scale, called Emisal company which located in Fayoum city, Egypt, whose main activity is to produce anhydrous So-dium Sulphate and Sodium Chloride refined salt), Mag-nesium sulphate Heptahydrate (Epsom salt), Sodium chloride Pure.
Hence, the main objective of this paper, though, is twofold: (1) to explore FMEA methodology for identify-ing potential failure modes for process, assess the risk associated with those failure modes and prioritize issues for corrective action and identify and carry out correc-tive actions to address the most serious concerns and (2) to as certain to what extent the bow-tie diagram would
be successfully applied to occupational risks, in individ-ual firms, by their own people.
3. METHODOLOGY
There are several techniques developed to perform the risk assessment to mitigate the suffering. FMEA is one of the most widely used risk assessment tool. Re-cently, FMEA has been adopted in wide spectrum of fields such as the chemical, aerospace, military, auto-mobile, electrical, mechanical and large scale industries. The FMEA provides reliability and safety of a plant and helps to identify the potential process failures existing in a plant (Arun et al., 2013). Bow-tie model is one of the best tools developed for this communication. Barriers may be strong against a specific accident sequence and hence have smaller holes or weak which contribute to reduction of human error routes and which would permit larger holes (Celeste and Cristina, 2010).
3.1 Failure Mode and Effect Analysis (FMEA)
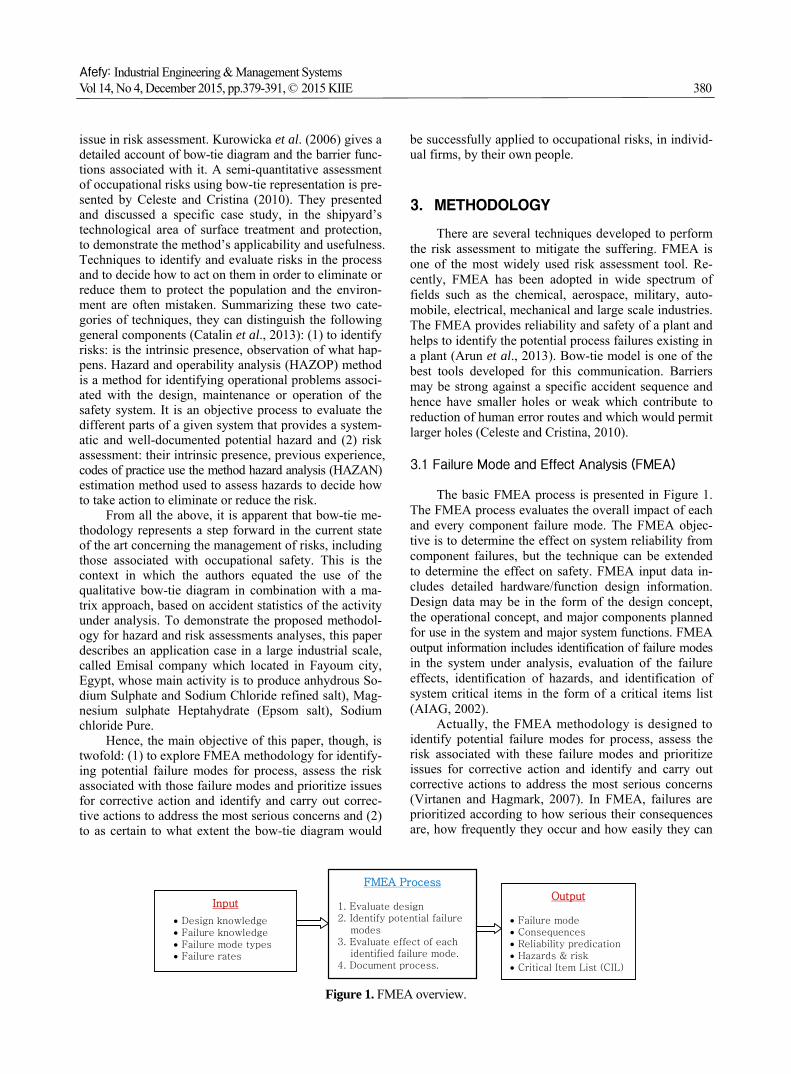
The basic FMEA process is presented in Figure 1. The FMEA process evaluates the overall impact of each and every component failure mode. The FMEA objec-tive is to determine the effect on system reliability from component failures, but the technique can be extended to determine the effect on safety. FMEA input data in-cludes detailed hardware/function design information. Design data may be in the form of the design concept, the operational concept, and major components planned for use in the system and major system functions. FMEA output information includes identification of failure modes in the system under analysis, evaluation of the failure effects, identification of hazards, and identification of system critical items in the form of a critical items list (AIAG, 2002).
Actually, the FMEA methodology is designed to identify potential failure modes for process, assess the risk associated with these failure modes and prioritize issues for corrective action and identify and carry out corrective actions to address the most serious concerns (Virtanen and Hagmark, 2007). In FMEA, failures are prioritized according to how serious their consequences are, how frequently they occur and how easily they can
FMEA Process
1. Evaluate design2. Identify potential failure
modes3. Evaluate effect of each
identified failure mode.4. Document process.
Output
• Failure mode• Consequences• Reliability predication• Hazards & risk• Critical Item List (CIL)
Input
• Design knowledge• Failure knowledge• Failure mode types• Failure rates
Figure 1. FMEA overview.
Hazard Analysis and Risk Assessments for Industrial Processes Using FMEA and Bow-Tie Methodologies Vol 14, No 4, December 2015, pp.379-391, © 2015 KIIE 381
be detected. Ideally, FMEA begins during the earliest conceptual stages of design and continues throughout the life of the product or service. Results are used to identify high-vulnerability elements to guide resource deployment.
An FMEA can be done any time in the system. RPN is simply calculated by the following equation:
RPN = Severity (S)×Occurrence (O)
×Detection (D) (1) The total RPN is calculated by adding all of the
risk priority numbers. The small RPN is always better than the high RPN. It could be computed for the entire process and/or for the design process only. Once it is calculated, it is easy to determine the areas of greatest concern. There could be less severe failures, but which occur more often and are less detectable. These actions can include specific inspection, testing or quality proce-dures, redesign (such as selection of new components), adding more redundancy and limiting environmental stresses or operating range. Once the actions have been implemented in the design/process, the new RPN should be checked, to confirm the improvements (Janarthanan, 2013; Abdel-Aziz and Helal, 2012).
3.2 Bow-Tie Methodology
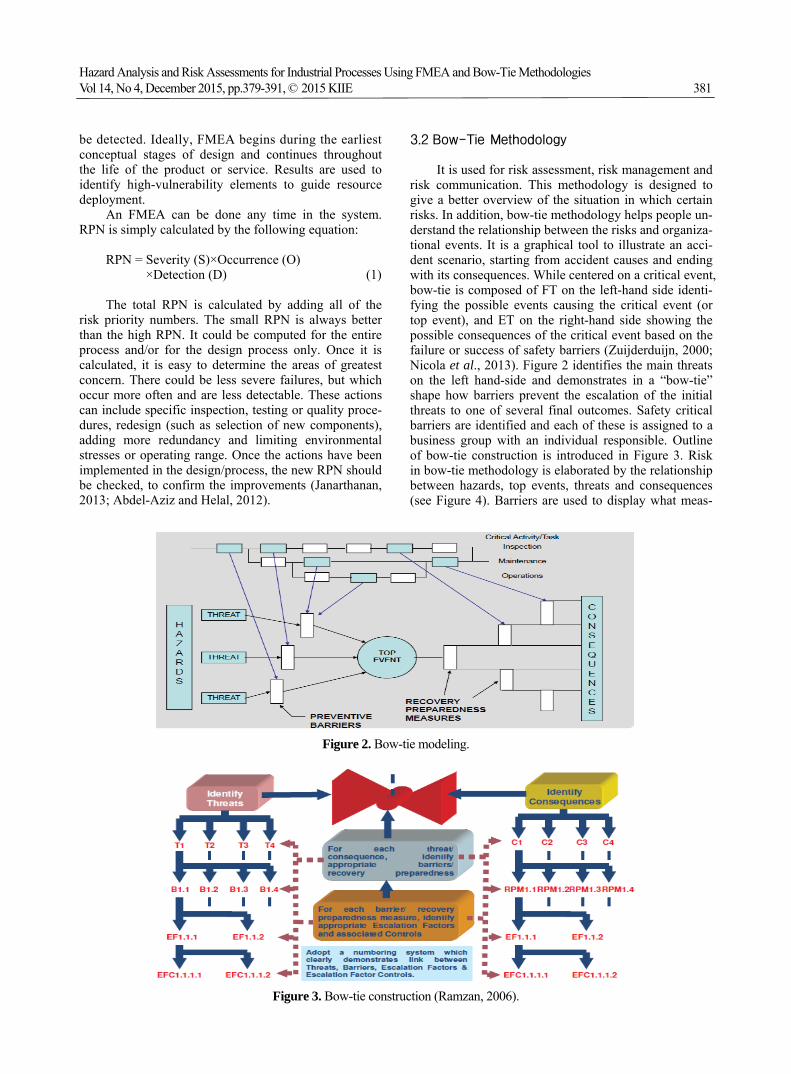
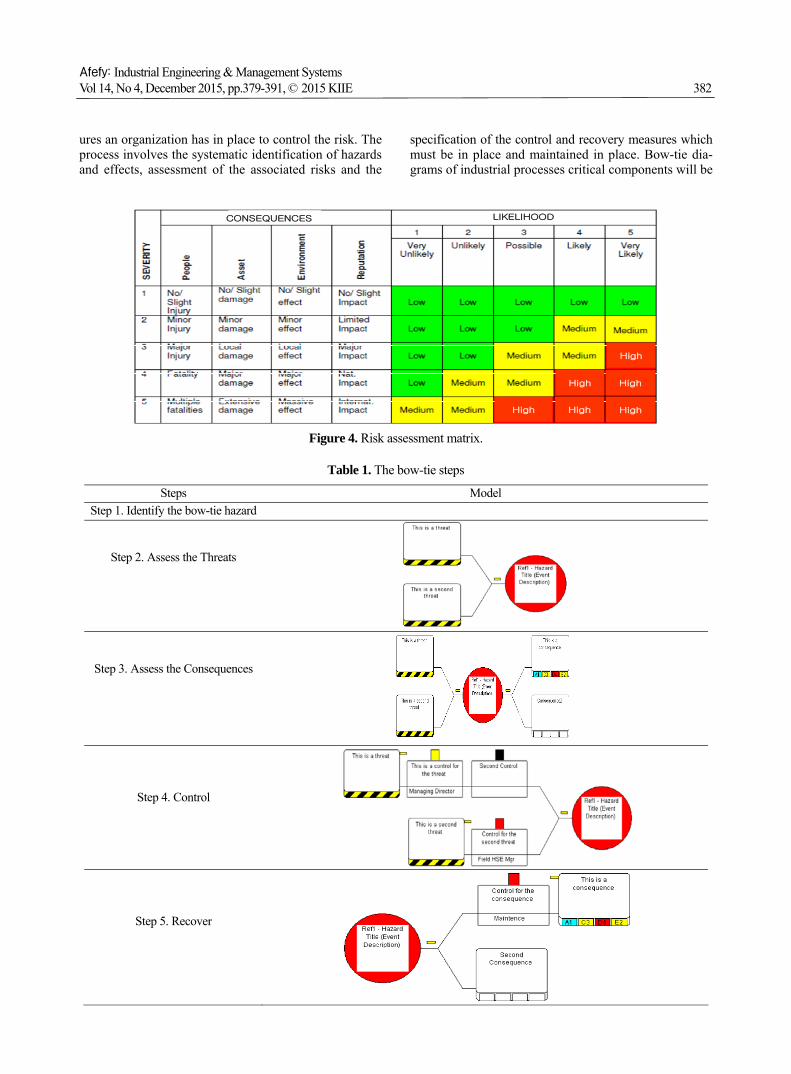
It is used for risk assessment, risk management and risk communication. This methodology is designed to give a better overview of the situation in which certain risks. In addition, bow-tie methodology helps people un-derstand the relationship between the risks and organiza-tional events. It is a graphical tool to illustrate an acci-dent scenario, starting from accident causes and ending with its consequences. While centered on a critical event, bow-tie is composed of FT on the left-hand side identi-fying the possible events causing the critical event (or top event), and ET on the right-hand side showing the possible consequences of the critical event based on the failure or success of safety barriers (Zuijderduijn, 2000; Nicola et al., 2013). Figure 2 identifies the main threats on the left hand-side and demonstrates in a “bow-tie” shape how barriers prevent the escalation of the initial threats to one of several final outcomes. Safety critical barriers are identified and each of these is assigned to a business group with an individual responsible. Outline of bow-tie construction is introduced in Figure 3. Risk in bow-tie methodology is elaborated by the relationship between hazards, top events, threats and consequences (see Figure 4). Barriers are used to display what meas-
Figure 2. Bow-tie modeling.
Figure 3. Bow-tie construction (Ramzan, 2006).
Afefy: Industrial Engineering & Management Systems Vol 14, No 4, December 2015, pp.379-391, © 2015 KIIE 382
ures an organization has in place to control the risk. The process involves the systematic identification of hazards and effects, assessment of the associated risks and the
specification of the control and recovery measures which must be in place and maintained in place. Bow-tie dia-grams of industrial processes critical components will be
High High
High High
High
High
CONSEQUENCES LIKELIHOOD
Figure 4. Risk assessment matrix.
Table 1. The bow-tie steps
Steps Model Step 1. Identify the bow-tie hazard
Step 2. Assess the Threats
Step 3. Assess the Consequences
Step 4. Control
Step 5. Recover
Hazard Analysis and Risk Assessments for Industrial Processes Using FMEA and Bow-Tie Methodologies Vol 14, No 4, December 2015, pp.379-391, © 2015 KIIE 383
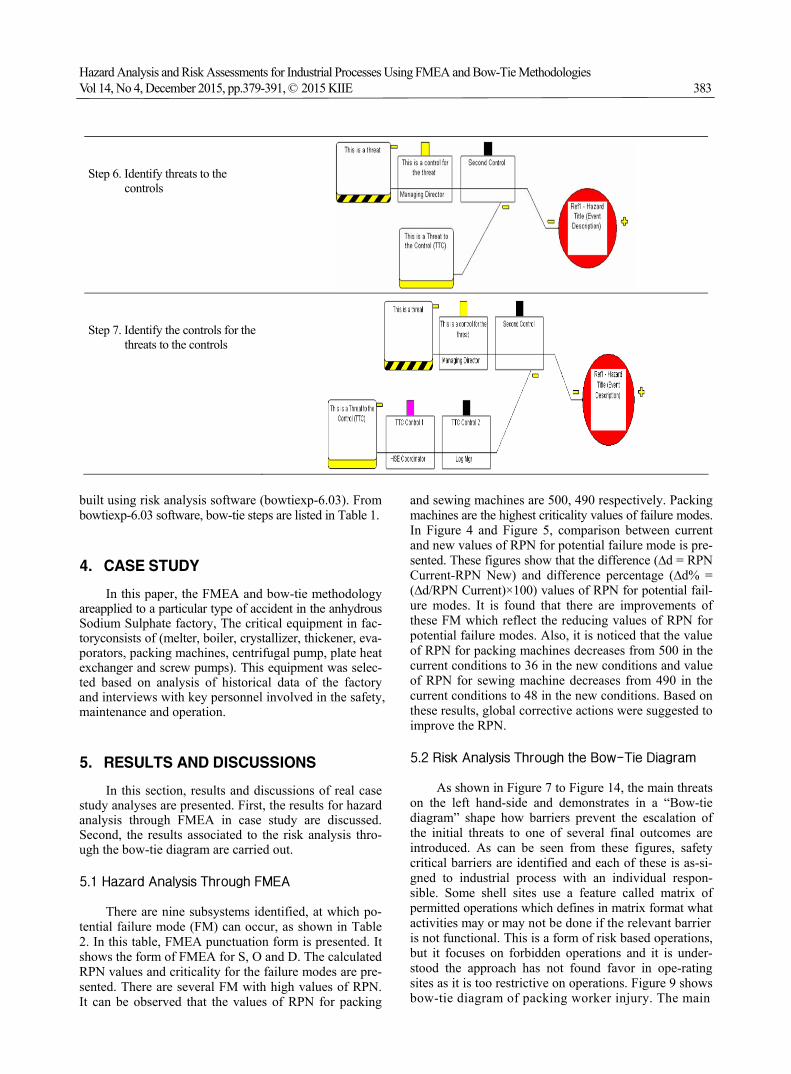
built using risk analysis software (bowtiexp-6.03). From bowtiexp-6.03 software, bow-tie steps are listed in Table 1.
4. CASE STUDY
In this paper, the FMEA and bow-tie methodology areapplied to a particular type of accident in the anhydrous Sodium Sulphate factory, The critical equipment in fac-toryconsists of (melter, boiler, crystallizer, thickener, eva-porators, packing machines, centrifugal pump, plate heat exchanger and screw pumps). This equipment was selec-ted based on analysis of historical data of the factory and interviews with key personnel involved in the safety, maintenance and operation.
5. RESULTS AND DISCUSSIONS
In this section, results and discussions of real case study analyses are presented. First, the results for hazard analysis through FMEA in case study are discussed. Second, the results associated to the risk analysis thro-ugh the bow-tie diagram are carried out.
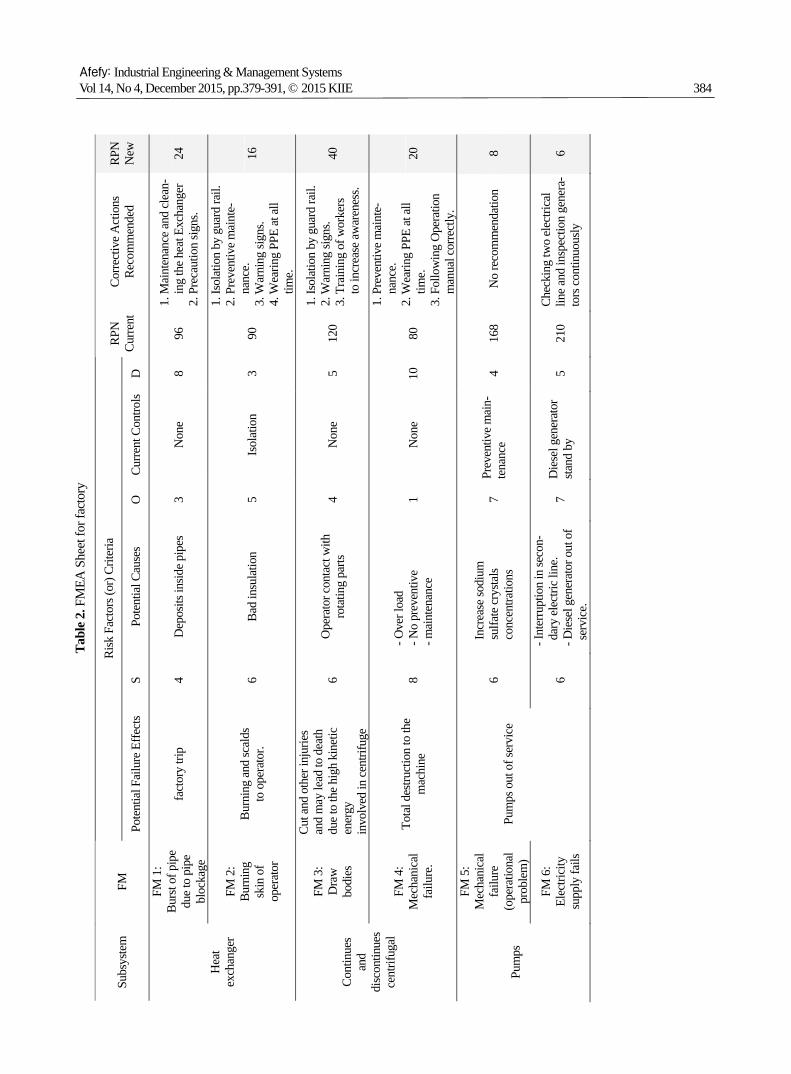
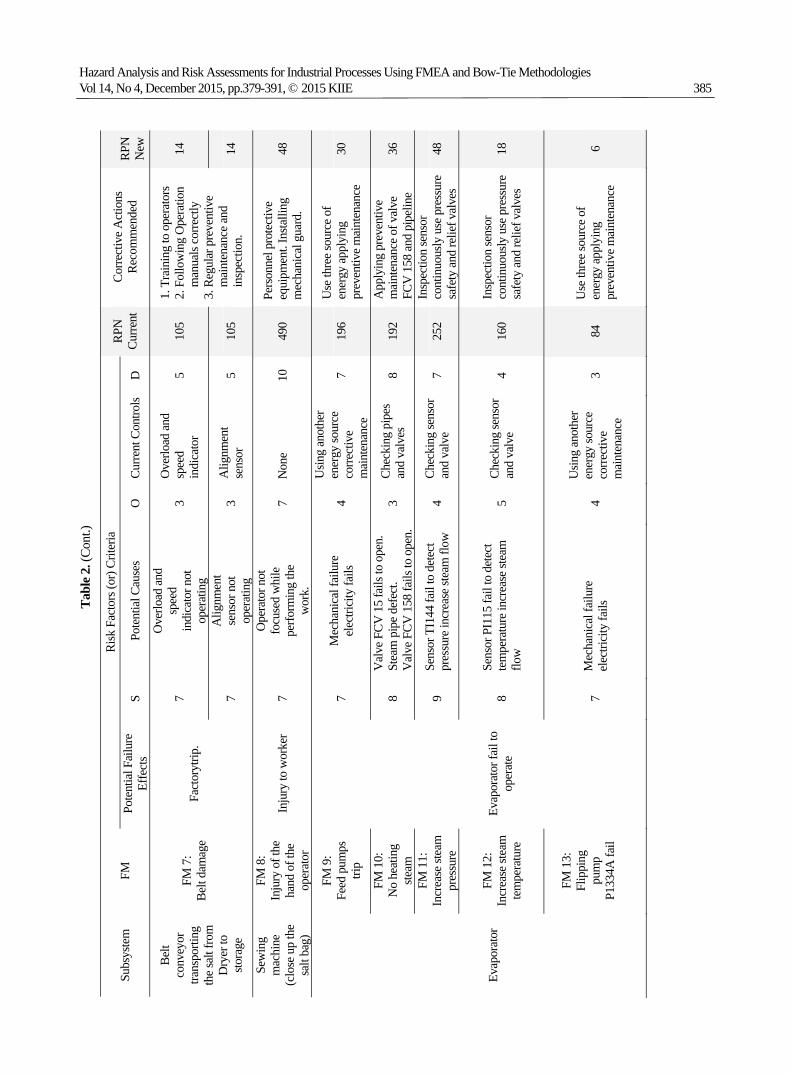
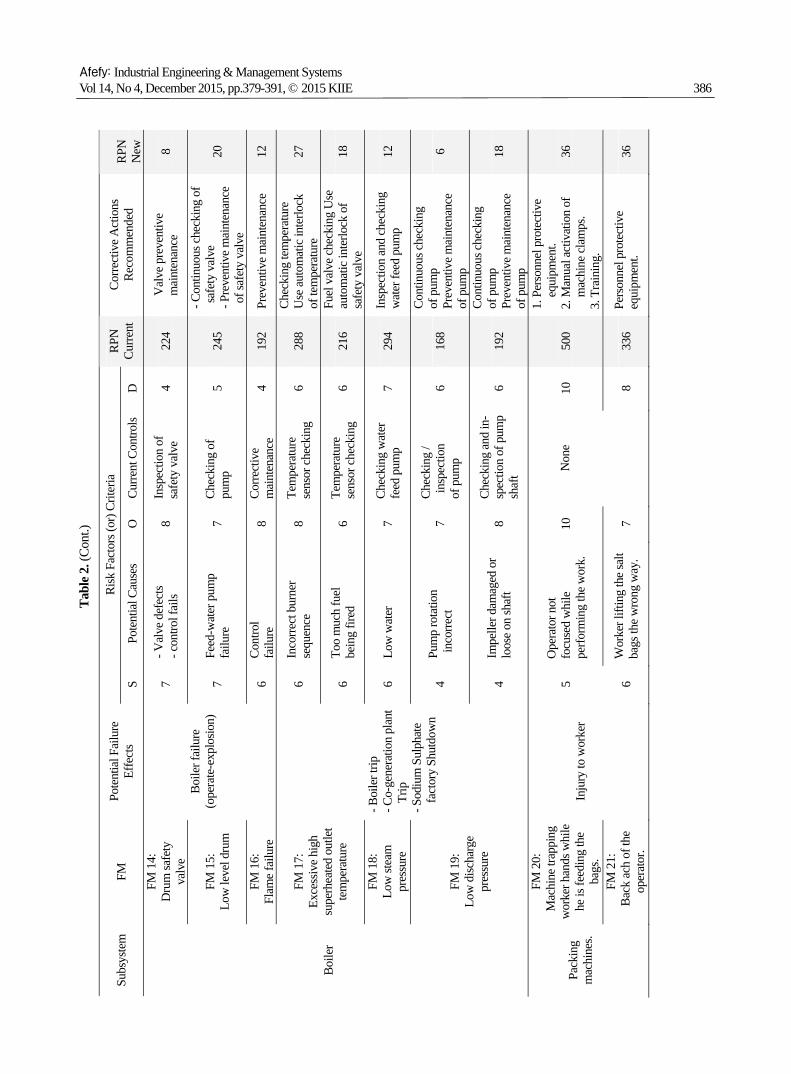
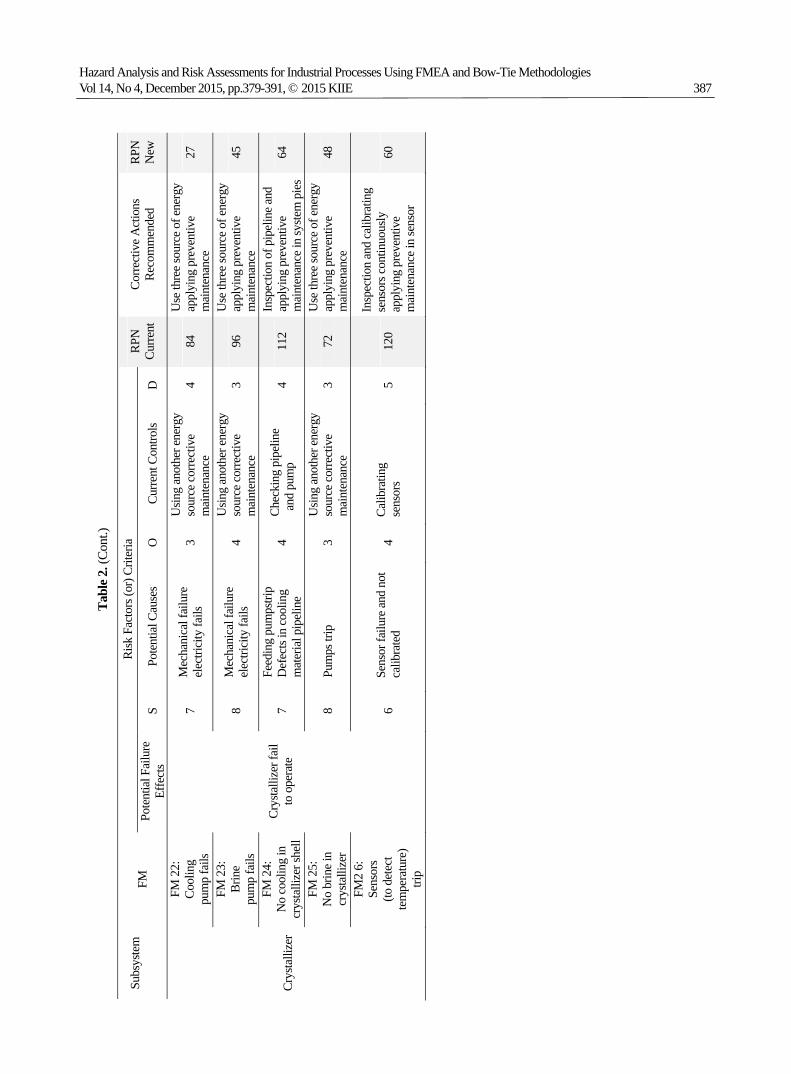
5.1 Hazard Analysis Through FMEA
There are nine subsystems identified, at which po-tential failure mode (FM) can occur, as shown in Table 2. In this table, FMEA punctuation form is presented. It shows the form of FMEA for S, O and D. The calculated RPN values and criticality for the failure modes are pre-sented. There are several FM with high values of RPN. It can be observed that the values of RPN for packing
and sewing machines are 500, 490 respectively. Packing machines are the highest criticality values of failure modes. In Figure 4 and Figure 5, comparison between current and new values of RPN for potential failure mode is pre-sented. These figures show that the difference (∆d = RPN Current-RPN New) and difference percentage (∆d% = (∆d/RPN Current)×100) values of RPN for potential fail-ure modes. It is found that there are improvements of these FM which reflect the reducing values of RPN for potential failure modes. Also, it is noticed that the value of RPN for packing machines decreases from 500 in the current conditions to 36 in the new conditions and value of RPN for sewing machine decreases from 490 in the current conditions to 48 in the new conditions. Based on these results, global corrective actions were suggested to improve the RPN.
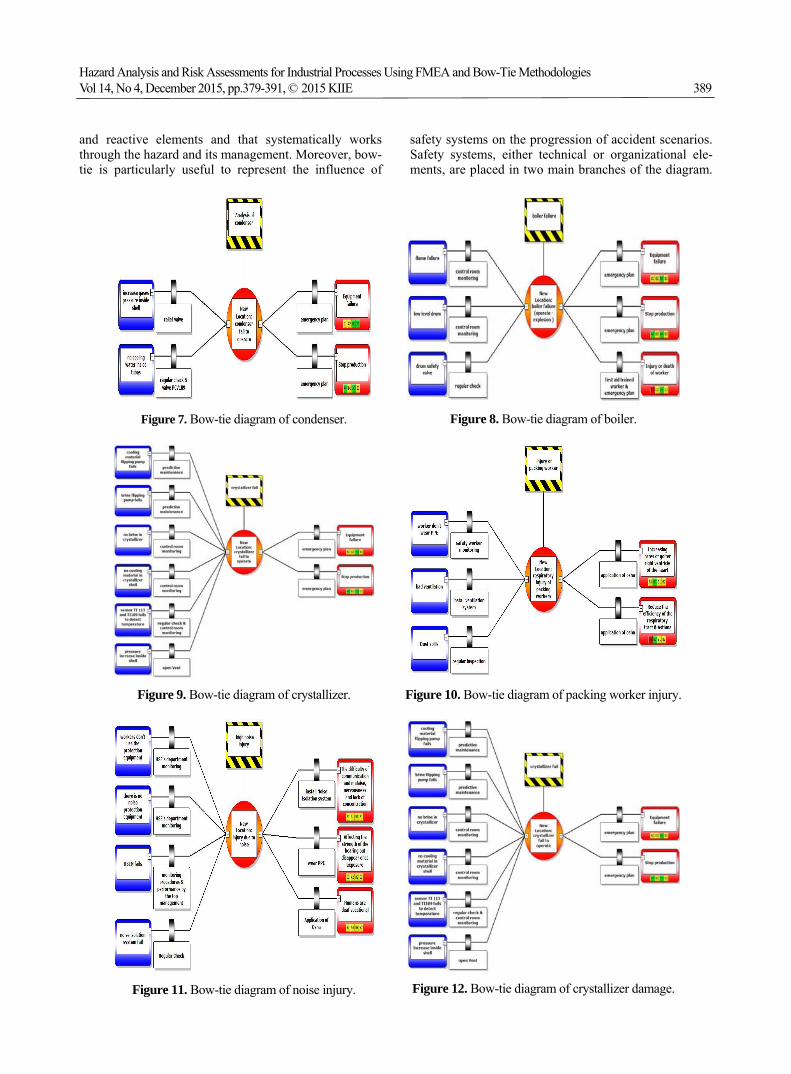
5.2 Risk Analysis Through the Bow-Tie Diagram
As shown in Figure 7 to Figure 14, the main threats on the left hand-side and demonstrates in a “Bow-tie diagram” shape how barriers prevent the escalation of the initial threats to one of several final outcomes are introduced. As can be seen from these figures, safety critical barriers are identified and each of these is as-si-gned to industrial process with an individual respon-sible. Some shell sites use a feature called matrix of permitted operations which defines in matrix format what activities may or may not be done if the relevant barrier is not functional. This is a form of risk based operations, but it focuses on forbidden operations and it is under-stood the approach has not found favor in ope-rating sites as it is too restrictive on operations. Figure 9 shows bow-tie diagram of packing worker injury. The main
Step 6. Identify threats to the
controls
Step 7. Identify the controls for the
threats to the controls
Afefy: Industrial Engineering & Management Systems Vol 14, No 4, December 2015, pp.379-391, © 2015 KIIE 384
Tab
le 2
. FM
EA S
heet
for f
acto
ry
Risk
Fac
tors
(or)
Crite
ria
Subs
yste
m
FM
Pote
ntia
l Fai
lure
Effe
cts
S Po
tent
ial C
ause
s O
Cu
rrent
Con
trols
D
RPN
Curre
ntCo
rrect
ive A
ctio
ns
Reco
mm
ende
d RP
NN
ew
FM 1
: Bu
rst o
f pip
e
due
to p
ipe
bl
ocka
ge
fact
ory
trip
4 D
epos
its in
side p
ipes
3
Non
e 8
96
1. M
aint
enan
ce an
d cl
ean-
ing
the h
eat E
xcha
nger
2. P
reca
utio
n sig
ns.
24
H
eat
ex
chan
ger
FM 2
: Bu
rnin
g
skin
of
op
erat
or
Burn
ing
and
scal
ds
to o
pera
tor.
6 Ba
d in
sula
tion
5 Is
olat
ion
3 90
1. Is
olat
ion
by g
uard
rail.
2.
Pre
vent
ive m
aint
e-na
nce.
3.
War
ning
sign
s. 4.
Wea
ring
PPE
at al
l tim
e.
16
FM 3
: D
raw
bo
dies
Cut a
nd o
ther
inju
ries
and
may
lead
to d
eath
du
e to
the h
igh
kine
tic
ener
gy
invo
lved
in c
entri
fuge
6 O
pera
tor c
onta
ct w
ith
rota
ting
parts
4
Non
e 5
120
1. Is
olat
ion
by g
uard
rail.
2.
War
ning
sign
s. 3.
Tra
inin
g of
wor
kers
to
incr
ease
aw
aren
ess.
40
Cont
inue
s an
d di
scon
tinue
s ce
ntrif
ugal
FM 4
:
Mec
hani
cal
failu
re.
Tota
l des
truct
ion
to th
e m
achi
ne
8 - O
ver l
oad
- No
prev
entiv
e - m
aint
enan
ce
1 N
one
1080
1. P
reve
ntiv
e mai
nte-
nanc
e.
2. W
earin
g PP
E at
all
time.
3.
Fol
low
ing
Ope
ratio
n
man
ual c
orre
ctly
.
20
Pu
mps
FM 5
: M
echa
nica
l fa
ilure
(o
pera
tiona
l pr
oble
m)
Pu
mps
out
of s
ervi
ce
6 In
crea
se so
dium
su
lfate
crys
tals
conc
entra
tions
7
Prev
entiv
e mai
n-te
nanc
e 4
168
No
reco
mm
enda
tion
8
FM
6:
Elec
trici
ty
supp
ly fa
ils
6
- Int
erru
ptio
n in
seco
n-da
ry e
lect
ric li
ne.
- Die
sel g
ener
ator
out
of
serv
ice.
7 D
iese
l gen
erat
or
stand
by
5 21
0 Ch
ecki
ng tw
o el
ectri
cal
line a
nd in
spec
tion
gene
ra-
tors
con
tinuo
usly
6
Hazard Analysis and Risk Assessments for Industrial Processes Using FMEA and Bow-Tie Methodologies Vol 14, No 4, December 2015, pp.379-391, © 2015 KIIE 385
Tabl
e 2. (
Cont
.)
Risk
Fac
tors
(or)
Crite
ria
Subs
yste
m
FM
Pote
ntia
l Fai
lure
Ef
fect
s S
Pote
ntia
l Cau
ses
O
Curre
nt C
ontro
lsD
RP
N
Curre
ntCo
rrect
ive A
ctio
ns
Reco
mm
ende
d
RP
NN
ew
7
Ove
rload
and
spee
d in
dica
tor n
ot
oper
atin
g
3 O
verlo
ad an
d sp
eed
indi
cato
r 5
105
14
Belt
conv
eyor
tra
nspo
rting
th
e sal
t fro
m
Dry
er to
sto
rage
FM 7
: Be
lt da
mag
e
Fact
oryt
rip.
7 A
lignm
ent
sens
or n
ot
oper
atin
g3
Alig
nmen
t se
nsor
5
105
1. T
rain
ing
to o
pera
tors
2.
Fol
low
ing
Ope
ratio
n
man
uals
corre
ctly
3.
Reg
ular
pre
vent
ive
m
aint
enan
ce an
d
insp
ectio
n.
14
Sew
ing
mac
hine
(c
lose
up
the
salt
bag)
FM 8
: In
jury
of t
he
hand
of t
he
oper
ator
Inju
ry to
wor
ker
7
Ope
rato
r not
fo
cuse
d w
hile
pe
rform
ing
the
wor
k.
7 N
one
10
490
Pers
onne
l pro
tect
ive
eq
uipm
ent.
Insta
lling
m
echa
nica
l gua
rd.
48
FM 9
: Fe
ed p
umps
tri
p 7
Mec
hani
cal f
ailu
re
elec
trici
ty fa
ils
4
Usin
g an
othe
r en
ergy
sour
ce
corre
ctiv
e
mai
nten
ance
7 19
6 U
se th
ree s
ourc
e of
en
ergy
app
lyin
g
prev
entiv
e mai
nten
ance
30
FM 1
0:
No
heat
ing
steam
8
Val
ve F
CV 1
5 fa
ils to
ope
n.
Stea
m p
ipe
defe
ct.
V
alve
FCV
158
fails
to o
pen.
3
Chec
king
pip
es
and
valv
es
8 19
2 A
pply
ing
prev
entiv
e
mai
nten
ance
of v
alve
FC
V 1
58 a
nd p
ipel
ine
36
FM 1
1:
Incr
ease
stea
m
pres
sure
9
Sens
or T
I144
fail
to d
etec
t pr
essu
re in
crea
se st
eam
flow
4 Ch
ecki
ng se
nsor
an
d va
lve
7 25
2 In
spec
tion
sens
or
cont
inuo
usly
use
pre
ssur
e sa
fety
and
relie
f val
ves
48
Ev
apor
ator
FM
12:
In
crea
se st
eam
te
mpe
ratu
re
Ev
apor
ator
fail
to
oper
ate
8
Sens
or P
I115
fail
to d
etec
t
tem
pera
ture
incr
ease
stea
m
flow
5
Chec
king
sens
or
and
valv
e 4
160
Insp
ectio
n se
nsor
co
ntin
uous
ly u
se p
ress
ure
safe
ty a
nd re
lief v
alve
s 18
FM
13:
Fl
ippi
ng
pum
p P1
334A
fail
7
Mec
hani
cal f
ailu
re
elec
trici
ty fa
ils
4
Usin
g an
othe
r en
ergy
sour
ce
corre
ctiv
e
mai
nten
ance
3 84
U
se th
ree s
ourc
e of
en
ergy
app
lyin
g
prev
entiv
e mai
nten
ance
6
Afefy: Industrial Engineering & Management Systems Vol 14, No 4, December 2015, pp.379-391, © 2015 KIIE 386
Tabl
e 2. (
Cont
.)
Risk
Fac
tors
(or)
Crite
ria
Subs
yste
m
FM
Pote
ntia
l Fai
lure
Ef
fect
s S
Pote
ntia
l Cau
ses
O
Curre
nt C
ontro
lsD
RP
N
Curre
ntCo
rrect
ive A
ctio
ns
Reco
mm
ende
d
RP
NN
ewFM
14:
D
rum
safe
ty
valv
e 7
- Val
ve d
efec
ts
- con
trol f
ails
8 In
spec
tion
of
safe
ty v
alve
4
224
Val
ve p
reve
ntiv
e
mai
nten
ance
8
FM 1
5:
Low
leve
l dru
m
7 Fe
ed-w
ater
pum
p
failu
re
7 Ch
ecki
ng o
f pu
mp
5
245
- Con
tinuo
us c
heck
ing
of
saf
ety
valv
e
- Pre
vent
ive
mai
nten
ance
of
safe
ty v
alve
20
FM 1
6:
Flam
e fa
ilure
Boile
r fai
lure
(o
pera
te-e
xplo
sion)
6 Co
ntro
l fa
ilure
8
Corre
ctiv
e
mai
nten
ance
4
192
Prev
entiv
e mai
nten
ance
12
6 In
corre
ct b
urne
r se
quen
ce
8 Te
mpe
ratu
re
sens
or c
heck
ing
6 28
8 Ch
ecki
ng te
mpe
ratu
re
Use
aut
omat
ic in
terlo
ck
of te
mpe
ratu
re
27
FM 1
7:
Exce
ssiv
e hig
h
supe
rhea
ted
outle
t te
mpe
ratu
re
6 To
o m
uch
fuel
be
ing
fired
6
Tem
pera
ture
se
nsor
che
ckin
g 6
216
Fuel
val
ve c
heck
ing
Use
au
tom
atic
inte
rlock
of
sa
fety
val
ve
18
FM 1
8:
Low
stea
m
pres
sure
6
Low
wat
er
7 Ch
ecki
ng w
ater
fe
ed p
ump
7 29
4 In
spec
tion
and
chec
king
w
ater
feed
pum
p 12
4 Pu
mp
rota
tion
inc
orre
ct
7 Ch
ecki
ng /
ins
pect
ion
of
pum
p
6 16
8
Cont
inuo
us c
heck
ing
of
pum
p Pr
even
tive m
aint
enan
ce
of p
ump
6
Bo
iler
FM 1
9:
Low
disc
harg
e
pres
sure
- B
oile
r trip
- C
o-ge
nera
tion
plan
t Tr
ip
- Sod
ium
Sul
phat
e fa
ctor
y Sh
utdo
wn
4
Impe
ller d
amag
ed o
r lo
ose
on sh
aft
8 Ch
ecki
ng a
nd in
-sp
ectio
n of
pum
p sh
aft
6 19
2
Cont
inuo
us c
heck
ing
of
pum
p Pr
even
tive m
aint
enan
ce
of p
ump
18
Pa
ckin
g m
achi
nes.
FM 2
0:
Mac
hine
trap
ping
w
orke
r han
ds w
hile
he
is fe
edin
g th
e ba
gs.
In
jury
to w
orke
r 5
Ope
rato
r not
fo
cuse
d w
hile
pe
rform
ing
the w
ork.
10
N
one
10
500
1. P
erso
nnel
pro
tect
ive
eq
uipm
ent.
2. M
anua
l act
ivat
ion
of
mac
hine
cla
mps
. 3.
Tra
inin
g.
36
FM
21:
B
ack
ach
of th
e op
erat
or.
6
Wor
ker l
iftin
g th
e sa
lt ba
gs th
e wro
ng w
ay.
7
8 33
6 Pe
rson
nel p
rote
ctiv
e
equi
pmen
t. 36
Hazard Analysis and Risk Assessments for Industrial Processes Using FMEA and Bow-Tie Methodologies Vol 14, No 4, December 2015, pp.379-391, © 2015 KIIE 387
Tabl
e 2. (
Cont
.)
Risk
Fac
tors
(or)
Crite
ria
Subs
yste
m
FM
Po
tent
ial F
ailu
re
Effe
cts
S Po
tent
ial C
ause
s O
Cu
rrent
Con
trols
D
RPN
Cu
rrent
Corre
ctiv
e Act
ions
Re
com
men
ded
RPN
New
FM 2
2:
Cool
ing
pum
p fa
ils
7 M
echa
nica
l fai
lure
el
ectri
city
fails
3
Usin
g an
othe
r ene
rgy
sour
ce c
orre
ctiv
e
mai
nten
ance
4
84
Use
thre
e sou
rce o
f ene
rgy
appl
ying
pre
vent
ive
m
aint
enan
ce
27
FM 2
3:
Brin
e
pum
p fa
ils
8 M
echa
nica
l fai
lure
el
ectri
city
fails
4
Usin
g an
othe
r ene
rgy
sour
ce c
orre
ctiv
e m
aint
enan
ce
3 96
U
se th
ree s
ourc
e of e
nerg
y ap
plyi
ng p
reve
ntiv
e
mai
nten
ance
45
FM 2
4:
No
cool
ing
in
crys
talli
zer s
hell
7 Fe
edin
g pu
mps
trip
Def
ects
in c
oolin
g
mat
eria
l pip
elin
e 4
Chec
king
pip
elin
e a
nd p
ump
4 11
2 In
spec
tion
of p
ipel
ine a
nd
appl
ying
pre
vent
ive
m
aint
enan
ce in
syste
m p
ies
64
Cr
ysta
llize
r
FM 2
5:
No
brin
e in
cr
ysta
llize
r
Cr
ysta
llize
r fai
l to
ope
rate
8 Pu
mps
trip
3
Usin
g an
othe
r ene
rgy
sour
ce c
orre
ctiv
e
mai
nten
ance
3
72
Use
thre
e sou
rce o
f ene
rgy
appl
ying
pre
vent
ive
m
aint
enan
ce
48
FM2
6:
Sens
ors
(to d
etec
t te
mpe
ratu
re)
trip
6
Sens
or fa
ilure
and
not
ca
libra
ted
4 Ca
libra
ting
se
nsor
s 5
120
Insp
ectio
n an
d ca
libra
ting
sens
ors c
ontin
uous
ly
appl
ying
pre
vent
ive
m
aint
enan
ce in
sens
or
60

Afefy: Industrial Engineering & Management Systems Vol 14, No 4, December 2015, pp.379-391, © 2015 KIIE 388
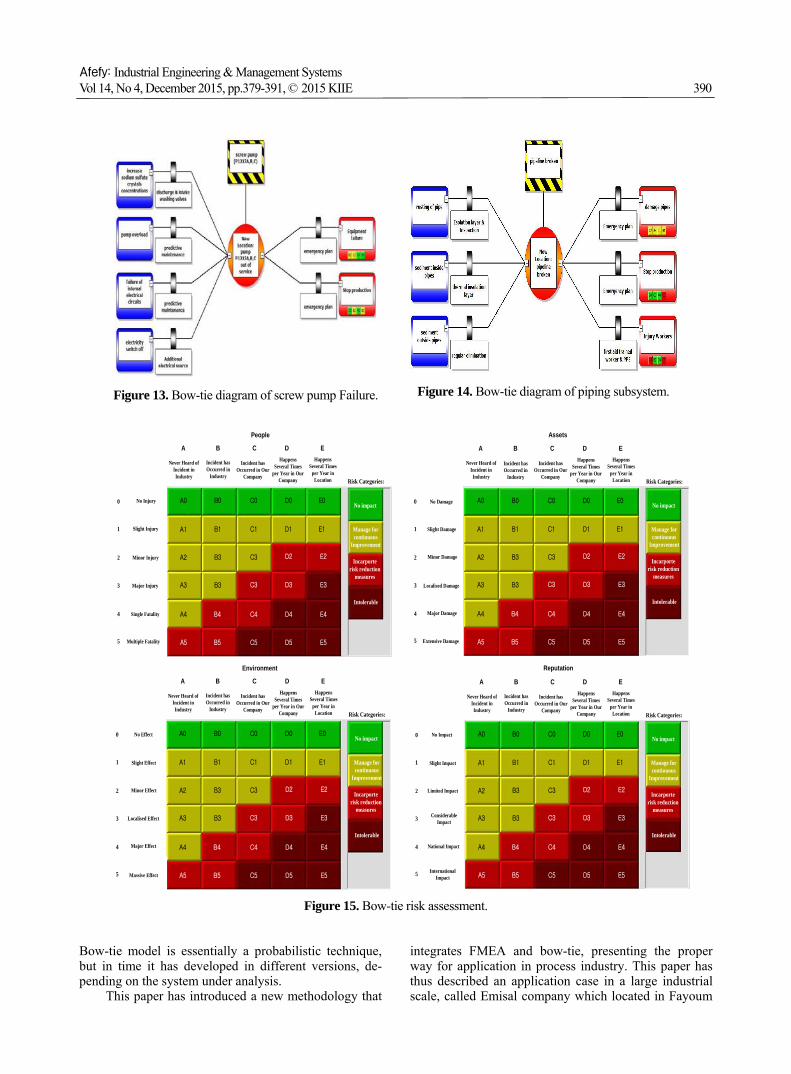
threats of the working injury are safety working mon-toring, install, and regular inspection.The main con-sequence of corrective action of packing worker injury is application of OSHA. Figure 11 shows bow-tie diagram of noise injury. In Figure 15, bow-tie risk assessment is plotted. As can be seen from this figure, risk categories in factory for people, asset, environment and reputation. From this figure, the values in red and brown are con-sidered critical. The subsystem on each zone found to have RPN highest value were studied further to mini-mize the S, reduce the O of the failure mode, and im-prove the D. Based on these results, the main conse-
quence of the corrective action should be applied in critical equipment for factory.
6. CONCLUSION
In this paper, bow-tie and FMEA methodologies are suggested to hazard analysis and risk assessments for the industrial processes. FMEA is a systematic tool for identifying the effects or consequences of FM and is used to eliminate or reduce the chance of failure. Bow-tie is considered as an approach that has both proactive
500450400350300250200150100
500
RPN
RPN New
RPN Current
FM
1FM
2FM
3FM
4FM
5FM
6FM
7FM
8FM
9FM
10FM
11FM
12FM
13FM
14FM
15FM
16FM
17FM
18FM
19FM
20FM
21FM
22FM
23FM
24FM
25FM
26FM
Figure 5. Comparison between current and new RPN values for FM.
120
100
80
60
40
20
0
Diff
eren
ce %
Δd = RPN Current-RPN NewDifference %(Δd%) = (Δd/RPN Current)*100
FM
FM1
FM2
FM3
FM4
FM5
FM6
FM7
FM8
FM9
FM10
FM11
FM12
FM13
FM14
FM15
FM16
FM17
FM18
FM19
FM20
FM21
FM22
FM23
FM24
FM25
FM26
Figure 6. Shows the RPN difference for FM.
Hazard Analysis and Risk Assessments for Industrial Processes Using FMEA and Bow-Tie Methodologies Vol 14, No 4, December 2015, pp.379-391, © 2015 KIIE 389
and reactive elements and that systematically works through the hazard and its management. Moreover, bow-tie is particularly useful to represent the influence of
safety systems on the progression of accident scenarios. Safety systems, either technical or organizational ele-ments, are placed in two main branches of the diagram.
Figure 7. Bow-tie diagram of condenser.
Figure 8. Bow-tie diagram of boiler.
Figure 9. Bow-tie diagram of crystallizer.
Figure 10. Bow-tie diagram of packing worker injury.
Figure 11. Bow-tie diagram of noise injury.
Figure 12. Bow-tie diagram of crystallizer damage.
Afefy: Industrial Engineering & Management Systems Vol 14, No 4, December 2015, pp.379-391, © 2015 KIIE 390
Bow-tie model is essentially a probabilistic technique, but in time it has developed in different versions, de-pending on the system under analysis.
This paper has introduced a new methodology that
integrates FMEA and bow-tie, presenting the proper way for application in process industry. This paper has thus described an application case in a large industrial scale, called Emisal company which located in Fayoum
Figure 13. Bow-tie diagram of screw pump Failure.
Figure 14. Bow-tie diagram of piping subsystem.
A5 B5 C5 D5 E5
B4 C4 D4 E4
C3 D3 E3
D2 E2
Intolerable
Incarporterisk reduction
measures
Manage forcontinuous
Improvement
No impact
Risk Categories:
Never Heard ofIncident inIndustry
HappensSeveral Times
per Year inLocation
Incident hasOccurred in
Industry
Incident hasOccurred in Our
Company
HappensSeveral Times
per Year in OurCompany
A B C D E
People
0
1
2
3
4
5
No Injury
Slight Injury
Minor Injury
Multiple Fatality
Major Injury
Single Fatality A4
A3
A2
A1
A0 B0 C0 D0 E0
B1 C1 D1 E1
B3 C3
B3
A5 B5 C5 D5 E5
B4 C4 D4 E4
C3 D3 E3
D2 E2
Intolerable
Incarporterisk reduction
measures
Manage forcontinuous
Improvement
No impact
Risk Categories:
Never Heard ofIncident inIndustry
HappensSeveral Times
per Year inLocation
Incident hasOccurred in
Industry
Incident hasOccurred in Our
Company
HappensSeveral Times
per Year in OurCompany
A B C D E
Assets
0
1
2
3
4
5 Extensive Damage
Major Damage A4
A3
A2
A1
A0 B0 C0 D0 E0
B1 C1 D1 E1
B3 C3
B3
No Damage
Slight Damage
Minor Damage
Localised Damage
A5 B5 C5 D5 E5
B4 C4 D4 E4
C3 D3 E3
D2 E2
Intolerable
Incarporterisk reduction
measures
Manage forcontinuous
Improvement
No impact
Risk Categories:
Never Heard ofIncident inIndustry
HappensSeveral Times
per Year inLocation
Incident hasOccurred in
Industry
Incident hasOccurred in Our
Company
HappensSeveral Times
per Year in OurCompany
A B C D E
Environment
0
1
2
3
4
5 Massive Effect
A4
A3
A2
A1
A0 B0 C0 D0 E0
B1 C1 D1 E1
B3 C3
B3
No Effect
Localised Effect
Major Effect
Minor Effect
Slight Effect
A5 B5 C5 D5 E5
B4 C4 D4 E4
C3 D3 E3
D2 E2
Intolerable
Incarporterisk reduction
measures
Manage forcontinuous
Improvement
No impact
Risk Categories:
Never Heard ofIncident inIndustry
HappensSeveral Times
per Year inLocation
Incident hasOccurred in
Industry
Incident hasOccurred in Our
Company
HappensSeveral Times
per Year in OurCompany
A B C D E
Reputation
0
1
2
3
4
5
A4
A3
A2
A1
A0 B0 C0 D0 E0
B1 C1 D1 E1
B3 C3
B3
InternationalImpact
National Impact
ConsiderableImpact
No Impact
Limited Impact
Slight Impact
Figure 15. Bow-tie risk assessment.
Hazard Analysis and Risk Assessments for Industrial Processes Using FMEA and Bow-Tie Methodologies Vol 14, No 4, December 2015, pp.379-391, © 2015 KIIE 391
city, Egypt. As a result of this methodology, the detec-tion rating to the failure mode, the values of RPN are calculated based on FMEA analysis. A set of corrective actions are suggested to improve the values of RPN. As a result of the subsequent bow-tie analysis, safety criti-cal barriers are identified and each of these is assigned to industrial process with an individual responsible. The results show the effectiveness of the proposed method-ology in process industry.
The current research can be further extended in fu-ture research work through various directions. The first direction can be the integration of the proposed method-ology with other risk assessment techniques. Further-more, the proposed method can be applied to other indu-strial and risk environments.
REFERENCES
Abdel-Aziz, I. H. and Helal, M. (2012), Application of FMEA-FTA in Reliability-Centered Maintenance Planning, 15th International Conference on Applied Mechanics and Mechanical Engineering, Military Technical College Kobry El-Kobbah, Cairo, Egypt.
AIAG (2002), FMEA-3 Potential Failure Mode and Ef-fects Analysis, 3rd ed., Automotive Industry Action Group (AIAG), (equivalent of SAE J-1739).
Aneziris, O. N., Papazoglou, I. A., Baksteen, H., Mud, M., Ale, B. J., Bellamy, L. J., Hale, A. R., Bloem-hoff, A., Post, J., and Oh, J. (2008), Quantified Risk Assessment for fall from Height, Safety Science, 46(2), 198-220.
Arun, J., Pravin, K., Venkatesh, M., and Giridharan, A. (2013), Reliability Study on Spark Plugs Using Pro-cess Failure Mode and Effect Analysis, Internatio-nal Journal of Engineering Research and Devel-opment, 9, 13-21.
Bellamy, L. J., Mud, M., Manuel, H. J., and Oh, J. (2013), Analysis of Underlying Causes of Investigated Loss of Containment Incidents in Dutch Seveso plants Using the Story builder method, J. Loss Prev. Pro-cess Ind..
Catalin, D., Neddef. V., and Panainte. M. (2013), Analy-sis of Technological Risk Assessment Methods in
Order to Identify Definitory Elements for A New Combined/Complete Risk Assessment Method, Jour-nal of Engineering Studies and Research, 19, 33-43.
Celeste, J. and Cristina, S. (2010), A semi-quantitative Assessment of Occupational Risks Using Bow-tie Representation, Safety Science, 48, 973-979.
Janarthanan, V. and Kumar, D. R. (2013), Root Cause Analysis and Process Failure Mode and Effect Ana-lysis of TIG Welding on SS 3041 Material, Pro-ceeding of NC MISAA.
Kahn, F., Yang, M., Veitch, B., Ehlers, S., and Chai (2014), Transportation Risk Analysis Framework for Arctic Waters, OMAE 2014, San Francisco, Cali-fornia, USA.
Kurowicka, D., Cooke, R., Goossens, L., and Ale, B. (2006), Expert Judgment Study for Placement Lad-der Bow-tie, In: Guedes Soares, Zio (Eds.), Safety and Reliability for Managing Risk, Balkema, Tay-lor and Francis Group, London, 1, 21-27.
Liu, H.-C., Liu, L., Bian, Q.-H., Lin, Q.-L., Dong, N., and Xu, P.-C. (2001), Failure Mode and Effects Analysis Using Fuzzy Evidential Reasoning Ap-proach and Grey Theory, Experts Systems with ap-plications, 38, 4403-4415.
Maheswaran, K. and Logan, T. (2013), A Novel Appro-ach for Prioritization of Failure modes in FMEA using MCDM, International Journal of Engineer-ing Research and applications, 3, 733-739.
Nicola, P., Nicolas, D., Ernesto, S., Mike, W., and Va-lerio, C. (2013), Towards a new approach for the identification of atypical accidents cenarios, Jour-nal of Risk Research, 16, 337-354.
Ramzan, A. (2006), The Application of Thesis Bow-Ties in Nuclear Risk Management, Journal of Safety and Reliability, 26, 1-11.
Virtanen, S. and Hagmark, P. E. (2007), Simulation and Calculation of Reliability Performance and Main-tenance Costs, IEEE, Proceeding: Annual Reliability and Maintainability Symposium (RAMS), Orlando, FL, USA, 34-40.
Zuijderduijn (2000), Risk Management by Shell Refin-ery/Chemicals at Pernis, the Netherlands. Seveso 2000 European Conference, Athens (Ed. G Papadakis).