have older adults joined the “age of technology”? demographic and attitudinal predictors of...
Post on 20-Dec-2015
213 views
TRANSCRIPT

Have Older Adults Have Older Adults Joined the “Age of Joined the “Age of
Technology”?Technology”?Demographic and Attitudinal Predictors of Information and Communication Technology
(ICT) Use in Late-LifeLoren D. Lovegreen, Ph.D.Simon Fraser University
Symposium 2008, Université du Québec à Montréal

AcknowledgementsAcknowledgements
This research is part of the This research is part of the Buffers to Buffers to Impairment and Disability of the Old-Old, Impairment and Disability of the Old-Old, funded by the National Institute on Aging, funded by the National Institute on Aging, grant number: RO1 AG010738-12. grant number: RO1 AG010738-12. Eva Eva Kahana, Pd.D.,Kahana, Pd.D., Principal Investigator Principal Investigator
I would especially like to thank Dr. Eva I would especially like to thank Dr. Eva Kahana, Director of the Elderly Care Kahana, Director of the Elderly Care Research Center, Department of Sociology, Research Center, Department of Sociology, Case Western Reserve University, OH USA Case Western Reserve University, OH USA for her generosity in granting permission to for her generosity in granting permission to use this study sample and data. use this study sample and data.

IntroductionIntroduction
Older adults have witnessed Older adults have witnessed tremendous technological advances tremendous technological advances during there life timeduring there life time
However, they are less likely However, they are less likely (compared to those younger) to (compared to those younger) to adopt technological resources (e.g., adopt technological resources (e.g., computers, internet, email, and cell computers, internet, email, and cell phones) in their daily lives (Fox, phones) in their daily lives (Fox, 2004). 2004).

IntroductionIntroduction
Contradictory reasons for why elders Contradictory reasons for why elders have limited adoption of technology:have limited adoption of technology: Some argue:Some argue: that elders possess a lack that elders possess a lack
of interest or ability (Fox, 2001/2004)of interest or ability (Fox, 2001/2004) Others argue:Others argue: limited adoption results limited adoption results
from insufficient efforts in training and from insufficient efforts in training and from a lack of senior-focused from a lack of senior-focused technology that addresses the special technology that addresses the special needs of the aged (Charness & Schaie, needs of the aged (Charness & Schaie, 2003)2003)
IntroductionIntroduction
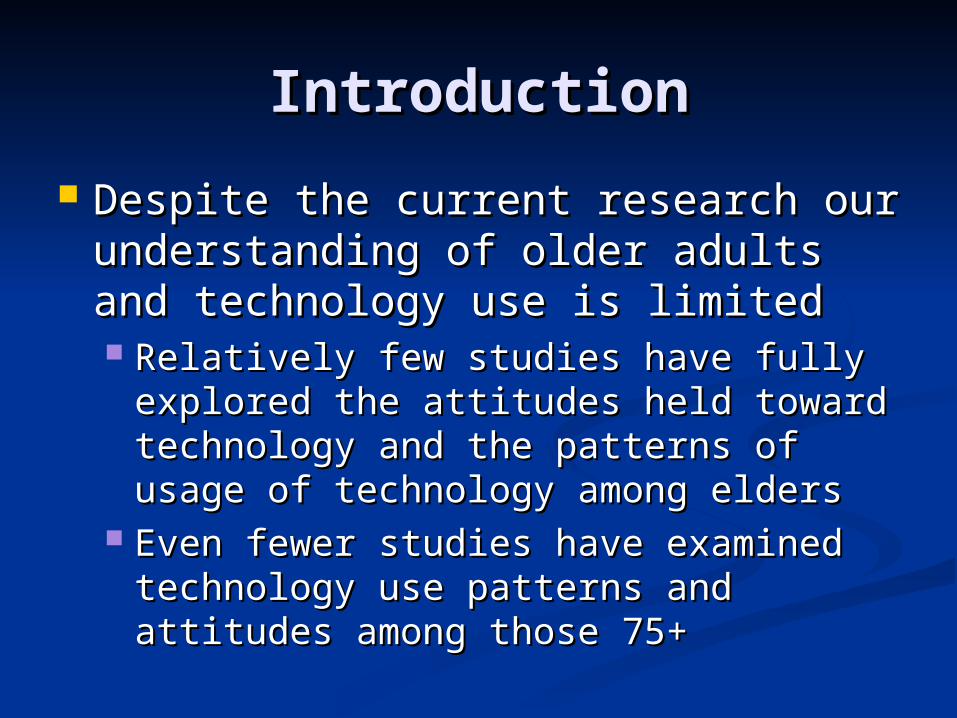
Despite the current research our Despite the current research our understanding of older adults and understanding of older adults and technology use is limitedtechnology use is limited Relatively few studies have fully Relatively few studies have fully
explored the attitudes held toward explored the attitudes held toward technology and the patterns of usage of technology and the patterns of usage of technology among elderstechnology among elders
Even fewer studies have examined Even fewer studies have examined technology use patterns and attitudes technology use patterns and attitudes among those 75+among those 75+

Research StatementResearch Statement This study explores access to and use of This study explores access to and use of
information and communication information and communication technologies among 471 community-technologies among 471 community-dwelling urban seniorsdwelling urban seniors
GoalsGoals To describeTo describe access and usage patterns of ICT access and usage patterns of ICT To describeTo describe attitudes held toward computers attitudes held toward computers To determineTo determine the impact of demographic the impact of demographic
characteristics on the likelihood of access to characteristics on the likelihood of access to and owning a computer and access to internetand owning a computer and access to internet

Older Adults and ICTOlder Adults and ICT Older adults are less likely to be wired Older adults are less likely to be wired
(online) than those younger (online) than those younger 65+ represent only 4% of the internet 65+ represent only 4% of the internet
populationpopulation However, the percent of US seniors who However, the percent of US seniors who
go online has increased by 47% between go online has increased by 47% between 2000 and 2004 (Pew Internet Project: 2000 and 2004 (Pew Internet Project: 2004)2004) This will increase as the This will increase as the “silver tsunami”“silver tsunami”
(today’s 50-60’s) are unlikely to give up their (today’s 50-60’s) are unlikely to give up their “wired” ways. “wired” ways.
These seniors will transform the These seniors will transform the non-wired non-wired senior stereotypesenior stereotype
Source: http.www.pewinternet.orgSource: http.www.pewinternet.org

Older Adults and ICTOlder Adults and ICT
Most of the growth in internet use is Most of the growth in internet use is among the early 60’s yrs groupamong the early 60’s yrs group
Little evidence that the 75+ group is Little evidence that the 75+ group is getting the internet bug (Fox, 2006)getting the internet bug (Fox, 2006)
Predictors of internet use include:Predictors of internet use include: Being male, higher education, higher Being male, higher education, higher
income, non-minority income, non-minority

Older Adults and ICTOlder Adults and ICT
Online BehaviorOnline Behavior Wired seniors are less likely than younger Wired seniors are less likely than younger
internet users to avail themselves to all internet users to avail themselves to all online activities online activities
Seniors more likely to engage in Seniors more likely to engage in “cautious “cautious clicking”clicking” –one false move on the internet –one false move on the internet can bring disaster (Chadwick-Dias et al., can bring disaster (Chadwick-Dias et al., 2004)2004)
While seniors take fewer chances online, While seniors take fewer chances online, they take less precautions (e.g., less likely to they take less precautions (e.g., less likely to have spyware)have spyware)

Methods: SampleMethods: Sample
Subset of a ongoing panel study of Subset of a ongoing panel study of community-dwelling elders living in a community-dwelling elders living in a large metropolitan area in Northeast large metropolitan area in Northeast Ohio, USAOhio, USA
Effective N=471Effective N=471

Sample Characteristics Sample Characteristics (N=471)(N=471)
Mean Age 77.1 yrs (SD=6.8) (Range = Mean Age 77.1 yrs (SD=6.8) (Range = 65 to 99)65 to 99)
% Female% Female 57.157.1 % Married% Married 73.773.7 % Non-Caucasian% Non-Caucasian 18.318.3 EducationEducation
% < High school% < High school 9.6 9.6 % High school degree% High school degree 28.228.2 % Some college% Some college 24.224.2 % College degree or >% College degree or > 38.038.0

Methods: Data Analysis Methods: Data Analysis
Descriptive Descriptive Logistic RegressionLogistic Regression
Three modelsThree modelsModel 1: Demographic Model 1: Demographic CharacteristicsCharacteristics
Model 2: Marital StatusModel 2: Marital StatusModel 3: Heath Status ControlModel 3: Heath Status Control

Methods: MeasuresMethods: Measures
Demographic CharacteristicsDemographic Characteristics Age (years)Age (years) Gender (female=1, male=0)Gender (female=1, male=0) Education (higher than HS=1, HS or less=0)Education (higher than HS=1, HS or less=0) Race/Ethnicity (Caucasian=1, Non-Caucasian=0)Race/Ethnicity (Caucasian=1, Non-Caucasian=0) Marital Status (married=1, not married=0)Marital Status (married=1, not married=0)
Health Status (Control)Health Status (Control) Self-rated physical health (3-item, response 1-5, Self-rated physical health (3-item, response 1-5,
>score, worse health)>score, worse health) Composite created (Items summed, range 3 – 15, Composite created (Items summed, range 3 – 15, αα
= .81)= .81)

Methods: Outcome Methods: Outcome MeasuresMeasures
DescriptiveDescriptive Access to computers and internet (yes/no)Access to computers and internet (yes/no) Usage of computer, internet, email and cell Usage of computer, internet, email and cell
phonephone Ownership (yes/no)Ownership (yes/no) Frequency of use (1=never, 5=daily)Frequency of use (1=never, 5=daily) Number of minutes at a sitting (computer)Number of minutes at a sitting (computer) Main activity on computer (open ended)Main activity on computer (open ended)
Attitudes toward computers (acceptance)Attitudes toward computers (acceptance) 4 items, response (1=SD to 4=SA)4 items, response (1=SD to 4=SA) Composite created, range 1 to 16, Composite created, range 1 to 16, αα = .77 = .77 >score, > acceptance>score, > acceptance Note: N answering = 282 (thus, this variable not Note: N answering = 282 (thus, this variable not
included in LR or OLS)included in LR or OLS)

Methods: Outcome Methods: Outcome MeasuresMeasures
Logistic RegressionLogistic Regression Do you own a computer? (yes=1, no=0)Do you own a computer? (yes=1, no=0) Do you have access to a computer? Do you have access to a computer?
(yes=1, no=0)(yes=1, no=0) Do you have access to the internet? Do you have access to the internet?
(yes=1, no=0)(yes=1, no=0)

Results - DescriptiveResults - Descriptive Access and UsageAccess and Usage % % N____ N____
Has access to computerHas access to computer 74.974.9 451451 Has access to internetHas access to internet 66.866.8 352352 Owns computerOwns computer 62.062.0 460460 Owns cell phoneOwns cell phone 53.453.4 470470
FrequencyFrequency % Daily % Daily % % Never__ Never__ ComputerComputer 48.548.5 24.724.7 Internet Internet 37.5 37.5
39.139.1 EmailEmail 39.639.6 40.040.0 Cell phoneCell phone 30.030.0 24.724.7

Results: (N=282)Results: (N=282)Attitudes Held Toward Attitudes Held Toward
ComputersComputers In general, all predictors (EXCEPT AGE) are In general, all predictors (EXCEPT AGE) are
associated with greater acceptance (i.e., males, associated with greater acceptance (i.e., males, married, Caucasian, higher education). married, Caucasian, higher education).
Age is associated with lower acceptance of Age is associated with lower acceptance of computerscomputers ““I would feel at ease in a computer class” (p=.014) (neg)I would feel at ease in a computer class” (p=.014) (neg) ““I would feel comfortable working with a computer” I would feel comfortable working with a computer”
(p=.011) (neg)(p=.011) (neg) ““Computers make me feel uneasy and confused” Computers make me feel uneasy and confused”
(p=.004)(p=.004) Thus, less ease in class, less comfort with Thus, less ease in class, less comfort with
computers, greater unease is associated with computers, greater unease is associated with greater age.greater age.

Results:Results: Final Model*: Outcome=Access to Final Model*: Outcome=Access to
ComputerComputer SignificantSignificant p valuep value Exp(B)Exp(B)
AgeAge .000.000 .935.935 Gender (f=1, m=0)Gender (f=1, m=0) .045.045
.597.597 EducationEducation .003.003 2.042.04 Self-rated HealthSelf-rated Health .028.028 .887.887 Marital Status Marital Status (marginal)(marginal) .082.082 1.601.60
Not SignificantNot Significant Race/EthnicityRace/Ethnicity .201.201 1.451.45
*Nagelkerke R*Nagelkerke R22 = 18.5 = 18.5 N=451N=451

Results: Results: Final Model*: Outcome=Own Final Model*: Outcome=Own
ComputerComputer SignificantSignificant p valuep value Exp(B)Exp(B)
Age Age .042.042 .986.986 Education Education .009.009 1.741.74 Race/Ethnicity Race/Ethnicity .032.032 1.731.73 Marital Status Marital Status .015.015 1.831.83
Not SignificantNot Significant p valuep value Exp(B)Exp(B) Gender Gender .151.151 .735.735 Self-rated HealthSelf-rated Health .148.148 .932.932
*Nagelkerke R*Nagelkerke R22 = 12.6 = 12.6 N=460N=460
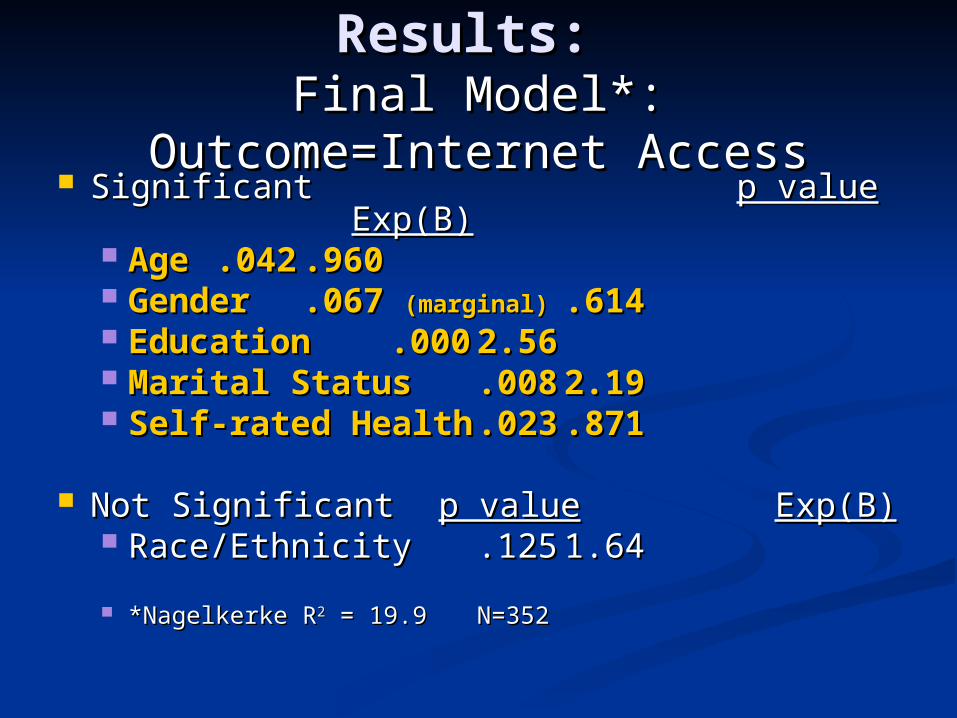
Results: Results: Final Model*: Outcome=Internet Final Model*: Outcome=Internet
AccessAccess SignificantSignificant p valuep value
Exp(B)Exp(B) Age Age .042.042 .960.960 GenderGender .067 .067 (marginal)(marginal) .614.614 Education Education .000.000 2.562.56 Marital Status Marital Status .008.008 2.192.19 Self-rated HealthSelf-rated Health .023.023 .871.871
Not SignificantNot Significant p valuep value Exp(B)Exp(B) Race/EthnicityRace/Ethnicity .125.125 1.641.64
*Nagelkerke R*Nagelkerke R22 = 19.9 = 19.9 N=352N=352

Results: LR ComparisonResults: LR Comparison
Access to Computer?
Y=1
Access to Internet?
Y=1
Own Computer?
Y=1
Age (years)
Odds decrease 6% each yr
Odds decrease 4% each yr
Odds decrease 3% each yr
Gender (F=1)
Odds decrease 40% for females
Odds decrease 39% for females
NS
Educ (> HS =1)
Odds increase by 2 for >HS
Odds increase by 2.6 for >HS
Odds increase by 1.7 for >HS
Race/ Ethnicity 1=Non-Minority
NS
NS
Odds increase by 1.7 for NM
Marital Status 1=Married
Odds increase 1.6 for married
Odds increase 1.8 for married
Odds increase 1.8 for married
Self Rated Health 1-5 (very sick)
Odds decrease 11% ea unit
Odds decrease 13% ea unit
NS

DiscussionDiscussion
Older age is predictive of Older age is predictive of not having accessnot having access to computers and the internet and to computers and the internet and not not owning owning a computer a computer
Being an older women is predictive of Being an older women is predictive of not not having accesshaving access to computers and the internet to computers and the internet
Having greater than a high school education Having greater than a high school education and being married is predictive of and being married is predictive of having having accessaccess to a computer and the internet and to a computer and the internet and owningowning a computer a computer
Being a minority is predictive of Being a minority is predictive of not owning not owning a computer a computer
Worse health is predictive of Worse health is predictive of not having not having access access to a computer or the internetto a computer or the internet

DiscussionDiscussion However, in this sample, we do see that older However, in this sample, we do see that older
adults have joined the “age of technology”adults have joined the “age of technology” The use of ICT provide an opportunity for The use of ICT provide an opportunity for
older adults to remain independent and to older adults to remain independent and to continue engagement in valued activities continue engagement in valued activities even after they encounter health limitationseven after they encounter health limitations
Use of ICT may be viewed as an indicator of Use of ICT may be viewed as an indicator of proactive behavior. Such behavior may proactive behavior. Such behavior may contribute to increased quality of lifecontribute to increased quality of life
Despite that a majority have access and own Despite that a majority have access and own a computer, attitudes toward computers is a computer, attitudes toward computers is less favorable as age increasesless favorable as age increases

Limitations and Future Limitations and Future DirectionsDirections
Use of secondary dataUse of secondary data Include other predictors (refine Include other predictors (refine
attitude measures; geographic attitude measures; geographic location; peer and family influence) location; peer and family influence)
Examine differences between long-Examine differences between long-time users versus new-users of ICTtime users versus new-users of ICT

Thank you!Thank you!
Detailed results from analyses are available upon request. Please contact [email protected]