predictors of information technology integration in
TRANSCRIPT
RESEARCH ARTICLE
Predictors of Information Technology
Integration in Secondary Schools: Evidence
from a Large Scale Study of More than 30,000
Students
Khe Foon Hew*, Cheng Yong Tan
Faculty of Education, The University of Hong Kong, Hong Kong, Hong Kong SAR
Abstract
The present study examined the predictors of information technology (IT) integration in sec-
ondary school mathematics lessons. The predictors pertained to IT resource availability in
schools, school contextual/institutional variables, accountability pressure faced by schools,
subject culture in mathematics, and mathematics teachers’ pedagogical beliefs and prac-
tices. Data from 32,256 secondary school students from 2,519 schools in 16 developed
economies who participated in the Program for International Student Assessment (PISA)
2012 were analyzed using hierarchical linear modeling (HLM). Results showed that after
controlling for student-level (gender, prior academic achievement and socioeconomic sta-
tus) and school-level (class size, number of mathematics teachers) variables, students in
schools with more computers per student, with more IT resources, with higher levels of IT
curricular expectations, with an explicit policy on the use of IT in mathematics, whose teach-
ers believed in student-centered teaching-learning, and whose teachers provided more
problem-solving activities in class reported higher levels of IT integration. On the other
hand, students who studied in schools with more positive teacher-related school learning cli-
mate, and with more academically demanding parents reported lower levels of IT integra-
tion. Student-related school learning climate, principal leadership behaviors, schools’ public
posting of achievement data, tracking of school’s achievement data by administrative
authorities, and pedagogical and curricular differentiation in mathematics lessons were not
related to levels of IT integration. Put together, the predictors explained a total of 15.90% of
the school-level variance in levels of IT integration. In particular, school IT resource availabil-
ity, and mathematics teachers’ pedagogical beliefs and practices stood out as the most
important determinants of IT integration in mathematics lessons.
Introduction
In the recent decades, many schools have jumped on the bandwagon to exploit advances in
information technology (IT) in the endeavor to enhance students’ learning and achievement.
This societal trajectory is corroborated by the proliferation of studies examining the impact of
PLOS ONE | DOI:10.1371/journal.pone.0168547 December 20, 2016 1 / 20
a1111111111
a1111111111
a1111111111
a1111111111
a1111111111
OPENACCESS
Citation: Hew KF, Tan CY (2016) Predictors of
Information Technology Integration in Secondary
Schools: Evidence from a Large Scale Study of
More than 30,000 Students. PLoS ONE 11(12):
e0168547. doi:10.1371/journal.pone.0168547
Editor: Andrew R. Dalby, University of
Westminster, UNITED KINGDOM
Received: April 26, 2016
Accepted: November 16, 2016
Published: December 20, 2016
Copyright: © 2016 Hew, Tan. This is an open
access article distributed under the terms of the
Creative Commons Attribution License, which
permits unrestricted use, distribution, and
reproduction in any medium, provided the original
author and source are credited.
Data Availability Statement: Data for this study
can be downloaded from https://www.oecd.org/
pisa/pisaproducts/pisa2012database-
downloadabledata.htm.
Funding: The authors received no funding or
sources of support during this specific study.
Competing Interests: The authors have declared
that no competing interests exist.

IT on achievement [1, 2, 3]. However, there is little evidence to-date to unequivocally support
or refute the rhetoric that IT can enhance student achievement. For example, Cheung and Sla-
vin’s [1] meta-analysis of 74 studies showed that educational technology applications were, on
average, modestly related with mathematics learning outcomes. However, recently published
analysis of PISA 2012 data [4] showed that access to IT resources was not associated with
enhanced mathematics achievement. Even experimental studies showed mixed evidence for
the contribution of IT to student achievement [5, 6].
Instead of asking whether school IT resources have a conclusive positive relationship with
student achievement, it may be more fruitful to examine why and how these resources are
used in teaching-learning in schools in the first place. Put another way, two schools may have
different compelling reasons for integrating IT into teaching-learning practices. These reasons
may then moderate the effects of IT on student achievement. Indeed, earlier studies have sug-
gested that IT per se does not necessarily translate to optimal usage; instead IT integration in
schools represents a more useful indicator of IT impact [7, 8]. This paradigm shift in thinking
has resulted in many scholars attempting to “unpack” what IT integration in teaching-learning
means in the school context. Some scholars relate IT integration to teachers using technology
for instructional preparation [9], instructional delivery [10], or simply to enhance the effective-
ness of implementing teachers’ usual activities [11]. More recently, however, scholars have
shifted the focus from teachers’ work to students’ learning. For example, Cuban, Kirkpatrick,
and Peck [12] emphasize the different levels of IT usage by students in their class learning,
while other researchers understand IT as students learning higher-order competencies and
skills such as critical and creative thinking, problem-solving, and social communication [13].
Given the potential of IT integration on students’ achievement, researchers quite under-
standably shift their attention to examine what IT-related variables predict effective IT integra-
tion in teaching-learning in schools [14, 15, 16]. However, students’ learning is a complex
multi-factorial process affected by student-teacher proximal interactions and other indirect
contextual factors in the school ecology [16, 17]. Therefore, other school and teacher variables
that are not directly related to IT may be equally important in determining the degree of IT
integration in schools. The paucity of studies examining non-IT related variables represent an
important gap to be addressed.
Therefore, the present study aims to (a) examine different IT and non-IT related predictors
of the levels of IT integration in schools, and (b) identify which sets of predictors are more
important than others in predicting IT integration. It takes advantage of a large dataset on IT
integration involving fifteen-year-old students’ involvement in mathematics lessons (and not
merely teacher-centered presentations), and many predictor variables (namely, IT resource
availability in schools, school contextual/institutional variables, accountability pressure faced
by schools, subject culture in mathematics, and mathematics teachers’ pedagogical beliefs and
practices) using the hierarchical linear modeling (HLM) approach. The availability of the mul-
titudinous variables allows for the examination of the independent effects of each predictor
after controlling for other predictor and student- and school-level control variables (e.g., stu-
dents’ prior academic achievement, number of mathematics teachers). This approach also rep-
resents a significant methodological improvement over isolated studies focusing on specific
variables [16, 18] (O’Dwyer, Russell, & Bebel, 2004; Zhao & Frank, 2003). More specifically, it
addresses Zhao and Frank’s [16] concern that
“In summary, previous research has resulted in a large, almost inexhaustible, list of factors
that may affect the uses of technology in schools. However, these factors are often examined
in isolation from each other or from the system in which they interact.” (pp. 809–810).
information Technology Integration
PLOS ONE | DOI:10.1371/journal.pone.0168547 December 20, 2016 2 / 20

Furthermore, this approach contrasts with meta-analytic studies that attempt to compare
the effectiveness of different predictors obtained from various individual studies that may not
necessarily be comparable in methodological design [19]. At the same time, the use of HLM
recognizes the structure of the data (students nested in schools), and allows for the degree of
IT integration to be appropriately examined at the school (vis-a-vis student) level [20].
Although the participants of PISA 2012 come from 68 different economies, the present study
focuses on only those from the Organization of Economic Cooperation and Development
(OECD) economies. This decision is informed by previous evidence showing that the quality
of schools may vary as function of national economic development [21], thereby enabling us
to limit the sample to more comparable schools, while overcoming the problem of range
restriction in variables common in small-scale studies [22].
Background
We begin with a clarification of the key term–IT integration. In the present study, we adapt
the description used by Hew and Brush [14] to define IT integration as the use of computing
devices such as desktop computers, laptops, tablets, software, or Internet for educational pur-
poses. More specifically, this study considers IT integration as the use of technology as a tool
for learning mathematics. It includes participants using devices and software to extend their
cognitive abilities to understand mathematics concepts, or solve problems such as drawing
graphs of functions, constructing geometric figures, entering data in spreadsheets, drawing
histograms, and determining how graphs change according to different parameters.
Previous research has found that using IT as a learning tool (such as the aforementioned
examples) can improve student mathematics learning [1, 2]. For example, Li and Ma [2] meta-
analyzed more than 40 experimental or quasi-experimental articles that employed IT for learn-
ing purposes, and used mathematics achievement as outcome. The results of their analysis sug-
gested that using IT as a learning tool (e.g., spreadsheet, Geometer’s Sketchpad) positively
impacted mathematics achievement of students.
Although studies have shown that use of IT as a learning tool can help student learning of
mathematics, IT use is typically affected by certain school- and teacher-level factors. A review
of the relevant studies suggests a list of factors, which can be parsimoniously categorized into
the following dichotomy: first- and second-order factors.
First-order factors are elements external to teachers [23]. Examples of the most commonly re-
ported first-order factors include IT infrastructure such as availability and access to hardware and
software [14, 24, 25, 26], institutional support such as management encouragement [18, 27], tech-
nical support [28], subject and assessment culture [11], and shared school IT vision and policy.
In contrast, second-order factors are elements intrinsic to teachers [23]. The most commonly
reported second-order factors are teacher professional development such as computer knowl-
edge or skill training [24, 29, 30], and teacher beliefs [31, 32, 33]. Ertmer [34] who examine
teacher beliefs about teaching and learning, consider these beliefs pedagogical and viewed them
as the “final frontier” (p. 25) in the quest for IT integration due to the stronger influence of
beliefs as opposed to computer knowledge or skill in predicting teacher behavior. Two prototyp-
ical ideologies are commonly discussed–teacher-centered or learner-centered belief [31, 32, 33,
35, 36]. Studies have found that teachers with learner-centered beliefs were more likely to have a
positive attitude (computer liking), and motivation to conduct IT integrated lessons [31, 33].
Limitations of past relational studies
Although past relational studies have suggested various predictors of IT integration, the results
must be interpreted with caution. First, previous research on IT integration is often limited to
information Technology Integration
PLOS ONE | DOI:10.1371/journal.pone.0168547 December 20, 2016 3 / 20

the study of teacher-level factors [29, 37]. There are relatively few empirical studies that exam-
ine school related or subject culture factors in secondary school mathematics lessons.
Second, there is no control for variables such as students’ prior academic achievement and
the number of teachers. Students’ prior academic achievement is an important variable in
learning [38]. It is possible that teachers conduct more IT integrated lessons as a remedial or
compensatory strategy for students with lower prior achievement compared to students with
higher achievement. Likewise, the number of teachers may affect the frequency of IT integra-
tion because schools with more teachers might have difficulty in scheduling the computer labs
for students to use. Hence students’ prior academic achievement and the availability of quali-
fied teachers may be confounding variables if they are not controlled.
The third limitation is that past studies exhibit a heavy reliance on linear regression analyses.
Richter [39] note that such analyses are incapable of handling complex data structures associated
with students being nested in schools [40]. The fourth limitation is the tendency of studies to rely
on teachers’ self-rating of the frequency or extent to which they use IT [15, 41, 42]. Teachers’ self-
report data may be compromised by social desirability bias [43]. Finally, many studies tend to
group different categories of technology use as “IT integration”. For example, Tondeur and col-
leagues [37] included the use of computers to develop students’ technical skills (e.g., how to use
the keyboard), in addition to use of computers as a learning tool as IT integration.
In this study we address the aforementioned limitations. The present study is unique in that
we specifically examined IT integration as the use of IT as a learning tool for secondary school
mathematics, rather than computer skills. IT integration in mathematics lessons is examined
in light of the importance of mathematical and scientific competencies in knowledge-based
economies [44]. Data from 32,256 students from 16 developed countries were analyzed,
thereby diminishing the limitations of country-specific results. We controlled for students’
academic achievement and the shortage of teachers, among other variables. We also examined
the possible effects of school-level variables such as students’ behavioral climate (e.g., students
skipping classes, truancy), principal-related activities (e.g., promoting evidence-based teaching
practices, evaluating classroom instruction), the accountability pressure schools faced on stu-
dents’ academic achievement, and mathematics subject culture. These variables, to our best
knowledge, have not been examined in past studies on IT integration in secondary school
mathematics. To manage the nested data, the present study employed HLM to address the pos-
sible correlation in achievement scores of students belonging to the same school and to parti-
tion achievement into between-school (the appropriate level for the purposes of the present
study) as opposed to within-school variance [20]. Finally, the measurement of IT integration
using students’ reported data, instead of teachers’, helped circumvent the problems of possible
teachers’ inaccurate responses or social desirability bias [43].
Material and Method
Participants
Participants were students and school principals who participated in PISA 2012 conducted by
OECD. PISA 2012 measured the proficiency of approximately 500,000 15-year-old students
from 68 economies (OECD and non-OECD members) in applying their knowledge and skills
learned in reading, mathematics, and science to authentic problems. However, only the data
from OECD economies were examined in the present study. Cases with missing data for any
of the variables investigated were excluded. This resulted in a final sample of 32,256 students
from 2,519 schools in 16 OECD economies available for analysis. These economies comprised
Australia, Austria, Belgium, Switzerland, Chile, Denmark, Hungary, Ireland, Israel, Italy,
Korea, Mexico, New Zealand, Portugal, Slovak Republic, and Sweden.
information Technology Integration
PLOS ONE | DOI:10.1371/journal.pone.0168547 December 20, 2016 4 / 20
Measures
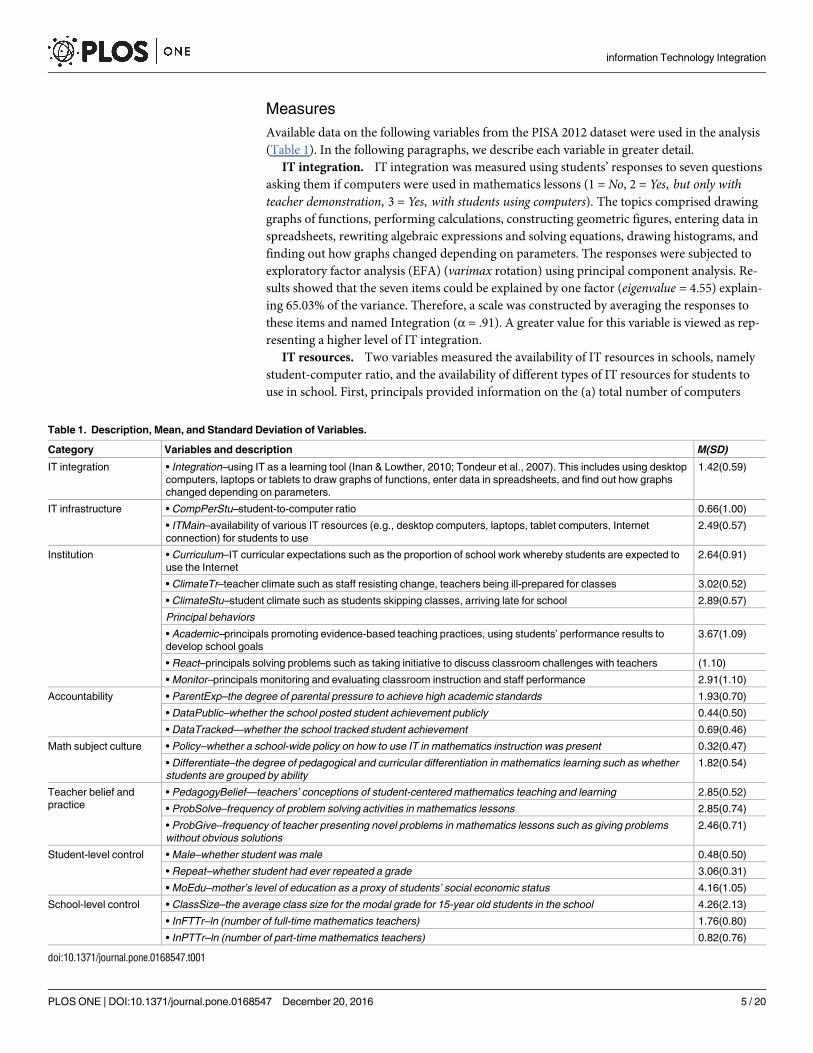
Available data on the following variables from the PISA 2012 dataset were used in the analysis
(Table 1). In the following paragraphs, we describe each variable in greater detail.
IT integration. IT integration was measured using students’ responses to seven questions
asking them if computers were used in mathematics lessons (1 = No, 2 = Yes, but only withteacher demonstration, 3 = Yes, with students using computers). The topics comprised drawing
graphs of functions, performing calculations, constructing geometric figures, entering data in
spreadsheets, rewriting algebraic expressions and solving equations, drawing histograms, and
finding out how graphs changed depending on parameters. The responses were subjected to
exploratory factor analysis (EFA) (varimax rotation) using principal component analysis. Re-
sults showed that the seven items could be explained by one factor (eigenvalue = 4.55) explain-
ing 65.03% of the variance. Therefore, a scale was constructed by averaging the responses to
these items and named Integration (α = .91). A greater value for this variable is viewed as rep-
resenting a higher level of IT integration.
IT resources. Two variables measured the availability of IT resources in schools, namely
student-computer ratio, and the availability of different types of IT resources for students to
use in school. First, principals provided information on the (a) total number of computers
Table 1. Description, Mean, and Standard Deviation of Variables.
Category Variables and description M(SD)
IT integration • Integration–using IT as a learning tool (Inan & Lowther, 2010; Tondeur et al., 2007). This includes using desktop
computers, laptops or tablets to draw graphs of functions, enter data in spreadsheets, and find out how graphs
changed depending on parameters.
1.42(0.59)
IT infrastructure • CompPerStu–student-to-computer ratio 0.66(1.00)
• ITMain–availability of various IT resources (e.g., desktop computers, laptops, tablet computers, Internet
connection) for students to use
2.49(0.57)
Institution • Curriculum–IT curricular expectations such as the proportion of school work whereby students are expected to
use the Internet
2.64(0.91)
• ClimateTr–teacher climate such as staff resisting change, teachers being ill-prepared for classes 3.02(0.52)
• ClimateStu–student climate such as students skipping classes, arriving late for school 2.89(0.57)
Principal behaviors
• Academic–principals promoting evidence-based teaching practices, using students’ performance results to
develop school goals
3.67(1.09)
• React–principals solving problems such as taking initiative to discuss classroom challenges with teachers (1.10)
• Monitor–principals monitoring and evaluating classroom instruction and staff performance 2.91(1.10)
Accountability • ParentExp–the degree of parental pressure to achieve high academic standards 1.93(0.70)
• DataPublic–whether the school posted student achievement publicly 0.44(0.50)
• DataTracked—whether the school tracked student achievement 0.69(0.46)
Math subject culture • Policy–whether a school-wide policy on how to use IT in mathematics instruction was present 0.32(0.47)
• Differentiate–the degree of pedagogical and curricular differentiation in mathematics learning such as whether
students are grouped by ability
1.82(0.54)
Teacher belief and
practice
• PedagogyBelief—teachers’ conceptions of student-centered mathematics teaching and learning 2.85(0.52)
• ProbSolve–frequency of problem solving activities in mathematics lessons 2.85(0.74)
• ProbGive–frequency of teacher presenting novel problems in mathematics lessons such as giving problems
without obvious solutions
2.46(0.71)
Student-level control • Male–whether student was male 0.48(0.50)
• Repeat–whether student had ever repeated a grade 3.06(0.31)
• MoEdu–mother’s level of education as a proxy of students’ social economic status 4.16(1.05)
School-level control • ClassSize–the average class size for the modal grade for 15-year old students in the school 4.26(2.13)
• InFTTr–ln (number of full-time mathematics teachers) 1.76(0.80)
• InPTTr–ln (number of part-time mathematics teachers) 0.82(0.76)
doi:10.1371/journal.pone.0168547.t001
information Technology Integration
PLOS ONE | DOI:10.1371/journal.pone.0168547 December 20, 2016 5 / 20

available for educational purposes for the modal grade corresponding to fifteen-year-old stu-
dents, and (b) total number of these students in their schools in the School Questionnaire. The
student-computer ratio in each school (CompPerStu) was computed by dividing (a) by (b).
Next, students responded to seven questions asking if various IT resources were availablefor them to use in school (1 = No, 2 = Yes, but the student did not use it, 3 = Yes, and the studentused it). These resources comprised desktop computers, portable laptop or notebooks, tablet
computers, Internet connection, printers, USB (memory) sticks, and e-book readers. The
responses were subjected to EFA (varimax rotation) using principal component analysis.
Results from the third round of EFA, after deleting two items that exhibited cross-loading on
more than one factor, showed that the items could be summarized by one factor (eigen-value = 1.90) explaining 37.95% of the variance. A scale (ITMain; α = .71) was constructed by
averaging the responses to the three items that loaded on this factor (pertaining to desktop
computers, Internet connection, and printers).
Institution. Six institutional variables pertaining to IT curricular expectations, school
climate, and principal leadership behaviors were measured. First, a variable (Curriculum)
was constructed by averaging principals’ responses to three questions asking about the propor-
tion of schoolwork (work during lessons, homework, and assignments/projects) whereby stu-
dents were expected to access the Internet (1 = <10%, 2 = 10–25%, 3 = 26–50%, 4 = 51–75%,
5 = >75%).
Next, principals’ responses to 19 questions asking if various climate-related phenomena
impeded students’ learning in their schools (e.g., student truancy, staff resisting change) were
coded as follows: 1 = A lot, 2 = To some extent, 3 = Very little, 4 = Not at all). The responses
were subjected to EFA (varimax rotation) using principal component analysis. Results from
the second round of EFA, after deleting items that exhibited cross-loading on more than one
factor, showed that the items could be summarized by two factors explaining a total of 48.82%
of the variance. Five items measuring staff resisting change, teachers not meeting individual
students’ needs, teachers being too strict with students, teachers being ill-prepared for classes,
and students not being encouraged to achieve their full potential loaded on the first factor
(eigenvalue = 2.79; 25.32% of variance explained). A scale (ClimateTr) was constructed by
averaging the responses to these teacher-related items that loaded on this factor (α = .80). Four
items measuring students skipping classes, truancy, arriving late for school, and not attending
compulsory school events loaded on the second factor (eigenvalue = 2.59; 23.50% of variance
explained). A scale (ClimateStu) was constructed by averaging the responses to these student-
related items that loaded on this factor (α = .81). A greater value for these climate variables rep-
resented a more positive school learning climate.
Principals also responded to 22 questions asking about the frequency of different activities
they were involved in (e.g., “I work to enhance the school’s reputation in the community”)
using a six-point scale (1 = Did not occur, 2 = 1–2 times yearly, 3 = 3–5 times yearly, 4 =
Monthly, 5 = Weekly, 6 = More than once a week). The responses were subjected to EFA (vari-max rotation) using principal component analysis. Results from the third round of EFA, after
deleting items that exhibited cross-loadings, showed the items could be summarized by three
factors explaining a total of 66.05% of the variance. The first factor on principals’ instructional
activity(eigenvalue = 3.00; 27.26% of variance explained) comprised five items measuring prin-
cipals ensuring the alignment of teachers’ professional development with school teaching
goals, promoting evidence-based teaching practices, using students’ performance results to
develop school goals, ensuring that teachers worked according to school goals, and enhancing
school’s reputation in the community. The second factor on principals resolving classroom
problems (eigenvalue = 2.23; 20.23% of variance explained) comprised three items measuring
principals solving classroom problems together with teachers, taking initiative to discuss
information Technology Integration
PLOS ONE | DOI:10.1371/journal.pone.0168547 December 20, 2016 6 / 20
classroom problems, and paying attention to disruptive classroom behaviors. The third factor
on principals’ monitoring (eigenvalue = 2.04; 18.56% of variance explained) comprised three
items measuring principals reviewing student work when evaluating classroom instruction,
conducting informal classroom observations regularly, and evaluating staff performance. Three
scales corresponding to the three factors were constructed by averaging the responses to items
loading on each of the factors (Academic, α = .84; React, α = .81; Monitor, α = .74 respectively).
Accountability. Three variables were constructed to measure the accountability pressure
schools faced on students’ academic achievement. First, a variable (ParentExp) was con-
structed to measure principals’ responses to a question asking about the degree of parental
pressure schools encountered to achieve high academic standards (1 = Largely absent, 2 = Pres-sure from minority of parents, 3 = Constant pressure from many parents). Next, two dichoto-
mous variables were constructed to measure the existence of two principal-reported school
practices (1 = Yes, 0 = No): posting achievement data publicly (DataPublic), and tracking of
achievement data by administrative authorities (DataTracked).
Mathematics subject culture. Subject culture refers to the ‘‘general set of institutionalized
practices and expectations which have grown up around a particular school subject” (Goodson
& Mangan, 1995, p. 614). In the present study, two variables measured the expectations and
norms pertaining to mathematics in schools. First, a dichotomous variable (Policy) was con-
structed to measure the presence of a school policy that describes the expected ways in which
technology is used for learning mathematics (1 = Yes, 0 = No).
Next, three questions were asked about the degree of pedagogical and curricular differentia-
tion in mathematics (i.e., if students in mathematics classes studied similar content but at
different levels of difficulty, if students studied different content of mathematics topics at dif-
ferent difficulty levels, and if students were grouped by ability within mathematics classes
using a three-point scale (1 = Not for any classes, 2 = For some classes, 3 = For all classes). The
responses were subjected to EFA (varimax rotation) using principal component analysis.
Results showed that the items could be summarized by one factor (eigenvalue = 1.60) explain-
ing 53.46% of the variance. A scale (Differentiate) was constructed by averaging the responses
to the three items (α = .56).
Mathematics teacher beliefs and practices. Three variables measured mathematics
teachers’ pedagogical beliefs and practices. First, three questions were asked about mathemat-
ics teachers’ conceptions of student-centered teaching and learning such as adapting standards
to students’ needs using a four-point scale (1 = Strongly disagree, 2 = Disagree, 3 = Agree, 4 =
Strongly agree). The responses were subjected to EFA (varimax rotation) using principal com-
ponent analysis. Results showed that the items could be summarized by one factor (eigen-value = 1.68) explaining 55.88% of the variance. A scale (PedagogyBelief) was constructed by
averaging the responses to the items (α = .60).
Next, students responded to nine questions asking about the frequency of problem-solving
activities in their mathematics classes (e.g., teachers asking questions that made students reflect
on problems, teachers asking students to explain how they solved problems) using a four-point
scale (1 = Never or rarely, 2 = Sometimes, 3 = Often, 4 = Always or almost always). The responses
were subjected to EFA (varimax rotation) using principal component analysis. Results of the
second round of EFA showed that, after deleting items that cross-loaded on more than one fac-
tor, the items could be summarized by two factors explaining a total of 60.99% of the variance.
The first factor (eigenvalue = 1.85; 30.77% variance explained) comprised three items measuring
teachers facilitating students’ problem-solving capacities (namely, helping students to learn
from their mistakes, asking students to explain their solutions, and getting students to apply
their learning to new contexts). The second factor (eigenvalue = 1.81; 30.22% variance ex-
plained) comprised three items measuring teachers presenting novel problems to students
information Technology Integration
PLOS ONE | DOI:10.1371/journal.pone.0168547 December 20, 2016 7 / 20
(namely, presenting problems without obvious solutions, giving problems that required stu-
dents to think for a while, and asking students to decide on their own procedures for solving
problems). Two scales were constructed by averaging the responses to the items for each factor
(ProbSolve, α = .68; ProbGive, α = .66 respectively).
Controls. Three student-level and three school-level variables were used as controls in the
analysis. The student-level controls comprised students’ gender, prior academic achievement,
and SES. First, a dummy variable, Male, was coded as 0 for female and 1 for male students. Stu-
dents also responded to three items indicating whether they had ever repeated a grade at the
primary, lower secondary, and upper secondary level using a three-point scale (1 = No, never;2 = Yes, once; 3 = Yes, twice or more). These responses were added up to form a measure of stu-
dents’ prior academic achievement (Repeat), with higher values indicating lower levels of stu-
dents’ prior academic achievement.
Three indicators (parents’ education, occupation, and income) have been used to measure
SES in the literature. There is evidence that these indicators are highly correlated with each
other, with more educated parents enjoying work of higher occupational status and earning a
higher income. In the present study, parents’ education was used to measure students’ familial
SES. More specifically, mothers’ as opposed to fathers’ education was used because prior
research showed that it was a more predictive variable of student achievement (Chiu & Khoo,
2005). Therefore, a variable (MoEdu) measuring mothers’ responses to items measuring their
highest level of schooling completed (1 = Did not complete primary education, 2 = Completedprimary education, 3 = Completed lower secondary education, 4 = Completed upper secondaryeducation that provided direct access to labor markets or to non-university tertiary education, 5 =
Completed upper secondary education that provided access to university level or non-universitytertiary education) was included in the analysis.
The three school-level controls comprised the average class size and number of mathemat-
ics teachers in schools. First, ClassSize measured the average class size (principal-reported) for
the modal grade for fifteen-year-old students in schools (1 =�15 students, 2 = 16–20 students,3 = 21–25 students, 4 = 26–30 students, 5 = 31–35 students, 6 = 36–40 students, 7 = 41–45 stu-dents, 8 = 46–50 students, 9 =>50 students). lnFTTr and lnPTTr were obtained by applying the
logarithmic transformation to the data on number of full-time and part-time mathematics
teachers in each school (principal-reported) to address problems of violations of normality
assumption in the two latter variables.
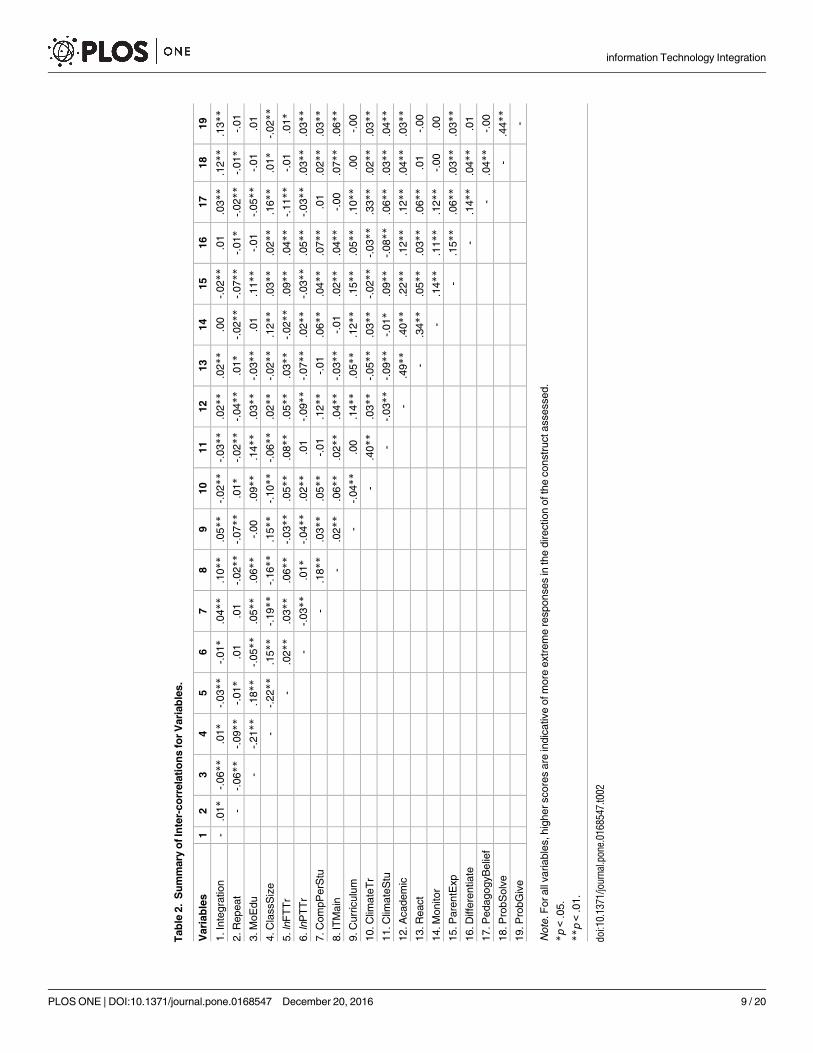
The correlation between the variables are summarized in Table 2.
Procedure
PISA 2012 involved all 34 OECD and 31 partner economies (OECD, 2013). All participating
economies followed standardized procedures outlined in the technical standards and manuals
provided. In addition, students, school principals, and parents (in some economies) completed
related questionnaires pertaining to student learning.
Results
Models predicting IT integration in mathematics lesson were examined for different sets of vari-
ables in the following sequence: controls, IT resource availability, institutional variables, assess-
ment pressure, mathematics subject culture, and mathematics teacher beliefs and practices.
Centered independent variables were used in all the HLM models to enhance the interpretabil-
ity of the results and to minimize the problem of multi-collinearity.
HLM results (Table 3) for the null model (Model 1) showed that 85.29% and 14.71% of the
variance in IT integration in mathematics lessons occurred at levels 1 (within-school) and 2
information Technology Integration
PLOS ONE | DOI:10.1371/journal.pone.0168547 December 20, 2016 8 / 20
Tab
le2.
Su
mm
ary
ofIn
ter-
co
rrela
tio
ns
for
Vari
ab
les.
Vari
ab
les
12
34
56
78
910
11
12
13
14
15
16
17
18
19
1.In
tegra
tion
-.0
1*
-.06**
.01*
-.03**
-.01*
.04**
.10**
.05**
-.02**
-.03**
.02**
.02**
.00
-.02**
.01
.03**
.12**
.13**
2.R
epeat
--.
06**
-.09**
-.01*
.01
.01
-.02**
-.07**
.01*
-.02**
-.04**
.01*
-.02**
-.07**
-.01*
-.02**
-.01*
-.01
3.M
oE
du
--.
21**
.18**
-.05**
.05**
.06**
-.00
.09**
.14**
.03**
-.03**
.01
.11**
-.01
-.05**
-.01
.01
4.C
lassS
ize
--.
22**
.15**
-.19**
-.16**
.15**
-.10**
-.06**
.02**
-.02**
.12**
.03**
.02**
.16**
.01*
-.02**
5.ln
FT
Tr
-.0
2**
.03**
.06**
-.03**
.05**
.08**
.05**
.03**
-.02**
.09**
.04**
-.11**
-.01
.01*
6.ln
PT
Tr
--.
03**
.01*
-.04**
.02**
.01
-.09**
-.07**
.02**
-.03**
.05**
-.03**
.03**
.03**
7.C
om
pP
erS
tu-
.18**
.03**
.05**
-.01
.12**
-.01
.06**
.04**
.07**
.01
.02**
.03**
8.IT
Main
-.0
2**
.06**
.02**
.04**
-.03**
-.01
.02**
.04**
-.00
.07**
.06**
9.C
urr
iculu
m-
-.04**
.00
.14**
.05**
.12**
.15**
.05**
.10**
.00
-.00
10.C
limate
Tr
-.4
0**
.03**
-.05**
.03**
-.02**
-.03**
.33**
.02**
.03**
11.C
limate
Stu
--.
03**
-.09**
-.01*
.09**
-.08**
.06**
.03**
.04**
12.A
cadem
ic-
.49**
.40**
.22**
.12**
.12**
.04**
.03**
13.R
eact
-.3
4**
.05**
.03**
.06**
.01
-.00
14.M
onitor
-.1
4**
.11**
.12**
-.00
.00
15.P
are
ntE
xp
-.1
5**
.06**
.03**
.03**
16.D
iffe
rentiate
-.1
4**
.04**
.01
17.P
edagogyB
elie
f-
.04**
-.00
18.P
robS
olv
e-
.44**
19.P
robG
ive
-
Note
.F
or
all
variable
s,hig
herscore
sare
indic
ative
ofm
ore
extr
em
ere
sponses
inth
edirection
ofth
econstr
uctassessed.
*p<
.05.
**p<
.01.
doi:10.1
371/jo
urn
al.p
one.
0168547.t002
information Technology Integration
PLOS ONE | DOI:10.1371/journal.pone.0168547 December 20, 2016 9 / 20
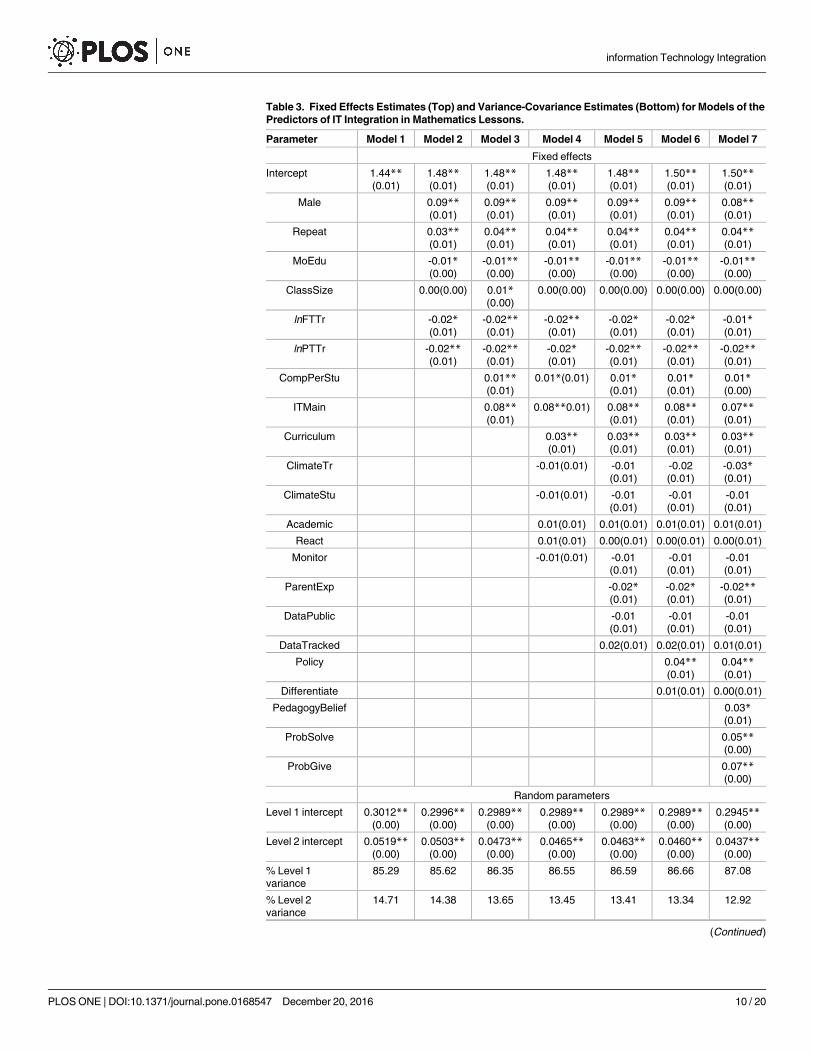
Table 3. Fixed Effects Estimates (Top) and Variance-Covariance Estimates (Bottom) for Models of the
Predictors of IT Integration in Mathematics Lessons.
Parameter Model 1 Model 2 Model 3 Model 4 Model 5 Model 6 Model 7
Fixed effects
Intercept 1.44**(0.01)
1.48**(0.01)
1.48**(0.01)
1.48**(0.01)
1.48**(0.01)
1.50**(0.01)
1.50**(0.01)
Male 0.09**(0.01)
0.09**(0.01)
0.09**(0.01)
0.09**(0.01)
0.09**(0.01)
0.08**(0.01)
Repeat 0.03**(0.01)
0.04**(0.01)
0.04**(0.01)
0.04**(0.01)
0.04**(0.01)
0.04**(0.01)
MoEdu -0.01*(0.00)
-0.01**(0.00)
-0.01**(0.00)
-0.01**(0.00)
-0.01**(0.00)
-0.01**(0.00)
ClassSize 0.00(0.00) 0.01*(0.00)
0.00(0.00) 0.00(0.00) 0.00(0.00) 0.00(0.00)
lnFTTr -0.02*(0.01)
-0.02**(0.01)
-0.02**(0.01)
-0.02*(0.01)
-0.02*(0.01)
-0.01*(0.01)
lnPTTr -0.02**(0.01)
-0.02**(0.01)
-0.02*(0.01)
-0.02**(0.01)
-0.02**(0.01)
-0.02**(0.01)
CompPerStu 0.01**(0.01)
0.01*(0.01) 0.01*(0.01)
0.01*(0.01)
0.01*(0.00)
ITMain 0.08**(0.01)
0.08**0.01) 0.08**(0.01)
0.08**(0.01)
0.07**(0.01)
Curriculum 0.03**(0.01)
0.03**(0.01)
0.03**(0.01)
0.03**(0.01)
ClimateTr -0.01(0.01) -0.01
(0.01)
-0.02
(0.01)
-0.03*(0.01)
ClimateStu -0.01(0.01) -0.01
(0.01)
-0.01
(0.01)
-0.01
(0.01)
Academic 0.01(0.01) 0.01(0.01) 0.01(0.01) 0.01(0.01)
React 0.01(0.01) 0.00(0.01) 0.00(0.01) 0.00(0.01)
Monitor -0.01(0.01) -0.01
(0.01)
-0.01
(0.01)
-0.01
(0.01)
ParentExp -0.02*(0.01)
-0.02*(0.01)
-0.02**(0.01)
DataPublic -0.01
(0.01)
-0.01
(0.01)
-0.01
(0.01)
DataTracked 0.02(0.01) 0.02(0.01) 0.01(0.01)
Policy 0.04**(0.01)
0.04**(0.01)
Differentiate 0.01(0.01) 0.00(0.01)
PedagogyBelief 0.03*(0.01)
ProbSolve 0.05**(0.00)
ProbGive 0.07**(0.00)
Random parameters
Level 1 intercept 0.3012**(0.00)
0.2996**(0.00)
0.2989**(0.00)
0.2989**(0.00)
0.2989**(0.00)
0.2989**(0.00)
0.2945**(0.00)
Level 2 intercept 0.0519**(0.00)
0.0503**(0.00)
0.0473**(0.00)
0.0465**(0.00)
0.0463**(0.00)
0.0460**(0.00)
0.0437**(0.00)
% Level 1
variance
85.29 85.62 86.35 86.55 86.59 86.66 87.08
% Level 2
variance
14.71 14.38 13.65 13.45 13.41 13.34 12.92
(Continued )
information Technology Integration
PLOS ONE | DOI:10.1371/journal.pone.0168547 December 20, 2016 10 / 20
(between-school) respectively. These results supported the use of HLM models which took
into account the non-independence of IT integration experienced by students who belonged
to the same school.
When the various control variables were included in the model (Model 2), results showed
that boys (Male, β = 0.09, p< .01), students with lower prior academic achievement (Repeat,
β = 0.03, p< .01), and students with less educated mothers (MoEdu, β = -0.01, p< .05)
reported higher levels of IT integration in their mathematics lessons. On the other hand, stu-
dents in schools with more full-time (lnFTTr, γ = -0.02, p< .05) or part-time (lnPTTr, γ =
-0.02, p< .01) mathematics teachers reported lower levels of IT integration. In contrast, aver-
age class size was not significantly related to the level of IT integration (ClassSize, γ = 0.00, p =
.40). The set of control variables explained 0.55% and 3.12% of the level 1 and 2 variances in IT
integration respectively.
In Model 3, all the control variables were significantly related to IT integration. More spe-
cifically, boys (Male, β = 0.09, p< .01), students with lower prior academic achievement
(Repeat, β = 0.04, p< .01), students with less educated mothers (MoEdu, β = -0.01, p< .05),
and students in schools with larger average class sizes (ClassSize, γ = 0.01, p< .05) reported
higher levels of IT integration in their mathematics lessons. On the other hand, students in
schools with more full-time (lnFTTr, γ = -0.02) or part-time (lnPTTr, γ = -0.02) mathematics
teachers reported lower levels of IT integration, p< .01. Turning to the school IT resource var-
iables, students in schools with more computers per student (CompPerStu, γ = 0.01), and with
more IT resources available for students’ use (ITMain, β = 0.08) reported higher levels of IT
integration, p< .01. The control and school IT resource variables explained 0.78% and 9.03%
of the level 1 and 2 variances in IT integration respectively. The increase from 3.12% to 9.03%
explained variance at level 2 underscored the importance of school IT resource availability in
determining the level of IT integration.
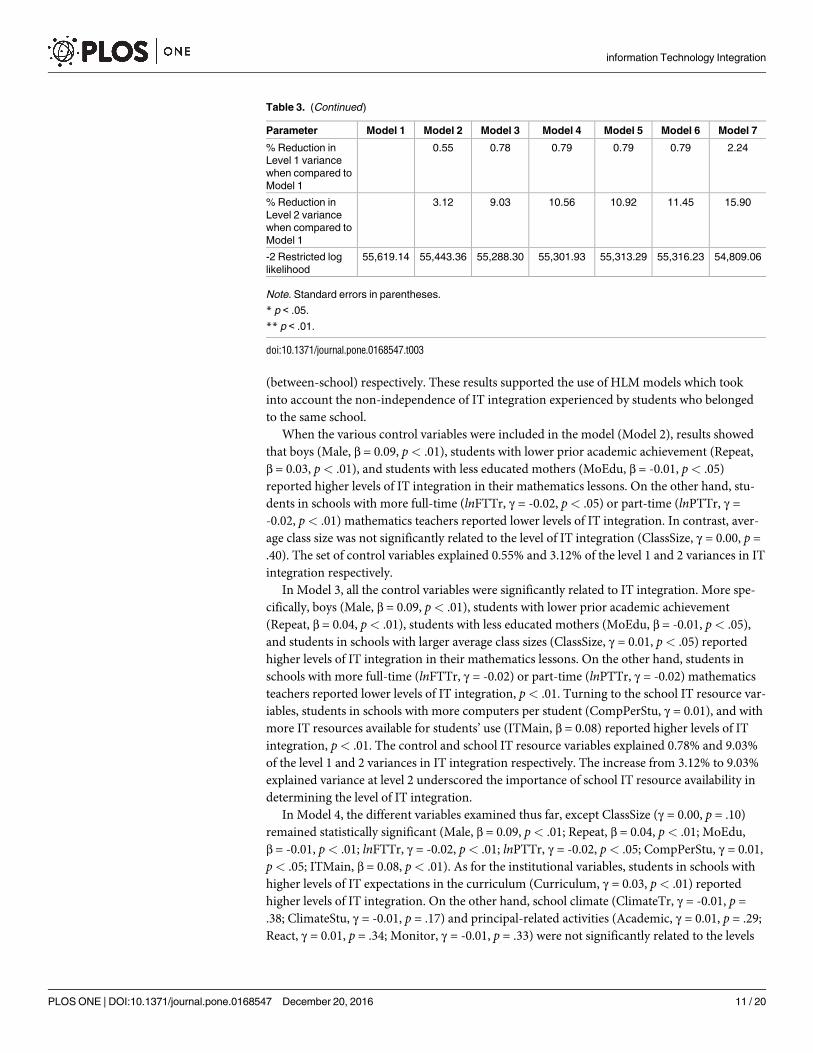
In Model 4, the different variables examined thus far, except ClassSize (γ = 0.00, p = .10)
remained statistically significant (Male, β = 0.09, p< .01; Repeat, β = 0.04, p< .01; MoEdu,
β = -0.01, p< .01; lnFTTr, γ = -0.02, p< .01; lnPTTr, γ = -0.02, p< .05; CompPerStu, γ = 0.01,
p< .05; ITMain, β = 0.08, p< .01). As for the institutional variables, students in schools with
higher levels of IT expectations in the curriculum (Curriculum, γ = 0.03, p< .01) reported
higher levels of IT integration. On the other hand, school climate (ClimateTr, γ = -0.01, p =
.38; ClimateStu, γ = -0.01, p = .17) and principal-related activities (Academic, γ = 0.01, p = .29;
React, γ = 0.01, p = .34; Monitor, γ = -0.01, p = .33) were not significantly related to the levels
Table 3. (Continued)
Parameter Model 1 Model 2 Model 3 Model 4 Model 5 Model 6 Model 7
% Reduction in
Level 1 variance
when compared to
Model 1
0.55 0.78 0.79 0.79 0.79 2.24
% Reduction in
Level 2 variance
when compared to
Model 1
3.12 9.03 10.56 10.92 11.45 15.90
-2 Restricted log
likelihood
55,619.14 55,443.36 55,288.30 55,301.93 55,313.29 55,316.23 54,809.06
Note. Standard errors in parentheses.
* p < .05.
** p < .01.
doi:10.1371/journal.pone.0168547.t003
information Technology Integration
PLOS ONE | DOI:10.1371/journal.pone.0168547 December 20, 2016 11 / 20

of IT integration. The proportion of level 1 variance explained by the control, school IT
resource, and institutional variables remained almost unchanged (0.79%), while the propor-
tion of level 2 variance explained increased from 9.03% to 10.56%.
In Model 5, the pattern of relationships between each of these variables and the levels of IT
integration remained unchanged (Male, β = 0.09, p< .01; Repeat, β = 0.04, p< .01; MoEdu,
β = -0.01, p< .01; ClassSize, γ = 0.00, p = .14; lnFTTr, γ = -0.02, p< .05; lnPTTr, γ = -0.02, p<.01; CompPerStu, γ = 0.01, p< .05; ITMain, β = 0.08, p< .01; Curriculum, γ = 0.03, p< .01;
ClimateTr, γ = -0.01, p = .23; ClimateStu, γ = -0.01, p = .34; Academic, γ = 0.01, p = .11; React,
γ = 0.00, p = .47; Monitor, γ = -0.01, p = .38). With regards to the accountability variables, stu-
dents in schools with higher levels of parental pressure for academic achievement (ParentExp,
γ = -0.02, p< .05) reported lower levels of IT integration. However, schools’ public posting of
achievement results (DataPublic, γ = -0.01, p = .22) or tracking of schools’ achievement results
by administrative authorities (DataTracked, γ = 0.02, p = .13) was not significantly related to
levels of IT integration. The proportion of level 1 variance explained by the control, school IT
resource, institutional, and accountability variables remained the same (0.79%), while the pro-
portion of level 2 variance explained increased marginally from 10.56% to 10.92%.
In Model 6, the pattern of relationships between each of these variables and the levels of IT
integration remained unchanged (Male, β = 0.09, p< .01; Repeat, β = 0.04, p< .01; MoEdu,
β = -0.01, p< .01; ClassSize, γ = 0.00, p = .15; lnFTTr, γ = -0.02, p< .05; lnPTTr, γ = -0.02, p<.01; CompPerStu, γ = 0.01, p< .05; ITMain, β = 0.08, p< .01; Curriculum, γ = 0.03, p< .01;
ClimateTr, γ = -0.02, p = .18; ClimateStu, γ = -0.01, p = .31; Academic, γ = 0.01, p = .16; React,
γ = 0.00, p = .52; Monitor, γ = -0.01, p = .29; ParentExp, γ = -0.02, p< .05; DataPublic, γ =
-0.01, p = .22; DataTracked, γ = 0.02, p = .16). One of the two mathematics subject culture vari-
ables measuring the presence of school policy on how to use computers in mathematics
instruction, Policy, was positively related to levels of IT integration (γ = 0.04, p< .01). How-
ever, the other variable measuring the degree of pedagogical and curricular differentiation in
mathematics lessons (Differentiate) was not significantly related to levels of IT integration (γ =
0.01, p = .27). The proportion of level 1 variance explained by the variables remained the same
(0.79%), while the proportion of level 2 variance explained increased from 10.79% to 11.45%.
In the last model (Model 7), the pattern of relationships between each of these variables and
the levels of IT integration remained unchanged for all the variables except for ClimateTr.
More specifically, boys (Male, β = 0.08, p< .01), students with less educated mothers (MoEdu,
β = -0.01, p< .05), and students with lower levels of prior academic achievement (Repeat, β =
0.04, p< .01) reported higher levels of IT integration. Additionally, students in schools with
more computers per student (CompPerStu, γ = 0.01, p< .05), with more access to IT resources
(ITMain, β = 0.07, p< .01), with higher levels of IT curricular expectations (Curriculum, γ =
0.03, p< .01), and with an explicit policy on the use of IT in mathematics (Policy, γ = 0.04,
p< .01) reported higher levels of IT integration. On the other hand, students who studied
in schools with more full- and part-time mathematics teachers (lnFTTr, γ = -0.01, p< .05;
lnPTTr, γ = -0.02, p< .01 respectively), with more positive school learning climate attributable
to teacher-related factors (ClimateTr, γ = -0.03, p< .05), and with more academically demand-
ing parents (ParentExp, γ = -0.02, p< .01) reported lower levels of IT integration. Class sizes
(ClassSize, γ = 0.00, p = .30), school learning climate attributable to student factors (Clima-
teStu, γ = -0.01, p = .17), principal leadership (Academic, γ = 0.01, p = .39; React, γ = 0.00, p =
.47; Monitor, γ = -0.01, p = .35), schools’ public posting of achievement data (DataPublic, γ =
-0.01, p = .28), tracking of school’s achievement data by administrative authorities (Data-
Tracked, γ = 0.01, p = .25), and pedagogical and curricular differentiation in mathematics les-
sons (Differentiate γ = 0.00, p = .68) were all not related to levels of IT integration. The last set
of variables entered into the model pertaining to mathematics teachers’ beliefs and practices
information Technology Integration
PLOS ONE | DOI:10.1371/journal.pone.0168547 December 20, 2016 12 / 20
were all significantly related to levels of IT integration. More specifically, students whose teach-
ers believed in student-centered teaching-learning (StuFocus, γ = 0.03, p< .05) and whose
teachers provided more problem-solving activities in class (ProbSolve, β = 0.05, p< .01; Prob-
Give, β = 0.07, p< .01) reported higher levels of IT integration. The proportion of level 1 vari-
ance explained by the variables increased from 0.79% to 2.24%, while the proportion of level 2
variance explained increased from 11.45% to 15.90, indicating that teacher beliefs and practices
were important predictors of IT integration.
Discussion
The present study employs HLM to (a) examine different IT and non-IT related predictors of
the levels of IT integration in schools, and (b) identify which sets of predictors are more
important than others in predicting IT integration in school mathematics lessons. IT integra-
tion in mathematics lessons was measured using students’ responses to a series of questions
asking them if IT had been used in teachers’ demonstration or for students’ learning in mathe-
matics lessons, with responses on students’ involvement taken to be indicative of higher levels
of IT integration.
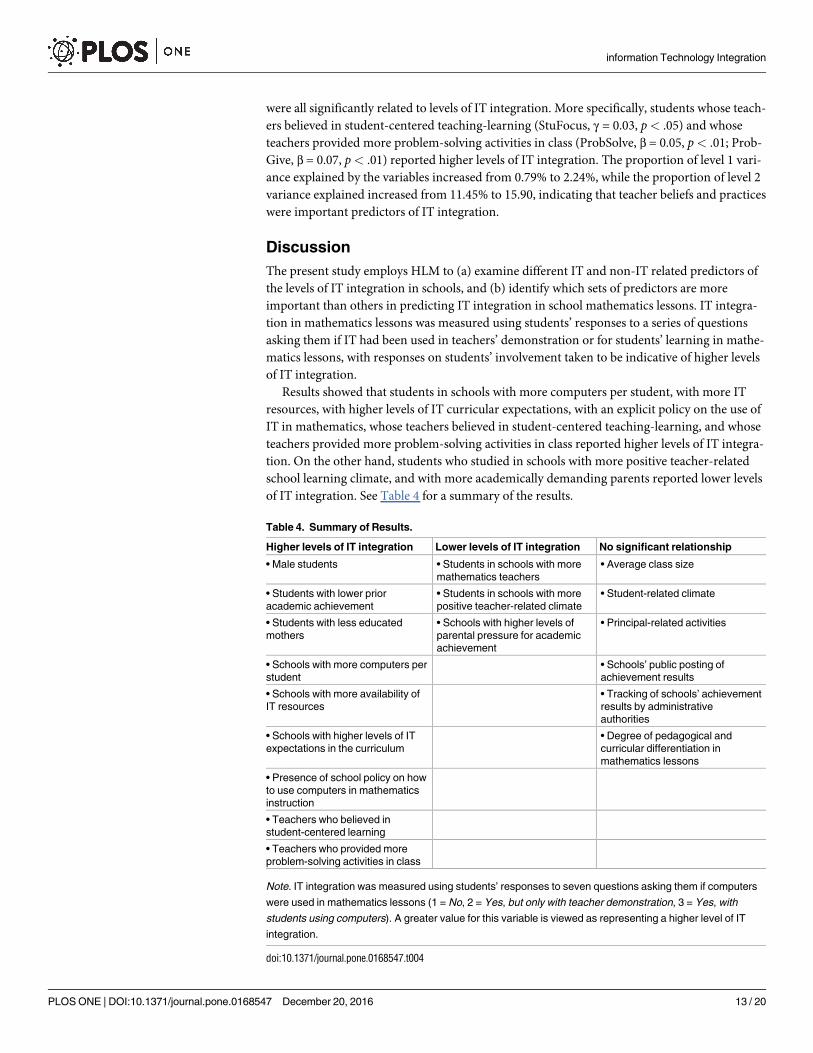
Results showed that students in schools with more computers per student, with more IT
resources, with higher levels of IT curricular expectations, with an explicit policy on the use of
IT in mathematics, whose teachers believed in student-centered teaching-learning, and whose
teachers provided more problem-solving activities in class reported higher levels of IT integra-
tion. On the other hand, students who studied in schools with more positive teacher-related
school learning climate, and with more academically demanding parents reported lower levels
of IT integration. See Table 4 for a summary of the results.
Table 4. Summary of Results.
Higher levels of IT integration Lower levels of IT integration No significant relationship
• Male students • Students in schools with more
mathematics teachers
• Average class size
• Students with lower prior
academic achievement
• Students in schools with more
positive teacher-related climate
• Student-related climate
• Students with less educated
mothers
• Schools with higher levels of
parental pressure for academic
achievement
• Principal-related activities
• Schools with more computers per
student
• Schools’ public posting of
achievement results
• Schools with more availability of
IT resources
• Tracking of schools’ achievement
results by administrative
authorities
• Schools with higher levels of IT
expectations in the curriculum
• Degree of pedagogical and
curricular differentiation in
mathematics lessons
• Presence of school policy on how
to use computers in mathematics
instruction
• Teachers who believed in
student-centered learning
• Teachers who provided more
problem-solving activities in class
Note. IT integration was measured using students’ responses to seven questions asking them if computers
were used in mathematics lessons (1 = No, 2 = Yes, but only with teacher demonstration, 3 = Yes, with
students using computers). A greater value for this variable is viewed as representing a higher level of IT
integration.
doi:10.1371/journal.pone.0168547.t004
information Technology Integration
PLOS ONE | DOI:10.1371/journal.pone.0168547 December 20, 2016 13 / 20
Put together, the predictors (including the controls) explained a total of 15.90% of the
school-level variance in levels of IT integration. Among the variables, access to school IT
resources (5.91%) and teachers’ pedagogical beliefs and practices (4.45%) account for a larger
proportion of the between-school IT integration variance, as compared to IT curricular expec-
tations (1.53%), parents’ expectations (0.36%), or the presence of IT policies in schools
(0.53%).
The usefulness of the myriad variables at the student, subject, and school levels in predicting
IT integration underscores the need for policymakers and school leaders to have a comprehen-
sive approach to promote IT-enabled teaching-learning. This plan may include a shared vision
and IT integration plan; and strategies to address resource shortages, change teachers’ peda-
gogical beliefs and practices, provide teachers with professional development opportunities,
and include higher-order thinking skills that are susceptible to IT-enabled teaching in assess-
ments [14].
Access to IT resources
Results showed that variables measuring the access to IT resources in schools constituted the
most important set of predictors of IT integration. This finding is consonant with Fabry and
Higgs’ [8] contention that IT integration in schools is contingent upon teachers and students’
unfettered access to adequate and appropriate hardware and software. There are many creative
ways to increase the access to IT in schools, including schools adopting cheaper computer sys-
tems, integrating IT into one or two subject areas at any one time, using laptops equipped with
wireless connections instead of computer laboratories, locating computers in classrooms
instead of centralized venues, and rotating students in groups through small number of com-
puters in classrooms [45, 46, 47].
Teachers’ pedagogical beliefs and practices
However, when juxtaposed against the contributions of teachers’ student-centered pedagogical
beliefs and practices, IT access appears to be necessary albeit insufficient for IT integration
[48]. Indeed, the results showed that teacher variables such as their beliefs in student-centered
teaching-learning and the implementation of problem-solving pedagogies constitute the sec-
ond most important set of predictors of IT integration in terms of the proportion of variance
explained. This finding is consistent with those reported in previous studies underscoring the
importance of perceived compatibility between teachers’ pedagogical beliefs and the capabili-
ties of IT [16, 34]. It also alludes to teachers using IT for higher-level learning objectives (i.e.,
providing students with educational opportunities such as problem-solving) instead of more
mundane replacement (using IT as an alternative means to teach the same instructional goals)
or amplification purposes (using IT to increase effectiveness and efficiency of teaching) [49].
Given the importance of teachers in IT integration, schools can articulate a common vision
and strategic plans with regards to integrating IT, provide necessary resources to support
teachers, provide teachers with continuous professional development, and provide mecha-
nisms to encourage teachers to experiment with IT integration [50, 51, 52, 53].
Compensatory use of IT
Results showed negative relationships between IT integration and mothers’ education, and stu-
dents’ prior academic achievement. Students with less educated mothers and students with
lower levels of prior academic achievement reported higher levels of IT integration. These
results suggest that schools may have used IT to compensate for the lower learning ability of
students from disadvantaged backgrounds (e.g., with lower mothers’ educational attainment).
information Technology Integration
PLOS ONE | DOI:10.1371/journal.pone.0168547 December 20, 2016 14 / 20

More specifically, results from the present study suggests that some teachers may have used IT
integrated lessons more as a remedial or compensatory strategy to address the specific learning
needs of lower achieving and unmotivated students. Teachers may have assigned individual
use of computer and educational software to lower achieving students more frequently so that
students can obtain more immediate and direct learning feedback [54]. This increased usage
of IT for compensatory purposes may therefore explain the negative IT-achievement relation-
ships found by other researchers [54].
Contrary to expectations, the results showed that students who studied in schools with less
positive teacher-related school learning climate (e.g., teachers being ill-prepared for classes)
reported higher levels of IT integration. The reason for this is unclear, although it is probable
that ill-prepared teachers might use technology as a babysitter tool for their students, as Green
[55] remarked:
“Some teachers want a competent babysitter so they can take break. . .they fervently wish
for a computer lab staffed with a full-time aide [and individual computers] who will receive
their students at the door and return to them safe-and-sound 30 minutes later.”
The results also indicated that students in schools with more mathematics teachers and
with higher parental pressure for academic achievement reported lower levels of IT integra-
tion. Schools with more teachers may find it difficult to schedule computer labs for individual
students to use. The parental pressure for students to score high on tests would create a daunt-
ing challenge for teachers. Teachers probably feel that they can teach more content when they
used technology to didactically present or demonstrate the mathematics topics, rather than
allowing students to use computers on their own to explore the topics because of the additional
time required for the latter.
Insignificant relationships
The results also showed that there was no significant relationship between IT integration and
the following variables: average class size, student-related school learning climate, principal-
related activities, schools’ public posting of achievement data, tracking of school’s achievement
data by administrative authorities, and pedagogical and curricular differentiation in mathe-
matics lessons. The Pearson correlations between these variables, except principals’ monitor-
ing and schools’ pedagogical/curricular differentiation, and IT integration were significant,
but they became insignificant in the HLM models.
The non-significant relationship between average class size and student use of technology is
consistent with the findings of Ritzhaupt and colleagues [42]. It seems that student to com-
puter ratio is a more important predictor variable of student technology use compared to mere
class size.
It is interesting that only the teacher- but not student-related aspects of school learning cli-
mate were related to IT integration in schools. This finding is consistent with the literature
highlighting that teacher characteristics, more so than student or other school attributes, may
be more instrumental to the use of IT in teaching [16, 34]. It also underscores the agency of
teachers in addressing challenges of unmotivated students–they can decide to use IT or other
means to enhance learning.
The finding that different principal leadership behaviors were not predictive of IT integra-
tion alludes to the indirect, mediated effects that school leaders have on school and student
outcomes [56]. The school effectiveness literature has found that principals impact student
achievement indirectly by developing the school’s instructional capacity (setting school vision;
information Technology Integration
PLOS ONE | DOI:10.1371/journal.pone.0168547 December 20, 2016 15 / 20

supporting and monitoring teaching processes; and building systems, structures, and pro-
cesses) so that teachers at the frontline of teaching are better supported to teach effectively
[57]. Therefore, it is likely that principals influence IT integration in teaching through other
proximal processes such as influencing teachers’ beliefs on the use of IT and providing teachers
and students with access to IT as the results of our study have shown.
The results also showed that schools’ public posting of achievement data or the tracking of
school’s achievement data by administrative authorities was not significantly related to IT inte-
gration. These results contrasted with that for parental expectations which was found to nega-
tively predict IT integration. Given the neoliberal context that many schools are operating in
[58, 59], it is understandable that parents, being stakeholders who are most proximal to
schools, are more influential than more remote school inspections (e.g., via monitoring of
results) or the larger community-at-large (e.g., who evaluate school performance via the pubic
posting of students’ results) [59, 60, 61]. In any case, external monitoring of school perfor-
mance by educational authorities may also be influenced by parental expectations.
The reason for the non-significant finding between pedagogical/curricular differentiation
in mathematics lessons and IT integration is unclear. On the one hand, it can be reasoned that
teachers may employ IT to cater to students’ diverse learning needs in differentiation [49]. On
the other hand, teachers have at their disposal many other different platforms and strategies to
choose from in customizing their teaching [62]. Therefore, future research may investigate
how teachers cater to diverse students’ learning needs using IT or other means.
In sum, it is perhaps premature to definitively conclude that the aforementioned variables
are not related to IT integration as some of them may be indirectly related to IT integration
(e.g., principal leadership). Therefore, future research can examine how the myriad variables,
significant or otherwise, are related to each other (e.g., the relationship among schools’ public
posting of results, external monitoring, and parental expectations), and the direct and indirect
effects they have on IT integration [14].
Conclusion
The present study examined what predicted IT integration in secondary school mathematics
lessons. Data from 32,256 secondary school students from 2,519 schools in 16 developed econ-
omies who participated in PISA 2012 were analyzed. For the purposes of the present study, IT
integration was defined as the use of computing devices such as desktop computers, laptops,
tablets, software, or Internet for learning mathematics in schools. It is noteworthy that IT inte-
gration was measured using students’, instead of teachers’, reported data, thereby circumvent-
ing the problems of possible teachers’ inaccurate responses or social desirability bias [43].
A variety of independent variables was examined for their relationship with IT integration.
The availability of the multitudinous variables allows for the examination of the independent
effects of each predictor after controlling for other predictor and student- and school-level
control variables. This approach also represents a significant methodological improvement
over isolated studies focusing on specific variables [16, 18]. To manage the nested data, the
present study employed HLM to address the possible correlation in achievement scores of stu-
dents belonging to the same school and to partition achievement into between-school (the
appropriate level for the purposes of the present study) as opposed to within-school variance
[20].
Results showed that after controlling for student-level (gender, prior academic achievement
and socioeconomic status) and school-level (class size, number of mathematics teachers) vari-
ables, students in schools with more computers per student, with more IT resources, with higher
levels of IT curricular expectations, with an explicit policy on the use of IT in mathematics,
information Technology Integration
PLOS ONE | DOI:10.1371/journal.pone.0168547 December 20, 2016 16 / 20

whose teachers believed in student-centered teaching-learning, and whose teachers provided
more problem-solving activities in class reported higher levels of IT integration. On the other
hand, students who studied in schools with more positive teacher-related school learning cli-
mate, and with more academically demanding parents reported lower levels of IT integration.
Student-related school learning climate, schools’ public posting of achievement data, tracking of
school’s achievement data by administrative authorities, and pedagogical and curricular differ-
entiation in mathematics lessons were not related to levels of IT integration. Put together, the
predictors explained a total of 15.90% of the school-level variance in levels of IT integration. In
particular, school IT resource availability, and mathematics teachers’ pedagogical beliefs and
practices stood out as important determinants of IT integration in mathematics lessons.
The present study contributes to the literature in two ways. First, it provides evidence on
the myriad IT and non-IT related variables that may predict levels of IT integration in mathe-
matics lessons. The results address the knowledge gap arising from the bias on investigating
proximal IT-related variables in previous studies. They also underscore the relative importance
of teachers’ pedagogical beliefs and practices, and access to school IT resources by teachers
and students in IT integration as compared to other school contextual/institutional or mathe-
matics subject culture variables. The second contribution is the insights on the plausible com-
pensatory use of IT for lower-achieving students who may be studying in poorly resourced
schools. These insights add to the evidence pointing to negative association between IT and
students’ achievement reported in some studies.
Notwithstanding these contributions, the present study is unable to provide conclusive
causal claims regarding what predictors contribute to IT integration because of its cross-sec-
tional analysis. Also, while the focus on developed economies in the present study enables
meaningful comparisons to be made, a case can be made that different variables may predict
IT integration in less-developed economies. Future research may employ multi-level structural
equation modelling to examine the relationships among different predictor variables and IT
integration in schools. In particular, this analytical approach may unravel indirect effects on IT
integration for variables that are found to be insignificant in the present study. Longitudinal or
experimental research designs will also address questions of causality. The knowledge base will
also benefit from future research examining the differential impact of IT integration on stu-
dents of different SES and prior academic achievement profiles.
Author Contributions
Conceived and designed the experiments: KFH CYT.
Performed the experiments: CYT.
Analyzed the data: CYT.
Contributed reagents/materials/analysis tools: KFH.
Wrote the paper: KFH CYT.
References1. Cheung ACK, Slavin RE. The effectiveness of educational technology applications for enhancing math-
ematics achievement in K-12 classrooms: a meta-analysis. Educational Research Review. 2013; 9:
88–113.
2. Li Q, Ma X. A meta-analysis of the effects of computer technology on school students’ mathematics
learning. Educational Psychology Review. 2010; 22: 215–243.
information Technology Integration
PLOS ONE | DOI:10.1371/journal.pone.0168547 December 20, 2016 17 / 20
3. Tamin RM, Bernard RM, Borokhovski E, Abrami PC, Schmid RF. What forty years of research says
about the impact of technology on learning: a second-order meta-analysis and validation study. Review
of Educational Research. 2011; 81(1): 4–28.
4. OECD. Students, Computers and Learning: Making the Connection. 2015 [cited 16 December 2015].
Available from: http://www.keepeek.com/Digital-Asset-Management/oecd/education/students-
computers-and-learning_9789264239555-en#page3.
5. Leuven E, Lindahl M, Oosterbeek H, Webbink D. The effect of extra funding for disadvantaged pupils
on achievement. The Review of Economics and Statistics. 2007; 89(4): 721–736.
6. Machin S, McNally S, Silva O. New technology in schools: Is there a payoff?” Economic Journal. 2007;
117(522):1145–1167.
7. Clark RE. Reconsidering research on learning from media. Review of Educational Research. 1983; 53:
445–449.
8. Fabry DL, Higgs JR. Barriers to the effective use of technology in education: current status. Journal of
Educational Computing Research. 1997; 17(4): 385–395.
9. Bebell D, Russell M, O’Dwyer L. Measuring teachers’ technology uses: why multiple-measures are
more revealing. Journal of Research on Technology in Education. 2004; 37(1): 45–63.
10. Bitter GG, Legacy JM. Using technology in the classroom. 7th ed. Boston, MA: Allyn & Bacon; 2008.
11. Hennessy S, Ruthven K, Brindley S. Teacher perspectives on integrating ICT into subject teaching:
commitment, constraints, caution, and change. Journal of Curriculum Studies. 2005; 37(2):155–192.
12. Cuban L, Kirkpatrick H, Peck C. High access and low use of technologies in high school classrooms:
explaining an apparent paradox. American Educational Research Journal. 2001; 38(4): 813–834.
13. Morrison GM, Lowther DL. Integrating computer technology into the classroom. 4th ed. Upper Saddle
River, NJ: Pearson Merrill Prentice Hall; 2010.
14. Hew KF, Brush T. Integrating technology into K-12 teaching: current knowledge gaps and recommenda-
tions for future research, Educational Technology Research and Development. 2007; 55(3): 223–252.
15. Inan FA, Lowther DL. Factors affecting technology integration in K-12 classrooms: a path model. Edu-
cational Technology Research & Development. 2010; 58: 137–154.
16. Zhao Y, Frank KA. Factors affecting technology uses in schools: an ecological perspective. American
Educational Research Journal. 2003; 40(4): 807–840.
17. Reynolds D, Sammons P, de Fraine B, van Damme J, Townsend T, Teddlie C, et al. Educational effec-
tiveness research (EER): a state-of-the-art review. School Effectiveness and School Improvement.
2014; 25(2): 197–230.
18. O’Dwyer L, Russell M, Bebel D. Elementary teachers’ use of technology: characteristics of teachers,
schools, and districts associated with technology use. Boston, MA: Technology and Assessment
Study Collaborative Boston College; 2004.
19. Borenstein M, Hedges LV, Higgins JPT, Rothstein HR. Introduction to meta-analysis. New York, NY:
Wiley; 2009.
20. Raudenbush SW, Bryk B. Hierarchical liner models: applications and data analysis methods. 2nd ed.
Thousand Oaks, CA: Sage; 2002.
21. Baker DP, Goesling B, Letendre GK. Socioeconomic status, school quality, and national economic
development: a cross-national analysis of the “Heyneman-Loxley Effect” on mathematics and science
achievement. Comparative Education Review. 2002; 46(3): 291–312.
22. Schleicher A. Securing quality and equity in education: lessons from PISA. Prospects. 2009; 39: 251–
263.
23. Ertmer PA, Addison P, Lane M, Ross E, Woods D. Examining teachers’ beliefs about the role of technol-
ogy in the elementary classroom. Journal of Research on Computing in Education. 1999; 32(1): 54–71.
24. Galanouli D, Murphy C, Gardner J. Teachers’ perceptions of the effectiveness of ICT-competence train-
ing. Computers & Education.2004; 43: 63–79.
25. Wachira P, Keengwe J. Technology integration barriers: urban school mathematics teachers’ perspec-
tives. Journal of Science Education Technology. 2011; 20: 17–25.
26. Yildirim S. Current utilization of ICT in Turkish basic education schools: a review of teacher’s ICT use
and barriers to integration. International Journal of Instructional Media. 2007; 34(2): 171–186.
27. Dawson C, Rakes GC. The influence of principals’ technology training on the integration of technology
into schools. Journal of Research on Technology in Education. 2003; 36(1): 29–49.
28. Grimes D, Warschauer M. Learning with laptops: A multi-method case study. Journal of Educational
Computing Research. 2008; 38(3): 305–332.
information Technology Integration
PLOS ONE | DOI:10.1371/journal.pone.0168547 December 20, 2016 18 / 20

29. Mathews JG, Guarino AJ. Predicting teacher computer use: a path analysis. International Journal of
Instructional Media. 2000; 27(4): 385–392.
30. van Braak J, Tondeur J, Valcke M. Explaining different types of computer use among primary school
teachers. European Journal of Psychology of Education. 2004; 19(4): 407–422.
31. Hermans R, Tondeur J, Van Braak J, Valcke M. The impact of primary school teachers’ educational
beliefs on the classroom use of computers. Computers & Education. 2008; 51(4): 1499–1509.
32. Liu SH. Factors related to pedagogical beliefs of teachers and technology integration. Computers &
Education. 2011; 56: 1012–1022.
33. Sang G, Valcke M, van Braak J, Tondeur J. Student teachers’ thinking processes and ICT integration:
predictors of prospective teaching behaviors with educational technology. Computers & Education.
2010; 54(1): 103–112.
34. Ertmer PA. Teacher pedagogical beliefs: the final frontier in our quest for technology integration. Educa-
tional Technology Research and Development. 2005; 53(4): 25–39.
35. Meirink JA, Meijer PC, Verloop N, Bergen TCM. Understanding teacher learning in secondary educa-
tion: the relations of teacher activities to changed beliefs about teaching and learning. Teaching and
Teacher Education. 2009; 25(1): 89–100.
36. Schuh KL. Learner-centered principles in teacher-centered practices? Teaching and Teacher Educa-
tion. 2004; 20(8): 833–846.
37. Tondeur J, Valcke M, van Braak J. A multidimensional approach to determinants of computer use in pri-
mary education: teacher and school characteristics. Journal of Computer Assisted Learning. 2008; 24:
494–506.
38. Dochy FJRC. Prior knowledge and learning. In: Husen T, Postlethwaite TN, editors. International Ency-
clopedia of Education. 2nd ed. New York: Pergamon Press; 1994. pp. 4698–4702.
39. Richter T. What is wrong with ANOVA and multiple regression? Analyzing sentence reading times with
hierarchical linear models. Discourse Processes. 2006; 41(3): 221–250.
40. Werblow J, Duesbery L. The impact of high school size on math achievement and dropout rate. The
High School Journal. 2009; 92: 14–23.
41. Inan FA, Lowther DL. Laptops in the K-12 classrooms: exploring factors impacting instructional use.
Computers & Education. 2010; 55(3): 937–944.
42. Ritzhaupt AD, Dawson K, Cavanaugh C. An Investigation of Factors Influencing Student Use of Tech-
nology in K-12 Classrooms Using Path Analysis. Journal of Educational Computing Research. 2012;
46(3): 229–254.
43. Rosenfeld P, Booth-Kewley S, Edwards JE, Thomas MD. Responses on computer surveys: Impression
management, social desirability, and the big brother syndrome. Computers in Human Behavior. 1996;
12(2): 263–274.
44. Harris RG. The knowledge-based economy: intellectual origins and new economic perspectives. Inter-
national Journal of Management Reviews. 2001; 3(1): 21–40.
45. Johnson DW, Johnson RT. Implementing cooperative learning. Contemporary Education. 1992; 63(3):
173–180.
46. Lowther DL, Ross SM, Morrison GM. When each one has one: the influences on teaching strategies
and student achievement of using laptops in the classroom. Educational Technology Research and
Development, 2003; 51(3): 23–44.
47. Tearle P. A theoretical and instrumental framework for implementing change in ICT in education. Cam-
bridge Journal of Education. 2004; 34(3): 331–351.
48. Lowther DL, Inan FA, Strahl JD, Ross SM. Does technology integration “work” when key barriers are
removed? Educational Media International. 2008; 45(3): 189–206.
49. Hughes J. The role of teacher knowledge and learning experiences in forming technology-integrated
pedagogy. Journal of Technology and Teacher Education. 2005; 13(2): 277–302.
50. Lawson T, Comber C. Superhighways technology: personnel factors leading to successful integration
of information and communications technology in schools and colleges. Journal of Information Technol-
ogy for Teacher Education. 1999; 8(1): 41–53.
51. Mouza C. Learning to teach with new technology: implications for professional development. Journal of
Research on Technology in Education. 2002–2003; 35(2): 272–289.
52. Sandholtz JH, Reilly B. Teachers, not technicians: rethinking technical expectations for teachers.
Teachers College Record. 2004; 106(3): 487–512.
53. Schiller J. Interventions by school leaders in effective implementation of information and communica-
tions technology: perceptions of Australian principals. Journal of Information Technology for Teacher
Education. 2002; 11(3): 289–301.
information Technology Integration
PLOS ONE | DOI:10.1371/journal.pone.0168547 December 20, 2016 19 / 20

54. Papanastasiou EC, Zembylas M, Vrasidas C. Can computer use hurt science achievement? The USA
results from PISA. Journal of Science Education and Technology. 2003; 12(3): 325–332.
55. Green LC. Teacher and instructional technology: Wise or foolish choices. Intercultural Development
Research Association; 2002 [cited 2015 Aug 25]. Available from http://www.idra.org/IDRA_Newsletter/
May_2002_Self_Renewing_Schools_Technology/Teacher_and_Instructional_Technology/
56. Hendriks MA, Scheerens J. School leadership effects revisited: a review of empirical studies guided by
indirect-effect models. School Leadership & Management. 2013; 33(4): 373–394.
57. Hallinger P. A review of three decades of doctoral studies using the Principal Instructional Management
Rating Scale: a lens on methodological progress in educational leadership. Educational Administration
Quarterly. 2011; 47(2): 271–306.
58. Ball SJ. The teacher’s soul and the terrors of performativity. Journal of Education Policy. 2003; 18(2):
215–228.
59. Lee M, Walker A, Chui YL. Contrasting effects of instructional leadership practices on student learning
in a high accountability context. Journal of Educational Administration. 2012; 50(5): 586–611.
60. Gordon MF, Louis KS. Liking parent and community involvement with student achievement: comparing
principal and teacher perceptions of stakeholder influence. American Journal of Education. 2009; 116
(1): 1–31.
61. Ladd HF, Fiske EB. Does competition improve teaching and learning? Evidence from New Zealand.
Educational Evaluation and Policy Analysis. 2003; 25(1): 97–112.
62. Hattie J. Visible learning: a synthesis of over 800 meta-analyses relating to achievement. London &
New York, NY: Routledge; 2009.
information Technology Integration
PLOS ONE | DOI:10.1371/journal.pone.0168547 December 20, 2016 20 / 20