harmonics measurement in computer laboratory and design … measurement in computer laboratory and...
TRANSCRIPT
(IJACSA) International Journal of Advanced Computer Science and Applications,
Vol. 8, No. 12, 2017
240 | P a g e
www.ijacsa.thesai.org
Harmonics Measurement in Computer Laboratory and
Design of Passive Harmonic Filter using MATLAB
1Muhammad Usman Keerio,
2Muhammad Shahzad Bajwa,
3Abdul Sattar Saand and
4Munwar Ayaz memon
Department of Electrical Engineering QUEST Nawabshah
Sindh, Pakistan
Abstract—In this paper the harmonics measurement for
computer loads is analyzed and passive filters are designed for
mitigating those harmonics. The filters are designed to meet the
IEEE standard 519-1992 which is recommended for harmonic
current limits. Personal computers are non-linear loads that
generate harmonics due to non-sinusoidal current present at
entrance of power supply. In this work the personal computers in
laboratory are taken as domestic load and harmonics generated
by them cannot be ignored which are simulated using
MATLAB/Simulink. The purpose is developing analytical
method for the design of the passive harmonic filter that absorbs
current harmonics caused by computer loads. The findings of
this study would be supportive to make the source current free
from harmonics thereby reducing the THD. Simulation results of
proposed design method of passive filters shows attractive results
for harmonic reduction with profit of upgrade of power factor.
Design of passive harmonic filters by using non active power can
be simple cost effective solution for systems.
Keywords—Power Quality (PQ); personal computers; Total
Harmonic Distortion (THD); passive filter; MATLAB/Simulink
I. INTRODUCTION
In AC power supply systems, current waveform is distorted and harmonics are created due to usage of non-linear loads that reduces the quality of power [1], [2]. That causes enormous fault occurrence and monetary losses toward power supply system. Harmonics effect in AC power system is increasing day by day [3], [4]. Harmonics due to personal computers loads has particular attention to power quality (PQ) because personal computers are frequently concentrated in a massive group and produces harmonics [5], [6].
A. Personal Computers(PC’s)
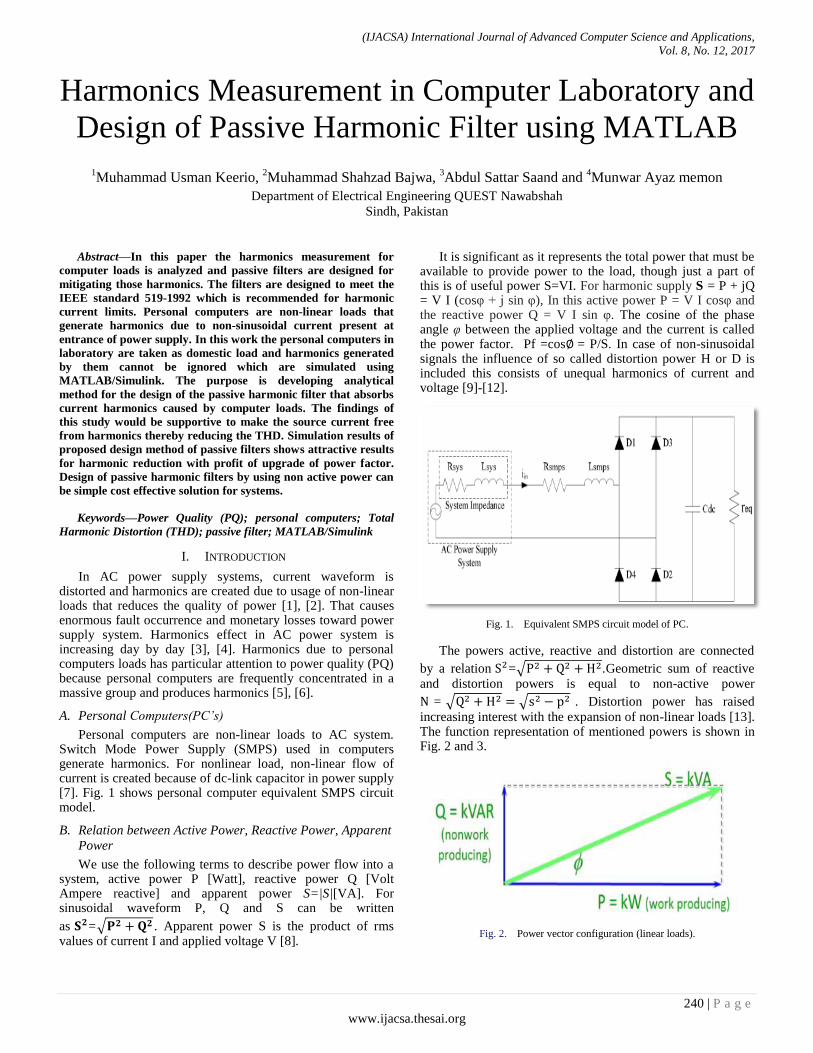
Personal computers are non-linear loads to AC system. Switch Mode Power Supply (SMPS) used in computers generate harmonics. For nonlinear load, non-linear flow of current is created because of dc-link capacitor in power supply [7]. Fig. 1 shows personal computer equivalent SMPS circuit model.
B. Relation between Active Power, Reactive Power, Apparent
Power
We use the following terms to describe power flow into a system, active power P [Watt], reactive power Q [Volt Ampere reactive] and apparent power S=|S|[VA]. For sinusoidal waveform P, Q and S can be written
as =√ . Apparent power S is the product of rms values of current I and applied voltage V [8].
It is significant as it represents the total power that must be available to provide power to the load, though just a part of this is of useful power S=VI. For harmonic supply S = P + jQ = V I (cosφ + j sin φ), In this active power P = V I cosφ and the reactive power Q = V I sin φ. The cosine of the phase angle φ between the applied voltage and the current is called the power factor. Pf =cos = P/S. In case of non-sinusoidal signals the influence of so called distortion power H or D is included this consists of unequal harmonics of current and voltage [9]-[12].
Fig. 1. Equivalent SMPS circuit model of PC.
The powers active, reactive and distortion are connected
by a relation =√ .Geometric sum of reactive
and distortion powers is equal to non-active power
= √ √ . Distortion power has raised
increasing interest with the expansion of non-linear loads [13]. The function representation of mentioned powers is shown in Fig. 2 and 3.
Fig. 2. Power vector configuration (linear loads).
(IJACSA) International Journal of Advanced Computer Science and Applications,
Vol. 8, No. 12, 2017
241 | P a g e
www.ijacsa.thesai.org
Fig. 3. Power vector configuration (non-linear loads).
The paper is organized as follows: Section I presents the introduction of non-linear load and harmonic distortion, Section II presents the methodology of research work, Section III presents the result of measurement of harmonic distortion for computer laboratory, Section IV present the simulation of system for proposed filter design and discussion about obtained results and Section V concludes the paper.
II. METHODOLOGY
Harmonic distortion depends upon electronic elements used in appliance‟s circuitry. Numbers of nonlinear residential loads are increasing day by day; therefore harmonics caused by these loads cannot be neglected. There are many techniques to reduce harmonics but economic and maintenance points of view there have necessity to select best compensation method. The design attempts to comply with the IEEE Standard 519-1992 recommended harmonic limits applied to the current harmonic limits [14]-[17].
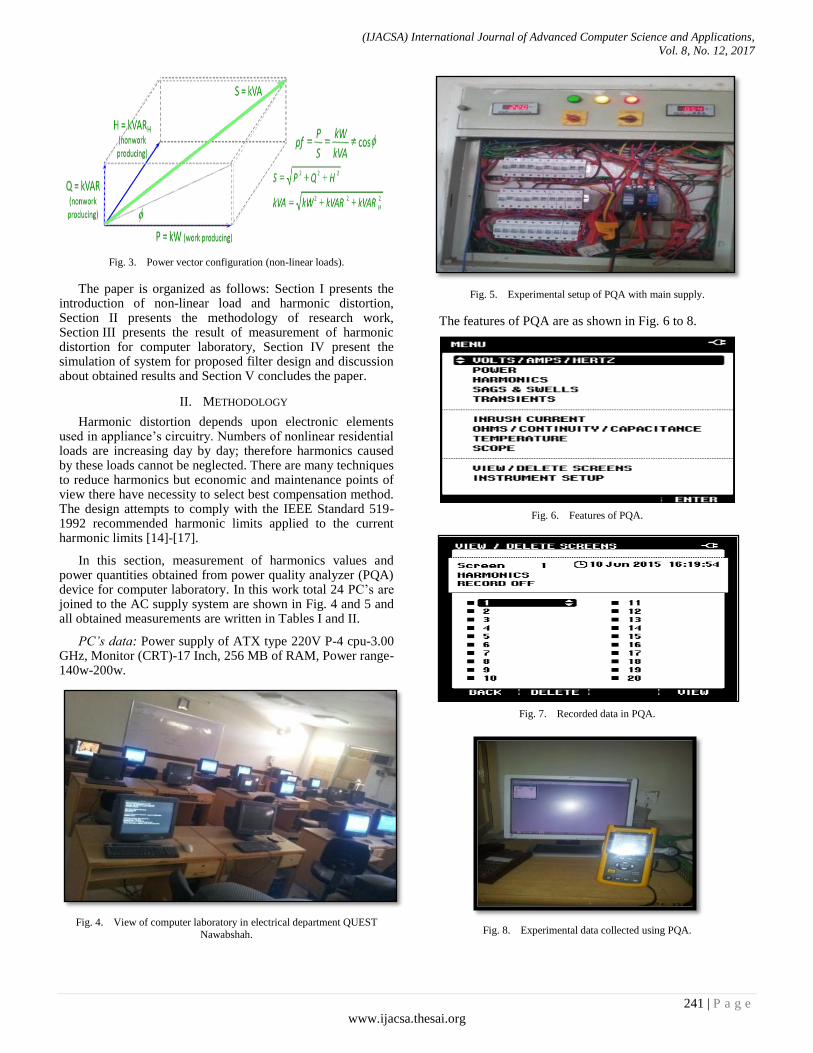
In this section, measurement of harmonics values and power quantities obtained from power quality analyzer (PQA) device for computer laboratory. In this work total 24 PC‟s are joined to the AC supply system are shown in Fig. 4 and 5 and all obtained measurements are written in Tables I and II.
PC’s data: Power supply of ATX type 220V P-4 cpu-3.00 GHz, Monitor (CRT)-17 Inch, 256 MB of RAM, Power range-140w-200w.
Fig. 4. View of computer laboratory in electrical department QUEST
Nawabshah.
Fig. 5. Experimental setup of PQA with main supply.
The features of PQA are as shown in Fig. 6 to 8.
Fig. 6. Features of PQA.
Fig. 7. Recorded data in PQA.
Fig. 8. Experimental data collected using PQA.
(IJACSA) International Journal of Advanced Computer Science and Applications,
Vol. 8, No. 12, 2017
242 | P a g e
www.ijacsa.thesai.org
III. MEASUREMENT RESULTS OF PQA
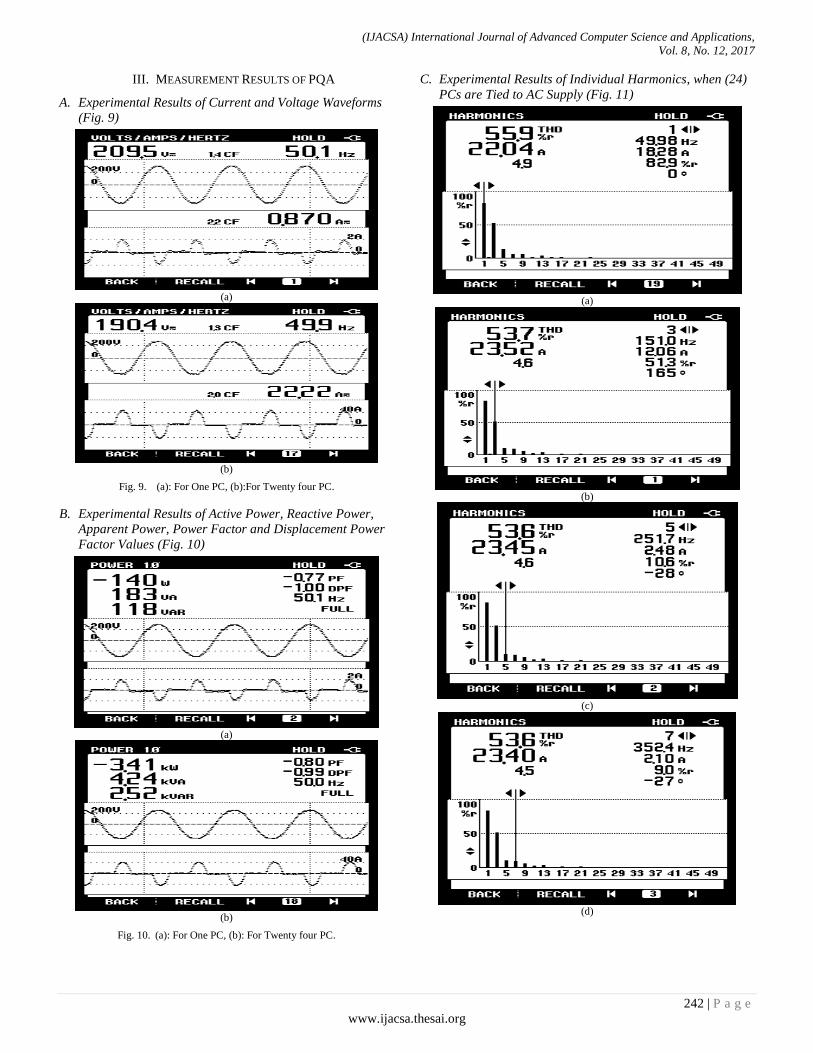
A. Experimental Results of Current and Voltage Waveforms
(Fig. 9)
(a)
(b)
Fig. 9. (a): For One PC, (b):For Twenty four PC.
B. Experimental Results of Active Power, Reactive Power,
Apparent Power, Power Factor and Displacement Power
Factor Values (Fig. 10)
(a)
(b)
Fig. 10. (a): For One PC, (b): For Twenty four PC.
C. Experimental Results of Individual Harmonics, when (24)
PCs are Tied to AC Supply (Fig. 11)
(a)
(b)
(c)
(d)
(IJACSA) International Journal of Advanced Computer Science and Applications,
Vol. 8, No. 12, 2017
243 | P a g e
www.ijacsa.thesai.org
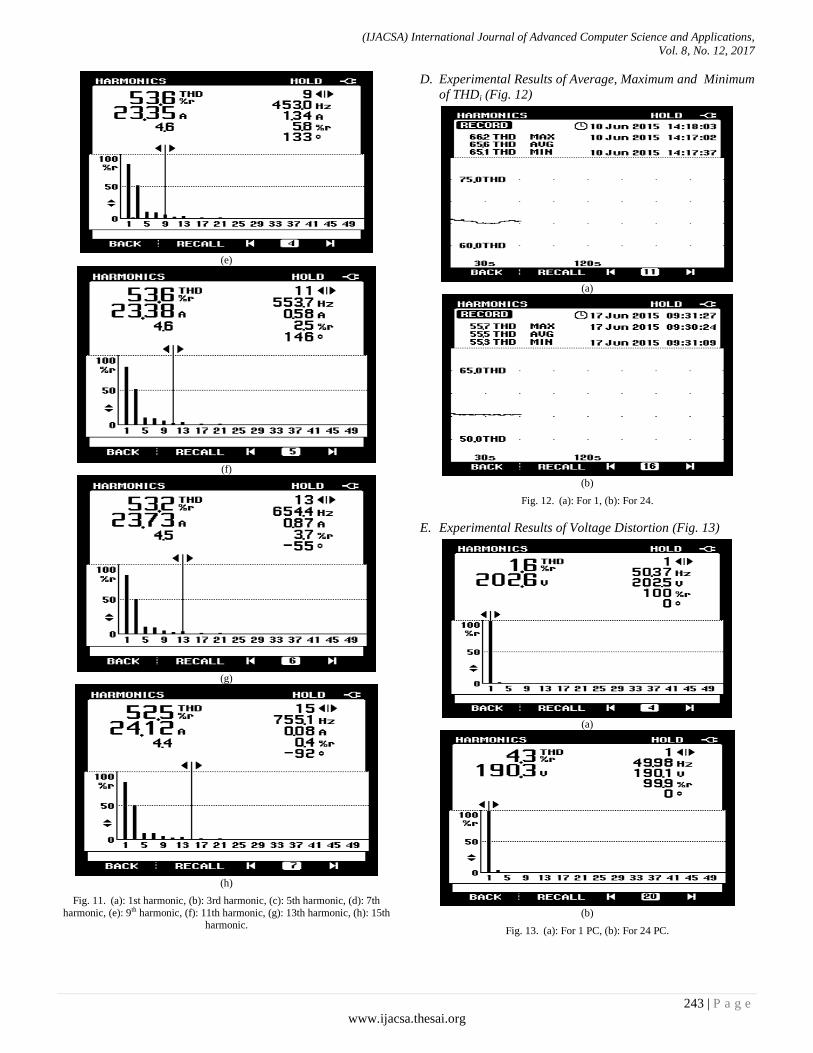
(e)
(f)
(g)
(h)
Fig. 11. (a): 1st harmonic, (b): 3rd harmonic, (c): 5th harmonic, (d): 7th
harmonic, (e): 9th harmonic, (f): 11th harmonic, (g): 13th harmonic, (h): 15th harmonic.
D. Experimental Results of Average, Maximum and Minimum
of THDi (Fig. 12)
(a)
(b)
Fig. 12. (a): For 1, (b): For 24.
E. Experimental Results of Voltage Distortion (Fig. 13)
(a)
(b)
Fig. 13. (a): For 1 PC, (b): For 24 PC.
(IJACSA) International Journal of Advanced Computer Science and Applications,
Vol. 8, No. 12, 2017
244 | P a g e
www.ijacsa.thesai.org
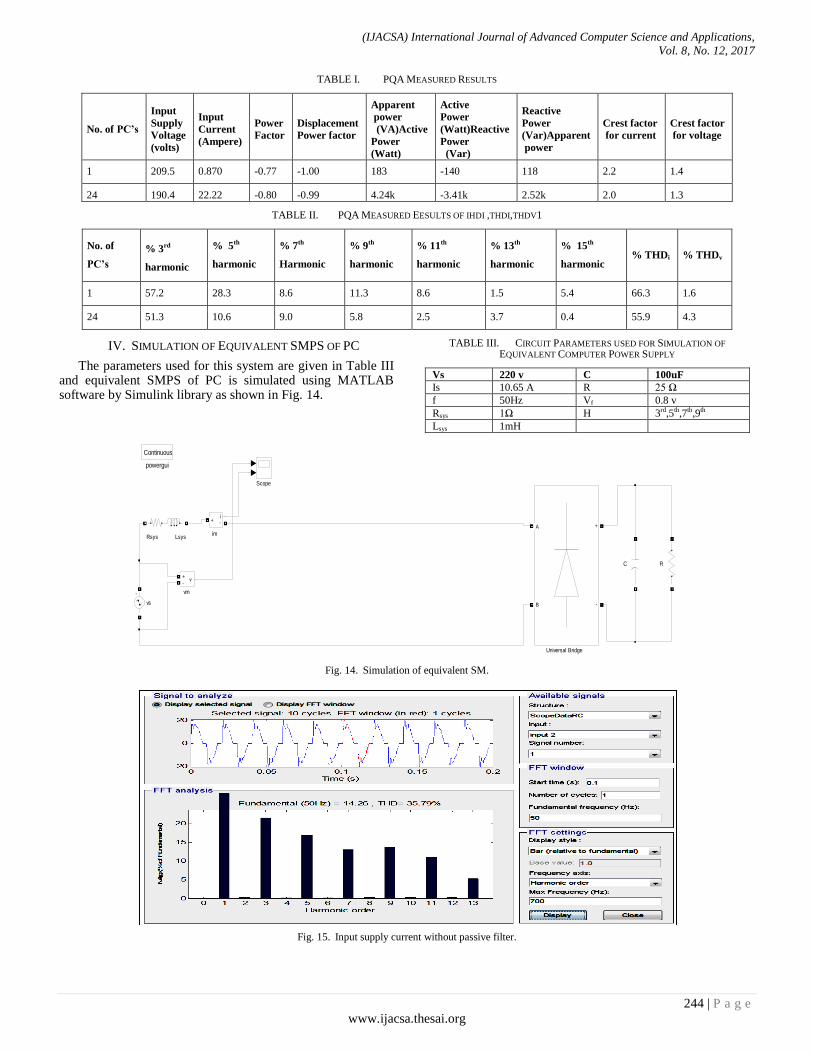
TABLE I. PQA MEASURED RESULTS
No. of PC’s
Input
Supply
Voltage
(volts)
Input
Current
(Ampere)
Power
Factor Displacement
Power factor
Apparent
power
(VA)Active
Power
(Watt)
Active
Power
(Watt)Reactive
Power
(Var)
Reactive
Power
(Var)Apparent
power
Crest factor
for current
Crest factor
for voltage
1 209.5 0.870 -0.77 -1.00 183 -140 118 2.2 1.4
24 190.4 22.22 -0.80 -0.99 4.24k -3.41k 2.52k 2.0 1.3
TABLE II. PQA MEASURED EESULTS OF IHDI ,THDI,THDV1
No. of
PC’s
% 3rd
harmonic
% 5th
harmonic
% 7th
Harmonic
% 9th
harmonic
% 11th
harmonic
% 13th
harmonic
% 15th
harmonic % THDi % THDv
1 57.2 28.3 8.6 11.3 8.6 1.5 5.4 66.3 1.6
24 51.3 10.6 9.0 5.8 2.5 3.7 0.4 55.9 4.3
IV. SIMULATION OF EQUIVALENT SMPS OF PC
The parameters used for this system are given in Table III and equivalent SMPS of PC is simulated using MATLAB software by Simulink library as shown in Fig. 14.
TABLE III. CIRCUIT PARAMETERS USED FOR SIMULATION OF
EQUIVALENT COMPUTER POWER SUPPLY
Vs 220 v C 100uF
Is 10.65 A R 25 Ω
f 50Hz Vf 0.8 v
Rsys 1Ω H 3rd,5th,7th,9th
Lsys 1mH
Fig. 14. Simulation of equivalent SM.
Fig. 15. Input supply current without passive filter.
im
vs
vm
v+-
powergui
Continuous
i+ -
Universal Bridge
A
B
+
-
Scope
Rsys Lsys
RC
(IJACSA) International Journal of Advanced Computer Science and Applications,
Vol. 8, No. 12, 2017
245 | P a g e
www.ijacsa.thesai.org
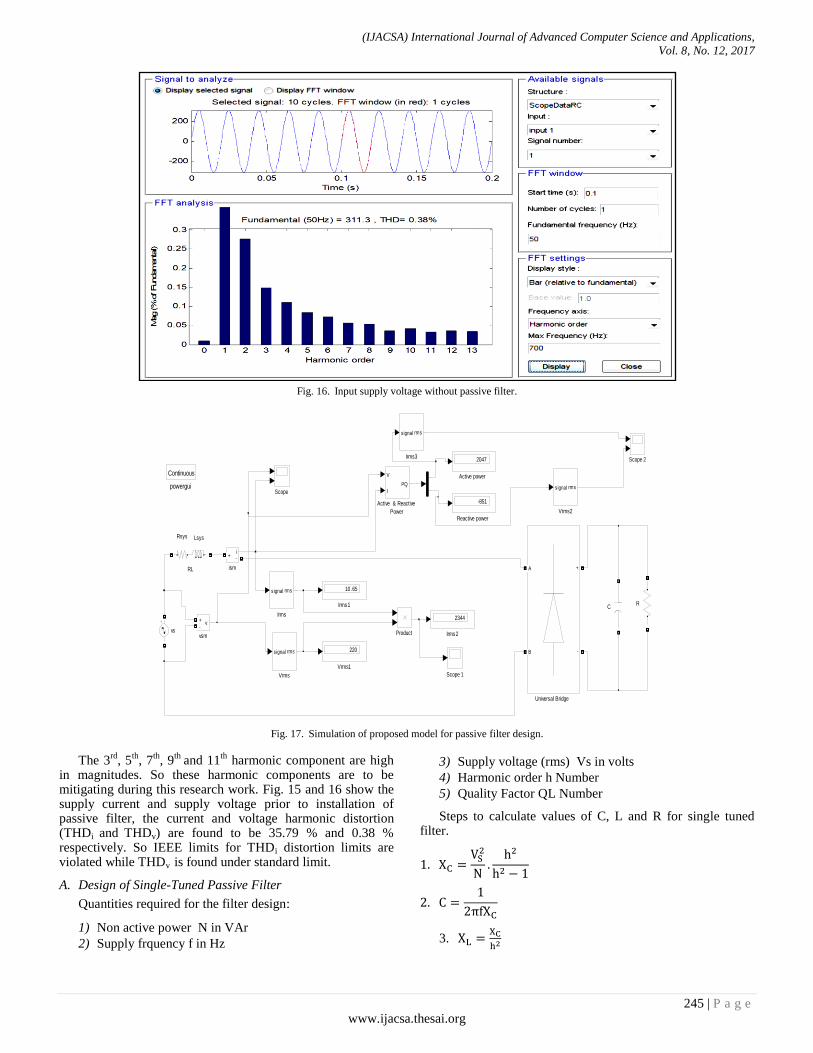
Fig. 16. Input supply voltage without passive filter.
Fig. 17. Simulation of proposed model for passive filter design.
The 3rd
, 5th
, 7th
, 9th
and 11th
harmonic component are high in magnitudes. So these harmonic components are to be mitigating during this research work. Fig. 15 and 16 show the supply current and supply voltage prior to installation of passive filter, the current and voltage harmonic distortion (THDi and THDv) are found to be 35.79 % and 0.38 % respectively. So IEEE limits for THDi distortion limits are violated while THDv is found under standard limit.
A. Design of Single-Tuned Passive Filter
Quantities required for the filter design:
1) Non active power N in VAr
2) Supply frquency f in Hz
3) Supply voltage (rms) Vs in volts
4) Harmonic order h Number
5) Quality Factor QL Number
Steps to calculate values of C, L and R for single tuned filter.
3.
Rsys Lsys
vsm
v+-
vs
powergui
Continuous
ism
i+ -
Vrms2
signal rms
Vrms1
220
Vrms
signal rms
Universal Bridge
A
B
+
-
Scope 2
Scope 1
Scope
Reactive power
-851
RL
R
Product
Irms3
signal rms
Irms2
2344
Irms1
10 .65
Irms
signal rms
C
Active power
2047
Active & Reactive
Power
V
IPQ
(IJACSA) International Journal of Advanced Computer Science and Applications,
Vol. 8, No. 12, 2017
246 | P a g e
www.ijacsa.thesai.org
4. L =
5. R=
Here to avoid from using a trial-and-error approach for single tune filter design, non-active power is considered as design parameter and proposed MATLAB/Simulink model for doing this calculation is as shown in Fig. 17 and various power obtained from this proposed model is written as shown in Table IV.
TABLE IV. VARIOUS POWERS OBTAINED WITH PROPOSED MODEL
S(VA) P(W) Q(VAr)
2344 2047W -851Var
Now we can use below equation to computes the non-active power needs in Var as follows:
=√ √ =√
N=1141.98 Var
Now we can calculate values of required passive harmonic component filter as follows.
For 3rd
Harmonic filter
=
= 47.68 Ω
2.
=
= 66.79uF
3.
=
= 5.29 Ω
4. L =
=
= 16.8mH
5. R=
=
= 0.1058 Ω
Similarly follows the same steps ,in this paper four single tuned passive filter has been designed such as 3
rd,5
th,7
th and 9
th
and the values of all passive tuned filter can be shown in Table V.
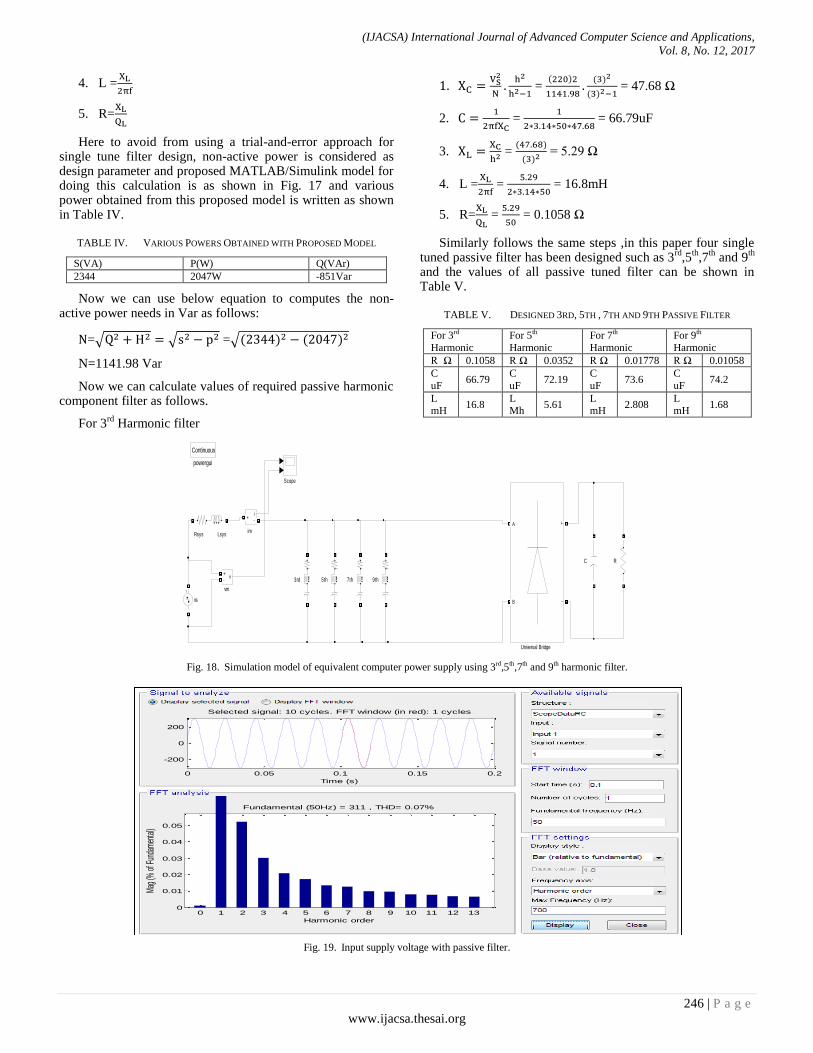
TABLE V. DESIGNED 3RD, 5TH , 7TH AND 9TH PASSIVE FILTER
For 3rd
Harmonic
For 5th
Harmonic
For 7th
Harmonic
For 9th
Harmonic
R Ω 0.1058 R Ω 0.0352 R Ω 0.01778 R Ω 0.01058
C
uF 66.79
C
uF 72.19
C
uF 73.6
C
uF 74.2
L mH
16.8 L Mh
5.61 L mH
2.808 L mH
1.68
Fig. 18. Simulation model of equivalent computer power supply using 3rd,5th,7th and 9th harmonic filter.
Fig. 19. Input supply voltage with passive filter.
im
vs
vm
v+-
powergui
Continuous
i+ -
Universal Bridge
A
B
+
-
Scope
Rsys Lsys
RC
9th7th5th3rd
0 0.05 0.1 0.15 0.2
-200
0
200
Selected signal: 10 cycles. FFT window (in red): 1 cycles
Time (s)
0 1 2 3 4 5 6 7 8 9 10 11 12 130
0.01
0.02
0.03
0.04
0.05
Harmonic order
Fundamental (50Hz) = 311 , THD= 0.07%
Mag
(% o
f Fun
dam
enta
l)
(IJACSA) International Journal of Advanced Computer Science and Applications,
Vol. 8, No. 12, 2017
247 | P a g e
www.ijacsa.thesai.org
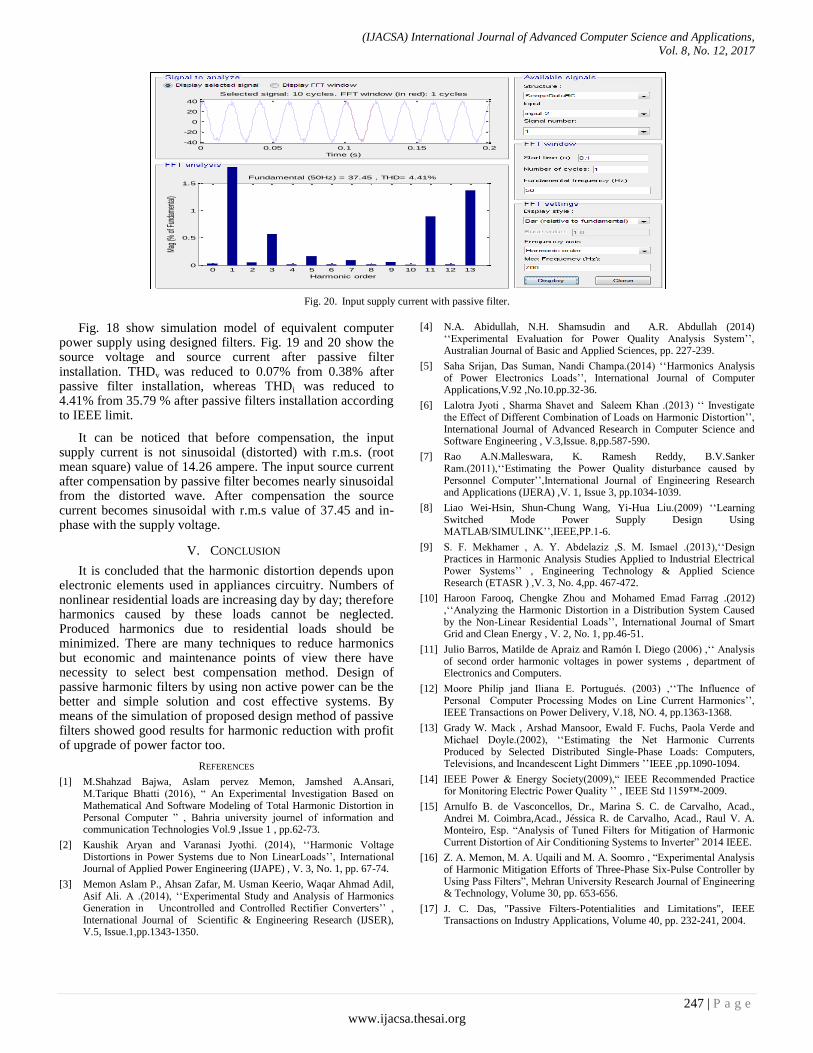
Fig. 20. Input supply current with passive filter.
Fig. 18 show simulation model of equivalent computer power supply using designed filters. Fig. 19 and 20 show the source voltage and source current after passive filter installation. THDv was reduced to 0.07% from 0.38% after passive filter installation, whereas THDi was reduced to 4.41% from 35.79 % after passive filters installation according to IEEE limit.
It can be noticed that before compensation, the input supply current is not sinusoidal (distorted) with r.m.s. (root mean square) value of 14.26 ampere. The input source current after compensation by passive filter becomes nearly sinusoidal from the distorted wave. After compensation the source current becomes sinusoidal with r.m.s value of 37.45 and in-phase with the supply voltage.
V. CONCLUSION
It is concluded that the harmonic distortion depends upon electronic elements used in appliances circuitry. Numbers of nonlinear residential loads are increasing day by day; therefore harmonics caused by these loads cannot be neglected. Produced harmonics due to residential loads should be minimized. There are many techniques to reduce harmonics but economic and maintenance points of view there have necessity to select best compensation method. Design of passive harmonic filters by using non active power can be the better and simple solution and cost effective systems. By means of the simulation of proposed design method of passive filters showed good results for harmonic reduction with profit of upgrade of power factor too.
REFERENCES
[1] M.Shahzad Bajwa, Aslam pervez Memon, Jamshed A.Ansari, M.Tarique Bhatti (2016), “ An Experimental Investigation Based on Mathematical And Software Modeling of Total Harmonic Distortion in Personal Computer ” , Bahria university journel of information and communication Technologies Vol.9 ,Issue 1 , pp.62-73.
[2] Kaushik Aryan and Varanasi Jyothi. (2014), „„Harmonic Voltage Distortions in Power Systems due to Non LinearLoads‟‟, International Journal of Applied Power Engineering (IJAPE) , V. 3, No. 1, pp. 67-74.
[3] Memon Aslam P., Ahsan Zafar, M. Usman Keerio, Waqar Ahmad Adil, Asif Ali. A .(2014), „„Experimental Study and Analysis of Harmonics Generation in Uncontrolled and Controlled Rectifier Converters‟‟ , International Journal of Scientific & Engineering Research (IJSER), V.5, Issue.1,pp.1343-1350.
[4] N.A. Abidullah, N.H. Shamsudin and A.R. Abdullah (2014) „„Experimental Evaluation for Power Quality Analysis System‟‟, Australian Journal of Basic and Applied Sciences, pp. 227-239.
[5] Saha Srijan, Das Suman, Nandi Champa.(2014) „„Harmonics Analysis of Power Electronics Loads‟‟, International Journal of Computer Applications,V.92 ,No.10.pp.32-36.
[6] Lalotra Jyoti , Sharma Shavet and Saleem Khan .(2013) „„ Investigate the Effect of Different Combination of Loads on Harmonic Distortion‟‟, International Journal of Advanced Research in Computer Science and Software Engineering , V.3,Issue. 8,pp.587-590.
[7] Rao A.N.Malleswara, K. Ramesh Reddy, B.V.Sanker Ram.(2011),„„Estimating the Power Quality disturbance caused by Personnel Computer‟‟,International Journal of Engineering Research and Applications (IJERA) ,V. 1, Issue 3, pp.1034-1039.
[8] Liao Wei-Hsin, Shun-Chung Wang, Yi-Hua Liu.(2009) „„Learning Switched Mode Power Supply Design Using MATLAB/SIMULINK‟‟,IEEE,PP.1-6.
[9] S. F. Mekhamer , A. Y. Abdelaziz ,S. M. Ismael .(2013),„„Design Practices in Harmonic Analysis Studies Applied to Industrial Electrical Power Systems‟‟ , Engineering Technology & Applied Science Research (ETASR ) ,V. 3, No. 4,pp. 467-472.
[10] Haroon Farooq, Chengke Zhou and Mohamed Emad Farrag .(2012) ,„„Analyzing the Harmonic Distortion in a Distribution System Caused by the Non-Linear Residential Loads‟‟, International Journal of Smart Grid and Clean Energy , V. 2, No. 1, pp.46-51.
[11] Julio Barros, Matilde de Apraiz and Ramón I. Diego (2006) ,„„ Analysis of second order harmonic voltages in power systems , department of Electronics and Computers.
[12] Moore Philip jand Iliana E. Portugués. (2003) ,„„The Influence of Personal Computer Processing Modes on Line Current Harmonics‟‟, IEEE Transactions on Power Delivery, V.18, NO. 4, pp.1363-1368.
[13] Grady W. Mack , Arshad Mansoor, Ewald F. Fuchs, Paola Verde and Michael Doyle.(2002), „„Estimating the Net Harmonic Currents Produced by Selected Distributed Single-Phase Loads: Computers, Televisions, and Incandescent Light Dimmers ‟‟IEEE ,pp.1090-1094.
[14] IEEE Power & Energy Society(2009),“ IEEE Recommended Practice for Monitoring Electric Power Quality ‟‟ , IEEE Std 1159™-2009.
[15] Arnulfo B. de Vasconcellos, Dr., Marina S. C. de Carvalho, Acad., Andrei M. Coimbra,Acad., Jéssica R. de Carvalho, Acad., Raul V. A. Monteiro, Esp. “Analysis of Tuned Filters for Mitigation of Harmonic Current Distortion of Air Conditioning Systems to Inverter” 2014 IEEE.
[16] Z. A. Memon, M. A. Uqaili and M. A. Soomro , “Experimental Analysis of Harmonic Mitigation Efforts of Three-Phase Six-Pulse Controller by Using Pass Filters”, Mehran University Research Journal of Engineering & Technology, Volume 30, pp. 653-656.
[17] J. C. Das, "Passive Filters-Potentialities and Limitations", IEEE Transactions on Industry Applications, Volume 40, pp. 232-241, 2004.
0 0.05 0.1 0.15 0.2-40
-20
0
20
40
Selected signal: 10 cycles. FFT window (in red): 1 cycles
Time (s)
0 1 2 3 4 5 6 7 8 9 10 11 12 130
0.5
1
1.5
Harmonic order
Fundamental (50Hz) = 37.45 , THD= 4.41%Ma
g (%
of F
unda
menta
l)