harmonic source identification using partial least...
TRANSCRIPT

CEED Seminar Proceedings 2015 Khaksar: Harmonic Source Identification
97
Harmonic Source Identification Using Partial Least Squares Regression
Sina Khaksar
Tyrone Fernando, Herbert Iu School of Electrical and Electronic Engineering
Yau Chow CEED Client: Western Power
Abstract
Harmonic distortions in power systems are an increasingly significant concern for utility companies and can adversely impact the efficient utilisation of a power system, driving up costs. Being able to identify the sources of these distortions would have a sizable impact on network and business planning. This project explores the methodologies proposed in literature for harmonic source identification and evaluates their practicality and applicability to the existing Western Power network and available resources. A data-based approach, based on Partial Least Squares (PLS) regression, has been chosen and further developed into a software tool that can be used by power engineers. The algorithm has been tested on real world field-data with preliminary results illustrating how it can be used by power engineers to aid network planning and analysis. The methodology will be subject to further validation by comparing results with an alternative methodology, based on system impedances, carried out in the same test environment. Further recommended study includes testing in a simulated environment and testing the effect of increasing the sampling rate.
1. Introduction Harmonics are sinusoidal components of periodic waveforms that have a frequency that is a multiple of the fundamental power frequency and cause waveform distortions when combined with the fundamental frequency component. Due to the development of power electronics and increasing use of non-linear loads in industrial environments, these distortions have become a significant power quality concern for utility companies. The effects of harmonic distortions in power systems include the reduction of efficiency in the generation, transmission and utilisation of electrical energy, shortening of life of electrical equipment and the malfunctioning and increased faults of plant component. In addition to reducing these effects, being able to identify or narrow down which regions and customers are generating noise into the system will allow more efficient network investigation and enable a more proactive approach to network planning. Additionally, better insight of harmonic sources can impact business strategy as power utility companies incorporate harmonic noise generation into contract negotiations with industrial customers. The problem can also be characterised in a “Big Data” context. Western Power collects large amounts of data on harmonic measurements from their power network every day; this project addresses the question of whether, through the use of data mining techniques, useful information can be extracted from this resource that is otherwise difficult for humans to interpret and analyse.
CEED Seminar Proceedings 2015 Khaksar: Harmonic Source Identification
98
1.1 Project Objectives This project has an iterative research, experimental and design component with the following scope and objectives: 1) Research methodologies proposed in literature for harmonic source identification and evaluate their practicality within the context of existing Western Power resources and capabilities; 2) Propose, develop and field-test chosen methodology, and review and validate its performance; and 3) Design a software tool that implements the developed algorithm to be used by engineers in aide of network planning and analysis. 1.2 Literature Review The earliest methods proposed to quantify harmonic contribution looked at the direction of the power flow at the point of common coupling (PCC). However it has been shown that in situations where both sides (utility and customer) generate harmonics then power flow is not a reliable indicator (Xu et al., 2002). The superposition method features prominently in the literature and involves modelling the power system into separate Norton equivalents of the utility and customer sides (Söder et al., 1999) and then defining the current and voltage harmonic contributions of each side using superposition. As a consequence, the superposition model requires knowledge of the customer and utility impedances. This would present a significant problem in the context of implementing this method in the Western Power system as system impedances are most likely not accurately known. Methods to measure and calculate impedances are usually complicated, expensive, or involve a process that may cause disturbance to the customer (Mazin, 2012). State estimation was first proposed by Heydt (1989) in the context of harmonic source identification using a least squares based technique. More recently, approaches extending harmonic state estimation have been proposed utilising neural-networks and fuzzy logic (Mazin, 2012). State estimation based techniques are promising in their practicality, however, measurements of current and voltage need to be synchronised to very high accuracy (Mazin, 2012), and the bus admittance matrix must be determined using system data. Correlation data-based methods (or intelligent methods) use correlation of the measured parameters to quantity harmonic contributions of a load. Dan and Czira (1998) have illustrated using the linear correlation characteristics between harmonic current and voltage of a load as an indicator of harmonic source. This is done without any presumed knowledge about the system (for example, impedances, as discussed in other methods). The impact of harmonic current and voltage of a load at one bus on the distortions of other buses has been illustrated by Mazin (2012) where synchronised harmonic measurements were taken at 3 test sites (for example, A, B and C). For example, for the 5th harmonic, it was found that the harmonic voltage at Site A is strongly impacted by its harmonic current and that the current of Site A strongly impacted the voltage distortions at Site B and C. Through simulation and verification, it was shown that applying a Partial Least Squares (PLS) regression had strong performance in estimating harmonic impact (Mazin, 2012). Many of these methodologies have been verified through IEEE bus simulation systems and it has been a commonly emphasised concern by many that the proposed methods require further testing in the field. This study will field-test the chosen methodology.

CEED Seminar Proceedings 2015 Khaksar: Harmonic Source Identification
99
2. Process 2.1 Methdology Decision Framework The methodologies studied were analysed and compared in the context of their required assumptions, parameters, inputs and performance in practical applications. This framework was used to decide which methodology would be the most promising for further investigation. In order to classify the methodologies, one distinguishing characteristic is whether a method is model-based or data-based. Model-based methods require accurate knowledge of the utility and customer impedances and it has been shown that obtaining this information is difficult or impractical, especially on the customer side. On the other hand, data-based methods evaluate harmonic impact through correlation and cause-and-effect relationships directly from measured data. For example, the PLS regression method only requires magnitudes of harmonic current and voltage measurements, for which data is already being collected by Western Power regularly. Hence, data-based approaches ranked highest in the decision matrix. 2.2 Partial Least Squares Regression and Harmonic Impact Partial least squares regression uses a latent variable approach to model the covariance in two matrices, X and Y, and find the maximum multidimensional change in X that will explain the change in Y. It differs from ordinary least squares regression in that it accounts for high colinearity between the independent variables and performs strongly when there are many independent variables, situations in which ordinary least squares regressions fail. The PLS algorithm achieves this by indirectly extracting latent variables (underlying factors that have the best predictive power) from both the independent and dependant variables and using them to build a model able to predict Y scores. Finally, the model shown in (1) is built where Bpls is a vector of regression coefficients relating X and Y. A detailed explanation and algorithm of how this model is derived has been presented by Abdi and Williams (2013). 𝒀 = 𝑿𝐵!"# (1)
However, for harmonic source identification, the model is not used for predicting values. Instead, the Bpls regression coefficients are used as an indicator of how strongly each column in X has an influence in Y. In the harmonic source context, each column in X will be harmonic current measurements at a particular load bus and Y will be a column vector of harmonic voltage measurements at a particular target site. A Harmonic Impact index (2) has been developed by Mazin (2012) to give an estimate of the impact of a test load on a target bus. 𝑯𝑰𝒍𝒐𝒂𝒅 𝑨𝑩𝒖𝒔 𝑿 𝑡! = 𝑩𝑷𝑳𝑺 !
𝒏!!! !!!!! !!
𝒏𝒊!𝟏 ×100 (2)
2.3 Software Tool Implementation A software tool has been developed, written in the Python programming language, implementing Harmonic Source Identification through partial least squares regression (HSI PLS tool) using the algorithm outlined above. The tool extracts and preprocesses the data relevant for analysis into the X (current measurements of test nodes) and Y (voltage measurements of target node) matrices required, performs the PLS regression and calculates the Harmonic Impact.
CEED Seminar Proceedings 2015 Khaksar: Harmonic Source Identification
100
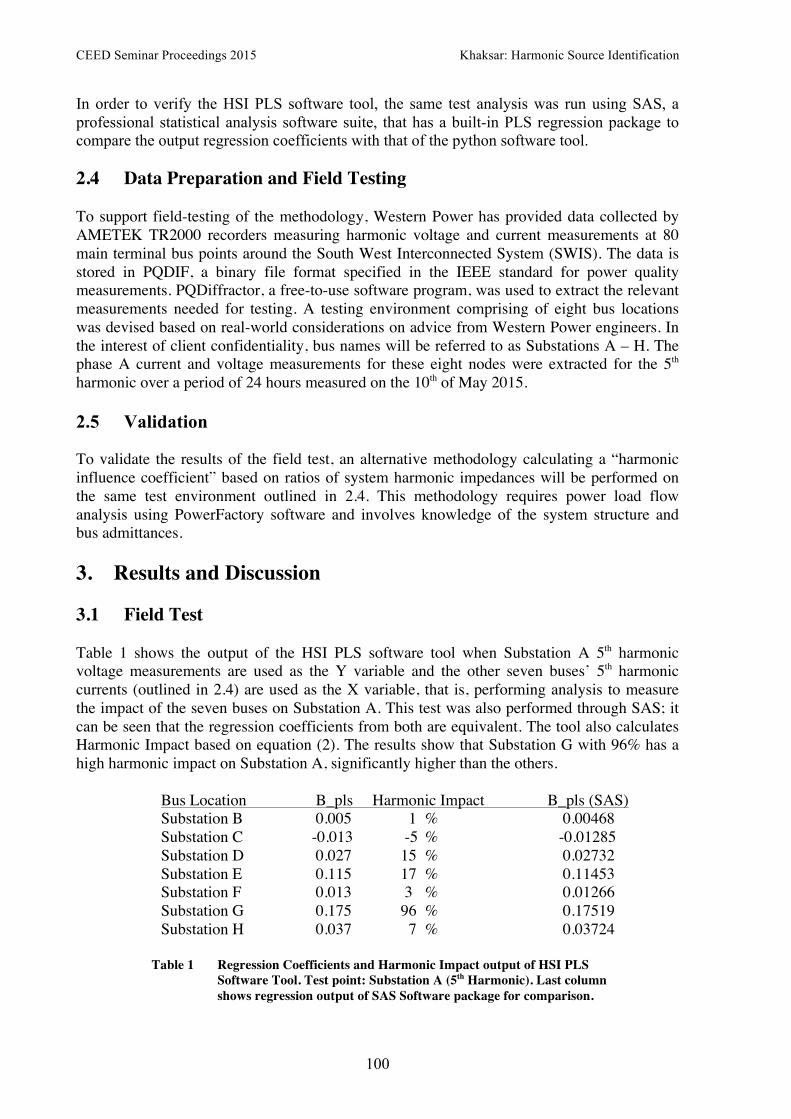
In order to verify the HSI PLS software tool, the same test analysis was run using SAS, a professional statistical analysis software suite, that has a built-in PLS regression package to compare the output regression coefficients with that of the python software tool. 2.4 Data Preparation and Field Testing To support field-testing of the methodology, Western Power has provided data collected by AMETEK TR2000 recorders measuring harmonic voltage and current measurements at 80 main terminal bus points around the South West Interconnected System (SWIS). The data is stored in PQDIF, a binary file format specified in the IEEE standard for power quality measurements. PQDiffractor, a free-to-use software program, was used to extract the relevant measurements needed for testing. A testing environment comprising of eight bus locations was devised based on real-world considerations on advice from Western Power engineers. In the interest of client confidentiality, bus names will be referred to as Substations A – H. The phase A current and voltage measurements for these eight nodes were extracted for the 5th harmonic over a period of 24 hours measured on the 10th of May 2015. 2.5 Validation To validate the results of the field test, an alternative methodology calculating a “harmonic influence coefficient” based on ratios of system harmonic impedances will be performed on the same test environment outlined in 2.4. This methodology requires power load flow analysis using PowerFactory software and involves knowledge of the system structure and bus admittances. 3. Results and Discussion 3.1 Field Test Table 1 shows the output of the HSI PLS software tool when Substation A 5th harmonic voltage measurements are used as the Y variable and the other seven buses’ 5th harmonic currents (outlined in 2.4) are used as the X variable, that is, performing analysis to measure the impact of the seven buses on Substation A. This test was also performed through SAS; it can be seen that the regression coefficients from both are equivalent. The tool also calculates Harmonic Impact based on equation (2). The results show that Substation G with 96% has a high harmonic impact on Substation A, significantly higher than the others.
Bus Location B_pls Harmonic Impact B_pls (SAS) Substation B 0.005 1 % 0.00468 Substation C -0.013 -5 % -0.01285 Substation D 0.027 15 % 0.02732 Substation E 0.115 17 % 0.11453 Substation F 0.013 3 % 0.01266 Substation G 0.175 96 % 0.17519 Substation H 0.037 7 % 0.03724
Table 1 Regression Coefficients and Harmonic Impact output of HSI PLS
Software Tool. Test point: Substation A (5th Harmonic). Last column shows regression output of SAS Software package for comparison.

CEED Seminar Proceedings 2015 Khaksar: Harmonic Source Identification
101
The algorithm was then re-applied for each of the eight buses selected as the target node. Table 2 is a collation of the results shown as a map of Harmonic Impact of the row on the column.
Bus B C A D E F G H Substation B -‐ 1 1 4 2 2 4 3 Substation C 2 -‐ 5 17 13 -‐8 1 7 Substation A 9 2 -‐ 2 3 -‐5 17 2 Substation D 9 16 15 -‐ 8 14 21 21 Substation E 18 16 17 25 -‐ 19 29 20 Substation F 2 3 3 4 4 -‐ 4 4 Substation G 110 90 96 115 128 102 -‐ 106 Substation H 11 8 7 18 7 8 14 -‐
Table 2 Map of Harmonic Impacts of eight test buses on each-other.
Read as Harmonic Impact (%) of row-on-column (5th Harmonic). From this analysis, it can be observed that Substation G (row highlighted) has a significant impact on all the other buses with a Harmonic Impact much greater than the other nodes. This suggests that harmonic injection at Substation G has a significant impact on the harmonic voltage distortion on the other nodes monitored on the transmission network. These results could be further appiled to narrow down the regions for further investigation (for example, determining which customers are generating harmonics and/or what prevention measures can be taken).
(a) (b)
Figure 1 (a) Network graph visualising results in Table 3. (b) Radar map showing impact on Substation G
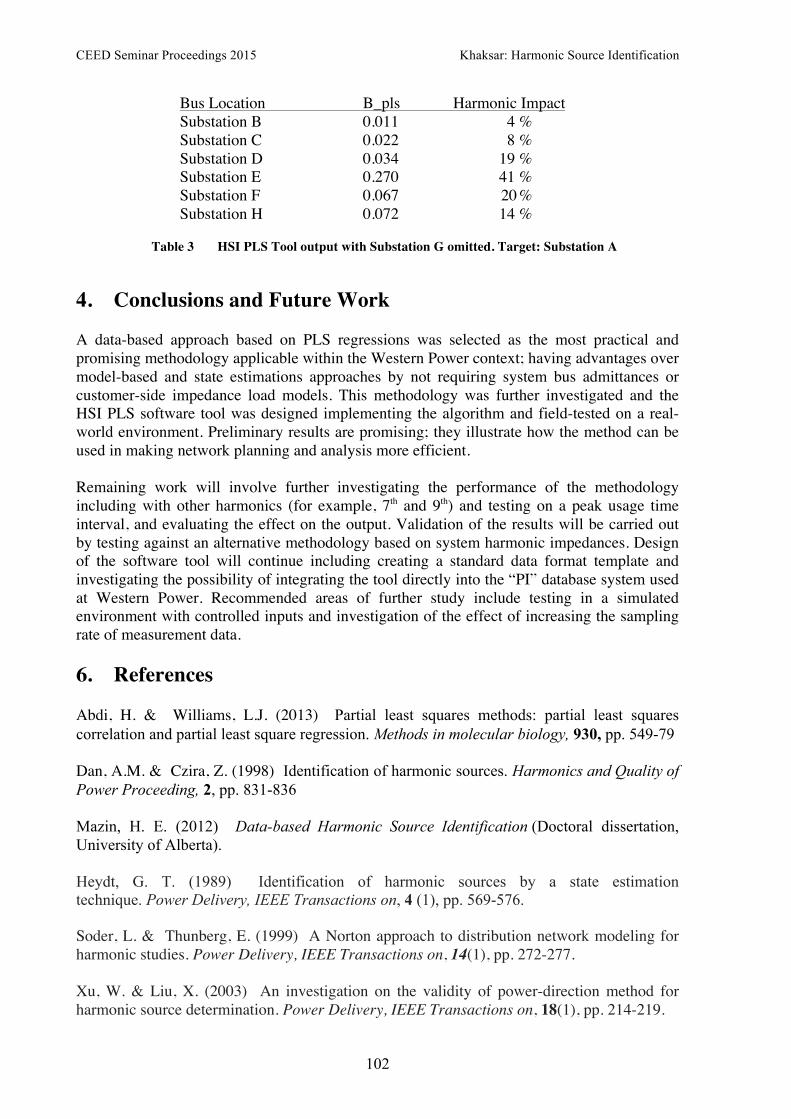
3.2 Discussion While the model is deterministic, the results should not be taken as a hard measure of Harmonic Impact but as a relative measure based on the input conditions (the test bus nodes selected). Table 3 shows the output of the model if Substation G is omitted from the analysis performed in Table 1. It can be observed, for example, that the HI for Substation E has risen significantly. This may not reduce from the applicability of the methodology, given the input nodes are carefully selected by the engineers and that results are not over-interpreted.
CEED Seminar Proceedings 2015 Khaksar: Harmonic Source Identification
102
Bus Location B_pls Harmonic Impact Substation B 0.011 4 % Substation C 0.022 8 % Substation D 0.034 19 % Substation E 0.270 41 % Substation F 0.067 20 % Substation H 0.072 14 %
Table 3 HSI PLS Tool output with Substation G omitted. Target: Substation A
4. Conclusions and Future Work A data-based approach based on PLS regressions was selected as the most practical and promising methodology applicable within the Western Power context; having advantages over model-based and state estimations approaches by not requiring system bus admittances or customer-side impedance load models. This methodology was further investigated and the HSI PLS software tool was designed implementing the algorithm and field-tested on a real-world environment. Preliminary results are promising; they illustrate how the method can be used in making network planning and analysis more efficient. Remaining work will involve further investigating the performance of the methodology including with other harmonics (for example, 7th and 9th) and testing on a peak usage time interval, and evaluating the effect on the output. Validation of the results will be carried out by testing against an alternative methodology based on system harmonic impedances. Design of the software tool will continue including creating a standard data format template and investigating the possibility of integrating the tool directly into the “PI” database system used at Western Power. Recommended areas of further study include testing in a simulated environment with controlled inputs and investigation of the effect of increasing the sampling rate of measurement data. 6. References Abdi, H. & Williams, L.J. (2013) Partial least squares methods: partial least squares correlation and partial least square regression. Methods in molecular biology, 930, pp. 549-79 Dan, A.M. & Czira, Z. (1998) Identification of harmonic sources. Harmonics and Quality of Power Proceeding, 2, pp. 831-836 Mazin, H. E. (2012) Data-based Harmonic Source Identification (Doctoral dissertation, University of Alberta). Heydt, G. T. (1989) Identification of harmonic sources by a state estimation technique. Power Delivery, IEEE Transactions on, 4 (1), pp. 569-576. Soder, L. & Thunberg, E. (1999) A Norton approach to distribution network modeling for harmonic studies. Power Delivery, IEEE Transactions on, 14(1), pp. 272-277. Xu, W. & Liu, X. (2003) An investigation on the validity of power-direction method for harmonic source determination. Power Delivery, IEEE Transactions on, 18(1), pp. 214-219.