harbor seal diet in hood canal, south puget sound and...
TRANSCRIPT

STATE OF WASHINGTON January 2009
Harbor seal diet in Hood Canal, South Puget Sound and the San Juan Island archipelago
Washington Department of Fish and WildlifeWildlife ProgramScience Division
Monique M. Lance and Steven J. Jeffries

Suggested Citation: Lance, M.M., and S.J. Jeffries. 2009. Harbor seal diet in Hood Canal, South Puget Sound and the San Juan Island archipelago. Contract Report to Pacific States Marine Fisheries Commission for Job Code 497; NOAA Award No. NA05NMF4391151. Washington Department of Fish and Wildlife, Olympia WA. 30 pp. Cover photos: Josh London, NOAA (center), Alaska Fisheries Science Center, Resource Assessment and Conservation Engineering (insets)

Harbor seal diet in Hood Canal, South Puget Sound and the San Juan Island Archipelago Final Report Studies of Expanding Pinniped Populations Pacific States Marine Fisheries Commission 26 January 2009 Monique M. Lance and Steven J. Jeffries Washington Department of Fish and Wildlife Wildlife Science Program 7801 Phillips Road SW Lakewood, Washington 98498 Period: 1 July 2008 through 31 December 2008 PSMFC Job Code 497 NOAA Award No. NA05NMF4391151

i
i
Acknowledgements The National Marine Fisheries Service (NMFS) through the Pacific States Marine Fisheries Commission (PSMFC) funded the Hood Canal portion of this project. Additional funding and support for this project were provided by the Washington Department of Fish and Wildlife. We thank key field and laboratory personnel: Josh London, Dyanna Lambourn, Bryan Murphie, Tom Cyra, Joe Evenson, Jeff Gould, Belen Roca, Kelly Brock, Tammy Schmidt, Marissa Stratton, Aaron Galloway, Shannon Murphie, and Amelia Brower. Access to collection sites and logistic support was provided by: Gary Phillips at Quilcene Bay; Steve Middleton and Doug Hinton at Dosewallips State Park; and WDFW Region 6 for the Duckabush River access area. Dr. Glenn VanBlaricom and the WACFWRU provided support for field and laboratory analysis. WDFW state marine mammal funding and NMFS through PSMFC funded the south Puget Sound portion of this project. We thank Harriet Huber (NOAA, National Marine Mammal Laboratory) for support of Gertrude Island harbor seal research efforts, Dyanna Lambourn for sample collection and Aaron Galloway and Amelia Brower for sample processing. The SeaDoc Society Research Agreement K004431-25 and NMFS through PSMFC funded the San Juan Island portion of this project. We thank key field and laboratory personnel: Jeff Gould for assisting with boat operations and field collection of samples; Amelia Brower, Aaron Galloway, Katie Luxa and Melissa Erkel for assistance with field collection and sample processing; Kevin Ryan and Ulrich Wilson (USFWS) permitted access to intertidal areas at sites within the San Juan Islands Wildlife Refuge; and Phil Green (The Nature Conservancy) permitted access to intertidal areas of Goose Island for sample collection. We thank Susan Riemer (ODFW) and William Walker (NOAA, National Marine Mammal Laboratory) for assistance with prey identification on difficult samples; Scott Pearson (WDFW) for reviewing this report and providing valuable input; and Harriet Huber and Jim Thomason (NOAA, National Marine Mammal Laboratory) for use of the National Marine Mammal Laboratory food habits lab for scat sample processing. Thank you Wayne Palsson (WDFW) for providing recent trawl data; Dan Penttila (WDFW) for providing forage fish information; Kyle Adicks (WDFW) for providing regional salmon abundance data; and Jeff Foisy (WDFW) for creating Figs 1-4. Harbor seal research activities were conducted under MMPA Research Permit 782-1702-00.

ii
ii
Abstract Harbor seals are the most abundant resident pinniped species in Puget Sound. They forage high on the food chain, are a relatively long-lived species, and have been used as sentinels of marine ecosystem health. Harbor seals are primarily piscivorous and consume seasonally and locally abundant prey, which allows us to investigate changes in their prey base, both on a temporal and spatial basis by examining diet. We use percent frequency of occurrence of prey species in fecal samples (scats) collected from river mouths in Hood Canal, sandy haulouts in South Puget Sound and rocky island and reef haul outs in the San Juan Islands to describe diet seasonally and regionally and to examine potential changes in diet over time. In Hood Canal during fall (1998-2001 and 2003-2005), harbor seals fed mainly on Pacific hake (occurring in 79% of samples), Pacific herring (30%) and adult salmonids (26%). Diet shifted during spring (1999 and 2005) with Pacific hake (85%) and Pacific herring (26%) remaining important, but Northern anchovy (35%) increasing significantly and adult salmonids (8%) decreasing significantly. South Puget Sound diet was dominated by gadids (99%), both Pacific tomcod and Pacific hake. Clupeid species (69%) also composed a large proportion of the diet, but unlike the other regions, plainfin midshipman (47%) and flat fish (33%) were primarily primary prey for harbor seals. Minor seasonal fluctuations in occurrence were observed for cephalopods, shiner surfperch, juvenile salmonids and rockfish. Prey assemblages in south Puget Sound seal diet are likely due to differences in habitat and the predominance of relatively shallow and calm inlets and bays. In the San Juan Islands, Pacific herring was the most important prey species overall (57%). Gadid species (winter and spring), adult salmon (summer/fall), Pacific sand lance (winter and spring), and Northern anchovy (winter) were important more seasonally. The San Juan Islands are influenced by the Strait of Juan de Fuca and Strait of Georgia and seal diet reflects this dynamic region. In comparing these three very different regions, clupeids (primarily herring) were a significant component of seal diet in each region. Adult salmonids are important seasonally in Hood Canal and the San Juan Islands and a gadid species and Pacific herring dominate the diet year round. As adult salmon migrate into the region and become abundant, harbor seals forage primarily on salmon (range 25–67% frequency of occurrence). For gadids, seals preyed primarily on Pacific hake in Hood Canal, Pacific tomcod and Pacific hake in south Puget Sound, and walleye pollock in North Puget Sound/San Juan Islands. Northern anchovy were important in Hood Canal and the San Juan Islands during winter, but not in South Puget Sound. High proportions of midshipman and flat fish in seal diet were unique to South Puget Sound. Many of the other important prey species were similar among regions including shiner surfperch, cephalopods, sand lance and sculpins. These data correlate well with species composition in each region and suggest that harbor seal diet provides a good indicator of fish availability and can be used to detect localized changes in prey availability.

i
i
Table of Contents
Acknowledgements ........................................................................................................................ i
Abstract.......................................................................................................................................... ii
Introduction................................................................................................................................... 1
Methods.......................................................................................................................................... 2
Results ............................................................................................................................................ 3
Discussion....................................................................................................................................... 6
Literature Cited .......................................................................................................................... 10
ii
ii
List of Figures
Figure 1. Study area showing Hood Canal, south Puget Sound and San Juan Islands, Washington.................................................................................................................................. 14
Figure 2. Map of Puget Sound and Hood Canal showing sample collection locations......... 15
Figure 3. Map of south Puget Sound showing sample collection locations............................ 16
Figure 4. Map of the San Juan Islands showing sample collection locations ........................ 17
Figure 5. Overall weighted average of primary (>10%) prey species in the diet of harbor seals for all seasons and years combined in Hood Canal, south Puget Sound and the San Juan Islands................................................................................................................................. 18
iii
iii
List of Tables
Table 1. Number of harbor seals scats collected (“C”) and with remains (“R”) by haul out site during fall (July – early December) 1998, 1999, 2000, 2001, 2003, 2004 and 2005 by year in Hood Canal, Washington. ............................................................................................. 19
Table 2. Number of harbor seals scats collected (“C”) and with remains (“R”) by haul out site during spring (March-June) 1999 and 2005 in Hood Canal, Washington. .................... 19
Table 3. Number of harbor seals scats collected (“C”) and with remains (“R”) by haul out site by season in 1995, 1997, 2004 in south Puget Sound, Washington. ................................. 20
Table 4. Number of harbor seal scats collected by season and region in the San Juan Islands 2005-2007. Collection location details found in Lance and Jeffries 2007. ............... 20
Table 5. Percent frequency of occurrence (FO) of prey species identified using all structures (bone and otoliths) in harbor seal scats during fall (July – early December) of 1998, 1999, 2000, 2001, 2003 and 2004 by year in Hood Canal, Washington........................ 21
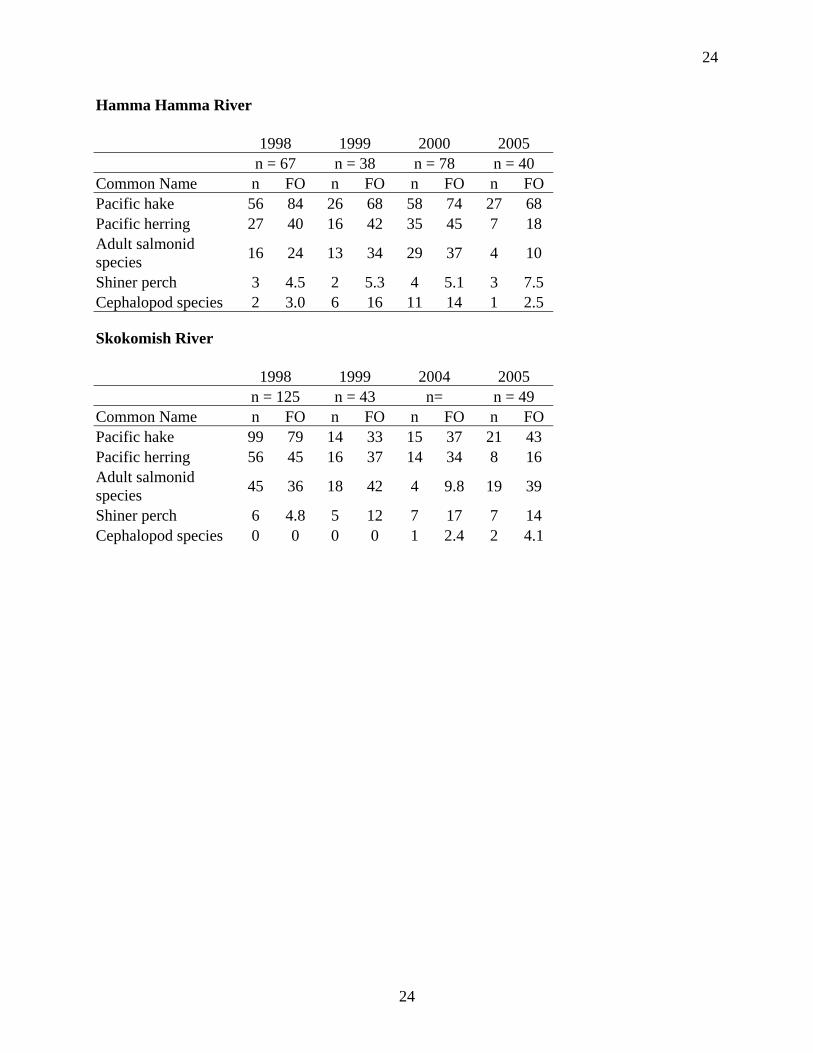
Table 6. An annual comparison of the percent frequency of occurrence (FO) of primary prey species identified using all structures (bone and otoliths) in harbor seal scats by river system in Hood Canal, Washington during fall (late July – early December) of 1998, 1999, 2000, 2001, 2003 and 2004. ......................................................................................................... 23
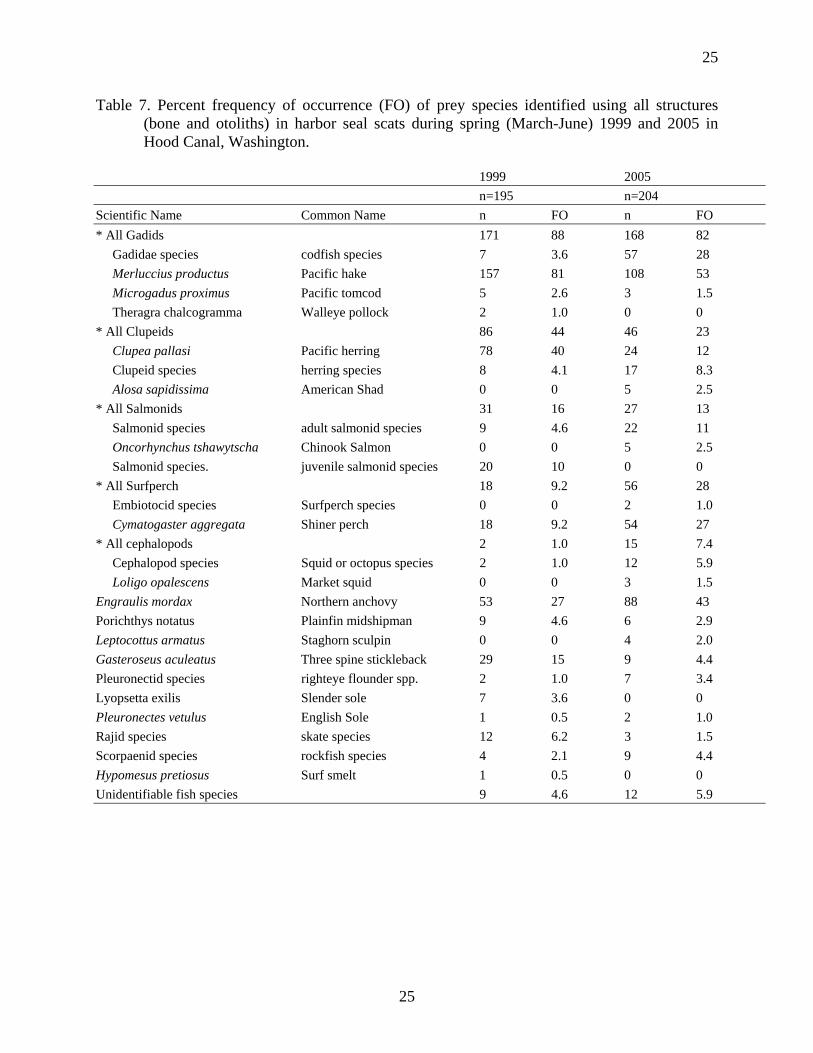
Table 7. Percent frequency of occurrence (FO) of prey species identified using all structures (bone and otoliths) in harbor seal scats during spring (March-June) 1999 and 2005 in Hood Canal, Washington. ............................................................................................. 25
Table 8. Percent frequency of occurrence (FO) of prey species identified using all structures (bone and otoliths) in harbor seal scats during fall 1995, spring 1997, summer 1997, winter 1997 and fall 2004 in south Puget Sound, Washington. .................................... 26
Table 9. Frequency of occurrence (FO; expressed as percent) and overall weighted average of prey species in the diet of harbor seals by season in the San Juan Islands, 2005-06........ 28
Table 10. Frequency of occurrence (FO; expressed as percent) and overall weighted average of prey species in the diet of harbor seals by season in the San Juan Islands, 2006-07................................................................................................................................................... 30

1
1
Introduction Increases in pinniped populations have coincided with dramatic decreases in many marine and anadromous fish populations (WDF et al. 1993, Bargmann 1998, Jeffries et al. 2003). Gadids (cod species) and forage fish in general, and herring specifically, are vital components of the marine food web and are an important indicator of the overall health of the marine environment. Pacific herring form the base of the Puget Sound marine food web, supporting higher trophic fish, seabirds, and marine mammals (Calambokidis et al.1978, Calambokidis et al.1989, Olesiuk et al. 1990, Suryan and Harvey 1998, Lance and Thompson 2005, Stick 2005, Lance and Jeffries 2006, Lance and Jeffries 2007). The role of seal and sea lion predation in structuring marine ecosystems and affecting recovery of depressed fish stocks is a critical management issue (NMFS 1997). The collapse of fisheries throughout the Pacific Northwest has fueled the need to move away from a single-species management approach and beyond conventional methods of marine coastal management (Bargmann 1998). Healthy and sustaining populations of native species in Puget Sound, including a robust food web is one of the Puget Sound Partnership’s ecosystem recovery goals (Puget Sound Partnership 2008) The harbor seal is the most abundant resident pinniped species in the inland waters of Washington. In Hood Canal they use five primary haulouts located at the major river mouths as well as on oyster rafts in Quilcene Bay and number over 1,000 animals (Jeffries et al. 2003). In south Puget Sound they use five primary haulouts located on reefs, islands, private floats, and log booms, and number approximately 1,200 animals (Jeffries et al. 2003). In the San Juan Islands they use over 150 intertidal haulout locations and number nearly 4,000 animals (Jeffries et al. 2003). There are an additional 1,000 animals in the adjacent Gulf Islands in British Columbia to the west and 2,000 animals in the Eastern bays (Samish, Skagit, Padilla and Bellingham Bays) to the east (Jeffries et al. 2003). Harbor seals in the San Juan Islands, Hood Canal and Strait of Georgia forage within approximately 10 kilometers of a haulout site with most individuals foraging in the same specific area and returning to the same haul out site (Suryan and Harvey 1998, Olesiuk 1999, WDFW unpub. data). Because harbor seals forage in close proximity to haulout sites and eat locally abundant fish species, research on their diet can be used to examine temporal and spatial variability in their prey base, how the prey base varies over time and space, and their role in shaping the complex marine ecosystem. In Washington, harbor seal diet data is generally composed of small schooling forage (primarily herring) and various groundfish species. The status of Puget Sound herring stocks varies by region. South and central Puget Sound herring stocks have maintained a healthy population status since first evaluated in 1994, however north Puget Sound region herring stocks have moved progressively to depressed in recent years in large part due to the decrease in spawning biomass for the Cherry Point stock. The Strait of Juan de Fuca region stock status has been consistently classified as critical since 1994, primarily due to the condition of the Discovery Bay stock, which has remained at a very low level of abundance (Stick 2005). For groundfish, the Georgia Basin Pacific hake stock at one time comprised the largest fishery in central and north Puget Sound, but spawning biomass has declined 85% over the past 15 years and the fishery is now closed (Gustafson et al. 2000). Central Puget Sound Pacific hake are candidates for listing by Washington State (Brown and Gaydos 2005). Populations of Pacific cod in North Puget Sound are “depressed” with south and central Puget Sound populations of this fish listed as
2
2
candidates species for listing by Washington State (Brown and Gaydos 2005). Simultaneously, pinniped populations have increased seven to ten-fold in Washington with passage of the Marine Mammal Protection Act in 1972 (Jeffries et al. 2003). Harbor seals are unquestionably affected by the dramatic shifts that have occurred in their prey base. Understanding the importance of these prey species in the diet of harbor seals is needed to help develop ecosystem-based recovery and management strategies for Puget Sound, Hood Canal and the Strait of Georgia. Harbor seals are known to consume a wide range of prey sizes including adult salmonids returning to rivers to spawn, out-migrating salmon smolts, gadids, flatfishes, and small schooling forage fishes (Calambokidis et al.1978, Calambokidis et al.1989, Olesiuk et al. 1990, Riemer et al. 1999, London et al. 2001, Browne et al. 2002, Orr et al. 2004, Lance and Jeffries 2006, Lance and Jeffries 2007). Seasonal abundance of prey species undoubtedly plays a key role in the foraging ecology and diet of harbor seals. Determining harbor seal diet in Puget Sound, both spatially and temporally, has important implications for fisheries biologists in understanding whether harbor seal populations are consuming young of the year fishes that would be recruited into the population (e.g. Pacific herring), or larger fish with greater reproductive output (e.g. adult salmon) and consequently has significant population effects on the prey base. Harbor seal diet comparisons are also useful in addressing the question of multispecies and community effects by examining changes in fish size and composition over time. In this study, we present harbor seal diet data from three distinct regions in Puget Sound: Hood Canal, south Puget Sound and San Juan Island archipelago. This report collates these data to allow for comparison among years, between seasons and among regions. Different project goals and study designs were employed in each region. Hood Canal diet data were collected as part of the west coast pinniped predation study focused on threatened and endangered salmon consumption by pinnipeds (London et al. 2001). South Puget Sound diet data were collected opportunistically during captures and observations at WDFW long term monitoring locations at Gertrude Island and Eagle Island (Lambourn et al. 2008). San Juan Island diet data were collected to examine the dependence of harbor seals on forage fish and rockfish communities, to strive to understand how they integrate into and impact the marine food web and to investigate the role of harbor seals in Marine Protected Areas designed to recover fish stocks (Lance and Jeffries 2006, Lance and Jeffries 2007). We obtained a large sample size of fecal samples (scats) and used these to examine all prey species in harbor seal diet. Our study assumes that harbor seal diet composition reflects the composition and abundance of local prey species. We believe this assumption is reasonable because, harbor seals have been shown to eat what is seasonally and locally abundant (Olesiuk et al. 1990, London et al. 2001, Browne et al. 2002, Orr et al. 2004, Lance and Jeffries 2006, Lance and Jeffries 2007), they use haul out sites within 10 km of foraging areas and return to those haul out sites at regular intervals and deposit scat (Suryan and Harvey 1998, Olesiuk 1999, WDFW unpub. data) and hard parts (bones, otoliths, squid beaks) found in scats are representative of species being consumed by seals (Harvey 1989, Cottrell et al.1996, Bowen 2000, Orr and Harvey 2001) Methods Sample collection. In Hood Canal, scat collections were attempted at roughly 10-14 day intervals during fall and spring. Fall collections were made from mid July to early December at

3
3
harbor seal haulout areas near Quilcene Bay (1998-2001, 2003, 2005), Dosewallips River (1998-2001 and 2003-2005), Duckabush River (1998-2001, 2003, 2005), Hamma Hamma River (1998-2000 and 2005) and the Skokomish River in 1998-1999 and 2004- 2005) (Table 1, Figure 2). Spring collections were made from March to June at harbor seal haulout areas near Quilcene Bay, Dosewallips River and Skokomish River (1999 and 2005) and Duckabush River and Hamma Hamma River (2005) (Table 2, Figure 2). In south Puget Sound, scats were collected opportunistically during captures and observations at Gertrude Island during fall 1995, spring 1997, summer 1997, winter 1997 and fall 2004 and at Eagle Island during spring 1997, summer 1997 and winter 1997 (Table 3, Figure 3). In the San Juan Islands, scats were collected seasonally over three “collection windows” delineated as: 1 March-30 April (‘spring’), 1 August–30 September (‘summer/fall’) and 1 December–30 January (‘winter’) 2005-2007 (Table 4, Figure 4). Scats were collected on rocky haulout locations during daytime low tide windows from six regions in the San Juan Islands designated as: ‘South Strait of Georgia’, ‘North Rosario Strait’, ‘Eastern Bays’, ‘South Rosario Strait’, ‘South San Juan Channel’, and ‘North San Juan Channel’ (Figure 4). Two to three collection trips were made each season and 100 scats was the target sample size for each region (Trites and Joy 2005). Effort was adjusted to allow for meaningful statistical analyses. Haulout locations on rocks or islands with important seabird colonies precluded collections during critical seabird nesting and breeding periods at some sites from 15 April – 31 August. Samples were collected in either plastic ‘Whirlpak’ bags or in fine mesh paint strainer bags and frozen until processing. Sample processing. Samples were cleaned using a washing machine (Orr et al. 2003) or using nest sieves if samples contained rocks that would damage prey remains in the washing machine (Lance et al. 2001). Prey were identified to the lowest possible taxon using a dissecting microscope, reference fish bone collections from Washington and Oregon, and published bone, otolith and cephalopod beak keys (Kashiwada et al. 1979, Morrow 1979, Wolff 1982, Clarke 1986, Cannon 1987, Harvey et al. 2000, Lance et al. 2001). Data were entered into an Access database. Data analyses. Diet data are presented as percent frequency of occurrence. To account for differences in samples sizes among seasons, we present an unweighted average that was calculated by taking the mean percent frequency of occurrence of the three seasons for each species. Samples did not contain bones identified to both the species level (e.g. walleye pollock) and family level (gadid species) unless they were different size (age) classes (e.g. large walleye pollock bones and otoliths and few small gadid species bones). Scientific fish names are from Hart 1973. Results Hood Canal. In Hood Canal, a total of 2,578 scats were collected during fall (Fig 3, Table 1) and 314 scats were collected during spring (Fig 3, Table 2). Data analyses were based on 98% and 99% of harbor seal scats that contained identifiable prey during fall and spring, respectively. Marine and

4
4
anadromous fishes were found in all samples analyzed and cephalopods occurred in 7-12% of samples. Overall, harbor seals in Hood Canal fed primarily on Pacific hake (63% occurrence, hereafter hake), clupeids (primarily Pacific herring, 49%, hereafter herring), and adult salmonid species (26%) during fall (Table 2). Frequency of occurrence of hake, herring and adult salmonids fluctuated slightly from year to year, however; their importance in the diet remained relatively constant. The adult “salmonid species” category may include any species of salmonid, hatchery or wild, that might be in the San Juan Islands during the study period, but which cannot be assigned to species from scats because the bones recovered are not species specific. Two other important species that occurred in greater than five percent of samples were, shiner surfperch (9%) and cephalopods (octopus and squids) (6%). Overall, fall diet was reasonably consistent among river systems with hake, herring and salmon dominating each year and shiner surfperch and cephalopods present in smaller proportions (Table 3). One small difference was the presence of threespine stickleback in Quilcene Bay, particularly during fall 2000. During spring 1999 and 2005, hake remained the most common prey species consumed, however; herring decreased in importance and shiner surfperch and northern anchovy increased (Table 7). South Puget Sound. In south Puget Sound, a total of 314 scats were collected during fall (Figure 3, Table 3). Data analyses were based on 98% of harbor seal scats that contained identifiable prey. Marine and anadromous fishes were found in all samples analyzed and cephalopods occurred in 19% of samples. Overall, almost all samples (99%) collected at Gertrude Island and Eagle Island in south Puget Sound contained gadids (primarily Pacific tomcod and Pacific hake, 43% and 34% respectively) (Table 8). Three other primary prey species included clupeid species (69%), plainfin midshipman (47%), and flat fish (33%) that were primarily starry flounder and English sole. The “clupeid species” category could include any species of clupeid including Pacific herring, American shad, and Pacific sardine, but which cannot be assigned to species because the bones recovered are not species specific (e.g. vertebrae). Similarly, the “gadid species” category could include those species of gadid found in Puget Sound including Walleye pollock, Pacific tomcod, Pacific hake and Pacific cod, but which cannot be assigned species because bones recovered were not species specific. Other important species that occurred in greater than five percent of samples were, in decreasing order of importance, cephalopods (19%), shiner surfperch (14%), juvenile salmonids (13%), and rockfish species (9%) (Table 8). There were not large seasonal differences in diet observed. Gadids, clupeids, midshipman, and flatfish were relatively consistent in the diet year round. The following minor fluctuations in occurrence were observed: cephalopods were most common during fall and spring; shiner surfperch were most common during spring; juvenile salmonids were more common during spring and summer; and rockfish were most common during summer (Table 8). San Juan Islands. During three collection periods (‘spring’, ‘summer/fall’ and ‘winter’), a total of 899 scats were collected from sites distributed throughout the San Juan Islands during both years (Figure 4, Tables 9 and 10). Data analyses were based on 99% (507 of 509 collected) and 98% (392 of 398

5
5
collected) of harbor seal scats that contained identifiable prey during 2005-2006 and 2006-2007, respectively. Marine and anadromous fishes were found in all samples analyzed and cephalopods occurred in 7-11% of samples. Overall, in 2005-2006 harbor seals fed primarily on Pacific herring (57% occurrence), adult Salmonid species (26%), Gadid species (24%), and Pacific sand lance (20%) in the San Juan Islands (Table 9). Other important species that occurred in greater than five percent of samples were, in decreasing order of importance, Northern anchovy, Walleye pollock, Spiny dogfish, sculpin species, flatfish species, cephalopods and skate species (Table 9). Seasonal changes in diet composition were observed during 2005-2006 in the San Juan Islands. Clupeid species, primarily Pacific herring, were important prey for San Juan Islands harbor seals year round. Gadid species were important prey species in the San Juan Islands primarily during winter and spring. Walleye pollock occurred in over 40% of harbor seal samples collected during spring and was also present in samples collected during both summer/fall and winter collection periods (Table 9). Summer/fall diet was dominated by returning adult salmonid species. Clupeids were found in over 65% of samples collected during the winter, but harbor seal diet also became more varied with Northern anchovy, Gadid species, Pacific sand lance, Spiny dogfish, skates, cottid species, flatfish species, snailfish species and cephalopods all found in greater than 13% of samples collected (Table 9). Overall, in 2006-2007 harbor seals fed primarily on Pacific herring (57% occurrence), adult salmonid species (19%), and walleye pollock (15%) in the San Juan Islands (Table 10). Other important species that occurred in greater than five percent of samples were, in decreasing order of importance, rockfish species (12%), threespine stickleback (12%), cephalopods (octopus and squids) (11%), shiner perch (11%), Pacific sand lance (10%), gadid species (9%), clupeid species (9%), Northern anchovy (8%), skate species (6%), sculpin species (6%), and eelpout species (5%) (Table 1). Seasonal changes in diet composition were observed during 2006-2007 in the San Juan Islands. Clupeid species, primarily Pacific herring, were important prey for San Juan Islands harbor seals year round, but primarily during spring (91%) and winter (71%). Adult salmonid species were the dominant prey species during the summer/fall collection period. Gadid species were important prey species in the San Juan Islands primarily during winter. Walleye pollock was the most important of the gadid species present in their diet and occurred in 21% and 16% of harbor seal samples collected during winter and summer/fall and was also present in samples collected during the spring collection period (Table 10). Northern anchovy was an important prey species in seal diet almost exclusively during spring (Table 10). Diet became more varied during the winter, with clupeids still dominant (71% of samples collected), but gadids (specifically walleye pollock), sculpins, shiner perch, rockfish and cephalopods (squid and octopus) were found in greater than 15% of samples collected (Table 10). Regional comparison. In all three regions, clupeids (primarily herring) were important in harbor seal diet year round (Figure 5, Tables 5-10). In each region, gadids dominated the diet however the gadid species largely differed by region. In general, Hood Canal seals ate hake during fall and spring, in South

6
6
Puget Sound seals ate tomcod and also hake and in the San Juan Islands harbor seals ate walleye pollock. Adult salmon were important seasonally in Hood Canal and the San Juan Islands during summer/fall, but not in south Puget Sound. Similarly, northern anchovy were important seasonally in Hood Canal and the San Juan Islands during winter, but not in south Puget Sound. High proportions of midshipman and flat fish (primarily starry founder and english sole) in seal diet were unique to south Puget Sound. Many of the other important prey species were similar among regions including shiner surfperch, cephalopods, sand lance and sculpins (Figure 5). Discussion Hood Canal. Food habits data indicate that Hood Canal harbor seals are opportunistic predators feeding on a variety of prey species, primarily schooling fishes, adult salmonids, and cephalopods. Hake, herring, adult salmon, shiner surfperch, and cephalopod species were the five most commonly occurring species for all years combined. The frequency of each prey species did vary among location, most notably the large percentage cephalopod species and threespine stickleback in Quilcene Bay. A high frequency of shiner surfperch was also observed in Quilcene Bay, Dosewallips River and Duckabush River. Bottom trawl data collected during 2002 and 2005 by Washington Department of Fish and Wildlife indicate hake and tomcod in 2002 and hake in 2005 were the primary gadid species in Hood Canal (Wayne Palsson, pers. comm.). Each Hood Canal River supports runs of various salmonid species including chinook, coho, chum and pink. Steelhead and sea run cutthroat are present as well. Many salmonid runs have declined sharply, with several (chinook, summer chum and Dosewallips pinks) listed in the 1992 Salmon and Steelhead Stock Inventory (WDF et al. 1992) as critical or depressed. Hood Canal summer chum and Puget Sound chinook (including some runs in Hood Canal) were recently listed as “Threatened” under the ESA. Salmonid consumption and impacts on specific salmon runs by pinnipeds were the drivers for this study. Salmon species are the third most frequently occurring species based on scat analysis. Identification of salmon to species is only possible with otoliths, however this only accounts for a small percentage of the samples collected. Development of molecular genetic techniques to identify salmon to species using bone recovered from fecal samples is an important tool for identifying salmon species and these data are currently being analyzed. South Puget Sound. Tomcod, hake and herring were important in south Puget Sound seal diet during all seasons and across years that were sampled (1995, 1997 and 2004). In addition to these schooling ground and forage fishes, midshipman, flat fishes and shiner surfperch were common. Relatively shallow bays with sandy substrate, such as Case Inlet, Carr Inlet and Nisqually Reach, dominate south Puget Sound. Gertrude Island in particular is located in Still Harbor, which is a relatively isolated sandy-bottomed bay on the north side of McNeil Island. In this type of habitat, it appears flat fish, midshipman and shiner surfperch compose a high proportion of the diet and this was reflected in samples collected at Gertrude Island and Eagle Island. Bottom trawl data collected during 2002 and 2005 by Washington Department of Fish and Wildlife indicate tomcod were the primary gadid species in Puget Sound (Wayne Palsson, pers.

7
7
comm.). Additionally, previous diet data collected in south Puget Sound in 1988 at the Nisqually River and at Gertrude Island in 1979 and 1994-1995 were similar in composition and proportion (NMFS 1997). San Juan Islands. In the San Juan Islands, harbor seals fed predominantly on Pacific herring, adult salmonids, and walleye pollock during spring and summer/fall 2006, and winter 2007. These results are similar to data collected in the San Juan Islands in 2005-2006 and other studies conducted in close proximity to the San Juan Islands that show that harbor seals feed primarily on adult salmonids when they are abundant, as well as small schooling fish and gadid species (Calambokidis et al. 1989, Olesiuk et al. 1990, Lance and Jeffries 2006). The peak of adult salmon in harbor seal diet during summer/fall coincides with high concentrations of returning adult salmon passing through waters around the San Juan Islands. In August-September 2005, pink salmon were the most numerous species in the San Juan Island area and harbor seals ate more pink salmon than other salmon species (Lance and Jeffries 2006). In August-September 2006, Puget Sound fall chum salmon numbers were up significantly in 2006 and sockeye salmon were the predominant adult salmon species with approximately 13 million late-run sockeye salmon were estimated to have passed through inland waters of Washington and British Columbia while returning to the Fraser River with 30-40% of those returning through the Strait of Juan de Fuca and San Juan Islands (K. Adicks, WDFW, pers. comm.). Harbor seals ate all species of salmon found in the San Juan Islands during this time period, with chum and sockeye occurring most frequently in the diet. In 2006, pink salmon were essentially absent as they only return in odd years, coho salmon return numbers were down significantly from 2005 throughout Puget Sound and southern British Columbia, and chinook salmon were more available based on by-catch in sockeye salmon fisheries, present during this study (K. Adicks, WDFW, pers. comm.). In general, diet composition data collected in the San Juan Islands indicates that harbor seals forage opportunistically on prey that is locally abundant throughout the region, but that varies seasonally. Walleye pollock, spotted ratfish, Pacific tomcod, english sole, Southern rock sole and dover sole were the six most frequently observed species in bottom trawls conducted by Washington Department of Fish and Wildlife in the San Juan Islands during May and June of 2001 (Palsson et al. 2003). While gadids (specifically walleye pollock) were found in harbor seal diet during all seasons and in a high percentage of samples collected in the winter, spotted ratfish did not appear in the diet. We speculate harbor seals do not consume this abundant species because they have a serrate, venomous dorsal spine (Hart 1973). English sole and other Pleuronectid species occurred in harbor seal diet, but in low frequencies compared to overall availability based on bottom trawl data (Palsson et al. 2003). Bottom trawls are best designed for flatfish and benthic oriented gadids and do not generally sample schooling forage fishes. Key prey species found in harbor seal diet in this study are primarily pelagic. This suggests harbor seals are feeding mainly in the water column rather than on the bottom and likely explains differences observed in fish species composition between trawl and diet data. Time-depth recorder data from harbor seals foraging in the Strait of Georgia indicates they spend the majority of their time feeding in the water column (P. Olesiuk, DFO-Canada, pers. comm.).

8
8
Regional comparison. Current population status and trends for juvenile and adult forage fish species throughout Puget Sound are not well known. Washington Department of Fish and Wildlife Fish Program and others have conducted extensive surveys to map and protect spawning habitat for Pacific herring, Pacific sand lance and surf smelt in Puget Sound. The Cherry Point Pacific herring stock that was once the largest in the state with an average run size of over 6,000 tons is now considered “depressed” with a two year stock status of “critical”, and is a proposed candidate for listing by Washington State (Bargmann 1998, Brown and Gaydos, 2005, Stick et al. 2005). Only one north Puget Sound Pacific herring stock is considered moderately healthy (Samish/Portage Bay stock) based on 25 year spawning biomass estimates (Stick 2005). Pacific sand lance occurred in approximately 10% of samples collected in the San Juan Islands and is receiving more attention recently for its importance to alcids (S. Pearson, WDFW, pers. comm.). Systematic spawning surveys for Pacific sand lance and surf smelt were conducted in the late 1980s and early 1990s by Washington Department of Fish and Wildlife with approximately 200 survey stations (D. Penttila, WDFW, pers. comm.) and more recently (2001-2004) by Friends of the San Juans, in concert with the San Juan County Marine Resources Committee, with the support of a number of funding entities with approximately 2000 survey stations (Moulton 2000). Northern anchovy was eaten almost exclusively during spring by harbor seals in both the San Juan Islands and Hood Canal. There have been no detailed spawning surveys for Northern anchovy in Puget Sound by Washington Department of Fish and Wildlife or others, however eggs were detected during plankton sampling throughout the rest of Puget Sound basin during summer 2006, including Whatcom and Skagit Counties (D. Penttila, WDFW, pers. comm.). Other apex marine predators feed on Pacific herring and Pacific sand lance in Puget Sound. They are the two most important prey species for thousands of Common murres (Uria aalge) and Rhinoceros auklets (Cerorhinca monocerata) in late summer and fall in the San Juan Islands (Lance and Thompson 2005) and were the two most important prey species delivered to Rhinoceros auklet chicks on Protection and Smith Islands located just south of the San Juan Islands in the late 1970s and early 1980s (Wilson and Manuwal 1986) and during the 2006, 2007 and 2008 breeding seasons on Protection Island (S. Pearson, WDFW, pers. comm.). Midshipman and flat fish (starry flounder and english sole) were most frequent in south Puget Sound harbor seal diet (Figure 5). These species prefer sandy substrate that is prevalent near Gertrude Island and Eagle Island and likely explains this difference from other regions. Washington Department of Fish and Wildlife has conducted a series of bottom trawl surveys in the Strait of Georgia, San Juan Islands, eastern Strait of Juan de Fuca, Hood Canal and south Puget Sound and abundance estimates support this finding (W. Palsson, WDFW, pers. comm.). Market squid were also common in the diet. We found no published information on abundance or distribution of market squid in Puget Sound although winter tends to be an important period based on sport harvests. The peak of adult salmon in harbor seal diet during summer/fall in both Hood Canal and the San Juan Islands coincides with high concentrations of returning adult salmon. Studies of pinniped predation on salmonids elsewhere have shown harbor seals are generally a terminal predator on salmon, taking them in estuaries and river mouths (Riemer et al. 1999, London et al. 2001, Olesiuk et al. 1990, Orr et al. 2004). This was the case in Hood Canal, however in the San Juan Islands, harbor seals are routinely feeding on salmon in “open water” areas as they funnel

9
9
through narrow passages in the San Juan Islands. In Johnstone Strait in British Columbia, which is another area where salmon funnel through, a high proportion of salmon was found in harbor seal diet (30% of diet in July and September) (Olesiuk et al. 1990). Interestingly, adult salmon moving through these areas in the San Juan Islands also attract southern resident killer whales (Orcinus orca) that focus predation on chinook salmon. Adult salmon were rare in south Puget Sound diet collected from Gertrude Island and Eagle Island despite salmon runs returning to nearby rivers. Perhaps this is due to other more numerous or easily attainable species found close to the haul out and the generally depressed nature salmon populations in south Puget Sound. Alternatively, if scat samples were collected from haulout sites located right off important river mouths such as the Nisqually River, harbor seal diet may show a greater importance of salmonids similar to what was found their diet in Hood Canal or the San Juan Islands.

10
10
Literature Cited Bargmann, G. 1998. Forage fish management plan: a plan for managing the forage fish resources
and fisheries of Washington. WDFW 600 Capitol Way N. Olympia, WA. 98501. 67 p. Brown, N.A. and J.K. Gaydos. 2005. Species of concern within the Puget Sound Georgia Basin
Marine Ecosystem: changes from 2002-2004. Abstract from Proceedings from the 2005 Puget Sound Georgia Basin Research Conference. 17 p.
Bowen, W.D. 2000. Reconstruction of pinniped diets: accounting for complete digestion of
otoliths and cephalopod beaks. Canadian Journal of Fisheries and Aquatic Sciences 57:898–905.
Browne, P, Laake, J. L. and De Long, R. L. 2002. Improving pinniped diet analyses through
identification of multiple skeletal structures in fecal samples. Fish. Bull. (U.S.) 100: 423-433.
Calambokidis, J., K. Bowman, S. Carter, J. Cubbage, P. Dawson, T. Fleischner, J. Schuett-
Hames, J. Skidmore, B. Taylor, and S.G. Herman. 1978. Chlorinated hydrocarbon concentrations and the ecology and behavior of harbor seals in Washington state waters. Cascadia Research Collective. Final Report to the National Science Foundation, Washington, D.C. Olympia. 121 p.
Calambokidis, J., B.D. McLaughlin, and G.H. Steiger. 1989. Bacterial contamination related to
harbor seals in Puget Sound, Washington. Cascadia Research Collective. Final Report to Jefferson County and Washington Department of Ecology Olympia. 121 p.
Cannon, D.Y. 1987. Marine Fish Osteology: A manual for archaeologists. Archaeology Press,
Simon Fraser University, Burnaby, British Columbia. Publication no. 18. Clarke, M.R. (ed.). 1986. A handbook for the identification of cephalopod beaks. Clarendon
Press, Oxford. 273 p. Cottrell, P.E., A.W. Trites, and E.H. Miller. 1996. Assessing the use of hard parts in faeces to identify harbour seal prey: results of captive-feeding trials. Can. J. Zool. 74:
875-880. Gustafson, R.G., W. H. Lenarz, B.B. McCain, C.C. Schmitt, W.S. Grant, T.L. Builder and R.D.
Methot. 2000. Status review of Pacific hake, Pacific cod, and walleye Pollock from Puget Sound, Washington. U.S. Dept. of Commerce, NOAA Tech. Memo. NMFS-NWFSC-44. 275 p.
Hart, J.L. 1973. Pacific Fishes of Canada. Fisheries Research Board of Canada. Ottawa. Harvey, J.T. 1989. Assessment errors associated with harbour seal (Phoca vitulina) faecal
sampling. Journal of Zoology (London) 219:101–111.

11
11
Harvey, J.T., T.R. Loughin, M.A. Perez, and D.S. Oxman. 2000. Relationship between fish size
and otolith length for 62 species of fishes from the eastern north Pacific Ocean. U.S. Dep. Commer. NOAA Tech. Rept., NMFS circular 150:1-36.
Jeffries, S.J., H.R. Huber, J. Calambokidis, J. Laake. 2003. Trends and status of harbor seals in
Washington State: 1978-1999. Journal of Wildlife Management 67(1): 207-218. Kashiwada, J., C.W. Recksiek, K.A. Karpov. 1979. Beaks of the market squid, Loligo
opalescens, as tools for predator studies. CalCOFI 20:65-69. Lambourn, D.M., S.J. Jeffries and H.R. Huber. 2008. Observations of Harbor Seals in Southern
Puget Sound during 2008. Contract report to NOAA Fisheries. Washington Department of Fish and Wildlife, Olympia WA. 27 pp.
Lance, M.M., A.J. Orr, S.D. Riemer, M.J. Weise, and J.L. Laake. 2001. Pinniped food habits
and prey identification techniques protocol. AFSC Processed report 2001-04 NOAA/NMFS 7600 Sand Point Way N.E. Seattle, WA. 98115-0070. 36 p.
Lance, M.M., and C.W. Thompson. 2005. Overlap in diets and foraging of Common Murres and
Rhinoceros Auklets after the breeding season. Auk 122 (3): 887-901. Lance, M.M., and S.J. Jeffries. 2006. Estimating importance of rockfish, lingcod and other
bottomfish in the diet of harbor seals in the San Juan Islands. Contract Report to SeaDoc Society Research Agreement No. K004431-22. Washington Department of Fish and Wildlife, Olympia WA. 20 pp.
Lance, M.M., and S.J. Jeffries. 2007. Temporal and spatial variability of harbor seal diet in the
San Juan Island archipelago. Contract Report to SeaDoc Society Research Agreement No. K004431-25. Washington Department of Fish and Wildlife, Olympia WA. 21 pp.
London, J.M., M.M. Lance and S.J. Jeffries. 2001. Observations of harbor seal predation on
Hood Canal salmonids from 1998 to 2000. Final Report, Studies of expanding pinniped populations NOAA Grant No. NA17FX1603, WDFW, PSMFC contract No. 02-15. 20 p.
Morrow J.E. 1979. Preliminary keys to otoliths of some adult fishes of the Gulf of Alaska,
Bering Sea, and Beaufort Sea. NOAA Tech. Rpt., NMFS, Circular 420. Moulton, L. L. 2000. San Juan County Forage Fish Assessment Project: Distribution of potential
surf smelt and Pacific sand lance spawning habitat in San Juan County Final Report. MJM Research, 1012 Shoreland Drive Lopez Island, WA 98261. 23 p.
NMFS. 1997. Investigation of Scientific Information on the Impacts of California Sea Lions and
Pacific Harbor Seals on Salmonids and on the Coastal Ecosystems of Washington, Oregon, and California. U.S. Department of Commerce, NOAA National Marine Fisheries Service. NOAA Technical Memorandum NMFS-NWFSC-28 172 p.
12
12
Olesiuk, P. F., M.A. Bigg, G.M. Ellis, S.J. Crockford, and R.J. Wigen. 1990. An assessment of
the feeding habits of harbour seals (Phoca vitulina) in the Strait of Georgia, British Columbia, based on scat analysis. Department of Fisheries and Oceans, Canada. Canadian Technical Report of Fisheries and Aquatic Sciences #1730. 135 p.
Olesiuk, P.F. 1999. Daily activity budgets and foraging patterns of harbour seals (Phoca vitulina)
in the Strait of Georgia, British Columbia. Abstract from the 13th biennial conference on the Biology of Marine Mammals, Hawaii. p.138.
Orr, A. J., and J.T. Harvey. 2001. Quantifying errors associated with using fecal samples to
determine the diet of the California sea lion (Zalophus californianus). Canadian Journal of Zoology 79:1080–1087.
Orr, A.J., A.S. Banks, S. Mellman, H.R. Huber, R.L. DeLong, and R.F. Brown. 2004.
Examination of the foraging habits of Pacific harbor seal (Phoca vitulina richardsi) to describe their use of the Umpqua River, Oregon, and their predation on salmonids. Fish. Bull. 102:108–117.
Orr, A.J., J.L. Laake, M.I. Dhruv, A.S. Banks, R.L. DeLong, and H.R. Huber. 2003. Comparison
of processing pinniped scat samples using a washing machine and nested sieves. Wildlife Society Bulletin 31(1):253-257.
Palsson, W., S. Hoffmann, P. Clarke, and J. Beam. 2003. Results from the 2001 transboundary
trawl survey of the southern Strait of Georgia, San Juan Archipelago and adjacent waters. Washington Department of Fish and Wildlife, 16018 Mill Creek Blvd. Mill Creek, WA. 98012-1296. 117 p.
PSAT (Puget Sound Action Team). 2007. 2007 Puget Sound update: Ninth report of the Puget
Sound Ambient Monitoring Program. Puget Sound Action Team, Olympia, WA. 260 pp. Puget Sound Partnership. 2008. Puget Sound Action Agenda: Protecting and Restoring the
Puget Sound Ecosystem by 2020. P.O. Box 40900 Olympia, WA 98504-0900. 207 pp. Riemer, S.D., R.F. Brown, B.E. Wright, and M.I. Dhruv. 1999. Monitoring Pinniped Predation
on Salmonids at Alsea River and Rogue River, Oregon: 1997-1999. Oregon Department of Fish and Wildlife, Marine Mammal Program 7118 N.E. Vandenberg Ave., Corvallis, OR 97330.
Stick, K., K. Costello, C. Herring, A. Lindquist, J. Whitney, and D. Wildermuth. 2005.
Distribution and abundance of Pacific herring (Clupea pallasi) spawn deposition for Cherry Point, Washington stock, 1973-2004. Abstract from Proceedings from the 2005 Puget Sound Georgia Basin Research Conference. 7 p.

13
13
Suryan, R.M. and J.T. Harvey. 1998. Tracking harbor seals (Phoca vitulina richardsi) to determine dive behavior, foraging activity, and haul-out site use. Marine Mammal Science, 14 (2):361-372.
Trites, A.W. and R. Joy. 2005. Dietary analysis from fecal samples: how many scats are enough?
Journal of Mammalogy 86(4):704-712. WDF, WDW, and Western Washington Treaty Indian Tribes. 1993. 1992 Washington State
Salmon and Steelhead Stock Inventory (SaSI). Washington Department of Fish and Wildlife. Olympia, WA. 212 p.
Wilson, U.W. and D.A. Manuwal. 1986. Breeding biology of the Rhinoceros Auklet in
Washington. Condor 88:143-155. Wolff, G. 1982. A beak key for eight eastern tropical Pacific cephalopod species with
relationships between beak dimensions and size. Fish. Bull. U.S. 80:357-370.

14
14
Figure 1. Study area showing Hood Canal, south Puget Sound and San Juan Islands, Washington.

15
15
Figure 2. Map of Puget Sound and Hood Canal showing sample collection locations

16
16
Figure 3. Map of south Puget Sound showing sample collection locations

17
17
Figure 4. Map of the San Juan Islands showing sample collection locations

18
18
Figure 5. Overall weighted average of primary (>10%) prey species in the diet of harbor seals for all seasons and years combined in Hood Canal, south Puget Sound and the San Juan Islands
0
10
20
30
40
50
60
70
80
90
100
Gadids
Herring
Salmon
Surfpe
rches
Cepha
lopod
s
Midship
men
Flatfis
h
Sandla
nce
Sculpi
ns
Ancho
vy
Prey Species
Wei
ghte
d A
vera
ge F
O
HC
SPS
SJI

19
19
Table 1. Number of harbor seals scats collected (“C”) and with remains (“R”) by haul out site during
fall (July – early December) 1998, 1999, 2000, 2001, 2003, 2004 and 2005 by year in Hood Canal, Washington.
1998 1999 2000 2001 2003 2004 2005
C R C R C R C R C R C R C R
Quilcene Bay 156 152 115 114 245 244 147 145 3 3 0 0 66 66
Dosewallips River 243 240 199 196 156 149 175 172 24 24 129 129 86 86
Duckabush River 7 7 9 9 127 125 102 100 93 92 0 0 2 2
Hamma Hamma River 68 67 40 38 80 78 0 0 0 0 0 0 40 40
Skokomish River 127 125 48 43 0 0 0 0 0 0 41 41 50 49
Total 601 591 411 400 608 596 424 417 120 119 170 170 244 243
Table 2. Number of harbor seals scats collected (“C”) and with remains (“R”) by haul out site during spring (March-June) 1999 and 2005 in Hood Canal, Washington.
1999 2005
C R C R
Quilcene Bay 10 10 0 0
Dosewallips River 170 170 82 82
Duckabush River 0 0 5 5
Hamma Hamma River 0 0 13 12
Skokomish River 17 15 105 105
Total 197 195 205 204

20
20
Table 3. Number of harbor seals scats collected (“C”) and with remains (“R”) by haul out site by
season in 1995, 1997, 2004 in south Puget Sound, Washington.
Fall 1995 (October)
Spring 1997 (April-May)
Summer 1997 (June-August)
Winter 1997 (October-Dec)
Fall 2004 (September)
C R C R C R C R C R
Gertrude Island 20 20 121 118 18 18 45 45 64 64
Eagle Island 0 0 5 5 3 3 38 38 0 0
Total 20 20 126 123 21 21 83 83 64 64
Table 4. Number of harbor seal scats collected by season and region in the San Juan Islands 2005-
2007. Collection location details found in Lance and Jeffries 2007.
2005 2006 2007
Spring Summer/Fall
Winter Spring Summer/Fall Winter
South Strait of Georgia 31 74
4 9 37 3
North Rosario Strait 0 74
0 0 36 0
East Rosario Strait 4 59
0 17 51 31
South Rosario Strait 0 59
11 4 20 9
South San Juan Channel 42 56
34 61 64 17
North San Juan Channel 0 63
0 6 47 4

21
21
Table 5. Percent frequency of occurrence (FO) of prey species identified using all structures (bone and otoliths) in harbor seal scats
during fall (July – early December) of 1998, 1999, 2000, 2001, 2003 and 2004 by year in Hood Canal, Washington
1998 1999 2000 2001 2003 2004 2005 n=591 n=400 n=596 n=417 n=119 n=170 n=243
Scientific Name Common Name n FO n FO n FO n FO n FO n FO n FO * All Gadids 518 88 304 76 511 86 312 75 81 68 123 72 207 85 Gadidae species codfish species 0 0 7 1.8 14 2.3 58 14 18 15 50 29 58 24 Merluccius productus Pacific hake 501 85 289 72 470 79 240 58 61 51 66 39 143 59 Microgadus proximus Pacific tomcod 15 2.5 7 1.8 26 4.4 14 3.4 1 0.8 7 4.1 6 2.5 Theragra chalcogramma Walleye pollock 2 0.3 1 0.3 1 0.2 0 0 0 0 0 0 0 0 Gadus macrocephalus Pacific cod 0 0 0 0 0 0 8 1.9 1 0.8 0 0 0 0 * All Clupeids 258 44 198 50 314 53 219 53 81 68 85 50 67 28 Clupea pallasi Pacific herring 258 44 164 41 23 3.9 80 19 19 16 62 37 45 19 Clupeid species herring spp. 0 0 33 8.3 291 49 139 33 62 52 22 13 22 9.1 Alosa sapidissima American Shad 0 0 1 0.3 0 0 0 0 0 0 1 0.6 0 0 * All Salmonids 152 26 114 29 163 27 145 35 29 24 58 34 50 21 Salmonid species adult salmonid spp. 150 25 110 28 146 25 137 33 25 21 55 32 48 20 Oncorhynchus tshawytscha Chinook Salmon 0 0 0 0 0 0 0 0 0 0 1 0.6 2 0.8 Salmonid species juvenile salmonid spp. 2 0.3 8 2.0 17 2.9 8 1.9 4 3.4 2 1.2 0 0 * All Surfperch 43 7.3 33 8.4 85 14 50 12 3 2.5 25 15 29 12 Cymatogaster aggregata Shiner perch 39 6.6 30 7.5 81 14 44 11 3 2.5 22 13 28 12 Rhacochilus vacca Pile perch 4 0.7 3 0.8 4 0.7 6 1.4 0 0 3 1.8 1 0.4 * All cephalopods 23 3.9 32 8.0 59 9.9 25 6.0 7 5.9 10 5.9 8 3.3 Cephalopod species 9 1.5 24 6.0 25 4.2 25 6.0 7 5.9 2 1.2 3 1.2 Octopus rubescens 0 0 8 2.0 6 1.0 0 0 0 0 1 0.6 0 0 Loligo opalescens Market squid 11 1.9 0 0 28 4.7 0 0 0 0 7 4.1 5 2.1 Berryteuthis/Gonatopsis borealis species 3 0.5 0 0 13 2.2 0 0 0 0 0 0 0 0
Engraulis mordax Northern anchovy 14 2.4 19 4.8 8 1.3 1 0.2 0 0 7 4.1 36 15 Porichthys notatus Plainfin midshipman 14 2.4 15 3.8 13 2.2 12 2.9 3 2.5 6 3.5 11 4.5

22
22
Leptocottus armatus Staghorn sculpin 16 2.7 9 2.3 14 2.3 20 4.8 0 0 6 3.5 8 3.3 Chitonotus pugetensis Roughback sculpin 1 0.2 0 0 0 0 0 0 0 0 0 0 0 0 Cottid species sculpin species 0 0 0 0 0 0 0 0 0 0 2 1.2 1 0.4 Gasteroseus aculeatus Three spine stickleback 7 1.2 6 1.5 53 8.9 12 2.9 2 1.7 0 0 6 2.5 Pleuronectid species Righteye flounder 0 0 0 0 1 0.2 4 1.0 0 0 2 1.2 1 0.4 Platichthys stellatus Starry flounder 0 0 0 0 1 0.2 0 0 0 0 1 0.6 0 0 Lyopsetta exilis Slender sole 0 0 2 0.5 0 0 0 0 0 0 0 0 0 0 Pleuronectes vetulus English Sole 2 0.3 2 0.5 0 0 0 0 0 0 0 0 2 0.8 Bothid species Lefteye flounder. 0 0 0 0 0 0 0 0 0 0 0 0 1 0.4 Rajid species skate species 3 0.5 3 0.8 9 1.5 4 1.0 1 0.8 1 0.6 3 1.2 Liparidid species snailfish species 0 0 0 0 0 0 0 0 0 0 1 0.6 0 0 Ammodytes hexapteras Pacific sand lance 0 0 2 0.5 2 0.3 2 0.5 0 0 1 0.6 1 0.4 Scorpaenid species rockfish species 3 0.5 3 0.8 4 0.7 5 1.2 1 0.8 1 0.6 7 2.9 Unidentifiable fish spp. 29 4.9 18 4.5 15 2.5 40 9.6 3 2.5 5 2.9 6 2.5

23
23
Table 6. An annual comparison of the percent frequency of occurrence (FO) of primary prey species identified using all structures (bone and otoliths) in harbor seal scats by river system in Hood Canal, Washington during fall (late July – early December) of 1998, 1999, 2000, 2001, 2003 and 2004.
Quilcene Bay 1998 1999 2000 2001 2003 2005 n = 152 n = 114 n = 244 n = 145 n = 3 n = 66 Common Name n FO n FO n FO n FO n FO n FO Pacific hake 135 89 89 78 210 86 88 61 3 100 40 61 Pacific herring 59 39 50 44 107 44 27 19 2 67 13 20 Adult salmonid species 37 24 41 36 66 27 59 41 0 0 10 15
Shiner perch 15 9.9 8 7.0 38 16 18 12 0 0 12 18 Cephalopod species 9 5.9 12 11 31 13 12 8.3 0 0 2 3.0 Threespine stickleback 7 4.6 5 4.4 52 21 5 3.4 0 0 4 6.1
Dosewallips River 1998 1999 2000 2001 2003 2004 2005 n = 240 n = 196 n = 149 n = 172 n = 92 n = 129 n = 86 Common Name n FO n FO n FO n FO n FO n FO n FO Pacific hake 204 85 156 80 119 80 123 72 49 53 52 40 54 63 Pacific herring 113 47 75 38 68 46 76 44 41 45 49 38 17 20 Adult salmonid species 51 21 42 21 27 18 33 19 24 26 53 41 15 17
Shiner perch 15 6.3 14 7.1 12 8.1 2 1.2 2 2.2 15 12 6 7.0 Cephalopod species 0 0 0 0 0 0 6 3.5 6 6.5 8 6.2 3 3.5
Duckabush River
1998 1999 2000 2001 2003 2005 n = 7 n = 9 n = 125 n = 100 n = 24 n = 2 Common Name n FO n FO n FO n FO n FO n FO Pacific hake 7 100 5 56 83 66 29 29 9 38 1 50 Pacific herring 3 43 6 67 81 65 36 36 19 79 0 0 Adult salmonid species 1 14 0 0 24 19 45 45 4 17 0 0
Shiner perch 0 0 1 11 27 22 24 24 1 4.2 0 0 Cephalopod species 2 29 0 0 2 0.8 7 7.0 1 4.2 0 0
24
24
Hamma Hamma River
1998 1999 2000 2005 n = 67 n = 38 n = 78 n = 40 Common Name n FO n FO n FO n FO Pacific hake 56 84 26 68 58 74 27 68 Pacific herring 27 40 16 42 35 45 7 18 Adult salmonid species 16 24 13 34 29 37 4 10
Shiner perch 3 4.5 2 5.3 4 5.1 3 7.5 Cephalopod species 2 3.0 6 16 11 14 1 2.5
Skokomish River
1998 1999 2004 2005 n = 125 n = 43 n= n = 49 Common Name n FO n FO n FO n FO Pacific hake 99 79 14 33 15 37 21 43 Pacific herring 56 45 16 37 14 34 8 16 Adult salmonid species 45 36 18 42 4 9.8 19 39
Shiner perch 6 4.8 5 12 7 17 7 14 Cephalopod species 0 0 0 0 1 2.4 2 4.1
25
25
Table 7. Percent frequency of occurrence (FO) of prey species identified using all structures (bone and otoliths) in harbor seal scats during spring (March-June) 1999 and 2005 in Hood Canal, Washington.
1999 2005 n=195 n=204 Scientific Name Common Name n FO n FO * All Gadids 171 88 168 82 Gadidae species codfish species 7 3.6 57 28 Merluccius productus Pacific hake 157 81 108 53 Microgadus proximus Pacific tomcod 5 2.6 3 1.5 Theragra chalcogramma Walleye pollock 2 1.0 0 0 * All Clupeids 86 44 46 23 Clupea pallasi Pacific herring 78 40 24 12 Clupeid species herring species 8 4.1 17 8.3 Alosa sapidissima American Shad 0 0 5 2.5 * All Salmonids 31 16 27 13 Salmonid species adult salmonid species 9 4.6 22 11 Oncorhynchus tshawytscha Chinook Salmon 0 0 5 2.5 Salmonid species. juvenile salmonid species 20 10 0 0 * All Surfperch 18 9.2 56 28 Embiotocid species Surfperch species 0 0 2 1.0 Cymatogaster aggregata Shiner perch 18 9.2 54 27 * All cephalopods 2 1.0 15 7.4 Cephalopod species Squid or octopus species 2 1.0 12 5.9 Loligo opalescens Market squid 0 0 3 1.5 Engraulis mordax Northern anchovy 53 27 88 43 Porichthys notatus Plainfin midshipman 9 4.6 6 2.9 Leptocottus armatus Staghorn sculpin 0 0 4 2.0 Gasteroseus aculeatus Three spine stickleback 29 15 9 4.4 Pleuronectid species righteye flounder spp. 2 1.0 7 3.4 Lyopsetta exilis Slender sole 7 3.6 0 0 Pleuronectes vetulus English Sole 1 0.5 2 1.0 Rajid species skate species 12 6.2 3 1.5 Scorpaenid species rockfish species 4 2.1 9 4.4 Hypomesus pretiosus Surf smelt 1 0.5 0 0 Unidentifiable fish species 9 4.6 12 5.9

26
26
Table 8. Percent frequency of occurrence (FO) of prey species identified using all structures (bone and otoliths) in harbor seal scats during fall 1995, spring 1997, summer 1997, winter 1997 and fall 2004 in south Puget Sound, Washington.
Fall 1995 Spring 1997 Summer 1997 Winter 1997 Fall 2004 n = 20 n = 123 n = 21 n = 83 n = 64
Scientific Name Common Name n FO n FO n FO n FO n FO * All Gadids 23 100 137 100 20 95 97 100 69 100 Microgadus proximus Pacific tomcod 7 35 62 50 8 38 43 52 26 41 Merluccius productus Pacific hake 4 20 34 28 8 38 39 47 23 36 Gadidae species codfish 9 45 38 31 3 14 15 18 10 16 Theragra chalcogramma Walleye pollock 2 10 3 2.4 1 4.8 0 0 9 14 Gadus macrocephalus Pacific cod 1 0.32 0 0 0 0 0 0 1 1.6 Porichthys notatus Plainfin midshipman 12 60 53 43 6 29 39 47 33 55 * All Clupeids 11 55 55 45 13 62 45 54 56 88 Clupea pallasi Pacific herring 6 30 13 11 5 24 18 22 34 53 Clupeid species herring species 5 25 37 30 8 38 27 33 21 33 Alosa sapidissima American Shad 0 0 5 4.1 0 0 0 0 1 1.6 * All Surfperch 2 10 34 28 2 9.5 12 14 5 7.8 Cymatogaster aggregata Shiner perch 2 10 32 26 2 9.5 12 14 5 7.8 Embiotocid species. Surfperch 0 0 1 0.8 0 0 0 0 0 0 Rhacochilus vacca Pile perch 0 0 1 0.8 0 0 0 0 0 0 * All Salmonids 0 0 34 28 5 24 9 11 10 16 Salmonid species adult salmonid 0 0 2 1.6 0 0 3 3.6 4 6.3 Salmonid species juvenile salmonid 0 0 32 26 5 24 6 7.2 6 9.4 * All Flatfish 7 35 47 38 7 33 33 40 11 17 Pleuronectes vetulus English Sole 2 10 18 15 3 14 11 13 4 6.3 Pleuronectid species Righteye flounder 3 15 8 6.5 3 14 7 8.4 0 0 Lyopsetta exilis Slender sole 1 5.0 10 8.1 1 4.8 2 2.4 0 0 Platichthys stellatus Starry flounder 1 5.0 4 3.3 0 0 4 4.8 3 4.7 Errex zachirus Rex sole 0 0 1 0.8 0 0 1 1.2 3 4.7 Lepidopsetta bilineata Rock sole 0 0 2 1.6 0 0 2 2.4 0 0 Bothidae/Pleuronectidae Unidentified flat fish 0 0 2 1.6 0 0 2 2.4 0 0 Microstomus pacificus Dover sole 0 0 0 0 0 0 2 2.4 1 1.6 Bothid species Lefteye flounder 0 0 1 0.8 0 0 0 0 0 0

27
27
Isopsetta isolepis Butter sole 0 0 1 0.8 0 0 0 0 0 0 Psettichthys melanostictus Sand sole 0 0 0 0 0 0 1 1.2 0 0 Pleuronichthys coenosus C-O sole 0 0 0 0 0 0 1 1.2 0 0 * All Cottids 0 0 13 11 2 9.5 8 9.6 6 9.4 Leptocottus armatus Staghorn sculpin 0 0 5 4.1 2 9.5 2 2.4 0 0 Cottid species Sculpin 0 0 7 5.7 0 0 6 7.2 6 9.4 Hemilepidotus species Irish lord 0 0 1 0.8 0 0 0 0 0 0 * All cephalopods 11 55 13 10.6 2 9.5 7 8.4 8 13
Loligo opalescens Market squid 7 35 8 6.5 1 4.8 4 4.8 5 7.8
Octopus rubescens 1 5.0 2 1.6 1 4.8 2 2.4 1 1.6 Cephalopod species 3 15 3 2.4 0 0 1 1.2 2 3.1 Scorpaenid species Rockfish 1 5.0 12 9.8 5 24 4 4.8 0 0 Petromyzontidae species Lamprey 1 5.0 12 9.8 1 4.8 1 1.2 1 1.6 Ammodytes hexapteras Pacific sand lance 0 0 6 4.9 1 9.5 0 0 1 1.6 Rajid species Skate 0 0 7 5.7 0 0 1 1.2 0 0 Zoarcid species Eelpout 0 0 4 3.3 1 4.8 0 0 0 0 Liparidid species Snailfish 1 5.0 1 0.8 0 0 1 1.2 1 1.6 Engraulis mordax Northern anchovy 0 0 3 2.4 0 0 0 0 0 0 Hexagrammid species Greenling 0 0 2 1.6 0 0 0 0 0 0 Pholid species Gunnel 0 0 1 0.8 0 0 1 1.2 0 0 Gasteroseus aculeatus Three spine stickleback 0 0 1 0.8 0 0 0 0 0 0 Unidentified fish spp. 1 5.0 9 7.3 2 9.5 0 0 0 0 Unidentifiable fish spp 1 5.0 3 2.4 0 0 1 1.2 1 1.6

28
28
Table 9. Frequency of occurrence (FO; expressed as percent) and overall weighted average of prey species in the diet of harbor seals by season in the San Juan Islands, 2005-06
Spring Summer/Fall Winter Overall (wt)
Scientific Name Common Name n = 77 FO n =
384 FO n = 46 FO n =
507 FO
* All Clupeids 57 74 147 38 32 70 236 61 Clupea pallasi Pacific herring 55 71 135 35 29 63 219 57 Clupeid species herring spcies 2 2.6 11 2.9 1 2.2 14 2.5 Alosa sapidissima American Shad 0 0 1 0.26 2 4.35 3 1.5 * All Gadids 60 78 37 10 17 37 114 42 Gadidae species codfish species 29 38 16 4 14 30 59 24 Theragra chalcogramma Walleye pollock 31 40 19 5 3 7 53 17
Merluccius productus Pacific hake 0 0 2 0.52 0 0 2 0.2 * All Salmonids 0 0 307 80 6 13 313 31 Adult Salmonid spp. 0 0 251 65 6 13 257 26 Oncorhynchus gorbuscha Pink Salmon 0 0 25 6.51 0 0 25 2.2
Oncorhynchus tshawytscha Chinook Salmon (ad) 0 0 1 1.3 0 0 1 0.4
Oncorhynchus keta Chum Salmon 0 0 3 0.78 0 0 3 0.3 Oncorhynchus nerka Sockeye Salmon 0 0 1 0.26 0 0 1 0.1 Juvenile Salmonid species 0 0 22 5.73 0 0 22 1.9
Oncorhynchus tshawytscha Chinook Salmon (juv) 0 0 4 1.3 0 0 4 0.4
Ammodytes hexapteras Pacific sand lance 17 22 36 9 13 28 66 20 Engraulis mordax Northern anchovy 4 5.2 2 0.5 23 50.0 29 19 Squalus acanthias Spiny dogfish 0 0 2 0.52 17 37 19 12 * All Cottids 3 3.9 24 6.3 8 17.4 35 9.2 Cottid species sculpin species 1 1.3 10 2.6 6 13.0 17 5.6
Leptocottus armatus Pacific staghorn sculpin 2 2.6 6 1.6 2 4.4 10 2.8
Hemilepidotus species. irish lord species 0 0 8 2.08 0 0 8 0.7 * All Flatfish 1 1.3 23 6.0 6 13.0 30 6.8
Pleuronectid species righteye flounder species 1 1.3 7 1.8 1 2.2 9 1.8
Platichthys stellatus Starry flounder 0 0 4 1.04 3 6.52 7 2.5 Pleuronectes vetulus English Sole 0 0 7 1.82 0 0 7 0.6 Microstomus pacificus Dover sole 0 0 4 1.04 1 2.17 5 1.1
Bothid species lefteye flounder species 0 0 1 0.26 1 2.17 2 0.8
* All Cephalopods 3 3.9 13 3.4 6 13.0 22 6.8 Octopus rubescens 2 2.6 6 1.6 1 2.2 9 2.1 Berryteuthis magister 0 0 5 1.3 2 4.35 7 1.9 Loligo opalescens Market squid 1 1.3 1 0.3 2 4.4 4 2.0 Gonatidae species 0 0 0 0 1 2.17 1 0.7 Unknown cephalopod 0 0 1 0.26 0 0 1 0.1 Rajid species skate species 2 2.6 1 0.3 7 15.2 10 6.0 Liparidid species snailfish species 0 0 1 0.26 6 13 7 4.4 Cymatogaster aggregata Shiner perch 2 2.6 9 2.3 3 6.5 14 3.8
Hypomesus pretiosus Surf smelt 2 2.6 13 3.4 2 4.4 17 3.4 Gasteroseus aculeatus Threespine 5 0 4 1.04 4 8.7 13 3.2

29
29
stickleback Scorpaenid species rockfish species 0 0 1 0.26 3 6.52 4 2.3 Argentinid species Argentine 0 0 0 0 2 4.35 2 1.5 Porichthys notatus Plainfin midshipmen 2 2.6 4 1.0 0 0.0 6 1.2 Pholid species gunnel species 1 1.3 1 0.3 1 2.2 3 1.2 Hexagrammid species greenling species 2 2.6 1 0.3 0 0.0 3 1.0 Genus Rathbunella ronquil species 0 0 3 0.78 1 2.17 4 1.0
Diaphus theta California headlight fish 0 0 7 1.82 0 0 7 0.6
Zoarcid species eelpout species 0 0 6 1.56 0 0 6 0.5 Lycodopis pacifica Blackbelly eelpout 0 0 2 0.52 0 0 2 0.2 Petromyzontid species lamprey species 0 0 2 0.52 0 0 2 0.2 Anarrhichthys ocellatus Wolf-eel 0 0 1 0.26 0 0 1 0.1
Stenobrachius leucopsarus Northern lampfish 0 0 0 0 1 2.17 1 0.7
Scomber japonicus mackerel species 0 0 0 0 1 2.17 1 0.7 Not identifiable fish species 0 0 3 0.78 3 6.52 6 2.4
Unidentifiable fish species 3 3.9 13 3.4 1 2.2 17 3.2

30
30
Table 10. Frequency of occurrence (FO; expressed as percent) and overall weighted average of prey species in the diet of harbor seals by season in the San Juan Islands, 2006-07
Spring Summer/Fall Winter Overall (wt)
Scientific Name Common Name n = 97 FO
n = 239 FO
n = 56 FO
n = 392 FO
* All Clupeids 88 91 104 44 40 71 232 69 Clupea pallasi Pacific herring 79 81 76 32 33 59 188 57 Clupeid spp. herring species 6 6.2 22 9.2 7 13 35 9.5 Alosa sapidissima American Shad 3 3.1 6 2.5 0 0 9 1.9 * All Gadids 22 23 64 27 25 45 111 32 Gadidae spp. codfish species 12 12 15 6.3 5 8.9 32 9.1 Theragra chalcogramma Walleye pollock 9 9.3 38 16 12 21 59 15 Merluccius productus Pacific hake 0 0 6 2.5 5 8.9 11 3.8 Microgadus proximus Pacific tomcod 1 1.0 5 2.1 3 5.4 9 2.8 * All Salmonids 7 7.2 159 67 7 13 173 29 Adult Salmonid spp. 6 6.2 106 44 4 7.1 116 19 Oncorhynchus gorbuscha Pink Salmon (ad) 0 0 1 0.42 0 0 1 0.14 Oncorhynchus tshawytscha Chinook Salmon (ad) 0 0 1 0.42 0 0 1 0.14 Oncorhynchus keta Chum Salmon (ad) 0 0 13 5.4 0 0 13 1.8 Oncorhynchus nerka Sockeye Salmon (ad) 0 0 6 2.5 1 1.8 7 1.4 Oncorhynchus kisutch Coho Salmon (ad) 0 0 2 0.84 0 0 2 0.28 Juvenile Salmonid spp. 1 1.0 21 8.8 1 1.8 23 3.9 Oncorhynchus tshawytscha Chinook Salmon (juv) 0 0 7 2.9 1 1.8 8 1.6 Oncorhynchus kisutch Coho Salmon (juv) 0 0 1 0.42 0 0 1 0.14 Oncorhynchus nerka Sockeye Salmon (juv) 0 0 1 0.42 0 0 1 0.14 Ammodytes hexapteras Pacific sand lance 12 12 34 14 3 5.4 49 10 Engraulis mordax Northern anchovy 20 21 4 1.7 1 1.8 25 8.2 Squalus acanthias Spiny dogfish 1 1.0 1 0.42 0 0 2 0.47 * All Cottids 4 4.1 22 9.2 11 20 37 11 Cottid spp. sculpin species 2 2.1 10 4.2 7 13 19 6.4 Leptocottus armatus Pacific staghorn sculpin 0 0 9 3.8 4 7.1 13 3.6 Hemilepidotus spp. irish lord species 2 2.1 3 1.3 0 0 5 1.1 * All Flatfish 1 1.0 15 6.3 1 1.8 17 3.0
Pleuronectid spp. righteye flounder species 1 1.0 10 4.2 1 1.8 12 2.3
Pleuronectes vetulus English Sole 0 0 4 1.7 0 0 4 0.57 Bothid spp. lefteye flounder species 0 0 1 0.42 0 0 1 0.14 * All Cephalopods 4 4.1 34 14 9 16 47 11 Octopus rubescens 2 2.1 5 2.1 3 5.4 10 3.2 Berryteuthis magister 1 1.0 11 4.6 1 1.8 13 2.5 Loligo opalescens Market squid 0 0 5 2.1 0 0 5 0.7 Gonatidae spp. 0 0 1 0.42 3 5.4 4 1.9 Cephalopod species statolith only 1 1.0 12 5.0 2 3.6 15 3.2 Rajid spp. skate species 5 5.2 2 0.84 7 13 14 6.3 Liparidid spp. snailfish species 4 4.1 3 1.3 4 7.1 11 4.2 Cymatogaster aggregata Shiner perch 3 3.1 7 2.9 15 27 25 11 Osmerid species smelt species 2 2.1 5 2.1 3 5.4 10 3.2 Osmerus mordax dentex Rainbow smelt 1 1.0 1 0.42 0 0 2 0.47 Hypomesus pretiosus Surf smelt 0 0 1 0.42 0 0 1 0.14

31
31
Thaleichthys pacificus Eulachon 1 1.0 5 2.1 1 1.8 7 1.6 Gasteroseus aculeatus Threespine stickleback 5 5.2 4 1.7 0 0 9 2.3 Scorpaenid spp. rockfish species 3 3.1 22 9.2 13 23 38 12 Porichthys notatus Plainfin midshipmen 1 1.0 10 4.2 5 8.9 16 4.7 Pholid spp. gunnel species 0 0 7 2.9 0 0 7 0.97 Hexagrammid spp. greenling species 0 0 1 0.42 0 0 1 0.14
Diaphus theta California headlight fish 2 2.1 0 0 1 1.8 3 1.3
Zoarcid species eelpout species 1 1.0 18 7.5 4 7.1 23 5.2 Petromyzontid species lamprey species 0 0 9 3.8 0 0 9 1.3 Stenobrachius leucopsarus Northern lampfish 1 1.0 0 0 0 0 1 0.33 Not identifiable fish spp. 3 3.1 4 1.7 3 5.4 10 3.4 Unidentifiable fish spp. 1 1.0 2 0.84 3 5.4 6 2.4