handbook for asean government officials on climate change ... for asean government... · handbook...
TRANSCRIPT

ASIA-EUROPEENVIRONMENT FORUM
HANDBOOK FOR ASEAN GOVERNMENT OFFICIALS ON
Climate Change and SDGs

ISBN: 9789811113796
Views expressed here do not necessarily reflect those of the co-organisers, publisher or editors of this volume.
This publication is made with the financial support of the Asia-Europe Environment Forum (ENVforum) Partners:Asia-Europe Foundation (ASEF), Government of Sweden through the Regional Asia Environment Conference Support Programme, Hanns Seidel Foundation (HSF), ASEM SMEs Eco-Innovation Center (ASEIC) and the Institutefor Global Environmental Strategies (IGES).
This project is co-funded by the European Union.
Permissions and Rights
This work is licensed under a Creative Commons Attribution-NonCommercial-NoDerivatives 4.0 International License.
You are free to:
Share - copy and redistribute the material in any medium or format
Attribution - you must give appropriate credit, provide a link to the license, and indicate if changes were made.you may do so in any reasonable manner, but not in any way that suggests the licensor endorses you or your use.
NonCommercial - you may not use the material for commercial purposes.
NoDerivatives - If you remix, transform, or build upon the material, you may not distribute the modified material.
No additional restrictions - You may not apply legal terms or technological measures that legally restrict othersfrom doing anything to the license permits.
Handbook for ASEAN Government Officials on Climate Change and SDGs
Lead Authors:
Associate Professor HO Juay Choy, Energy Studies Institute
Melissa LOW Yu Xing, Energy Studies Institute
Gautam JINDAL, Energy Studies Institute
Dora ALMASSY, Central European University
Editor:
Grazyna PULAWSKA, Project Manager, Asia-Europe Foundation

HANDBOOKFOR ASEAN GOVERNMENT OFFICIALS
ON CLIMATE CHANGE AND SDGS
Singapore 2016


1
TABLE OF CONTENTS
LIST OF ABBREVIATIONS
LIST OF FIGURES
LIST OF TABLES
1. Introduction to the Science of Climate Change and Latest Findings
Evidence of Climate Change
Drivers of Climate Change
Global Carbon Emissions and the Impact of INDCs
Projections of Future Changes in Climate
Socio-Economic Impacts of Climate Change
Climate Change and its Socio-Economic Impacts in Southeast Asia
2. Global Climate Negotiations
Introduction to the United Nations Framework Convention on Climate Change
The Kyoto Protocol
In Search of the Next Climate Agreement - The Road to Paris
The Role of Party Groupings in the Climate Negotiations
3. The Paris Agreement: What Was Actually Achieved at the COP21 Summit?
Objective of the Agreement and Long-Term Goal
Mitigation and Global Stocktake
Forestry
Cooperative Approaches
Adaptation
Loss and Damage
Finance
Technology Transfer
Capacity Building
Transparency of Action and Support
Compliance
After Paris - What’s Next?
Paris Agreement’s Entry into Force
4. Climate Finance
Financing mechanisms of the UNFCCC
Multilateral and Bilateral Climate Financing Mechanisms
Analysis of the Current Climate Financing Landscape
01
03
06
08
10
10
11
13
14
15
16
18
18
19
25
28
34
35
36
36
37
38
38
39
40
40
40
41
42
43
46
46
49
52
TABLE OF CONTENTS

2
5. Climate Cooperation in the ASEAN Community
ASEAN Countries at the Climate Change Negotiations
Regional Climate Co-operation among the ASEAN Member States
The Paris Agreement and ASEAN
6. The Climate Policy Profile of the ASEAN Member States
Brunei Darussalam
Cambodia
Indonesia
Lao PDR
Malaysia
Myanmar
Philippines
Singapore
Thailand
Viet Nam
7. An ASEAN Climate Policy Profile
Climate Vulnerabilities
Adaptation Needs and Actions
GHG Emissions
Commitments to Mitigate GHG Emissions
Climate Change Policies and Programmes
BIBLIOGRAPHY
55
55
57
59
61
63
67
72
78
82
87
92
96
100
105
110
110
112
113
115
119
121

3
AAP-JRCC ASEAN Action Plan on Joint Response to Climate Change
AAUs Assignment Amount Units
ACCI ASEAN Climate Change Initiative
ADB Asian Development Bank
ADP Ad hoc Working Group on the Durban Platform for Enhanced Action
AGBM Ad hoc Group on the Berlin Mandate
AILAC Independent Alliance of Latin America and the Caribbean
AMS ASEAN Member States
AOSIS Alliance of Small Island States
APA Ad Hoc Working Group on the Paris Agreement
AR Assessment Report
ASEAN Association of South East Asian Nations
AWGCC ASEAN Working Group on Climate Change
AWG-KP Ad Hoc Working Group on Further Commitments for Annex I Parties under the Kyoto Protocol
AWG-LCA Ad Hoc Working Group on Long-term Cooperative Action under the Convention
BAP Bali Action Plan
BAU Business As Usual
BRs Biennial Reports
BURs Biennial Update Reports
CAIT Climate Analysis Indicators Tool
CBDR-RC Common but Differentiated Responsibilities and Respective Capabilities
CCAP Climate Change Action Plan
CCSP Climate Change Strategic Plan
CCSU Carbon Capture, Storage and Utilisation
CCTT Climate Change Technical Team
CDM Clean Development Mechanism
CER Certified Emission Reduction
CFS Central Forest Spine
CGE Consultative Group of Experts on National Communications from Parties not included in Annex I to the Convention
LIST OF ABBREVIATIONS

4
CMA Conference of the Parties serving as the Meeting of the Parties to the Paris Agreement
CMP Meeting of the Parties to the Kyoto Protocol
COP Conference of Parties
COW Committee of the Whole
CPI Climate Policy Initiative
CTCN Climate Technology Centre and Network
DNPI Dewan Nasional Perubahan Iklim
EIG Environmental Integrity Group
ERUs Emission Reduction Units
ETS Emissions Trading Scheme
GEF Global Environment Facility
GCF Green Climate Fund
GHG Greenhouse gases
GtC Gigatonnes of carbon
IAR International Assessment and Review
ICA International Consultation and Analysis
IETA International Emissions Trading Association
IFAD The International Fund for Agricultural Development
IMCCC Inter-Ministerial Committee on Climate Change
INDCs Intended Nationally Determined Contributions
IPCC Intergovernmental Panel on Climate Change
IRZ Inter-Rivernine Zones
ITMOs Internationally Transferred Mitigation Outcomes
JI Joint Implementation
LDCs Least Developed Countries
LDCF Least Developed Countries Fund
LEDS Low Emissions Development Strategies
LULUCF Land use, land-use change and forestry
MENGO Malaysia Environmental NGOs
MOECAF Ministry of Environmental Conservation and Forestry
MOI Means of Implementation
MRV Measurement, Reporting and Verification
NAMAs Nationally Appropriate Mitigation Actions

5
NAPAs National Adaptation Programme of Actions
NCCS National Climate Change Secretariat
NCs National Communications
NCS Nusantara Carbon Scheme
NCSD National Council for Sustainable Development
NDAs National Designated Authorities
NDCs Nationally Determined Contributions
NEC National Environmental Council
NGOs Non-Governmental Organisations
NIEs National Implementing Entities
OPEC The Organisation of Petroleum Exporting Countries
PCCB Paris Committee on Capacity Building
ppb Parts per billion
ppm Parts per million
QELROs Quantified Emission Limitation and Reduction Objectives
REDD Reducing emissions from deforestation and forest degradation
REDD+ Reducing emissions from deforestation and forest degradation and the role of conservation, sustainable management of forests and enhancement of forest carbon stocks in developing countries
REN Renewable Energy Policy Network
RF Radiative Forcing
SBI Subsidiary Body for Implementation
SBSTA Subsidiary Body for Scientific and Technological Advice
SCF UNFCCC Standing Committee on Finance
SCCF Special Climate Change Fund
SIDS Small Island Developing States
TEC Technology Executive Committee
UNCED United Nations Conference on Environment and Development
UNEP United Nations Environment Programme
UNFCCC United Nations Framework Convention on Climate Change
WG Working Group
WIM Warsaw International Mechanism for Loss and Damage
WMO World Meteorological Organization
WRI World Resources Institute
6
Figure 1: Observed changes in surface temperature 1901-2012
Figure 2: Total annual anthropogenic GHG emissions (GtCO2eq/yr) 1970–2010
Figure 3: Simplified schematic of the global carbon cycle
Figure 4: Global GHG emissions under various scenarios and Emissions Gap in 2030
Figure 5: Maps of projected late 21st century annual mean surface temperature change, annual mean precipitation change
Figure 6: Observed impacts attributed to climate change for physical, biological, and human and managed systems
Figure 7: Climate Change Vulnerability Map of Southeast Asia
Figure 8: Trends in regional contribution towards global CO2 emissions
Figure 9: Carbon budget
Figure 10: The third target of the EU2020 strategy on climate change and energy
Figure 11: World cloud of most used words in the LMDC submission on the 2015 agreement
Figure 12: World cloud of most used words in the LDC and AOSIS submission on the 2015 agreement
Figure 13: Key points from the Paris Agreement
Figure 14: Key tasks to be completed before the first Meeting of Parties to the Paris Agreement
11
12
12
13
14
15
16
25
26
31
32
33
35
43
LIST OF FIGURES

7
Figure 15: The flows of climate finance in 2015
Figure 16: Flow of Climate Finance in 2010-2012 (in $ per year) as per UNFCCC Standing Committee on Finance
Figure 17: ASEAN Member Countries
Figure 18: Number of climate projects and activities in Cambodia, by theme
Figure 19: Number of climate projects and activities in Indonesia, by theme
Figure 20: Number of climate projects and activities in Malaysia
Figure 21: Number of climate projects and activities in the Philippines, by theme
Figure 22: Number of climate projects and activities in Thailand, by theme
Figure 23: Number of climate projects and activities in Viet Nam, by theme
Figure 24: Global Climate Risk Index: Overall ranking between 1995-2014
Figure 25: Adaptive capacity of the Southeast Asian region (2005)
Figure 26: Total GHG emissions of ASEAN Member States - 2012 (MtCO2)
Figure 27: GHG emissions by Gas - 2012 (MtCO2) in the ASEAN region
Figure 28: Carbon dioxide emissions per capita in ASEAN Member States - metric tons of CO2 per capita
Figure 29: Growth trends of climate projects in ASEAN Member States
52
53
61
70
75
85
94
102
107
110
111
114
114
115
120

8
Table 1: Examples of climate initiatives outside the UNFCCC
Table 2: Availability of the LDCF and the SCCF for AMS
Table 3: Availability of the Adaptation Fund for AMS
Table 4: Availability of the Green Climate Fund for AMS
Table 5: Further information on the use of the funds
Table 6: Examples of available multilateral climate funds
Table 7: Examples of available bilateral climate funds
Table 8: ASEAN Member States in Climate Negotiating Groups and Climate Initiatives
Table 9: ASEAN agreements and initiatives relevant to climate change
Table 10: Selected socio-economic indicators for ASEAN Member States
Table 11: Brunei Darussalam’s national statistics
Table 12: Projected changes in temperate and precipitation
Table 13: Emissions Summary for Brunei Darussalam
Table 14: Brunei Darussalam’s INDC in sectoral breakdown
Table 15: Cambodia’s national statistics
Table 16: Observed and projected changes in temperature and precipitation
Table 17: Emissions summary for Cambodia
Table 18: Cambodia’s INDC in sectoral breakdown
Table 19: Indonesia’s national statistics
Table 20: Observed and projected changes in temperature and precipitation
Table 21: Emissions summary for Indonesia
Table 22: Indonesia’s INDC in sectoral breakdown
Table 23: Lao PDR national statistics
Table 24: Observed and projected changes in temperature and precipitation
Table 25: Emissions Summary for Lao PDR
Table 26: Lao PDR’s INDC in sectoral breakdown
30
47
47
48
48
50
51
55
58
62
63
63
64
65
67
67
68
70
72
72
73
76
78
78
79
81
LIST OF TABLES

9
Table 27: Malaysia’s national statistics
Table 28: Observed and projected changes in temperature and precipitation
Table 29: Emissions summary for Malaysia
Table 30: Myamnar’s national statistics
Table 31: Observed and projected changes in temperature and precipitation
Table 32: Emissions summary for Myanmar
Table 33: Myanmar’s INDC in sectoral breakdown
Table 34: The Philippines’ national statistics
Table 35: Observed and projected changes in temperature and precipitation
Table 36: Emissions Summary for the Philippines
Table 37: Singapore’s national statistics
Table 38: Observed and projected changes in temperature and precipitation
Table 39: Emissions summary for Singapore
Table 40: Thailand’s national statistics
Table 41: Observed and projected changes in temperature and precipitation
Table 42: Emissions summary for Thailand
Table 43: Thailand’s INDC in sectoral breakdown
Table 44: Viet Nam’s national statistics
Table 45: Changes in temperature and precipitation in Viet Nam
Table 46: Emissions summary for Viet Nam
Table 47: Viet Nam’s INDC in sectoral breakdown
Table 48: Germanwatch Global Climate Risk components in ASEAN for the 1995-2014 period
Table 49: Key vulnerable sectors to climate change in the ASEAN
Table 50: Overview of ASEAN Member States climate targets
Table 51: Climate Change strategic and institutional frameworks in among ASEAN Member States
82
82
83
87
87
88
90
92
92
93
96
96
97
100
100
101
104
105
105
106
108
111
112
116
119

10
In this chapter, we present an overview of up-to-date climate change evidence as well as its main drivers.We also elaborate on projected, future climatic changes and their expected environmental and socio-economic impacts both globally, and in the Southeast Asian region.
EVIDENCE OF CLIMATE CHANGE
The latest evidence of climate change was revealed by the Intergovernmental Panel on Climate Change(IPCC), within the framework of the Fifth Assessment Report (AR5) published in 2013 and 2014.
Box 1: The Intergovernmental Panel on Climate Change (IPCC) in a nutshell.
1. INTRODUCTION TO THE SCIENCE OF CLIMATE CHANGE AND LATEST FINDINGS
The IPCC, as an intergovernmental body, is the leading scientific body of climate change assess-ment at the international level. It was established by the United Nations Environment Programme(UNEP) and the World Meteorological Organization (WMO) in 1988 with the aim to gather andreview up-to-date knowledge on climate change and its socio-economic impacts. On its own, itdoes not conduct research or collect and assess data, but regularly gathers and reviews contri-bution from thousands of scientists worldwide. It assesses a variety of research outcomes andensures the provision of rigorous and policy-neutral scientific information to decision-makers.The work of the IPCC is coordinated by a Secretariat and supported by WMO and UNEP. Govern-ments also participate in the development of its work process and endorse the regularly pub-lished IPCC reports.
Source: IPCC website
Based on different scientific studies and observations, Working Group I (WG1) of the IPCC confirmedthat the “warming of the climate system is unequivocal, and since the 1950s, many of the observedchanges are unprecedented over decades to millennia” (IPCC AR5 WG1, 2013). The report also confirmed that “human influence has been the dominant cause of the observed warming since themid-20th century”, while also impacting other observed changes (IPCC AR5 WGR1, 2013). Observedglobal changes include increasing concentration of greenhouse gases (GHG) in the atmosphere, thewarming of the atmosphere and the oceans, rising sea levels, and diminishing snow and ice cover (IPCCAR5 WG1, 2013):
• Atmosphere: Between 1880 and 2012, the average combined land and ocean surfacetemperature increased by 0.85 degrees Celsius (°C) (Figure 1). Moreover, each of the lastthree decades have been successively warmer. There is a high probability that at the globallevel, the number of cold days and nights has decreased, while the number of warm daysand nights has increased. It is also likely that the frequency of heat waves has increasedin large parts of Europe, Asia and Australia. In addition, the frequency or intensity of heavyprecipitation has increased in North America and Europe.

11
Figure 1: Observed changes in surface temperature 1901-2012
Source: IPCC AR5 WG1, 2013
• Oceans: The surface level of the oceans (up to 700 m depth) has warmed 0.1°C over eachdecade since 1971, and it is likely that lower levels of the oceans (between 700-2000 mdepth) have also warmed since 1957. It was observed that the high salinity sea regionswill become more saline, while low salinity regions become less saline. The pH level ofocean surface water has decreased by 0.1 units since the beginning of the industrial ageand is causing acidification of the water.
• Sea level: The global average sea level has risen by approximately 0.19m between 1901and 2010, mainly due to the warming of the oceans and loss in glacier mass.
• Cryosphere: The ice cover in Greenland and the Antarctic has been diminishing over thelast three decades. It was found with high probability that the Arctic sea ice coverage decreased over the period 1979 to 2012 by 3.5 to 4.1% per decade. Over the same period,the annual mean Antarctic sea ice coverage increased between 1.2 to 1.8%, with the extent increasing in some regions and decreasing greatly in others. In the Northern Hemisphere, the snow cover has decreased in the months of March, April and June, whileArctic temperatures have increased since the mid-20th century.
DRIVERS OF CLIMATE CHANGE
The above-described climatic changes are caused by increasing energy uptake in the climate system,which can be measured by the level of radiative forcing (RF)1. As confirmed by the IPCC, the mainreason for the increasing RF is the increase in atmospheric concentration of GHGs (IPCC AR5, 2013).
1 Greenhouse gases (GHGs), such as carbon dioxide and methane, trap or absorb infrared radiation emitted from theEarth’s surface and re-emit radiant energy to the surface of the earth, thereby creating an energy imbalance

While GHGs occur naturally in the at-mosphere, and are essential formaking the earth livable, theamount of GHGs started to exceeddesirable levels as far back as thestart of the industrial revolution inthe 1750s. WGR1 of the IPCC’s AR5demonstrated that the increase inGHG emissions has been steadysince the 1750s2, and found thatthe most abundant gas is carbondioxide (CO2), as a result of fossilfuel combustion and cement pro-duction.
The cumulative anthropogenic CO2 emissions between 1750 and 2011 were 555 [470 to 640] giga-tonnes of carbon (GtC). Out of this, 67.6% can be linked to fossil fuel combustion and cement productionwhile 32.4% to deforestation and other land use change. Although 27.93% was absorbed by the oceanand 28.83% by the natural terrestrial ecosystems, 43.24% GtC accumulated in the atmosphere. Figure3 illustrates how these different activities come into play and affect the earth’s carbon cycle.
In the future, it is expected that more of the emitted anthropogenic CO2 will remain in the atmosphereas the absorption capacity of the oceans and terrestrial areas will be partially offset by climate change.Since the surface warming of the planet is caused by cumulative emissions of CO2, the observedchanges will persist for many centuries even if emissions of CO2 are considerably lowered or stoppedin the near future.
12
2 The atmospheric concentration of carbon dioxide (CO2), methane (CH4), and nitrous oxide (N2O) gases were 391 ppm,1803 ppb, and 324 ppb in 2011, and exceeded the pre-industrial levels by about 40%, 150%, and 20%, respectively.
Source: IPCC AR5 WGR3, 2014
Source: IPCC AR5 WGR1, 2013
Figure 2: Total annual anthropogenic GHG emissions(GtCO2eq/yr) 1970–2010
Figure 3: Simplified schematic of the global carbon cycle

13
GLOBAL CARBON EMISSIONS AND THE IMPACT OF INDCS
Studies assessing the 119 Intended Nationally Determined Contribution (INDCs) submitted by147 Parties prior to the Paris Agreement at the COP21, the pledges made in the INDCs will resultin a reduction of global emission as compared to the pre-INDC trajectories, these will not be sufficient to achieve a least-cost 2ºC pathway. The table below presents the key highlights fromthese reports:
Source: UNEP, 2015
Figure 4: Global GHG emissions under various scenarios and Emissions Gap in 2030
UNFCCC SynthesisReport
UNEP 2015 Emission Gap Report
Overall Emissions in 2030 in INDCscenario (Gt CO2e)
56.7
(53.1-58.6)
Conditional INDCs: 54 (52-57) Only Unconditionalpart of the INDCs: 56 (54-59)
Decrease in Emissions as compared to pre-INDC scenario (Gt CO2e)
3.6
(0.0-7.5)(4-6)
Emission gap from the 2°C pathway in 2030 (Gt CO2e)
15.1
(11.1-21.7)
Conditional INDCs: 12 (10-15)Only Unconditional part of the
INDCs: 14 (12-17)
Resulting temperature levelNo estimate
provided3°C by 2100

14
PROJECTIONS OF FUTURE CHANGES IN CLIMATE
As emissions continue to rise, further changes are expected by the end of the century (IPCC AR5, 2013).These may include:
• Atmosphere: It is very likely that global surface temperature will increase by 2°C by theend of the century. It is also expected that the contrast between wet and dry regions andseasons will increase.
• Oceans: Warming of the oceans will increase by the end of the century and will reachdeeper levels of the water, therefore affecting its circulation. Further carbon absorptionwill lead to further ocean acidification.
• Sea level: Average global sea levels will increase in more than 95% of the total ocean areaat a much higher rate compared to 1971-2010. Thus a 0.4 to 0.63cm average sea levelrise is predicted by the end of the century, and it is foreseen that 70% of all coastlines willbe affected by these increases.
• Cryosphere: Further decreases in the Arctic sea ice cover and the amount of spring snowin the Northern Hemisphere is expected. While AR5 assigned low probability for the decrease of the total sea ice extent and volume in the Antarctic, new scientific research,released in May 2014, has confirmed a massive glacier system loss in West Antarctica(National Geographic, 2014).
Figure 5: Maps of projected late 21st century annual mean surface temperature change, annual mean precipitation change
Source: IPCC AR5 WGR1, 2013

15
SOCIO-ECONOMIC IMPACTS OF CLIMATE CHANGE
Although the impacts will vary, climate change will affect most countries negatively in the comingdecades, and will affect the health and state of the physical, biological and human systems.
Figure 6: Observed impacts attributed to climate change for physical, biological, and human and managed systems
Source: IPCC AR5 WG2, 2014
Major observed and projected impacts include:
• Extreme weather events: In combination with other climatic changes, these events aremostly likely to affect those who live in coastal areas, and will especially aggravate the lifeof those in poor living conditions. In future, the frequency and the intensity of weather-in-duced natural disasters is expected to increase.
• Water stress: Due to changes in precipitation patterns, the global area affected by droughtshas been increasing since the 1970s. In certain areas of the Mediterranean, SouthernAfrica and parts of Southern Asia, overall precipitation has been declining, resulting inmore frequent drought events. Due to increases in temperatures in mountain areas, moun-tainous ice-packs have been shrinking in recent decades. These phenomena have a two-fold effect. First, it can reduce the available amount of freshwater for people living in theseareas and second, during summer months it can cause flash flood events due to the melt-ing of these ice-packs into the rivers.
• Biodiversity: Climate-induced changes have already been affecting various biologicalprocesses and species (e.g. earlier start of the spring season). If warming trends continue,many plant and animal species are expected to become extinct by the end of the century.
• Human health: Heat-, water- and food-related illnesses can increase due to climatechange. In addition, communicable diseases carried by mosquitoes (e.g. malaria, dengue)can reach parts of the world hitherto unaffected, as habitat patterns change.
• Agriculture: The yield levels of major crops, such as maize and wheat, have been decreas-ing since 1981 by 40mt/per year globally. According to IPCC calculations, a 1°C increase

16
in temperature will result in a 5% yield decrease in tropical, sub-tropical and temperateregions (IPCC AR5, 2013). Yields will be affected by various changes (e.g. rainfall patterns)but also by indirect changes (e.g. climate change-induced changes in biodiversity).
CLIMATE CHANGE AND ITS SOCIO-ECONOMIC IMPACTS IN SOUTHEAST ASIA
Southeast Asia is considered a highly vulnerable region to climate change and is already being affectedby sea level rises, extreme weather events and heat waves (IPCC AR5 WGII, 2014). In this section, wediscuss observed and predicted changes in the region as well as observed and projected environmentaland socio-economic impacts.
Observed and predicted changes in the climate of the Southeast Asian region include:
• Annual mean temperature: Observations since the 1960s have shown that each decadehas seen an average increase in temperature of 0.14°C-0.20°C (IPCC AR5 WGII, 2014).With regard to predicted future changes, the average temperate change in high-latitudeareas could increase by a range of 3-6°C by the end of the 21st century.
• Precipitation: Although regional and seasonal variations persist, increased precipitationcan also be observed in the region, with higher numbers of wet-day and extreme-rainfalldays (IPCC AR5 WGII, 2014). In the future, precipitation patterns will likely be more extremenear the centers of tropical cyclones.
• Extreme weather events: Increase in frequency of extreme events in the northern parts ofSoutheast Asia, although they have reportedly decreased in other countries, such as Myan-mar (IPCC AR5 WGI, 2014).
• Sea level rise: Due to the projected increase in seas levels, it is very likely that a millionpeople in the region will be exposed to an increased risk of flooding (IPCC AR5 WGII, 2014).
Fast population growth and related urbanization trends in the Southeast Asia region will put increasedpressure on natural resources, and make urban populations especially vulnerable to the impacts ofclimate change (ASEAN, 2007). As the national economies of the region rely heavily on their rich naturalresources and agricultural production, climate change has the potential to amplify socio-economic differences and decrease the political security of the region (IFAD, 2009).
Figure 7: Climate Change Vulnerability Map of Southeast Asia
Source: Yusuf andFrancisco, 2009

17
Major observed and projected impacts include:
• Water stress: The region is already affected by changes in rainfall patterns, droughts, floodsand cyclones. These changes severely impact the lives of the rural poor, who tend to lackadaptive capacity (IFAD, 2009). In the future, increased droughts as a result of changingprecipitation patterns and reduced snow-fed river flows may result in decreased food se-curity, more frequent forest fires, and increased exposure to infectious diseases (IPCC AR5WGII, 2014). Increases in population density, agricultural and industrial activities couldworsen water shortages. In addition, extreme rainfall events will cause further problems,by increasing the number of flooding events. While overall the region will be negatively im-pacted by water stress, localized impacts of climate change may be slightly positive, e.g.future water shortages may become less frequent in the Philippines (IFAD, 2009).
• Biodiversity: The region is rich in biodiversity and natural resources3. The ASEAN regionoccupies only 3% of the earth’s total surface but is home to over 20% of all known plant,animal and marine species, providing food, medicine, shelter, clothing and other biologicalgoods and ecosystems services to almost 600 million people in ASEAN (ASEAN, 2012).Coral reefs are prone to sea-temperature rise, while mangrove wetlands can be affectedby sea-level rise and changing rainfall patterns (IFAD, 2009). Changes in drought frequencyand patterns can influence flowering in lowland rainforests in the region (IPCC AR5 WG2,2005). Droughts may also negatively amplify the fragmentation of forests (IPCC AR5, WG1)and result in degradation of tropical forests, more frequent forest diseases and forest fires(IFAD, 2009). However, studies also found that forests and vegetation can also experiencepositive effects of climate change, e.g. Thailand’s total tropical forest cover may increase(IFAD, 2009). Overall, the degradation of ecosystems can seriously impact access to foodand water as well as to natural resources (e.g. timber) for commercial purposes (IPCC AR5WG2, 2005).
• Agriculture: Changing precipitation patterns will affect water quality and supply in the region, which will make irrigation systems more vulnerable. An increase in temperaturemay have various effects on crop yields. Moderate temperature increase (below 2 °C) maybe beneficial for rice yields in Indonesia and Malaysia, but would already negatively affectthe Philippines (IFAD, 2009). The sensitivity of major cereal and tree crops will mostly affect the rural poor, who rely on traditional agricultural methods and marginal lands (IFAD2009).
• Coastal areas: ASEAN countries have a total combined coastline length of 173,000 km,with 14% of the world’s marine fish population (IFAD, 2009). Due to geological and geographical characteristics, population increase and infrastructure developments, thecoastal zones of the region are highly prone to climate change. Major climatic changes include increases in sea-surface temperature and sea-levels, tidal variations, tropical cyclones and rainfall increase. These can negatively affect coastal and marine ecosystems,increasing the risk of coastal erosion and land loss, sea flooding and salinization of fresh-water, as well as result in coastal hazards and displacement of several million people.Risks are especially high in the delta regions of Bangladesh, Myanmar, Thailand and VietNam, as well as in the lower areas of Indonesia, Malaysia and the Philippines (IFAD, 2009).
Overall, the Southeast Asian region is set to be highly affected by future climatic changes, which willaffect the social and economic sectors of each nation in different ways. Observed and potential climatechanges and related socio-economic impacts at the national level are discussed in detail in Chapter 6.
3 40% of all world species live in the Southeast Asian forests, 35% of the mangrove forests, and about 30% of the coralreefs of the world are also found in the region. Indonesia, Malaysia and the Philippines together represent around 80%of global biological diversity. See Trevisan, J. (2013) The common framework for climate policy in South-East Asia, ICCGReflection No. 13/2013, International Center for Climate Governance, January 2013.

In this chapter we provide an overview of the development of global climate negotiations and theprocesses leading to the adoption of the Paris Agreement in December 2015. Major climate mecha-nisms and the role of party groupings in the negotiations are also discussed.
INTRODUCTION TO THE UNITED NATIONS FRAMEWORK CONVENTION ON CLIMATE CHANGE
Although it has been well-known since the 1960s that global average temperatures have been increas-ing, it was only in 1990 that the IPCC first confirmed global warming, and called for action to reversethe process.
The United Nations Framework Convention on Climate Change
The UN Framework Convention on Climate Change (UNFCCC) is an intergovernmental treaty developedto address the problem of climate change. The Convention, which sets out an agreed framework fordealing with the issue, was negotiated from February 1991 and was adopted at the June 1992 UN Conference on Environment and Development (UNCED) in Rio de Janeiro, Brazil, also known as the RioEarth Summit (UNFCCC, 2016b). The UNFCCC entered into force on 21 March 1994, 90 days after the50th country’s ratification had been received. As of 2016, 197 countries have ratified the Conventionand these are called Parties to the Convention. The ultimate objective of the Convention is to “stabilisegreenhouse gas concentrations in the atmosphere at a level that will prevent dangerous human interference with the climate system” (UNFCCC, 2016b).
The Conference of the Parties (COP), the main decision body of the UNFCCC, meets annually to reviewprogress and initiate further action. Since 2005, the COP also acts as the Meeting of the Parties to theKyoto Protocol (CMP)4 wherein all decisions related to the implementation of the Kyoto Protocol are undertaken. COPs are meant to be held in Bonn, Germany (where the UNFCCC Secretariat is based),unless a Party offers to host a session. Together with the COP Presidency, the session venue tends torotate between the main global regions: Africa, Asia, Eastern Europe, Latin America and the Caribbean,Western Europe and Others.
The permanent secretariat of the UNFCCC has been located in Bonn, Germany, since 1996. The sec-retariat provides organisational support and technical expertise to the UNFCCC negotiations and insti-tutions and facilitates the flow of authoritative information on the implementation of the Convention.
The COP is supported by two permanent subsidiary bodies. The Subsidiary Body on Scientific and Tech-nical Advice (SBSTA) provides information and advice on scientific and technological matters as relatingto the Convention while the Subsidiary Body for Implementation (SBI) develops recommendations toassist the COP in reviewing and assessing implementation of the Convention and in preparing and implementing its decisions. The SBSTA and SBI meet twice each year concurrently. One of these twoyearly meetings generally takes place in parallel with the COP.
18
2. GLOBAL CLIMATE NEGOTIATIONS
4 Further information on the Kyoto Protocol is provided in the later sections of this chapter.

19
In addition, a number of committees have been established to support the COP and international agree-ments linked to the UNFCCC (for example the Kyoto Protocol). These committees include the ComplianceCommittee of the Kyoto Protocol, the CDM Executive Board, the JI Supervisory Committee, the ClimateTechnology Centre and Network (CTCN), Adaptation Committee, Standing Committee on Finance, theLeast Developed Countries Expert Group, the Consultative Group of Experts on National Communica-tions from Parties not included in Annex I to the Convention (CGE), the Global Environmental Facility(GEF) and the Green Climate Fund (GCF).
Box 2: More information about the UNFCCC and the Kyoto Protocol
• UNFCCC website: It includes a variety of information, providing essential background information, the mechanisms and latest developments. It also gathers country communica-tions, submissions and presents emissions data.
URL: www.unfccc.int
• UNFCCC handbook: Published in 2006, it provides an overview of the processes of interna-tional climate change negotiations and activities related to the implementation of the Convention, including adaptation to climate impacts, mitigation of climate change, finance,technology transfer, capacity-building, and reporting.
URL: unfccc.int/resource/docs/publications/handbook.pdf
• IPCC website: As the leading scientific body on climate change, it includes a wealth of infor-mation on the activities of its working groups, and provides access to its assessment reportsand publications, which serve as the scientific bases for UNFCCC negotiations and aims tosupport policy and decision-makers.
URL: www.ipcc.ch
• Training materials of the Consultative Group of Experts on National Communications fromParties not included in Annex I to the Convention (CGE) are gathered on the UNFCCC websiteto facilitate the preparation of national communications by non-Annex I Parties. This collec-tion of documents offers guidance on vulnerability, mitigation and adaptation assessmentsas well as on GHG inventories.
URL:unfccc.int/national_reports/non-annex_i_natcom/training_material/methodological_documents/items/349.php
• Climate Change Information Network (CC:iNet): Hosted by the UNFCCC website, it serves asa clearing house mechanism to the Parties and provides them with a variety of materialspromoting education, training and awareness-raising.
URL: unfccc.int/cc_inet/cc_inet/items/3514.php
THE KYOTO PROTOCOL
The first meeting of the Conference of Parties (COP1), was held from 28 March to 7 April 1995 in Berlin,Germany. At COP1, Parties expressed concern over the adequacy of commitments to mitigate climatechange through addressing anthropogenic emissions by source and removals by sinks of all greenhousegases as contained in Article 4 of the Convention. Parties adopted a decision (Decision 1/CP.1) establishing the formation of an open-ended Ad hoc Group on the Berlin Mandate (AGBM). This begana process to strengthen the commitments of Annex I Parties to reduce GHG emissions beyond the year2000 through the adoption of a protocol or other legal agreement. From September 1995 to October
20
1997 and over 8 negotiation sessions of the AGBM, a total of 44 countries submitted over 94 documents to the AGBM on methodologies, formulae, indicators relating to levels of emission reductions, policies and measures and elements of the protocol or legal agreement5.
At COP3 held from 1-11 December 1997 in Kyoto, Japan6, a specific committee, Committee of theWhole (COW) was created to deal with the negotiations of the draft texts of the Protocol. Key issues inthe negotiations were institutions and mechanisms of Joint Implementation, CDM and Emissions Trading, and the Quantified Emission Limitation and Reduction Objectives (QELROs).
At the closing plenary, the Kyoto Protocol submitted by the COW was unanimously adopted. Under theProtocol, overall emissions of 38 industrialised countries, referred to as Annex I Parties, would be reduced by at least 5% below 1990 levels over the period 2008-2012 or 30% below projected levels.The range of emission reduction commitments for Annex I Parties ranged from +10% to –8% below1990 levels. Each Party was accordingly allocated a number of emission units, called AssignmentAmount Units (AAUs). One AAU is equivalent to 1 tonne of CO2. For example, Canada’s reduction targetwas 6% below the 1990 emission level of 457 million tonnes, and thus allocated a total of 430 millionAAUs each year.
As a result of the United States’ non-ratification7, the emission reduction pledges of the remaining 37developed nations and economies in transition were reduced to an average of 4.2% below 1990 levels.
Doha Amendment to the Kyoto Protocol
Following the entry into force of the Kyoto Protocol in May 2005, the first meeting of the Conference ofthe Parties serving as the Meeting of Parties to the Kyoto Protocol (CMP1) was held in conjunction withCOP 11 from 28 November to 9 December 2005, in Montreal, Canada. In according with Article 3 ofthe Protocol (UNFCCC, 2016c), the CMP1 established an Ad Hoc Working Group on Further Commit-ments for Annex I Parties under the Kyoto Protocol (AWG-KP) to negotiate a second commitment periodto the Kyoto Protocol. After 7 years and many rounds of negotiations, and overcoming key issues suchas emission reduction targets, length of the second period and carrying over of unused emission creditsinto the second period, the COP in December 2012, adopted the Doha Amendment to the Kyoto Protocol(UNFCCC, 2016d). Under the Doha Amendment, developed countries pledged to reduce their GHGemissions by at least 18% by 2020 below 1990 levels.
As of 3 May 2016, 65 countries had ratified the Doha Amendment, while a total of 144 instruments ofacceptance are required for the Amendment’s entry into force.
Mechanisms under the Convention and the Kyoto Protocol
While the Kyoto Protocol requires developed countries to reduce their emissions, it is also importantthat these reductions are achieved in the most economically effective manner. For example, for a coun-try that has already adopted low carbon technology, it may be more expensive to reduce additionalemissions as compared to a developing country where such opportunities may be available for a lowermarginal cost.
Based on this understanding, three mechanisms have been introduced under the Kyoto Protocol:
• Emissions trading: Defining GHG emissions as a commodity allows countries to sell permitted, but not used, emissions to other countries. Apart from this, countries can also
5 See UNFCCC (1996) Implementation of the Berlin Mandate: Comments from Parties, Note from the Secretariat, Addendum, Ad Hoc Group on the Berlin Mandate at its Fourth Session, Geneva, 9-19 July 1996, UN Doc.FCCC/AGBM/1995/MISC.1/Add.2
6 UNFCCC (1998) Report of the Conference of the Parties on its Third Session, Kyoto, 1 to 11 December 1997, UN Doc.FCCC/CP/1997/7.
7 See Kirby A. (2001) “US blow to Kyoto hopes”, BBC News, 28 March 2001.

21
trade in removal units from land use, land-use change and forestry (LULUCF), such as reforestation, and from specific emission reduction projects via the Joint Implementationand CDM. To date, the largest emission trading scheme is operated by the European Union.As of 2016, there are more than 19 emission trading systems (ETS) currently operating atsupranational, national, regional and local levels. These include ETS in China, Kazakhstan,Republic of Korea, New Zealand and states such as California, Quebec and cities such asTokyo (IETA, 2016).
• Joint Implementation (JI): This mechanism is defined in Article 6 of the Kyoto Protocol, allows a country with an emission reduction or limitation commitment under the KyotoProtocol (Annex B Party) to earn emission reduction units (ERUs) from an emission-reduc-tion or emission removal project in another Annex B Party, each equivalent to one tonneof CO2, which can be counted towards meeting its Kyoto target. Joint implementation offersParties a flexible and cost-efficient means to fulfil a part of their Kyoto commitments, whilethe host Party benefits from foreign investment and technology transfer.
• Clean Development Mechanism (CDM): The CDM supports emissions reduction projectsin developing countries by providing such projects with certified emission reduction (CER)credits, which can then be traded or sold. By purchasing CERs, developed countries areallowed to a meet a part of their own emission reduction targets under the Kyoto Protocol.As of 2016, CERs equivalent to emission reductions of more than 1.6 billion tons of CO2
equivalent were issued with China, India and the Republic of Korea, the top 3 countrieswith issued CERs (UNEP DTU, 2016).
At the same time, in order to further support developing countries in action against climate change,the UNFCCC has created three additional mechanisms:
• Technology Mechanism: This aims to promote technology development and support technology transfer that enables climate change mitigation and adaptation in developingcountries. Established in 2010, the mechanism is being implemented by the TechnologyExecutive Committee (TEC) and the CTCN. To identify the priority technology needs of developing countries, Party-driven technology needs assessments are carried out, involving different stakeholders.
• Reducing emissions from deforestation and forest degradation and the role of conserva-tion, sustainable management of forests and enhancement of forest carbon stocks in developing countries (REDD+): REDD+ targets developing countries and aims to promoteemission reductions in the forestry sector by addressing deforestation and supporting sustainable forest management. By assigning market value to the carbon stored in forests,it provides incentives to developing countries to implement mitigation projects in the forestsector. Most recently, within the Warsaw Framework for REDD+, decisions were adoptedat COP19 with regard to implementation, financing, monitoring, verification and reportingof the mechanism.
• Warsaw International Mechanism for Loss and Damage associated with Climate ChangeImpacts (WIM): Established at COP19 in Warsaw, this mechanism aims to promote integrated approaches to address loss and damages resulting from climate change impacts in developing countries. It aims to build knowledge on managing climate risks,strengthening co-operation among various stakeholders, and promoting and enhancingdisaster risk management actions. To guide the implementation of the Mechanism, theCOP established an Executive Committee for it in Warsaw. The mechanism is planned toundergo review at the COP22 in November 2016.

22
Box 3: More information about the UNFCCC mechanisms
Emissions Trading:
• UNFCCC website on emissions trading.
URL: unfccc.int/kyoto_protocol/mechanisms/emissions_trading/items/2731.php
• UNCTAD: International Rules for Greenhouse Gas Emissions Trading. Defining the principles,modalities, rules and guidelines for verification, reporting and accountability.
URL: unctad.org/en/Docs/pogdsgfsbm6.en.pdf
• The European Commission: The EU Emissions Trading System.
URL: ec.europa.eu/clima/publications/docs/factsheet_ets_en.pdf
Joint Implementation:
• The UNFCCC website on Joint Implementation.
URL: ji.unfccc.int/index.html/
• French Inter-ministerial Greenhouse Gas Mission: Climate Change: Guide to the Kyoto Pro-tocol Mechanisms. The Joint Implementation mechanism.
URL: www.ffem.fr/webdav/site/ffem/shared/ELEMENTS_COMMUNS/U_ADMINISTRA-TEUR/ 5-PUBLICATIONS/Changement_climatique/GuideC_projets_Kyoto_angl.pdf
Clean Development Mechanism (CDM):
• UNFCCC website on CDM.
URL: cdm.unfccc.int
• The Clean Development Mechanism: A review of the First International Offset Program pre-pared for the Pew Center on Global Climate Change.
URL:www.c2es.org/docUploads/clean-development-mechanism-review-of-first-international-offset-program.pdf
Technology Mechanism:
• UNFCCC Technology Information Clearing House.
URL: unfccc.int/ttclear/pages/home.html
REDD+:
• REDD Web Platform.
URL: unfccc.int/methods/redd/redd_web_platform/items/4531.php
• FIELD: Guide for REDD+ negotiators.
URL: www.field.org.uk/guides/guide-for-redd-plus-negotiators-august-2013
• REDD+ Partnership website.
URL: reddpluspartnership.org/en/
Warsaw International Mechanism for Loss and Damage associated with Climate Change Impacts:
• UNFCCC introduction.
URL: unfccc.int/adaptation/workstreams/loss_and_damage/items/8134.php

23
Compliance with the Convention and Kyoto Protocol
Articles 4 and 12 of the Convention require all Parties, taking into account their Common But Differen-tiated Responsibilities and Respective Capabilities (CBDR-RC), to communicate information related toimplementation of their climate targets. These include a national inventory of anthropogenic emissionsby source and removals by sinks of all greenhouse gases not controlled by the Montreal Protocol; general description of steps taken or envisaged by the Party to implement the Convention; and any other information that the Party considers relevant to the achievement of the objective of the Convention8. These national communications were to be submitted by Annex I Parties every 4 yearsfollowing decisions for each submission by the COP.
Similarly, the Kyoto Protocol imposed two regular, on-going reporting requirements for Annex I Parties:an annual report and a periodic national communication. In both cases, Parties were to submit the information elements as required by the Convention and include additional information related to theimplementation of the Kyoto Protocol, as well as support developing countries in their mitigation andadaptation activities through technology transfer and financial assistance.
At COP16 in Cancun, as part of the Cancun Agreements9, it was decided that developed country Partiesshould enhance reporting in national communications and submit biennial reports, which outlineprogress in achieving emission reductions and the provision of financial, technology and capacity-build-ing support to non-Annex I Parties, building on existing reporting and review guidelines, processes andexperiences. Decision 1/CP.16 also established a new process, international assessment and review(IAR), under the Subsidiary Body for Implementation (SBI) that aims to promote the comparability of efforts among all developed country Parties with regard to their quantified economy-wide emission limitation and reduction targets.
For developing countries, reporting is now implemented through national communications (NCs) andbiennial update reports (BURs). Developing country Parties are required to submit their first NC within3 years of entering the Convention, and every 4 years thereafter.
The first BUR should be, consistent with the Party's capabilities or level of support provided, submittedby December 2014, and every 2 years thereafter. LDC Parties and SIDS can submit BURs at their owndiscretion. These BURs will be subject to a process called International Consultation and Analysis (ICA),also under the purview of the SBI.
The secretariat, the IPCC, the Consultative Group of Experts on National Communications from Partiesnot included in Annex I to the Convention (CGE), and related external sources provide tools and materialsto facilitate measuring, reporting, and verification in developing countries in accordance with the guide-lines to the Convention.
• The Work Programme of the Mechanism.
URL: unfccc.int/adaptation/workstreams/loss_and_damage/items/6056.php
• GermanWatch: Roadmap to Relevance for the Warsaw International Mechanism.
URL: www.lossanddamage.net/4952
8 United Nations (1992) United Nations Framework Convention on Climate Change UN Doc. FCCC/INFORMAL/84/Rev.1,9 May 1992, Articles 4 and 12.
9 UNFCCC (2010) Decision 1/CP.16, The Cancun Agreements: Outcome of the work of the Ad Hoc Working Group on Long-term Cooperative Action under the Convention, UN Doc. FCCC/CP/2010/7/Add.1, 15 March 2011.

24
Assessment of the Kyoto Protocol
Since it came into force in 2005, the Kyoto Protocol has attracted a number of viewpoints with regardsto its achievements and effectiveness. In 1998, Tom Wigley, a renowned climate scientist, called theProtocol an important first step while pointing out that much more must be done after Kyoto to reducefuture global warming by a significant amount (Wigley, 1998). In 2015, Climate Home concluded thaton a technical level, the Kyoto Protocol has seen dramatic developments that it can account for10. TheKyoto Protocol’s main achievements include: introduction of a multinational carbon market; delivery ofnew rules for reporting, accounting and verifying emissions; support to poorer countries through theestablishment of the Adaptation Fund; incentivising green investments in the developing world; andthe institution of rules-based architecture. All of these achievements have influenced the creation oflow carbon legislation across the world – notably the UK’s 2008 Climate Change Act.
On the occasion of the 10th anniversary of the Kyoto Protocol, the UNFCCC Executive Secretary Chris-tiana Figueres said that it was a remarkable achievement and that she is “... convinced that withoutthe Kyoto Protocol and its various mechanisms we would not be as far forward as we are today in respectto, for example, the growing penetration of renewable energies. Its vision has also assisted in spawningnew and innovative initiatives like supporting developing countries to reduce emissions from deforesta-tion and forest degradation”11.
In contrast, critics of the Protocol have noted that while Kyoto Protocol was adopted as an internationallybinding agreement, its binding nature is rather limited and virtual in practice (Morel & Shishlov, 2014).This is evident from United States’ non-ratification early in 2001 and Canada’s withdrawal from theProtocol in December 2011 to avoid penalties amounting to USD14 billion for noncompliance with itsemission reduction target12.
The large majority of the Kyoto Protocol signatories can claim some success since the total greenhouseemissions for 36 Parties at the end of that first commitment period were 22.6% lower than the 1990base year. But as critics have since pointed out, this overachievement came about with little or no effort.Prior to and in the negotiation years of the Protocol, emissions in the Eastern European countries werefalling dramatically following the breakup of the Soviet Union. With a target of about 4% below the 1990base year, much of the overall emission reductions took place before the Protocol was signed (the socalled “hot air” emissions). For example, by 2010, Russia's CO2 emissions were 34% lower than in thebase year and Ukraine's had fallen by 59% (Schiermeir, 2012). The United Kingdom’s 12.6 % GHG reduction target was also easily met through gas from the North Sea and closure of coal mines.
The global impact of the Kyoto Protocol has also been questioned. In the 1990s, the emissions of KyotoProtocol countries were at about 33% of world emissions. With the United States’ refusal to ratify theProtocol and Canada, Japan, New Zealand and the Russian Federation not taking on reduction targetsin the second commitment period, the remaining 34 will account for only 15% of the global emissions.Furthermore, in spite of the Kyoto Protocol countries reducing their emissions, overall global emissionshave soared. Data provided by the World Resources Institute (WRI) (Freidrich and Damassa, 2014)shows that global CO2 emissions in 2011 were by 39% higher than they were in year 2000. Most ofthe increases came from China, India and the United States – the top three emitters who are not boundby emissions reduction under the Protocol.
10 King, E. (2015) “Kyoto Protocol: 10 years of the world’s first climate change treaty”, Climate Home, 16 February 2015.URL: http://www.climatechangenews.com/2015/02/16/kyoto-protocol-10-years-of-the-worlds-first-climate-change-treaty/
11 UNFCCC, ‘Kyoto Protocol 10th Anniversary: Timely Reminder Climate Agreements Work’, Press Release, 13 February2015. Available online at: http://newsroom.unfccc.int/unfccc-newsroom/kyoto-protocol-10th-anniversary-timely-reminder-climate-agreements-work/
12 CBC News (2011) “Canada pulls out of Kyoto Protocol”, 12 December 2011. URL: http://www.cbc.ca/news/politics/canada-pulls-out-of-kyoto-protocol-1.999072

25
Figure 8: Trends in regional contribution towards global CO2 emissions
13 UNFCCC (2008) Decision 1/CP.13, Bali Action Plan, UN Doc. FCCC/CP/2007/6/Add.1*, 14 March 2008, para. 1.
CO2 Emissions Excluding LUCF (MtCO2)
CO2 Em
issions Excluding LUCF (M
tCO2 )
Asia Europe Africa OceaniaLatin America & the CaribbeanNorthem America
31853
30000
28000
26000
24000
22000
20000
18000
16000
14000
12000
10000
8000
6000
4000
2000
01960 1970 1980 1990 2000 2011
Source: Freidrich, J. & Damassa, T., 2014
IN SEARCH OF THE NEXT CLIMATE AGREEMENT – THE ROAD TO PARIS
Following the entry into force of the Kyoto Protocol in 2005, Parties began negotiating the way forwardpost-2012 at COP13 in Bali. One of the key outcomes from subsequent COPs was the Bali Action Plan(BAP) under which a subsidiary body termed Ad Hoc Working Group on Long Term Cooperative Action(AWG-LCA) was created. The objective of this body was “… to launch a comprehensive process to enablethe full, effective and sustained implementation of the Convention through long-term cooperative action,now, up to and beyond 2012…” with the goal of reaching an ‘agreed outcome’ in 200913.
While in 2009, COP 15 in Copenhagen was unable to lead to a legally binding outcome, the end resultwas a political agreement negotiated amongst the heads of states of the US, China, India, Brazil andSouth Africa. The “Copenhagen Accord” included recognition of: “… the scientific view that the increasein global temperature should be below 2 degrees Celsius”; Annex I (developed) countries’ “commitmentto implement” economy-wide emissions targets for 2020, and non-Annex I (developing) countries toimplement nationally appropriate mitigation actions (NAMAs); for the period 2010-2012, a collectivecommitment of developed countries to provide new and additional resources approaching USD 30 billion; and achieve collective mobilization of USD 100 billion per year by 2020.
In 2010 at COP16 in Cancún, governments adopted the Copenhagen Accord and agreed to limit globaltemperature increases below 2°C, by reducing global GHG emissions. This commitment is challenging,especially in the light of the recently released IPCC report (IPCC AR5, 2013), which suggests that halfof the cumulative (or historical) “CO2 emissions budget” that would allow the limiting of global warmingto below 2°C, had already been used up by the end of 2011.

26
Figure 9: Carbon budget
Source: University of Cambridge, Program for Sustainability and Leadership
To accelerate climate actions for keeping global warming below 2°C, in 2011 at COP17 Durban, theParties to the Convention established the basis for creating a new international emissions reductionprotocol. This was done by setting up an Ad Hoc Working Group on the Durban Platform for EnhancedAction (ADP). The ADP worked in two streams. The first workstream aimed to develop the text of thethen so-called 2015 Agreement, a “protocol, another legal instrument or an agreed outcome with legalforce” under the Convention that would be adopted by the Parties at COP21 in Paris, France and enterinto force in 2020. The second workstream focused on enhancing mitigation actions prior to 2020, before the new 2015 Agreement enters into force.
In 2012 at COP18 in Doha and in 2013 at COP19 in Warsaw, and at the intersessional meetings inBonn, Germany, negotiations under Workstream 1 took place under plenary sessions, roundtable discussions, informal consultations and contact groups, focusing on areas such as the application ofConvention principle of common but differentiated responsibility, national circumstances, nationally-determined mitigation commitment, Means of Implementation (MOI)14, balance between mitigationand adaption and transparency in action and support in the new agreement. Under Workstream 2,discussion focused on issues such as initiatives to increase ambition and means of implementation to increase ambition.
The Doha Climate Gateway set out a timetable for the 2015 Agreement, streamlined the negotiationsin focus of the new agreement, acknowledged the need for both ambitious mitigation activities and in-creased adaptation measures and launched a new commitment for the developed countries under theKyoto Protocol for the period 2013-202015.
14 Means of implementation include finance, technology development and transfer, and capacity building.15 See UNFCCC (2016f) The Doha Climate Gateway. URL: http://unfccc.int/key_steps/doha_climate_gateway/items/
7389.php

27
In COP 19 in Warsaw, Parties decided to prepare the draft of the new climate agreement by December2014 and finalise it by May 2015. They emphasised the role of national-level activities and agreed tolaunch domestic preparations for putting forward their commitments by the end of 2014. They also decided to accelerate mitigation actions until 2020, to improve the transparency of long-term climatefinancing, to establish the Warsaw Framework for REDD+ and the Warsaw International Mechanismfor Loss and Damage, to support developing countries especially affected by the impacts of climatechange. A major milestone of the negotiation process reached in the final minutes of the ADP plenaryat COP19 (IISD, 2013) was a change in the Parties’ mitigation pledges – from nationally determinedmitigation commitments, a term that had been used in previous negotiations and in Parties’ submis-sions to the ADP in 2013 – to intended nationally determined commitments (INDCs).
In 2014 at COP20 in Lima, then IPCC Chair Rajendra Pachauri provided negotiators with a timely reminder from the IPCC’s Fifth Assessment Report (AR5) on GHG emissions in which he stressed thatthe goal to remain below the 2°C target will require that GHG emissions decline by 40-70% by 2050,relative to 2010 levels, and reach zero or negative levels by 2100. Under the ADP, Parties worked on anon-paper on elements for a draft negotiating text and a single draft decision on advancing the DurbanPlatform for enhanced action put forward by the co-chairs. The information and processes required forsubmission of INDC featured prominently in the negotiating of the draft decision. The issues on differ-entiation, means of implementation and inclusion of terms “evolving responsibilities” and “parties ina position to do so”, and loss and damage remained unresolved through the negotiation sessions onthe draft decision and negotiating text.
In addition to the adoption of the 37-page draft text of the Paris Agreement16, the major outcome wasthe Lima Call for Climate Action17. A key feature in the Lima Call for Climate Action was that it reflectedconsensus in dealing with adaptation. The COP affirmed its determination to strengthen adaptationaction through the protocol, another legal instrument or agreed outcome with legal force under theConvention to be adopted at COP21 and urged developed country parties to provide and mobilise enhanced financial support to developing country parties for ambitious mitigation and adaptation actions.
The 37-page Lima text grew to a 90-page document at the conclusion of the intersessional negotiationsession held in Geneva, Switzerland in February 201518. Through the hard work and dedication of Parties and facilitators in consolidating and streamlining the Geneva Text during the subsequent 3 negotiating sessions in Bonn, Germany, the final draft agreement text and COP decision text were completed on 23 October 201519.
The Paris Climate Change Conference convened from 29 November to 13 December 2015 in Paris,France, and was attended by over 23,100 government officials and 9,400 representatives from UNbodies and agencies, intergovernmental organisations and civil society organisations (IISD, 2015).World leaders attended an event on 28 November to demonstrate support for a successful global climate agreement.
Negotiations on the key areas of the agreement text such as mitigation, adaptation, loss and damage,finance, technology development and transfer, capacity building, transparency, global stocktake andcompliance and associated COP decisions were organized through spin-off groups. Facilitators for eachspin-off group reported to an ADP contact group each morning on the progress made. Parties were able
16 See ADP 2-7 agenda item 3. Elements for a draft negotiating text. Version 2 of 10 December 2014 at 06:30. URL:https://unfccc.int/files/meetings/lima_dec_2014/in-session/application/pdf/adp2-7_3_10dec2014t_np.pdf
17 See UNFCCC (2014) Decision 1/CP.20, Lima Call for Climate Action, UN Doc. FCCC/CP/2014/10.Add.1. URL: http://un-fccc.int/resource/docs/2014/cop20/eng/10a01.pdf#page=2
18 See UNFCCC (2015) Work of the Contact Group on Item 3: Negotiating text, Advance unedited version 12 February 2015. 19 See UNFCCC (2015b) Draft agreement and draft decision on workstreams 1 and 2 of the Ad Hoc Working Group on the
Durban Platform for Enhanced Action, Work of the ADP contact group. Edited version of 6 November 2015, UN Doc.ADP.2015.11.InformalNote.

28
to reduce and to some extent resolve gaps in their positions and adopt draft ADP draft conclusionswhich included the draft agreement and decisions on Workstream 1 and Workstream 2 by 5 December2015.
On the evening of 5 December, the ADP draft agreement and associated decisions were presented toCOP21. Parties agreed on the mode of work and the formation of Comité de Paris, an open-endedgroup, presided over by the COP21 President, to reach compromise on the draft text. Four informal ministerial consultations, referred to as indabas, were formed under the Comité de Paris to addresskey areas of the agreement, namely: support, facilitated by Emmanuel Issoze-Ngondet (Gabon) andJochen Flasbarth (Germany); differentiation in the context of mitigation, transparency and finance, including pre-2020 finance, facilitated by Izabella Teixeira (Brazil) and Vivian Balakrishnan (Singapore);and ambition, long-term objectives and periodic review, facilitated by Pa Ousman (The Gambia) andAmber Rudd (UK). On 7 December, additional indabas on: adaptation, and loss and damage, led byRené Orellana (Bolivia) and Åsa Romson (Sweden); cooperative approaches and mechanisms, led byCatherine McKenna (Canada) and Raymond Tshibanda N’Tungamulongo (Democratic Republic of theCongo); and forests, led by Daniel Vicente Ortega Pacheco (Ecuador), Doris Leuthard (Switzerland) andHenri Djombo (Republic of the Congo).
Eventually, Parties were able to find convergence and the Paris Agreement and associated COP21 decision was adopted by the COP on 12 December 2015. Under Decision 1/CP.21, the COP has estab-lished the Ad Hoc Working Group on the Paris Agreement (APA) to prepare for the entry into force of theAgreement and to oversee the implementation of the work programme resulting from the relevant requests contained in the decision. Under Article 16, the COP will serve as the meeting of the Partiesto the Paris Agreement. Parties to the Convention that are not Parties to Paris Agreement may partici-pate as observers in the proceedings of any session of the Conference of the Parties serving as themeeting of the Parties to this Agreement (CMA) but shall not take any decisions.
THE ROLE OF PARTY GROUPINGS IN THE CLIMATE NEGOTIATIONS
In this subchapter we provide an introduction to major negotiation and regional interest groupings atthe UNFCCC negotiations as well as giving an overview of the climate co-operation among the ASEANcountries.
Groupings in the Climate Change Negotiation Process
While Parties to the Convention and the Kyoto Protocol are typically represented by their respective na-tional delegations comprised of officials representing and negotiating on behalf of their government,Parties can also choose to group and organise themselves regionally or by interest.
Under the United Nations, Parties are organized into 5 regional groups, mainly for the purpose of elect-ing the Bureau, namely: African States, Asian States, Eastern European States, Latin American and theCaribbean States, and the Western European and Other States20 (UNFCCC website).
Parties have organised themselves in other groupings which can be issue-specific, institutionalised orpolitical to present substantive interests including their own. These groups can effectively promote theviewpoint of member countries as well as play a major role in building consensus at the negotiations.Coalitions can also help give voice to points of views that might otherwise be overshadowed or neg-lected. The membership is not exclusive and one country can be a member of more than one group.
Overview of negotiating coalitions
Over the last 2 decades of the climate negotiations, several significant groups have been establishedto represent common interest of its members (UNEP, 2007). Major coalitions include:
20 The "Other States" include Australia, Canada, Iceland, New Zealand, Norway, Switzerland and the United States of America,but not Japan, which is in the Asian Group.

29
• Group of 77 and China (G-77 and China): As the largest coalition in the UN, it provides aplatform for 133 developing countries. The group meets before the regular UN sessionsat ministerial meetings and agrees on the viewpoints to be represented. Many of its mem-ber countries also take part in other, smaller coalitions, such as the African Group, Allianceof Small Island States (AOSIS) or the group of LDCs.
• European Union (EU): As a regional political and economic organisation, the EU consistsof 28 Member States (MS) from Europe. As well as its MSs, the EU itself is a party to theConvention, although without voting rights. During the negotiations, the EU is responsiblefor representing the interest and common position of its MSs as well as for ratification ofnew international agreements.
• Environmental Integrity Group (EIG): It includes Mexico, the Republic of Korea and Switzer-land and the mini-states of Lichtenstein and Monaco and is operational since 2000.
• African Group: It includes 53 countries from Africa. The group is diverse as it includes moredeveloped countries, oil-exporters as well as many of the LDCs. Therefore their negotiationinterest may differ considerably. In recent years the Group has become more effective andproactive and it has advocated for financing developing countries and for preparing alegally-binding agreement by 2020.
• Alliance of Small Island States (AOSIS): A coalition of 44 low-lying coastal states and smallisland countries, representing approximately 5% of the global population. These countriesare in different parts of the world but all face similar environmental, geographic, socialand economic challenges. They are all vulnerable to sea-level rise. An ad-hoc lobbyinggroup, it is represented at the negotiations by the chairperson or the vice-chairperson.
• Least Developed Countries (LDCs): The group includes those countries that are definedby the UN system as least developed states with low-income and weak human and economic capital. Many of the LDC countries are especially vulnerable to climate change,but lack resources for adequate adaptation activities. Currently there are 48 countries inthe group with more than half from Africa and the rest from Asian countries or Small IslandDeveloping States (SIDS).
• Umbrella Group: A loose coalition consisting of the non-EU developed countries, includingusually Australia, Canada, Iceland, Japan, New Zealand, Norway, the Russian Federation,Ukraine and the US. The members also frequently speak individually, but in their jointstatements they usually promote the view that developing countries should also adoptlegally-binding commitments.
• Like-Minded Developing Countries on Climate Change (LMDC): the group was establishedin 2012 by China, Ecuador, Egypt, India, Malaysia, Nicaragua, Pakistan, the Philippines21,Saudi Arabia, Thailand and Venezuela. Since then other G77 and China group membershave also joined the group and now it has approximately 20 members.
• High Ambition Coalition: This coalition was the master plan of Europe and its allies conceived over the course of 2015. EU Climate Action and Energy Commissioner, MiguelArias Cañete, led the outreach efforts, building a broad coalition of developed and devel-oping countries in favour of high ambition that shaped the successful outcome of the Parisconference.
21 The Philippines government announced its departure from the LMDC at a press conference at the Lima COP20 in 2014,reportedly wanting more flexibility in its negotiating positions. See Bello, W., ‘The Dilemmas Faced by Climate-VulnerableDeveloping Countries’, Counter Punch, 20 January 2015. URL: http://www.counterpunch.org/2015/01/20/the-dilem-mas-faced-by-climate-vulnerable-developing-countries/. See also Pearce, R., ‘Infographic: Mapping country alliances atthe international climate talks’, 10 December 2014, Carbon Brief. URL: http://www.carbonbrief.org/infographic-map-ping-country-alliances-at-the-international-climate-talks

30
In addition to major party groupings, there are also several regional and other interest groups, whichact on a more ad-hoc basis. These do not necessarily form official negotiation groups but they mayissue joint statements, promote common interests and support each other’s views.
Box 4: Other regional interests groups at the negotiations
AILAC: Independent Alliance of Latin America and the Caribbean
ASEAN: Association of Southeast Asian Nations
BASIC: Brazil, South Africa, India and China
BRIC: Brazil, Russia, India and China
CACAM Group: Countries from Central Asia and Caucasus, Albania and Moldova
GRULAC: Countries from Latin America and the Caribbean, including many Middle Income Countries and vulnerable SIDS
League of Arab States: Regional organization of North African and Middle Eastern Arab countries
OPEC: Organization of Petroleum Exporting Countries22
Intergovernmental Agency of the Francophonie: French-speaking countries
22 Including Qatar Indonesia, Libya, the United Arab Emirates, Algeria, Nigeria, Ecuador, Gabon and Angola.
Source: UNFCCC website and UNEP, 2007
Besides the UNFCCC party groupings, a variety of joint climate initiatives have been formed, bringingtogether countries with similar climate interests and objectives (Widerberg and Stenson, 2013). Although these are more flexible mechanisms, which operate on a voluntary basis, they may contributeto the development of the 2015 agreement by setting examples for ambitious commitments and actionsand by creating an enabling environment at the national level.
Table 1: Examples of climate initiatives outside the UNFCCC
Type of co-operation Initiatives
Country co-operations
G7/G8
G20
Asia-Pacific Economic Co-operation (APEC)
Energy partnershipsREN21
Renewable Energy and Energy Efficiency Partnership (REEEP)
Emissions reductionpartnerships
Climate and Clean Air Coalition (CCAC)
Coalition for Rainforest Nations
Carbon Sequestration Leadership Forum (CSLF)
Global Methane Partnership
International Partnership on Mitigation and Measurement Reporting and Verification (M-MRV)
LEDS Global Partnership
REDD+ Partnership

31
THE ROLE OF PARTY GROUPINGS
Over the last 2 decades many party groupings have been successful in working together on climateagreements. The EU has been traditionally effective in promoting its initiatives and often played a majorrole in moving the negotiations forward. The Environmental Integrity Group (EIG) ensured representationof its members at closed-door, smaller group negotiations on different occasions. The OPEC countries,although they have not formed an official bloc, often take a common standpoint in their national statements.
Box 5: The European Union, a regional climate co-operation
Representing its 28 Member States, the EU played an important role in the launch of the KyotoProtocol by convincing other developed countries (i.e. Japan and Canada) to join the Protocol.Although the EU had failed at COP15 in Copenhagen to negotiate a new climate agreement,the MSs successfully lobbied for the launch of the second commitment period of the KyotoProtocol in 2011 at COP17 in Durban (The Climate Group, 2011). Furthermore by building acoalition with over 100 developing countries, it also managed to pave the way and launch thepreparations for the 2015 agreement (The Climate Group, 2011).
In addition, the EU as a regional grouping, can also serve as an example and inspire actionsin other countries. A legally-binding23 climate-energy package set 3 key emissions reductionand energy targets by 2020. These were also adopted by the Europe 2020 strategy for smart,sustainable and inclusive growth as headline targets.
Figure 10: The third target of the EU2020 strategy on climate change and energy
23 Providing a longer-term vision, in 2011 the EU also adopted a Roadmap to a Competitive Low-Carbon Economy by 2050.In line with the EU roadmap, the MS were also called to develop their national low-carbon roadmaps. More recently, in2013, the EU strategy on Adaptation to Climate Change was adopted. It aims to climate-proof the EU policies of vulnerablesectors and support the MS in developing national adaption strategies
Source: www.dotinfographics.com/projects

32
At the same time, other coalitions have had more difficulties in pursuing a common negotiation agenda.The G77 and China group includes a high number of diverse countries with considerable differencesin levels of development and in economic interest. As a result, the members of the G-77 and China frequently intervene as individual countries in debates, representing their own interest in terms of climate actions. In addition, many countries of the G77 and China group have formed smaller coalitions(AOSIS, the LDC and the African group). Although struggling with capacity and budget constraints, inrecent years, these smaller country coalitions have become more successful in promoting common interest. (UNEP, 2009 and UNFCCC website, 2016).
The importance of developing country coalitions is further amplified by the fact that developing countries often lack resources and capacities to effectively represent their negotiating interests. Forexample, especially if compared to developed countries, they often have a smaller delegation thatmakes it impossible for them to attend all parallel sessions or informal meetings or have a compre-hensive negotiation team with a variety of important capacities, including politicians, scientists, lawyers,economists and diplomats (UNEP, 2009). By teaming up with like-minded countries and working together with NGOs, their representation can be more efficient at the negotiations.
Figure 11: World cloud of most used words in the LMDC submission on the 2015 agreement
Source: Duyck, 2013
The LDC group also outlines the responsibility of developed countries but in addition it advocates thatall countries take climate actions. It also suggests the introduction of a strong compliance mechanism.The AOSIS, as a group of highly vulnerable countries to climate change, emphasises the historical responsibility and leadership role of developed countries.

33
The EIG advocates that all countries make mitigation commitments according to their capacity levels.It also promotes adoption of obligatory targets. The Independent Alliance of Latin America and theCaribbean (AILAC)24 also advocates that all countries make mitigation commitments. Countries in needcan receive support to finance their adaptation activities.
Figure 12: World cloud of most used words in the LDC and AOSIS submissionon the 2015 agreement
Source: Duyck, 2013
24 Including Chile, Colombia, Costa Rica, Guatemala, Panama and Peru

34
On 12 December 2015, 196 Parties (195 countries and the European Union) came together and agreedto the terms of the Paris Agreement, a landmark conclusion to more than 20 years of international climate diplomacy in which all Parties will contribute towards addressing the challenges of global climatechange. The Agreement is expected to come into force in 2020 and will succeed Commitment Period2 of the Kyoto Protocol.
The Agreement reflects a delicate balance between the vastly differing negotiating positions and agen-das of 195 countries in crucial areas such as: mitigation, transparency, adaptation, loss and damage,support including finance, technology development and transfer, and capacity-building, as well as theever-present cross-cutting issue of differentiation. Under the Agreement, all countries will take actionin the form of Intended Nationally Determined Contributions (INDCs) to reduce GHG emissions and willbe legally bound to report on their progress and account for their mitigation actions (Baker & McKenzie,2016).
While most countries felt that they had to concede on certain issues, the outcome from Paris seems tohave exceeded almost everyone’s expectations. World leaders and the press applauded the Agreementas “a major leap for mankind”, and “a turning point for the world”25. The European Union called it “anambitious and balanced agreement.”26 At the end of the day, the Ad hoc Working Group on the DurbanPlatform for Enhanced Action (ADP) delivered – as mandated – an Agreement “applicable to all Parties”and this itself must be considered a significant achievement. The Washington Post noted that “… TheParis Agreement is a landmark in the world’s response to manmade climate change, with every nationthat matters acknowledging the problem and pledging to respond… Opponents, including many in Congress, can no longer claim that action is pointless because big emitters such as China will nevercooperate”.27
However, there were also several mixed and cautionary views about the success of the Agreement.These views mostly noted that there is lack of clarity in actions, for example, in key issues such as mitigation and support and that many of the details have been moved out of the binding Agreementand into the more flexible Conference of Parties (COP) decisions (See Figure 8). It was noted that thetext is vague on the overall ambition as it does not specify a date for the peaking of emissions, andspecifies only that reductions should lead towards “greenhouse gas emissions neutrality” in the “secondhalf of the century”. As a result, the Agreement’s overall impact on global climate change will be contingent on its implementation.
3. THE PARIS AGREEMENT: WHAT WAS ACTUALLY ACHIEVED AT THE COP21 SUMMIT?
25 See Gosden E. (2015) “Paris climate agreement ‘a major leap for mankind’”, The Telegraph, 12 December 2015. 26 See European Commission (2015) “Historic climate deal in Paris: EU leads global efforts”, Press Release, 12 December
2015. 27 See The Washington Post (2015) “With the Paris climate pact, critics now have no basis to say action is pointless”, The
Washington Post, 12 December 2015.

35
Figure 13: Key points from the Paris Agreement
Source: Adapted from Woodard (2015)
In this chapter an analysis of the key articles of the Paris Agreement and their corresponding decisionsin the COP 21 Decision Text are presented.
OBJECTIVE OF THE AGREEMENT AND LONG-TERM GOAL
Paris Agreement - Articles 2.1, 4.1, 4.3, 4.4, 4.5Decision 1/CP.21 - Paras 23, 24
The Agreement sets a “long-term temperature goal” of limiting global climate change by holding the increase in global temperature to 2°C above pre-industrial levels and, if possible, to further restrict thetemperature increase to 1.5ºC; while keeping in context the objectives of sustainable development anderadication of poverty.
The 2°C target was first agreed upon at COP16 in Cancun. However, the Small Island Developing States(SIDS) have since argued that even a temperature rise of 2°C is enough to threaten the survival ofsome of their member states. Thus, at the Paris negotiations, agreement was reached on including the1.5°C as an ambitious effort, which Parties would nevertheless continue taking efforts to achieve.
The Agreement’s objectives also include enabling countries to move to a low emission developmenttrajectory while ensuring that food production is not threatened. This is in line with the original objectivesof the Convention.

36
MITIGATION AND GLOBAL STOCKTAKE
Paris Agreement – Articles 4.2, 4.3, 4.4, 4.9, 4.13, 5.1Decision 1/CP.21 – Paragraphs 22-40
In order to achieve the objective and long-term goals of the Agreement, Parties will need to submit theirfirst pledge, known as a “Nationally Determined Contribution” (NDC), no later than when the Party submits its instrument of ratification, accession, or approval of the Agreement before 2020. The countries that submit their pledges in the form of an Intended Nationally Determined Contribution(INDC)28 prior to joining the Agreement are deemed to have satisfied this requirement and need notre-submit one in the form of an NDC.
Building on the foundation of these submitted pledges, all Parties are to submit “successive” NDCs in2025 and every five years thereafter. These will have to represent a progression beyond the Party’scurrent emissions reduction pledge reflecting its highest possible ambition.
The initial and successive NDCs will reflect Parties’ common but differentiated responsibilities and re-spective capabilities (CBDR-RC), in light of different national circumstances. The Agreement takes intoconsideration differentiated responsibilities and capabilities of Parties through acknowledgement inArticle 4 of the special circumstances of Least Developed Countries (LDCs) and SIDS. Throughout thetext, there is a call for support to be provided to developing countries and for developed country Partiesto continue take the lead in economy-wide absolute emission reductions.
This differentiating mechanism is counterweighed by a strong process that is established for countriesto assess implementation and take stock of collective climate actions every 5 years. The “Global Stock-take” will convene in 2023, but before that countries will undertake a facilitative dialogue in 2018 totake stock of the Parties’ efforts in relation to the “long-term goal” of the Agreement. The dialogue isexpected to inform preparation of new NDCs that go beyond 2025 for countries such as the US andSwitzerland, which submitted targets only up till then. It is also expected to encourage countries thathave 2030 targets in their INDCs to update their NDCs before the Agreement comes into force.
FORESTRY
Paris Agreement – Preamble, Articles 4.1, 5, 13.7(a)
Parties to the UNFCCC have been negotiating a mechanism to reduce emissions from forest degradationand to enhance forest stocks since COP11 in 2005 (Wuppertal Institute for Climate, Environment andEnergy, 2016). In 2013, the Warsaw Framework for REDD+ (Reducing emissions from deforestationand forest degradation and the role of conservation, sustainable management of forests and enhance-ment of forest carbon stocks in developing countries) was adopted, which contained 7 decisions onvarious aspects of REDD+ including result-based finance and monitoring, reporting and verification(MRV) systems (UNFCCC, 2016b).
Thus, for the Paris negotiations, the main issue being debated was whether REDD+ would be explicitlymentioned in the Agreement or whether a more general reference to forestry-based activities and mech-anisms would be preferred. In addition, proposals being considered included setting up non-marketapproaches such as the Joint Mitigation and Adaptation Mechanism (JMA) for implementing forest protection activities.
Building upon the Warsaw Framework, Parties are encouraged to implement and support forestry related mitigation activities through both market and non-market approaches. In addition, the Decision
28 The term INDCs was agreed upon by Parties only in the final minutes of the ADP closing plenary at COP 19 in Warsaw,Poland in November 2013. Parties agreed to use the word “intended” together with “nationally determined contributions”so as to reflect consensus and signal a “bottom up” approach to encouraging universal participation of the Paris Agree-ment.

37
Text also recognises that finance needs to be made available for result-based payments for REDD+ activities as well as for JMA approaches, and that such finance may come from public, private, bilateral,or multilateral sources including the GCF.
COOPERATIVE APPROACHES
Paris Agreement - Article 6 (1-9)Decision 1/CP.21 - Paragraphs 36-40
The most practical approach towards reducing emissions is to achieve them in an economically efficientmanner, i.e. focus on cost-efficient emission reduction plans/strategies. Thus, emissions reductionmeasures that have negative or smaller payback periods must be targeted first, before utilising moreexpensive measures. For some Parties, such low cost emission reduction measures may have beenexhausted and additional measures may be economically prohibitive, or may not even be technologicallysound.
Thus, to enable Parties to achieve the objectives stated in their INDCs and to allow them to achieveeven higher ambition targets, the section on Cooperative Approaches recognises that Parties may en-gage in any form of voluntary cooperation amongst themselves, such as through carbon markets. Par-ties may also engage in bilateral transfer of emissions reductions, as Internationally TransferredMitigation Outcomes (ITMOs), from one Party to the other and use these credits towards the objectivesof their INDCs.
At first thought, this mechanism seems similar to the Clean Development Mechanism (CDM) and theJoint Implementation (JI) Mechanism that were created as part of the Kyoto Protocol’s flexibility mechanisms. However, there are key differences – firstly, the mechanism does not restrict cooperationto between developed and developing country parties. Thus, it theoretically opens up possibilities ofSouth-South carbon financing. Furthermore, it is not restricted to only project-based emissions reductionactivities; rather, such approaches may now focus on quantifying bulk emissions reductions from implementing sectoral level policies and programmes. Finally, it is clear that the mechanism must “…deliver an overall mitigation in global emissions” which is different from the zero-sum principle followed by the Kyoto mechanisms.29
During the implementation of the CDM and JI, a number of issues were encountered, such as whetherthe projects and resultant emissions reductions were truly “additional” or not. The accompanying decision text thus places the onus on the Subsidiary Body on Scientific and Technological Advice(SBSTA) to develop rules, modalities and procedures that utilise the experience gained from CDM andJI to ensure that the emissions reductions are Additional30. The rules, modalities and procedures willalso ensure that emissions reductions generated are not double counted, i.e. the ITMOs cannot beused by the Party hosting the emission reduction activity towards its NDC, if they are counted by theother Party towards its own NDC objectives. The mechanism will function under the authority of theConference of the Parties serving as the meeting of the Parties to the Paris Agreement (CMA), whichwill setup a new body to supervise its functioning.
A framework for non-market approaches as a form of cooperation will also be developed. However, fornow, there is no mention of any other details except for the high level objectives of the framework - i.e.creating synergy between mitigation, adaptation, technology transfer, etc. The responsibility for devel-oping a work programme for implementing non-market approaches has been allotted to the SBSTA31.
29 UNFCCC (2016) Decision 1/CP.21, Adoption of the Paris Agreement, UN Doc. FCCC/CP/2015/10/Add.1, 29 January2016, Annex, Article 6.4(d).
30 Ibid, para. 38.31 Ibid, para. 40.

38
ADAPTATION
Paris Agreement - Article 7Decision 1/CP.21 - Paragraphs 41-46
Developing countries particularly the LDCs32 and SIDS33 have been urging at COP meetings and inter-sessional meetings and in their submissions to the ADP, that adaptation should form a crucial elementof the Paris Agreement; and to address enhanced action and scaling up of funding from developedcountries to support adaptation. Interventions during the Paris negotiations called for adaptation’s linkwith mitigation to be maintained and continue to be based on the principles of CBDR-RC.
As part of the Agreement, Adaptation is recognised as a global challenge and a key component to thelong-term goal to protect people, livelihoods and ecosystems, and taking into account the urgent andimmediate needs of those developing countries that are particularly vulnerable. Parties shouldstrengthen their cooperation on enhancing action on adaptation and take into account the CancunAdaptation Framework.34
Each Party shall, as appropriate, engage in adaptation planning processes, and implementation of actions, including the development of relevant plans, policies and/or contributions. Parties should sub-mit and update periodically an adaptation communication. Continuous and enhanced internationalsupport shall be provided to developing countries. The Global Stocktake shall include progress, imple-mentation and support for adaptation.
LOSS AND DAMAGE
Paris Agreement - Article 8Decision 1/CP.21 - Paragraphs 47-51
Loss and damage associated with climate change was first proposed at the intersessional meeting inBonn, Germany in May 2012 when the Alliance of Small Island States (AOSIS) called for the establish-ment of such a mechanism under the new agreement35. It has long been a contentious and controver-sial issue between the developing and developed countries.
While developing countries, especially the LDCs and the SIDS, have been demanding the establishmentof an institutional mechanism to address loss and damage, developed countries have opposed the establishment of this mechanism arguing that loss and damage could be addressed under the existingframework of mitigation and adaptation. Developed countries are in favour of technical and financialsupport for loss and damage to developing counties, but remain steadfastly opposed to liability andcompensation associated with such a mechanism. As a result, the only major achievement till date onthis issue was the establishment of the Warsaw International Mechanism for Loss and Damage (WIM)agreed at COP19 in Warsaw, Poland.
In Paris, Parties were unable to resolve this issue well into the end stages of the negotiations. Eventually,the Comité de Paris was able to find convergence of views and a separate article on loss and damagewas agreed. Under Article 8, Parties recognise the importance of averting, minimising and addressingloss and damage associated with the adverse effects of climate change. The WIM is to operate under theauthority and guidance of the CMA and may be enhanced and strengthened, as determined by the CMA.
32 Cambodia, Lao PDR and Myanmar are recognised as LDCs.33 Singapore is a member of the SIDS.34 The Cancun Adaptation Framework was adopted by Parties as part of the Cancun Agreements from COP 16 held in Mexico
in 2010. Its objective is to increase international cooperation to support adaptation action in developing countries takinginto account the needs of those that are particularly vulnerable. For more details, see http://unfccc.int/adaptation/items/5852.php/.
35 See Alliance of Small Island States (AOSIS) proposal to the AWG-LCA: Multi-window Mechanism to Address Loss and Damage from Climate Change Impacts, 6 December 2008. URL: http://unfccc.int/files/kyoto_protocol/application/pdf/aosisinsurance061208.pdf

39
The article also lists eight areas of cooperation and facilitation to enhance understanding, action andsupport on loss and damage. While the Paris Agreement does recognise loss and damage as a separateissue from adaptation, it does not establish a new mechanism as called for by developing countries.There is no reference to liability and compensation from loss and damage in the Agreement, but theissue is clearly addressed in Paragraph 51 of the decision text which states that the Conference of theParties “Agrees that Article 8 of the Agreement does not involve or provide a basis for any liability orcompensation”, an outcome in line with the stance of the developed countries.36
FINANCE
Paris Agreement - Article 9Decision 1/CP.21 - Paragraphs 52-64, 114
Developing countries have long demanded that developed countries must provide significant amountsof climate finance if they expect developing countries to achieve ambitious emissions reductions. Analysis by one independent think-tank suggests that as of 23 October 2015, developing countrieshave requested USD 3,534 billion to implement their INDCs, including a demand for USD 2.5 trillion byIndia (Carbon Brief, 2016).
In Paris, attempts to reach agreement on finance clauses proved to be extremely difficult. While devel-oping country Parties demanded that developed country Parties provide a clear roadmap for achievingthe promised finance levels by 2020, developed country Parties instead wanted the burden to be sharedamongst “all Parties in a position to do so”.37
Under the Paris Agreement, developed country Parties are now mandated to provide finance to devel-oping country Parties for both mitigation and adaptation activities. At the same time Parties other thanthe developing country parties are also encouraged to voluntarily contribute towards financial support.In addition, finance mobilised must be balanced between mitigation and adaptation, rather than themitigation-centric nature of climate finance today.
Furthermore, developed countries must take the lead in mobilising climate finance from a variety ofsources and focus on public finance. While the agreement text contains no references to the quantityof climate finance that is targeted for mobilisation; it does mention that the mobilization should repre-sent a progression of funds mobilised. Instead, this information is codified in the Decision Text whichstates that developed countries will continue to mobilize USD 100 billion through 2025, after which anew collective quantified goal will be set with USD 100 billion as a floor38. The Decision Text also urgesthe developed countries to prepare a concrete roadmap towards achieving their goal of providing USD100 billion annually by 2020.39
There are also provisions for greater transparency regarding the provision of finance. Developed countryParties must biennially report qualitative and quantitative information regarding finance mobilized collectively and on financial resources provided to developing countries, as part of their overall reportingrequirements as agreed under the section on Transparency. In addition, there are also special require-ments to provide information on public financial resources provided to developing countries and on finance mobilised “through public interventions”.40
36 UNFCCC (2016) Decision 1/CP.21, Adoption of the Paris Agreement, UN Doc. FCCC/CP/2015/10/Add.1, 29 January2016, Annex, para. 51.
37 See Draft agreement and draft decision on workstreams 1 and 2 of the Ad Hoc Working Group on the Durban Platformfor Enhanced Action: Edited version of 6 November 2015, Article 6. URL: http://unfccc.int/resource/docs/2015/adp2/eng/11infnot.pdf
38 UNFCCC (2016) Decision 1/CP.21, Adoption of the Paris Agreement, UN Doc. FCCC/CP/2015/10/Add.1, 29 January2016, para. 54.
39 Ibid, para. 115.40 Ibid, para. 51 and Annex, Article 9, para 7.

40
The special inclusion of language on public finance is possibly the result of an intense debate betweendeveloped and developing countries on what constitutes climate finance; with developing countriesoften complaining that developed countries simply re-package already promised financial assistanceas climate finance, thus there being very little real, additional financial flow for climate action. As a result, the SBSTA has been tasked with development of modalities for developed country Parties todemonstrate transparency on how the financial resources have been mobilised.41
TECHNOLOGY TRANSFER
Paris Agreement - Article 9Decision 1/CP.21 - Paragraphs 65-70
The Paris Agreement notes the importance of enabling technology transfer towards achieving higherambition outcomes for both mitigation and building resilience. Thus, in continuation with the work ofthe UNFCCC’s Technology Mechanism, a technology framework is established to provide guidance tothe technology mechanism, which will now also serve the Paris Agreement. The Decision Text definescertain key objectives of the technology framework and delegates further elaboration of the frameworkto the SBSTA.42
The Financial Mechanism of the Agreement will play an important role in funding research and devel-opment and enabling access to technology for developing countries. Thus, it also mandates support,including financial support to be provided to developing countries to enable them to cooperate on tech-nology development and transfer. Adequacy of technology transfer and development will be assessedin the Global Stocktake to be done every 5 years beginning in 2023.
CAPACITY BUILDING
Paris Agreement - Article 11Decision 1/CP.21 - Paragraphs 71-83
Article 11 of the Agreement recognises that capacity building plays a crucial role in enhancing the abilityof developing countries, especially the LDCs and SIDS to not only implement mitigation and adaptationmeasures, but also access finance and technology transfer from the relevant institutions. In order toensure that capacity building continues to contribute effectively and further enhance capacity buildingefforts, the Decision Text establishes the Paris Committee on Capacity Building.
The key objectives to be covered under the 2016-2020 work plan for the Committee are also outlined,including identifying capacity gaps and needs, developing tools for implementation of capacity building,and identifying synergies with capacity building efforts of other institutions within and outside the climate change institutional framework. Furthermore, an assessment of the effectiveness and enhance-ment of this committee, including whether it should be extended, will be carried out in 2019.
All Parties engaging in capacity building efforts for developing countries will also report on their effortsand developing countries are required to report on their implementation of capacity building policiesand measures.
TRANSPARENCY OF ACTION AND SUPPORT
Paris Agreement - Article 13Decision 1/CP.21 - Paragraphs 84-98
Transparency is at the core of the Paris Agreement, since it contains requirements for Parties to discloseinformation on progress made towards fulfilling the objectives outlined in their NDCs. Thus, all Partiesneed to provide information on:
41 Ibid, para. 57.42 Ibid, para. 67-8.

41
• National greenhouse gas inventories prepared by using IPCC guidelines;
• Mitigation and adaptation actions towards the overall objectives of their NDCs; and
• Support provided (by developed country Parties and others who voluntarily chose to doso) and received (by developing country Parties) – in financial, technology and capacitybuilding terms
Except for the LDCs and SIDS, all Parties must submit this information at least once in 2 years. Thesubmitted information will be subjected to a technical expert review which will review the consistencyof the information provided with the requirements and will also identify areas of improvement. Partieswill also participate in a facilitative, multilateral consideration of progress.
While the transparency framework will build on existing arrangements under the Convention, the modal-ities, procedures and guidelines of this transparency framework shall eventually supersede the currentMeasurement, Reporting and Verification (MRV) system.
The requirements of the transparency framework can place undue requirements, especially on devel-oping countries. Thus in order to build institutional and technical capacity of developing countries, a“Capacity-building Initiative for Transparency” has been established. This initiative will support developing country Parties, upon request, in meeting enhanced transparency requirements as definedin Article 13 of the Agreement in a timely manner. The COP has requested the Global EnvironmentalFacility (GEF) to support the operation of this initiative including through voluntary contributions.
The section on transparency is critical because while the Agreement is a legally binding instrument, itcontains no specific language that mandates Parties to implement their respective (I)NDCs or achievethe objectives (action or support) spelled out in their pledges. The Agreement only states that countriesmust pursue domestic mitigation measures to achieve their set targets, and it places the responsibilityon Parties to account for their respective NDCs. Thus, to ensure that Parties make every effort to achievetheir specified targets, it is now mandatory for them to regularly report progress on their mitigation,adaptation, finance, technology transfer and capacity building pledges.
COMPLIANCE
Paris Agreement - Article 15Decision 1/CP.21 - Paragraphs 102-103
The Paris Agreement is a legally binding agreement and will come into force in 2020 on condition thatat least 55 Parties to the Convention accounting in total for at least an estimated 55% of the totalglobal greenhouse gas emissions have deposited their instruments of ratification, acceptance, approvalor accession. To facilitate the implementation and promote compliance with its provisions, a compliancemechanism is established. However, compliance is restricted to a facilitative, non-adversarial and non-punitive approach respecting the national capabilities and circumstances of the Parties. The mech-anism will consist of a committee of 12 scientific, technical, socio-economic or legal experts who willattempt to understand the reasons for non-compliance and promote compliance through facilitativeapproaches such as through capacity building.
A climate deal with universal participation has to be based on reasonable assurance that there will bereciprocity of actions among Parties. It must also instil confidence in countries to implement their own.It would not have been politically feasible for Parties to agree on a solution that would subject them toconsequences for non-compliance. Still, there has been significant progress made to enhance trans-parency in order to give “teeth” to the Agreement. The post-Paris agenda is likely to be packed with de-veloping MRV guidelines before the Agreement comes into force in 2020.

42
AFTER PARIS - WHAT’S NEXT?
After more than 2 decades of negotiations since the UNFCCC was adopted in 1992, countries were finally able to negotiate a legally binding agreement that requires all countries to be involved in takingactions to reduce emissions. The Agreement thus reflects consensus amongst 195 countries on a lotof divisive areas such as mitigation, finance and overarching principles such as differentiation.
However, in order to achieve this consensus, the Agreement has had to essentially take the form of askeletal framework that lays out the essential goals that needed to be agreed upon. To ensure thatParties collectively achieve these goals, a number of rules, modalities, procedures and guidelines willhave to be negotiated in the coming years.43 Most of these negotiations will be carried out at meetingsof the APA, SBI, SBSTA and COP, starting with the May 2016 meeting in Bonn.
The following are key areas from the Paris Agreement for which implementation rules will have to beagreed upon:
• Transparency: The Paris Agreement does not legally bind Parties to achieve their INDCs,but it does legally require them to report on their progress towards their pledges. It is ex-pected that this “name and shame” approach will play a key role in ensuring that Partiescontinuously strive to achieve their targets. Thus, all Parties except for the LDCs and SIDSwill have to disclose required information in the form of a biennial communication. Towardsthis objective, the APA has been tasked to develop a MRV system by 2018 that will buildupon and supersede the current MRV systems in place.
• Finance: One of the major demands from developing countries at the Paris negotiationswas for developed countries to provide “new and additional” climate finance, especiallyfrom public finance sources. This demand stems from the debate on what constitutes cli-mate finance and what doesn’t. The Paris Agreement has thus, tasked the COP to initiatea process that will identify what information needs to be disclosed by developed countriesin their biennial communications regarding finance that they have already provided andpublic funding that they intend to provide. Furthermore, the SBSTA will develop modalitiesfor how developed countries will be able to account for financial resources leveragedthrough public interventions.
• Carbon Markets: The Agreement includes provisions for Parties to cooperate in achievingtheir INDC pledges – through both market and non-market approaches. However, it recog-nises that the use of market approaches must be undertaken in a manner that ensuresoverall environmental integrity and sustainable development. To ensure this objective isachieved, the SBSTA will develop guidance to avoid double counting of emission reductionsby Parties that trade ITMOs, and will also develop rules, modalities and procedures to ensure that the emission reduction activities that result in ITMOs are “… additional to anythat would otherwise occur”.
The figure below lists other key additional tasks that will need to be completed before the first CMA.
43 For a list of decisions from the COP21 decision text that require activities and tasks to be undertaken by various bodies.URL: http://unfccc.int/files/bodies/cop/application/pdf/overview_1cp21_tasks_.pdf. See also UNFCCC (2016g) Progresstracker: Work programme resulting from the relevant requests contained in decision 1/CP.21, 18 July 2016. URL: http://unfccc.int/files/paris_agreement/application/pdf/progress_tracker_180716_1530.pdf

43
Figure 14: Key tasks to be completed before the first Meeting of Parties to the Paris Agreement
Source: Northrop, E. and Krnjaic, M., 2016
PARIS AGREEMENT’S ENTRY INTO FORCE
On 4 October 2016, the Paris Agreement passed its double threshold for entry into force with ratificationby 72 countries which account for more than 56% of global greenhouse gas emissions.
At a special “High-Level Event on Entry into Force of the Paris Agreement on Climate Change” on 21September 2016 convened by UN Secretary-General Ban Ki-moon on the sidelines of the UN GeneralAssembly, 31 countries including Brunei Darussalam, Singapore and Thailand formally joined the Paris

44
Agreement, moving the landmark deal closer to entry into force. Lao PDR had earlier deposited its instrument of ratification on 7 September 2016.
The agreement received a big boost earlier in the month when United States and China - the world’stwo largest emitters of greenhouse gases – ratified the agreement on the sidelines of the G20 Summitin Hangzhou. India, the world’s fourth largest emitter of greenhouse gas (counting the EU as a singlebloc) ratified the agreement on 2 October 2016, timed to coincide with the 147th birth anniversary ofMahatma Gandhi. The ratification move by major emitters and the global community to act on climatechange is important as it significantly catalyses climate action around the world and demonstrates sup-port of the countries that have joined the agreement.
While the rapid pace of ratification is unprecedented, the agreement’s early entry into force was noeasy feat. One of the climate leaders in the road to Paris, the European Union, which accounts for 12per cent of global emissions, had taken longer than expected to ratify. At the time of the special eventin New York, only three European states - France, Hungary and Austria - had passed domestic require-ments for ratification but this itself does not constitute ratification. The EU member states had agreedthat they would not submit their instruments of ratification until there is agreement on effort sharingwithin the bloc.
To this, President of the European Commission Jean-Claude Juncker had expressed embarrassmentat the slow progress. A proposal for fast-track ratification was submitted in June for approval by the European Parliament and Council. Consent of European Parliament is required prior to the adoption ofthe decision by the Council. Only when approved can the Council will designate a representative to deposit the ratification instrument to the UN Secretary-General, on behalf of the EU. The major stumbling block here was that effort sharing between the EU member states in order to achieve their40 per cent emissions reduction by 2030 compared to 1990 levels target had yet to be decided. Observers feared that lack of consent among the bloc’s member states over their respective share tothe EU-wide reduction target might delay the Paris pact until at least 2017.
However, the accelerated procedure paid off as the European Parliament voted on 4 October 2016 forthe EU to ratify the agreement, stemming fears that late ratification would seriously put the EU’s reputation as a climate leader at risk.
Other major emitters such as Japan and Canada are lagging behind. Japan has initiated its domesticprocess to ratify the agreement and its parliament kicked off an extraordinary session where necessarydocuments may be submitted. Canada is still in the midst of developing a national climate strategy onhow the country is expected to meet its climate target before putting forward their instrument of ratification to the federal cabinet. Other major emitters such as the Russian Federation which accountsfor 5 per cent of global emissions, Indonesia (4.3 per cent), Australia (1.48 per cent) or South Korea(1.4 per cent) have also yet to ratify the agreement.
Nevertheless, it is a remarkable achievement that the Paris Agreement will enter into force in 2016,given that it was adopted only 10 months ago. In contrast, the agreement’s predecessor – the KyotoProtocol – infamously took eight years to enter into force after being adopted in 1997. At the time, theUS had refused to ratify the Protocol, citing that China and other major developing countries needed toplay a role in addressing climate change as well.
The Agreement provides that it shall enter into force 30 days after 55 countries, representing 55 percentof global emissions, have deposited their instruments of ratification, acceptance or accession with theSecretary-General. As of today, 75 countries and the European Union have joined the Agreement, exceeding the 55 percent threshold for emissions. The first session of the Conference of the Partiesserving as the meeting of the Parties to the Paris Agreement, known in the climate jargon as CMA, willtake place during the upcoming annual UN climate conference (COP22) in Marrakech. There, partiesare expected to take stock of progress made by the subsidiary and constituted bodies in relation totheir mandated work under the Paris Agreement and section III of decision 1/CP.21, in order to promote

45
and facilitate coordination and coherence in the implementation of the work programme, and, if appropriate, take action, which may include recommendations.
COP22 is scheduled to start in Morocco on 7 November, a day before elections in the US. Republicanfront runner Mr Donald Trump has rubbished the science of climate change, resulting in uncertaintyover whether America – the world’s second largest emitter of greenhouse gases – will hold up its endof the bargain going forward under a Trump administration. Legal expert Daniel Bodansky from theSandra Day O’Connor College of Law points to a second important feature of early entry into force ofthe Paris Agreement.
If the Agreement enters into force before current US President Barack Obama leaves office then thenext president would not be able to withdraw until sometime in 2019, and the withdrawal would not beeffective until sometime in 2020. Once the agreement is in force, it would be politically much more difficult for Mr Trump, to back out of it. Indeed, backing out of an international agreement that the USpreviously entered into could be an unwise move, given the US’ leadership role in tackling global challenges, as well as from a public relations standpoint. It will also stymie the growth of the multi-billion dollar clean tech industry in the US and the rest of the world. For businesses, the signal togo green is now clear. Private and public entities around the world are already moving to cut theirgreenhouse gas emissions.
Now that the Paris Agreement is on track to enter into force, the next important step would be for countries to work towards achieving the targets they have set. After all, when 190 countries had putforward their climate pledges for 2030 – known as nationally determined contributions – they are domestically accountable as well. Countries will need to continually ratchet up ambition according toscience and pursue a low-carbon transition.

46
The UNFCCC and its Parties also recognise the importance of climate finance, and of providing financialassistance to developing countries, with fewer resources. Article 4.3 of the Convention commits devel-oped countries under Annex II to “… provide new and additional financial resources to meet the agreedfull cost incurred by developing country parties” required for meeting their reporting obligations underArticle 12.1 of the Convention and to provide “… financial resources including for transfer of technology,needed by developing country Parties to meet the agreed full incremental costs of implementing meas-ures…” covered under Article 4.1. In addition, Article 4.4 commits Annex II parties to help vulnerabledeveloping countries in meeting their adaptation costs.
In this chapter we provide a general overview of the various climate financing sources including mech-anisms of the UNFCCC and other multilateral and bilateral entities.
FINANCING MECHANISMS OF THE UNFCCC
The landscape of climate finance is rather complex, with a variety of funding sources and mechanisms.First, various financial mechanisms and funds operate directly under the Convention. These include:
• Global Environment Facility (GEF): As an international partnership, it serves as the financialmechanism for several environmental conventions, including the UNFCCC. The GEF finances mitigation and adaptation projects in developing countries and economies intransition, and aims to finance projects that offer win-win solutions for local economies(GEF, 2016). It reports to the COP and its activities are regularly reviewed. So far, the Fundhas allocated a total of USD 910 million for various mitigation and adaptation objectives(GEF, 2016). The GEF manages to major funds concerning climate change:
o Least Developed Countries Fund (LDCF): This was established to support the imple-mentation of National Adaptation Programmes of Action (NAPAs) in Least DevelopedCountries (LDCs), which are especially vulnerable to climate change. NAPAs and thedefinition of priority areas for adaptation actions are developed via country-drivenprocesses (UNFCCC, 2016).
o Special Climate Change Fund (SCCF): This fund focuses on financing long- and short-term adaptation activities in various sectors, and promoting technology transfer inany developing countries, vulnerable to climate change. Priority areas include waterresource management, agriculture, coastal zones, and natural resources (UNFCCC,2016 and GEF, 2016).
4. CLIMATE FINANCE

47
Table 2: Availability of the LDCF and the SCCF for AMS
Bru
nei
Dar
ussa
lam
Cam
bodi
a
Indo
nesi
a
Lao
PDR
Mal
aysi
a
Mya
nmar
Phili
ppin
es
Sing
apor
e
Thai
land
Viet
Nam
LDCF No Yes No Yes No Yes No No No No
SCCF Yes Yes Yes Yes Yes Yes Yes Yes Yes Yes
GEF
Foc
al P
oint
s
N.A
.
Min
istr
y of
Env
ironm
ent
U.S
. Em
bass
y of
Indo
nesi
a an
d M
in-
istr
y of
Env
ironm
ent a
nd F
ores
try
Wat
er R
esou
rce
and
Envi
ronm
ent
Adm
inis
trat
ion
and
Scie
nce
Tech
nol-
ogy
and
Envi
ronm
ent A
genc
y
Min
istr
y of
Nat
ural
Res
ourc
es a
nd
Envi
ronm
ent a
nd P
rime
Min
iste
r's
Dep
artm
ent E
cono
mic
s Pl
anni
ngU
nit
Min
istr
y of
Env
ironm
enta
l Con
serv
a-tio
n an
d Fo
rest
ry
Perm
anen
t Mis
sion
of t
he R
epub
licof
the
Phili
ppin
es to
the
Uni
ted
Nat
ions
and
Dep
artm
ent o
f Env
iron-
men
t and
Nat
ural
Res
ourc
es
N.A
.
Min
istr
y of
For
eign
Aff
airs
and
Min
istr
y of
Nat
ural
Res
ourc
es a
nd
Envi
ronm
ent
Min
istr
y of
Nat
ural
Res
ourc
es a
nd
Envi
ronm
ent
Bru
nei
Dar
ussa
lam
Cam
bodi
a
Indo
nesi
a
Lao
PDR
Mal
aysi
a
Mya
nmar
Phili
ppin
es
Sing
apor
e
Thai
land
Viet
Nam
Avai l -ability
No Yes Yes Yes Yes Yes Yes No Yes Yes
Coun
try
offic
es
N.A
.
Min
istr
y of
Env
iron-
men
t of t
he K
ingd
omof
Cam
bodi
a
Nat
iona
l Cou
ncil
on
Clim
ate
Chan
ge
Dire
ctor
y of
Clim
ate
Chan
ge O
ffic
eD
epar
tmen
t of
Envi
ronm
ent
Min
istr
y of
Nat
ural
R
esou
rces
and
En
viro
nmen
t
Nat
iona
l Env
ironm
ent
Cons
erva
tion
Com
mitt
ee (N
ECC)
Dep
artm
ent o
f En
viro
nmen
t and
N
atur
al R
esou
rces
N.A
.
Min
istr
y of
Nat
ural
R
esou
rces
and
En
viro
nmen
t
Min
istr
y of
Nat
ural
R
esou
rces
and
En
viro
nmen
t
Source: GEF, 2016
• Adaptation Fund: This fund supports adaptation programmes and projects in developingcountries that are Parties to the Kyoto Protocol. The Fund is financed from the CDM, by a2% levy after each CER issued by the CDM. It was established in 2001 and is managed bythe Adaptation Fund Board. The Adaptation Fund had received approximately USD 400million as of June 2015, out of which approximately USD 100 million had been disbursed(Mansell, A., 2015).
Table 3: Availability of the Adaptation Fund for AMS
Source: Adaptation Fund, 2016

48
• Green Climate Fund (GCF): This fund was established at COP16 to serve as an operatingbody of the Convention’s financial mechanism in the long term. The Fund is managed bythe GCF Board, and as of February 2016, has raised USD 10.2 billion in pledges (GCF,2016). It aims to support developing countries in their climate activities. To support thisobjective, developed countries pledged to provide USD 100 billion by 2020 via the GCF(UNFCCC, 2009).
Table 4: Availability of the Green Climate Fund for AMSB
rune
i D
arus
sala
m
Cam
bodi
a
Indo
nesi
a
Lao
PDR
Mal
aysi
a
Mya
nmar
Phili
ppin
es
Sing
apor
e
Thai
land
Viet
Nam
Availability No Yes Yes Yes Yes No Yes Yes Yes Yes
National Designated
Authority(NDA) andfocal point
No
Min
istr
y of
Env
ironm
ent
Fisc
al P
olic
y Ag
ency
, Min
istr
y of
Fi
nanc
e
Min
istr
y of
Nat
ural
Res
ourc
esan
d En
viro
nmen
t
Min
istr
y of
Nat
ural
Res
ourc
esan
d En
viro
nmen
t
Min
istr
y of
Env
ironm
enta
l Co
nser
vatio
n an
d Fo
rest
ry
Clim
ate
Chan
ge C
omm
issi
on
Nat
iona
l Clim
ate
Chan
ge
Secr
etar
iat
Off
ice
of N
atur
al R
esou
rces
and
Envi
ronm
enta
l Pol
icy
and
Plan
ning
Min
istr
y of
Pla
nnin
g an
d In
vest
men
tName Type Scope Project examples
Application Information
LDCF AdaptationNAPAimplementation in LDCs
o Cambodia: Strengthening Climate Information andEarly Warning Systems inCambodia to Support Climate Resilient Development and Adaptationto Climate
o Lao PDR: Climate adaptationin wetlands areas
o Myanmar: Adapting community forestry landscapes and associatedcommunity livelihoods to achanging climate, in particu-lar an increase in the frequency and intensity ofextreme weather events
https://www.thegef.org/gef/sites/thegef.org/files/publication/ 23469_LDCF.pdf
Source: Green Climate Fund, 2016
Table 5: Further information on the use of the funds

49
MULTILATERAL AND BILATERAL CLIMATE FINANCING MECHANISMS
Climate financing is also available via multi- and bilateral donor sources. Table 6 and Table 7 belowprovides a summary of existing multi- and bilateral climate funds, besides the UNFCCC financing mechanisms.
Name Type Scope Project examplesApplication Information
SCCFAdaptationand mitigation
Various climateactions in allvulnerable developingcountries
o Thailand: Strengthening theCapacity of VulnerableCoastal Communities to Address the Risk of ClimateChange and ExtremeWeather Events
o Viet Nam: Climate-resilientInfrastructure in NorthernMountain Province of Viet Nam
http://www.ctknetwork.org/wp-con-tent/documents/pdf/Accessing-SCCF.pdf
Adaptationfund
Adaptation
Project sectors:
Agriculture
Coastal Management
DRM
Food security
Rural Development
Water management
Water Management
o Cambodia: Enhancing Climate Resilience of RuralCommunities Living in Protected Areas
o Myanmar: Addressing Climate Change Risks onWater and Food Security inthe Dry Zones
https://www.adaptation-fund.org/apply-funding/project-funding/project-proposal-materials/
Green ClimateFund (GSF)
Adaptationand mitigation
Investment priorities include:
Energy generation andaccess
Climate-compatiblecities
Agriculture
Forestry
SIDSs
o Viet Nam: Improving the Resilience of VulnerableCoastal Communities to Climate Change Related Impacts
http://www.green-climate.fund/ ventures/accreditation

50
Table 6: Examples of available multilateral climate funds
Name of Fund Administration Focus Area Further Information
Clean Technology Fund World Bank Mitigation
Programmed and approvedprojects based on countryplans:
www-cif.climateinvestment-funds.org/country
Strategic Climate Fund World BankAdaptation, Mitigation, REDD
Forest Investment Program
World Bank REDD
Pilot Program for ClimateResilience
World Bank Adaptation
Scaling-Up RenewableEnergy Program for LowIncome Countries
World Bank Mitigation
Forest Carbon Partnership Facility
World Bank REDDwww.unredd.net/index.php?option=com_content&view=article&id=2088&Itemid=482
UN-REDD Programme UNDP REDD www.un-redd.org
Climate Change FundAsian DevelopmentBank
Adaptation, Mitigation
www.adb.org/site/funds/funds/climate-change-fund
Urban Climate ChangeResilience Trust Fund(UCCRTF)
Asian DevelopmentBank
Adaptationwww.adb.org/site/funds/funds/urban-climate-change-resilience-trust-fund
Integrated Disaster RiskManagement (IDRM)Fund
Asian DevelopmentBank
Adaptationwww.adb.org/site/funds/funds/integrated-disaster-risk-management-fund
Future Carbon Fund(FCF)
Asian DevelopmentBank
Mitigationwww.adb.org/site/funds/funds/future-carbon-fund-fcf
Global Climate ChangeAlliance
European Commission
Adaptation, Mitigation, REDD
www.gcca.eu/technical-and-financial-support
Global Energy Efficiencyand Renewable EnergyFund
European Commission
Mitigation www.geeref.com

51
Lastly, regional and national funding initiatives also exist, which have the aim of up-scaling and betterprioritizing climate finance in a certain region or country. Examples include the Congo Basin ForestFund, the Amazon Fund in Brazil and the Indonesia Climate Change Trust Fund.
Box 6: Initiatives tracking climate finance
Table 7: Examples of available bilateral climate funds
Country Name of Fund Focus Area Further Information
CanadaInternational Climate Financing
Adaptation, Mitigation, REDD
www.climatechange.gc.ca/finance/
GermanyInternational ClimateInitiative
Adaptation, Mitigation, REDD
www.international-climate-initia-tive.com/en/
JapanJapan Fund for theJoint Crediting Mechanism (JFJCM)
Mitigationwww.adb.org/site/funds/funds/japan-fund-for-joint-crediting-mecha-nism
NorwayInternational Climateand Forest Initiative
REDDwww.norad.no/en/front/funding/climate-and-forest-initiative-sup-port-scheme/
United KingdomInternational ClimateFund
Adaptation, Mitigation, REDD
www.gov.uk/government/publica-tions/international-climate-fund/international-climate-fund
• Climate Funds Update
www.climatefundsupdate.org/listing/strategic-climate-fund
• REDD X Tracking Forest Finance
URL: www.reddx.forest-trends.org
• Voluntary REDD+ Database
URL: www.reddplusdatabase.org
• REDD Countries Database
URL: www.theredddesk.org/countries
• UN Multi-Partner Trust Fund Office Gateway
URL: www.mdtf.undp.org
• Independent Fast Start Finance Tracking of the World Resource Institute
URL: www.wri.org/sites/default/files/pdf/climate_finance_pledges_2012-11-26.pdf

52
ANALYSIS OF THE CURRENT CLIMATE FINANCING LANDSCAPE
As for the funding sources, climate finance is provided both by various public and private actors. Anannual review of the global landscape of climate finance conducted by the Climate Policy Initiative (CPI),showed that in 2013 and 2014, 38% of global climate finance (approximately USD 148 billion) wasprovided by public sources, while 62% (USD 243 billion) was from private sources. Figure 15 providesan overview of the global climate financing landscape as it was in 2015.
Figure 15: The flows of climate finance in 2015
Source: Climate Policy Initiative, 2015
Another assessment of the global climate finance was conducted by the UNFCCC Standing Committeeon Finance (SCF) which was established as part of the Cancun Agreement with the objective of assistingthe COP “…in relation to the Financial Mechanism of the Convention” which includes objectives suchas “…measurement, reporting and verification (MRV) of support provided to developing country Parties”(UNFCCC, 2016e).
The SCF conducts a biennial assessment of climate finance related information provided by Parties intheir National Communications (NCs) and Biennial Update Reports (BURs), the first of which was com-pleted in 2014 covering the period 2010 – 2012. As per the report, the SCF estimated a flow of USD40 billion to USD 175 billion per year from developed countries to developing countries, out of whichpublic finance accounted for USD 35 billion to USD 50 billion, whereas private finance ranged fromUSD 5billion to USD 125 billion. Figure 13 provides a snapshot of global climate finance flows, includingflows specifically from developed countries to developing countries from 2010 to 2012.

53
Figure 16: Flow of Climate Finance in 2010-2012 (in $ per year) as per UNFCCC Standing Committee on Finance
from developed countries±
±
±
Other
±
±
UNFCCC funds
Quality of measurement and reporting:
Source: UNFCCC Standing Committee on Finance, 2014
A major development with respect to climate finance took place at the 2009 Copenhagen climate summit, where developed countries promised to annually jointly mobilise USD 100 billion of climate finance by 2020 for mitigation and adaptation in developing countries. While the commitment did notinclude any specific targets for the financing levels to be achieved within the timeframe to 2020, anassessment of climate finance flows from developed countries to developing countries between 2013and 2014 was carried out with the objective of informing the negotiations on climate finance at COP21in Paris (OECD, 2015).
The report estimated that climate finance flows from developed to developing countries had reachedUSD 62 billion in 2014, up from USD 52 billion in 2013, with bilateral public climate finance represent-ing a significant proportion, i.e. USD 22.8 billion per year and multilateral climate finance attributableto developed countries estimated at USD 17.9 billion in 2013-14. Thus, approximately 71% of the totalfunds comes from public finance. However, these numbers were challenged by a number of govern-

54
ments, think tanks and analysts for reasons such as including funding for projects where climate changewas not the principal objective, non-concessional financing, and export credit guarantees (DeutscheKlimafinanzieurg, 2015). A paper by the India’s Ministry of Finance suggested that the number couldbe as low as USD 2.2 billion (Ministry of Finance, Government of India 2015).
At the Paris negotiations, climate finance was considered to be an issue of the highest importance because many developing countries had listed mitigation commitments in their INDCs as conditionalupon receiving international “support” – broadly referring to finance and to some extent, technologytransfer. The developing countries, thus wanted firm commitments from developed countries, 5 yearcycles for setting climate finance targets and language that would require developed countries to ensurethat the finance would be “new and additional” rather than already promised aid repackaged as climatefinance.
Eventually, the Paris Agreement ended up offering nothing new or substantial to developing countries.It requires that developed countries provide financial resources to assist developing country Parties inboth mitigation and adaptation; however this commitment is already enshrined in the UNFCCC. Insteadof ratcheting up the promised climate finance from USD 100 billion per year after 2020, the accompa-nying decisions text extends this promise till 2025. Afterwards, a new number is to be agreed uponwith USD 100 billion per year as a floor.
However, the Agreement did take into consideration the fact that adaptation efforts were receiving avery small share of the overall climate finance flows. As per the OECD report, only 16% of internationalclimate finance went into adaptation in 2013 and 2014. Thus, the Agreement mentions that the scaledup financial resources should ideally be balanced between adaptation and mitigation efforts. This isan important development for ASEAN as it called for Parties to “…recognise the extreme vulnerabilityof ASEAN Member States to climate change, and therefore reflect the importance of strengtheningadaptation and climate resilience capacity in the 2015 agreement” as part of its Joint Statement onClimate Change to COP21 (ASEAN, 2015).

55
The ASEAN Member States (AMS) have been working on harmonizing their environmental policies sincethe 1990s when the first regional Strategic Plan of Action on the Environment was introduced for theperiod 1999-2004 (Trevisan, 2013). Joint climate co-operation activities were launched in the secondof half of the 2000s. From one side, they aim to establish a joint representation at the global UNFCCCnegotiations. From the other side, they work for the harmonization of climate change activities at theregional (ASEAN) level.
ASEAN COUNTRIES AT THE CLIMATE CHANGE NEGOTIATIONS
According to the official UN grouping, the Southeast Asian states are part of the Asian states at the ne-gotiations. As for negotiating coalitions, the AMS are members in the G77 and China group; Cambodia,Lao PDR and Myanmar are also involved in the LDC group while Malaysia, Philippines and Thailandparticipate in the LMDC group. Many of the AMS are also members in various international and regionalclimate initiatives. An overview of AMS membership in negotiating coalitions and other climate initiativesis presented in Table 5.
Table 8: ASEAN Member States in Climate Negotiating Groups and Climate Initiatives
5. CLIMATE COOPERATION IN THE ASEAN COMMUNITY
G77
LDC
LMD
C
Coal
ition
for R
ainf
ores
tN
atio
ns
Glo
bal M
etha
ne
Initi
ativ
e
Inte
rnat
iona
l Pa
rtne
rshi
p on
M
itiga
tion
and
MR
V
LED
S G
loba
l Pa
rtne
rshi
p
Asia
LED
S Pa
rtne
rshi
p
REE
EP
RED
D+
par
tner
ship
Brunei Darussalam ¨ ¨
Cambodia ¨ ¨ ¨ ¨
Indonesia ¨ ¨ ¨ ¨ ¨ ¨ ¨ ¨
Lao PDR ¨ ¨ ¨ ¨
Malaysia ¨ ¨ ¨ ¨ ¨ ¨
Myanmar ¨ ¨ ¨
Philippines ¨ ¨ ¨ ¨ ¨ ¨
Singapore ¨ ¨ ¨ ¨ ¨
Thailand ¨ ¨ ¨ ¨ ¨ ¨ ¨
Viet Nam ¨ ¨ ¨ ¨ ¨ ¨ ¨

56
In recent years, the AMS have also recognized the importance of joint representation at the climatenegotiations and have sought to promote their common regional interests. As a result, the AMS countryleaders issued a joint statement for the COP13, 15, 16 and 17, respectively in 2007, 2009, 2010,2011 and 2014.44 On 21 November 2015 in Kuala Lumpur, AMS country leaders adopted a joint statement on climate change to the COP21 on the occasion of its 27th ASEAN Summit. The pre-COP21statement focused on the Paris agenda and urged all Parties to the UNFCCC to recognise the extremevulnerability of AMS to climate change, and therefore reflect the importance of strengthening adaptationand climate resilience capacity in the 2015 Agreement.45
Over the years, joint AMS statements have recognised climate change as a serious threat to humanityand sustainable development and the high climate vulnerability of the ASEAN. The importance of ‘com-mon but differentiated responsibilities’ was also highlighted and the statements repeatedly called onAnnex I Parties to continue taking the leading role in climate change activities by setting more ambitiousemissions mitigation commitments, and by providing financial and technological support to developingcountries. At the same time, the statements emphasised the AMS’ willingness to contribute to theglobal negotiations, amplify their regional co-operation to tackle the climate challenge, implement mit-igation commitments and support clean energy and low-carbon development. Furthermore, the impor-tance of the Clean Development Mechanism, the Adaptation Fund and the REDD+ mechanisms, werealso underlined in the statements.
Box 67: ASEAN Standpoints on REDD
44 ASEAN Joint Statement on Climate Change to COP20 to the UNFCCC and CMP10 to the Kyoto Protocol (25th ASEAN Summit,2014); ASEAN Leaders’ Statement on Climate Change to COP17 to the UNFCCC and CMP7 to the Kyoto Protocol (19th
ASEAN Summit, 2011); ASEAN Leaders’ Statement on Joint Response to Climate Change Ha Noi, 9 April 2010, ASEANJoint Statement on Climate Change to COP15 to the UNFCCC and CMP5 to the Kyoto Protocol (15th ASEAN Summit, 2009);ASEAN Declaration on the 13th session of the Conference of the Parties to the UNFCCC and the 3rd session of the CMP tothe Kyoto Protocol (2007) URL: http://environment.asean.org/documentation/
45 ASEAN Joint Statement on Climate Change to the 21st session of the Conference of Parties to the UNFCCC (2015). URL: http://environment.asean.org/download/climate-change/agreement/ASEAN-Joint-Statement-on-Climate-Change-Adopted.pdf
As an important forestry block, controlling approximately 16% of global tropical forests, theAMS also issued a position paper in 2008 on Reducing Emission from Deforestation and ForestDegradation (REDD) in Developing Countries (ASEAN, 2008). It suggested that emissionsmeasuring methods as well as mitigation activities should be less complicated and called forgreater investment, technology transfer and capacity-building related to deforestation.
In the 2009-2011 statements, AMS recurrently confirmed the importance of REDD+ for theregion and outlined the importance of such a mechanism in ensuring emissions mitigation,biodiversity protection and in contributing to poverty reduction. Most recently the ASEAN released a statement on the methodological issues related non-market based approachesand non-carbon benefits under the REDD+ mechanism in March 2014 (ASEAN, 2014).
From 2009 onwards, the climate vulnerability of the AMS was also outlined in the statements. In 2009,the AMS outlined the vulnerability of urban population, called for an integrated coastal and ocean management approach and for the creation of the Adaptation Framework. In 2011, in order to assessclimate impacts and vulnerabilities for the region, the preparation of an ASEAN Report on ClimateChange Impacts and Vulnerability was announced.

57
REGIONAL CLIMATE CO-OPERATION AMONG THE ASEAN MEMBER STATES
The AMS countries confirmed the importance of regional climate co-operation in various meeting statements and declarations since 2007.46 After initial efforts, the ASEAN climate co-operation wasfurther strengthened with the launch of the 2009-2015 Road Map for an ASEAN Community. One ofthe strategic objectives (D.10) of the ASEAN Socio-cultural Community Blueprint under the Environmen-tal Sustainability section is to respond to climate change and to address its impacts. It aims to encour-age a common understanding of the adverse effects of climate change and to ensure theimplementation of necessary mitigation and adaptation actions in all sectors affected.
As foresaw in the Socio-cultural Community Blueprint, the ASEAN Climate Change Initiative (ACCI) wasestablished in 2009 at the 11th ASEAN Ministerial Meeting on Environment. Co-ordinated by the ASEANWorking Group on Climate Change (AWGCC), the ACCI serves as a consultative platform to strengthenthe co-operation and co-ordination among sectoral institutions as well as to enhance ASEAN represen-tation at international negotiations.
At the 16th ASEAN Summit in 2010 the ASEAN Leaders’ issued a ‘Joint Response to Climate Change’.They repeatedly urged for a global solution to the climate challenge as well as pledged for the develop-ment of a climate change resilient ASEAN community (ASEAN, 2010). In line with the latter, an ASEANAction Plan on Joint Response to Climate Change (AAP-JRCC) was developed by the AMS. Based on theRoadmap for an ASEAN Community 2009-2015, it seeks regional co-operation opportunities in termsof adaptation and mitigation options, climate research and global climate negotiations (ASEAN, 2012b).The AWGCC of the ACCI was designated for the implementation of the Action Plan and a lead countrywas appointed for the co-ordination of the implementation of each action programme point.
Box 8: Summary of the detailed programme of the ASEAN Action Plan on Joint Response to Climate Change
46 Examples include the ASEAN Declaration on Environmental Sustainability (13th ASEAN Summit in 2007), the SingaporeDeclaration on Climate Change, Energy and the Environment (3rd EAS Summit in 2007), the Singapore Resolution on Environmental Sustainability and Climate Change (11th AMME in 2009).
• Adaptation: Actions include strengthened climate research and R&D activities, an infor-mation and experiences exchange about adaptation efforts and development, and anASEAN work programme for disaster risk reduction and management. The importance ofbuilding resilience in the hydrological and agricultural sectors to reduce water stress andenhance food security is outlined.
• Mitigation: Actions include the exchange of emissions reduction best practices in differentsectors (such as energy production, land use and forestry), identification of low-carbondevelopment solutions, promotion of Nationally Appropriate Mitigation Actions (NAMAs),MRV and CDM mechanisms of the Kyoto Protocol and development of a carbon cap andtrade system in the region.
• Common activities for finance and investment, technology transfer and capacity building:Actions include the promotion of multilateral funds, private sector investments, supportfor technology transfer by exchange of experiences and by strategic co-operation with theprivate sector and capacity-building of relevant stakeholders related to national GHG in-ventories, to global negotiations and to adaptation capacities.
• Strengthen co-operation with other regional co-operations: To promote awareness of cli-mate change and enhance climate-related research.

58
The ASEAN countries commitment to the ACCI and the AAP-JRCC was also strengthened in the BangkokResolution on ASEAN Environmental Cooperation (ASEAN, 2012c). In addition, the co-ordinating bodyof the ACCI, the AWGCC also meets regularly to discuss the implementation of climate activities underthe ASCC Blueprint 2009-2015.47
Furthermore, many other climate-relevant activities are being undertaken in the framework of theASEAN co-operation. These include both mitigation and adaptation actions under general environmentalprotection, disaster risk reduction, sustainable energy, transport, urban development, natural resourcemanagement and agricultural production agreements and initiatives (Letchumanan, 2010 and Trevisan,2013).
Table 9: ASEAN agreements and initiatives relevant to climate change
Theme Agreement/Initiative
Air pollution The ASEAN Agreement on Trans-boundary Haze Pollution
Disaster risk management
ASEAN Agreement on Disaster Management and Emergency Response2010-2015
Sustainable energy ASEAN Plan of Action for Energy Cooperation 2010-2015
Sustainable transport
ASEAN-Japan Action Plan on Environment Improvement in Transport Sector
ASEAN-Germany technical assistance project on “energy efficiency andclimate change mitigation for the land transport
ASEAN-EC Air Transport Integration Project (AATIP)
Urban planning
ASEAN Initiative on Environmentally Sustainable Cities
Cool ASEAN, Green Capitals Initiative
ASEAN Environmentally Sustainable City (ESC) Award Programme
Environmental education ASEAN Environmental Education Action Plan (AEEAP)
Water resource management
The ASEAN Strategic Plan of Action on Water Resources Management(ASPA-WRM)
ASEAN Marine Water Quality Management Guidelines & Monitoring Manual
Natural resource use andAgriculture
The ASEAN Multi-Sectoral Framework on Climate Change: Agriculture,Fisheries and Forestry Towards Food Security (AFCC Framework)
The Rehabilitation and Sustainable Use of Peatland Forests in SouthEast Asia Project
Nature conservation
ASEAN Heritage Parks (AHP) Programme
Heart of Borneo Initiative (HoB)
Coral Triangle Initiative (CTI)
Source: Letchumanan, 2010, Trevisan 2013 and ASEAN Co-operation on Environment website
47 The 5th Meeting of the ASEAN Working Group on Climate Change (AWGCC) was held in April 2014 in Jakarta, Indonesia.

59
In the future, as emphasised in the Road Map for an ASEAN Community 2009-2015, the ASEAN aimsto address climate change more comprehensively through all-sector co-operation. Besides the existingregional climate change co-operation setting, it is also crucial that the AMS set and pursue nationalstandards/commitments and undertake adaptation and mitigation actions at the national level. Theseinitiatives can amplify the results of the regional climate co-operation activities and accelerate the movetowards climate-resilient societies and low-carbon economic development. This commitment was further reiterated in the Declaration on the ASEAN Post-2015 Environmental Sustainability and ClimateChange Agenda, adopted on the occasion of the 27th ASEAN Summit in Kuala Lumpur, Malaysia, on 21November 2015. The Declaration is one in which all AMS declared their commitment to implement actions aligned with the ASEAN Action Plan on Joint Response to Climate Change and adopt actionplans on mitigation and adaptation at the national and regional level (ASEAN, 2015). ASM, in theirASEAN Joint Statement On Climate Change to the 21st Session of the Conference of the Parties to theUnited Nations Framework Convention on Climate Change (COP21) also agreed to “explore means offurther enhancing sustainable development efforts throughout the ASEAN region during the pre-2020period, recognising that such efforts can be the fastest and most efficient way of closing the “ambitiongap”” (ASEAN, 2015b).
THE PARIS AGREEMENT AND ASEAN
The Paris Agreement and INDCs submitted by countries signal their willingness to take action to reducetheir emissions in the context of their respective national circumstances. While overall pledges madein the INDCs fall short of meeting the target of keeping the global temperature rise below 2°C, onemust see this as the first step in the context of bigger ambitions. The Agreement aspires to efforts thatcould lead to keeping the global temperature rise to a more ambitious 1.5°C, early peaking of emissions, and a zero net emission world in the second half of this century. With these broad contours,a robust arrangement in place for monitoring, reporting and verification of mitigation actions, and aglobal review every five years with a view to ratcheting up ambition in NDCs, one can remain optimisticabout the delivery of commitments.
Progressively Ambitious Targets
While many of the ASEAN countries still rely on fossil fuels and other high carbon-intensive processes,the clear articulation in their INDCs is to either reduce emission intensity of growth (e.g. Malaysia, Singapore), undertake emission reductions from business-as-usual levels (e.g. Indonesia, Philippines,Thailand, and Viet Nam), increase the share of renewable energy in the energy mix (e.g. Lao PDR) orimprove forest cover (e.g. Cambodia, Lao PDR). All of these measures are indicative of their resolve toshift their national emissions trajectories towards a low-carbon path.
However, the success of the Paris Agreement will depend on countries progressively setting more ambitious targets with each successive global stocktake. Thus, ASEAN countries must also continuouslymonitor their progress towards their 2020 and 2030 targets. At the same time, they must keep trackof technological advancements and their financial status to determine whether they can graduate towards higher ambition targets or target-types such as absolute emission reductions compared to abase year.
Transparency and Accountability
Transparency and accountability are key to the success of Paris Agreement because it entails a pledgeand review system rather than top-down targets with stringent compliance. The regular stocktaking ofthe achievement of pledges in 5-year cycles beginning in 2023 is a facilitative mechanism to ensurethat the global trajectory of emissions is monitored, taking into account mitigation, adaptation, meansof implementation and support, equity, and the best available science.
The ASEAN countries will also have to play their part by ensuring that they comply with the requirementsof the transparency framework and disclose accurate information in a timely manner, so that the stocktakes can accurately measure global progress. Current institutional frameworks in ASEAN

60
countries for reporting information as required currently will have to be strengthened further and thetechnical capability of these institutions will have to be upgraded as the new MRV systems supersedethe current ones.
Finance and Support
The Agreement has reiterated the goal that developed countries must jointly mobilize USD 100 billionper year from 2020. The decision text also states that the USD 100 billion target is a floor value andthat a new target will be set before 2025, bearing in mind the needs and priorities of developing countries. This is a clear recognition that financing needs will be higher in the future.
To access this funding, a first step that countries in ASEAN could take would be to clearly articulate intheir NDCs the “conditional” actions and contributions, along with the financing required for such actions. In addition, countries in the region will need to build adequate capacity and institutions to tapinternational climate finance from various funds. For instance, to access the Green Climate Fund, theywould need to establish National Designated Authorities (NDA) with clear mandates, and perhaps, ifthey desire so, National Implementing Entities (NIE) for direct access. In addition, a clear articulationof capacity building needs and associated support required could be channelled through the Paris Committee on Capacity Building (PCCB) established under the Paris Agreement. In this section we provide an overview of the climate vulnerabilities, adaptation needs, basic emissions characteristics,climate change strategies, policies and activities of each ASEAN Member State.

61
This chapter provides an overview of climate vulnerabilities, adaptation needs, emissions levels, climatechange strategies, policies and activities of all ASEAN Member States.
Figure 17: ASEAN Member Countries
6. THE CLIMATE POLICY PROFILE OF THE ASEAN MEMBER STATES
Source: Strengthening Human Rights and Peace Research and Education in ASEAN (ShapeSEA)

62
Table 10: Selected socio-economic indicators for ASEAN Member States
Country
Total landarea
Total population
Populationdensity
Annualpopulation
growth
GDP at currentprices
GDP per capita atcurrent prices
km2 thousand personsper km2 % million PPP
2014 2014 2014 2014 2014 2014 2014
Brunei Darussalam
5,769 413.0 72 1.7 17,108 41,424 82,850
Cambodia 181,035 15,184.1 84 1.5 16,771 1,105 3,334
Indonesia 1,860,360 252,164.8 136 1.3 983,571 3,901 11,498
Lao PDR 236,800 6,809.0 29 1.9 11,777 1,730 5,096
Malaysia 330,290 30,261.7 92 1.0 326,346 10,784 24,607
Myanmar 676,577 51,486.0 76 0.9 65,785 1,278 4,923
Philippines 300,000 101,174.9 337 1.8 284,910 2,816 6,846
Singapore 716 5,469.7 7,638 1.3 307,872 56,287 82,714
Thailand 513,120 68,657.0 134 0.6 373,225 5,436 14,333
Viet Nam 330,951 90,630.0 134 1.0 186,224 2,055 5,644
ASEAN Total 4,435,618 622,250.2 140 1.2 2,573,589 4,136 10,700
Source: ASEAN statistics, 2015
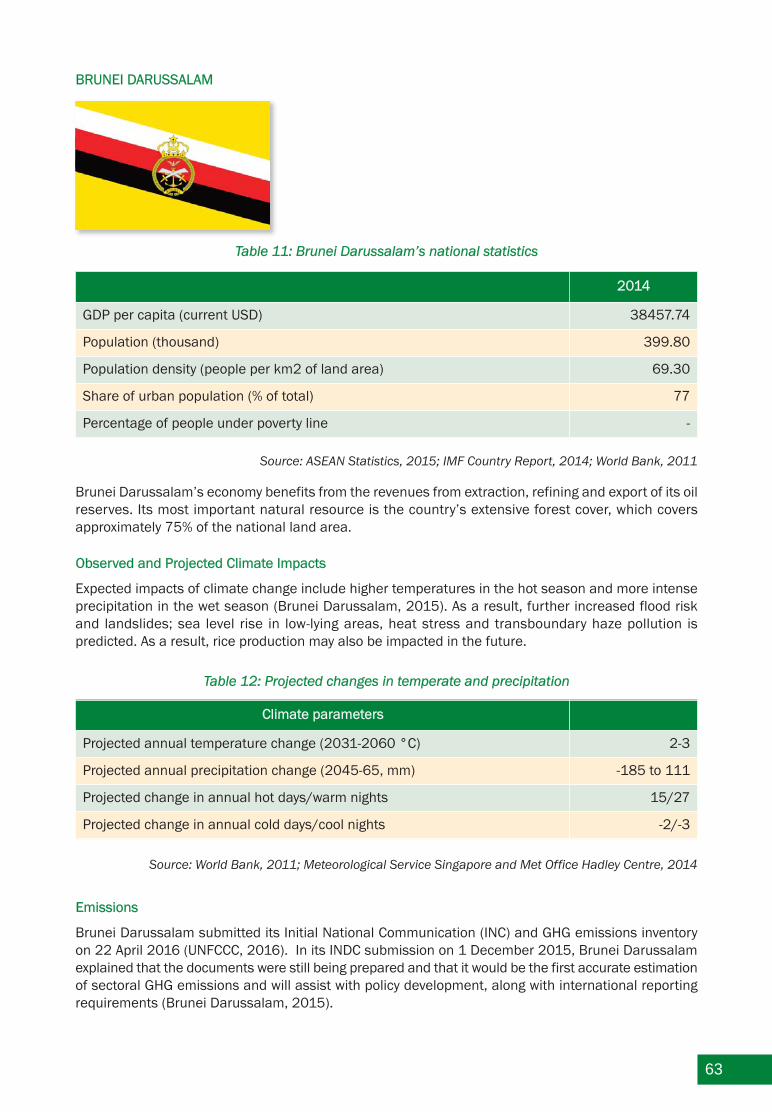
63
Brunei Darussalam’s economy benefits from the revenues from extraction, refining and export of its oilreserves. Its most important natural resource is the country’s extensive forest cover, which covers approximately 75% of the national land area.
Observed and Projected Climate Impacts
Expected impacts of climate change include higher temperatures in the hot season and more intenseprecipitation in the wet season (Brunei Darussalam, 2015). As a result, further increased flood riskand landslides; sea level rise in low-lying areas, heat stress and transboundary haze pollution is predicted. As a result, rice production may also be impacted in the future.
Table 12: Projected changes in temperate and precipitation
BRUNEI DARUSSALAM
Table 11: Brunei Darussalam’s national statistics
2014
GDP per capita (current USD) 38457.74
Population (thousand) 399.80
Population density (people per km2 of land area) 69.30
Share of urban population (% of total) 77
Percentage of people under poverty line -
Climate parameters
Projected annual temperature change (2031-2060 °C) 2-3
Projected annual precipitation change (2045-65, mm) -185 to 111
Projected change in annual hot days/warm nights 15/27
Projected change in annual cold days/cool nights -2/-3
Source: ASEAN Statistics, 2015; IMF Country Report, 2014; World Bank, 2011
Source: World Bank, 2011; Meteorological Service Singapore and Met Office Hadley Centre, 2014
Emissions
Brunei Darussalam submitted its Initial National Communication (INC) and GHG emissions inventoryon 22 April 2016 (UNFCCC, 2016). In its INDC submission on 1 December 2015, Brunei Darussalamexplained that the documents were still being prepared and that it would be the first accurate estimationof sectoral GHG emissions and will assist with policy development, along with international reportingrequirements (Brunei Darussalam, 2015).

64
CLIMATE CHANGE STRATEGIC PLANNING
Brunei Darussalam acceded to the United Nations Framework Convention on Climate Change (UNFCCC)on 7 August 2007 and it entered into force on 5 December 2007. The country later acceded to theKyoto Protocol on 20 August 2009 and it entered into force on 18 November 2009. The country hasalso signed different regional environmental agreements, such as the ASEAN Agreement on Trans-boundary Haze Pollution, the ASEAN Plan of Action on Energy Cooperation of 2010-2015 and the Heartof Borneo Declaration in 2007.
Brunei Darussalam focuses on forestry and sustainable development and has previously developed itsfirst National Environment Strategy in 1996. Already in its 8th National Development Plan (2001-2005),the Brunei Government allocated BND 91.9 million for the implementation of environment related projects, which constituted 1.26% of the total development allocation. Subsequently, the country alsoissued the Brunei 2035 Vision or “Wawasan Brunei 2035” and its underlying 9th and 10th NDP for 2007-2012 and 2012-2017 respectively. Brunei Darussalam’s INDC highlights that the “priority of the Visionto safeguard the welfare of their people and its plan of ensuring a clean, green and healthy environment for every citizen” (Brunei Darussalam, 2015, p2). In line with the principles of the Vision,in order to promote sustainable economic development, sectoral strategies were also developed.
Regarding climate change, its INDC notes that the Government of Brunei Darussalam is integrating theneed to enhance climate resilience and adaption to climate change including the protection of bothterrestrial and marine biodiversity into national development plans. Brunei Darussalam’s Disaster Management Order (2006) is an example of a national plan and strategy to enhance climate resilience.There is also a new environmental law called the Environmental Protection and Management Order2016 which is currently undergoing refinement before being gazette (Brunei Darussalam Ministry ofDevelopment, 2016). Further, its INDC notes that “sectoral adaptation plans currently exist; with furthereffort these can be developed into a national integrated and coordinated adaptation plan” (BruneiDarussalam, 2015, p7). The INDC expects that plans that address extreme weather and climate eventsand the vulnerability study can provide starting points for a National Adaptation Plan (NAP) under theUNFCCC.
Total GHG/CO2 emissions2010
(UNFCCC)2011
(World Bank)2012 (WRI)
CO2 emissions without LUCF (kt) 9,743.20 8,400.00
CO2 net emissions/ removals by LUCF (kt)
CO2 net emissions/removals with LUCF (kt)
GHG emissions without LUCF (kt) 10,200 20,050.00
GHG net emissions/removal by LUCF (kt) 2,630
GHG net emissions/removal with LUCF (kt) 7,400 22,070.00
CO2 emissions per capita emissions without LUCF(metric ton)
24.40 20.38
Source: Brunei Darussalam Ministry of Development, 2015, World Bank, 2016 & WRI, 2016
In 2014, the UNFCCC issued a Country Brief on Brunei Darussalam citing figures up to 2012 for fuelcombustion and GHG emissions (UNFCCC, 2014b).
Table 13: Emissions Summary for Brunei Darussalam
65
Climate Change Institutional Framework
The Department of Environment, Parks and Recreation was created in 1992 within the Ministry of Development to co-ordinate environmental protection activities in the country and at the internationallevel.
The National Council on Climate Change was established with the aim to develop and implement climatechange strategies, and is led by the Ministry of Development and the Energy Division at the Prime Minister's Office (Brunei Times, 2011).
To support the development of the national energy policy a National Energy Research Institution wascreated in 2011 (Brunei Darussalam, 2015).
Climate Actions
Brunei Darussalam aims to work on raising environmental awareness, mainstreaming environmentalconsiderations into planning, extending natural resource assessment and information, improving theurban and rural environment, and protecting biodiversity, forests, coastal and marine areas (BruneiDarussalam, 2012). Examples of flagship initiatives include a Mangrove Tree Planting initiative by thelocal NGO Green Brunei, the Brunei Recycling Drive educational project, the Brunei Youth EnvironmentalLeadership Programme, and the establishment of a solar power plant with 1.2 MW capacity. (BruneiDarussalam, 2012 and ACCAD, 2014).
Brunei Darussalam’s INDC stated that the Energy Department Prime Minister’s Office together withthe Ministry of Finance are looking to identify suitable financial incentives which can be introduced forhousehold appliances and in the transportation sector (Brunei Darussalam, 2015). On raising levelsof awareness about climate change, the country’s INDC noted that the Energy Department Prime Minister’s Office with the Ministry of Education’s Science, Technology and Environment Partnershipwill continue or further extend existing initiatives (e.g. an Energy Clubs to promote energy efficiencymeasures in schools or energy saving seminars for newly appointed government officials), as well as,it will launch additional initiatives (e.g. an Energy Week to promote energy efficiency measures to thepublic) and will target additional stakeholder groups, such as rural communities (Brunei Darussalam,2015).
Intended Nationally Determined Contribution
Brunei Darussalam submitted its INDC on 1 December 2015. The INDC’s mitigation component is summarised in the table below:
Table 14: Brunei Darussalam’s INDC in sectoral breakdown
Sectors Target Base year Target year
Energy
Reduce total energy consumption by 63% From BAU
By 2035Reduce energy intensity by 45% From 2005
Increase the share of renewables to 10% n.a.
Land TransportReduce carbon dioxide emission from morningpeak hour vehicle use by 40%
From BAU By 2035
ForestryIncrease the total gazette forest reserves to55%
From current 41% n.a.

66
Brunei Darussalam’s INDC describes its implementation plans in the energy, land transport and forestryand land use sectors. In terms of energy, the country plans to implement a number of policies and regulatory frameworks for energy efficiency and conservation, including electricity tariff reform, buildingguidelines for the non-residential sector, standards and energy labelling for products and appliances,energy management policy and fuel economy regulation.
Other project based energy efficiency measures such as the increased use of energy efficient street-lights are also planned. The country intends to meet its share of renewables goal by increasing the useof solar power and waste-to-energy resources. In the land transport sector, Brunei Darussalam published its Land Transport Master Plan (LTMP) in 2014 in line with their Vision 2035 and it includedplans to reduce by 40% morning peak hour carbon dioxide emissions against a BAU scenario in 2035.The country also intends to implement fuel standards, and promote electric and hybrid vehicles to meetits goals. In the forestry and land use sectors, 41% of the country’s land area has already been gazetteas forest reserves but work is underway to increase this to 55%. There has also been a ban on loggingconcessions in the forest reserves with the exception of restricted and controlled logging in designatedInter-Reverine Zones (IRZ). The INDC also highlighted Brunei Darussalam’s involvement in the “Heartof Borneo” Initiative, a trilateral forest conversation agreement it signed with Malaysia and Indonesiain 2007 to protect its endemic forest and ecosystems.
The INDC identified implementation challenges including the lack of comprehensive legislative framework, weak institutional co-ordination and stakeholder collaboration; lack of national GHG inventory; limited research expertise and availability of technologies in the field of climate change mitigation and adaptation; and a general lack of social awareness.
The INDC also contains a section on adaptation, wherein it identifies climate related risks and prioritysectors for Brunei Darussalam as well as details planning for implementation of the INDC and meansof implementation.
Country References Used
• Brunei Darussalam Ministry of Development (2016) Official Website of the Departmentof Environment, Parks and Recreation Environmental Acts and Guidelines.
• Brunei Darussalam Ministry of Development (2015) Brunei Darussalam’s Intended Nationally Determined Contribution (INDC)
• Brunei Times (2011) National Council on Climate Change set up with His Majesty's consent.
• Brunei Darussalam (2012) Country Statement at the 18th session of the Conference ofthe Parties (COP18)
• Meteorological Service Singapore and Met Office Hadley Centre (2014) A Regional ClimateModeling Experiment for Southeast Asia
• Renewable Energy and Energy Efficiency Partnership (2014) Brunei Darussalam
• Southeast Asia Network of Climate Change Offices (2014) ASEAN Climate Change ActionDatabase
• UNFCCC (2014) UNFCCC Country Brief 2014: Brunei Darussalam
• UNEP (2012) Building a Green Economy in the Heart of Borneo
• UNSD (2014) UN Data
• World Bank (2011) The Little Data Book on Climate Change
• World Bank (2014b) Open Database
[The full references are included in the bibliography.]

67
Cambodia is a low emitter and highly vulnerable country to the negative effects of climate change. Itsdevelopmental priorities include reducing the percentage of people living under the poverty line, whichit successfully halved from 53% in 2004. Cambodia is largely agrarian, although industrial productionhas been steadily rising over the last two decades. Due to the lack of infrastructure and institutionalcapacities, the country’s adaptive capacity is also limited, which further increases the economic lossesrelated to natural disasters (World Bank, 2014).
Observed and Projected Climate Impacts
Cambodia has recently been facing more frequent natural disasters including floods and droughts. Inthe future, sea level rise will pose a significant threat to low-lying coastal areas, which will cause stormsurges, high tides, coastal erosion and seawater intrusion (World Bank, 2014).
Table 16: Observed and projected changes in temperature and precipitation
CAMBODIA
Table 15: Cambodia’s national statistics
2014
GDP per capita (current USD) 897
Population (million) 15,184
Population density (people per km2 of land area) 84
Share of urban population (% of total) 21
Percentage of people under poverty line 20.50
Source: ASEAN Statistics, 2015; World Bank, 2015
Observed Projected
Temperature +0.8 °C increase since 1960 +0.7-2.7°C increase by 2060
RainfallInconsistent and not yet significantchanges
Expected to increase in the monsoonareas (–109 to 95 mm by 2045-2065)
Source: World Bank, 2014

68
Adaptation Needs
Support in accelerating adaptation efforts is required in three major areas (World Bank, 2014 andGSSD 2015):
• Agriculture and forestry: Introduction of climate-resilient crop varieties, grain banks fordrought periods, improved water use, improved access to weather information for farmers,and improved forest resource management (including restoration and conservation).
• Water resources: Quality and quantity assessment studies, improved water and watershedmanagement practices, and flood prevention methods.
• Healthcare: Health education programmes, health extension services, and malaria surveillance systems.
• Coastal zones: Climate proofing of infrastructure projects; adaptation plans in coastalareas; further and more detailed studies on vulnerabilities in coastal areas and adaptationsolutions.
GHG Emissions
The latest available UNFCCC GHG emissions data is for 2000. Although the CO2 emissions have increased since 1994, Cambodia’s per capita CO2 emissions are still very low in international and regional comparisons. While mitigation actions are not priorities in Cambodia, it is important to protectthe carbon sinks: the total forest cover has been considerably decreased, from 73.3% in 1990 to 53.6%in 2015 (World Bank, 2016). GHG emission estimations of the World Resource Institute indicate thatthe emissions from LULUCF had a significant contribution to Cambodia’s GHG emissions by 2012.
Table 17: Emissions summary for Cambodia
Total GHG/CO2e emissions2000
(UNFCCC)2011
(World Bank)2012 (WRI)
CO2 emissions without LUCF (kt) 2,052.59 4,495.74 4,170.00
CO2 net emissions/removals by LUCF -25,307.13
CO2 net emissions/removals with LUCF (kt) -23,245.24
GHG emissions without LUCF (kt) 24,108.70 25,850.00
GHG net emissions/removals by LUCF -24.565.50
GHG net emissions/removals with LUCF (kt) -456.81 49,120.00
CO2 emissions per capita emissions without LUCF (metric ton)
0.308 0.280
Source: GSSD 2015; World Bank 2016 and WRI, 2016
Climate Change Strategic Planning
Cambodia acceded to the UNFCCC on 18 December 1995 and it entered into force on 17 March 1996.The country later acceded to the Kyoto Protocol on 22 August 2002 and it was entered into force on 16February 2005.

69
The Government of Cambodia laid down its development objectives in the Rectangular Strategies forGrowth, Employment, Equity and Efficiency (2004) and in its latest National Strategic DevelopmentPlans (NSDP) for 2009-2013 and 2014-2018. The NSDP 2014-2018 set climate change as a cross-cutting issue, making climate change mainstreaming an integral part of development and povertyreduction efforts (Royal Government of Cambodia Ministry of Environment, 2016).
Linked to the national development objectives, Cambodia prepared a National Adaptation Programmeof Action on Climate Change in 2006. In 2013, it adopted the Climate Change Strategic Plan CCSP(2014-2023), defining eight strategic climate objectives and underlying action areas in line with existingdevelopment strategic objectives. These mostly focus on decreasing climate vulnerabilities and improving adaptation capacities, but also targets low-carbon economic development. The ClimateChange Action Plan (CCAP) for 2016-18, developed by the Ministry of Environment, will operationalizethe implementation of CCSP. The CCAP will implement seventeen actions corresponding to the eightobjectives of the CCSP, with a total budget of USD 28-30 million (Royal Government of Cambodia Ministry of Environment, 2016).
The NSDP 2014-2018 also foresees that the Ministry of Environment will prepare the climate changelegal framework, which will include updating the institutional arrangements, financing arrangements,and mainstreaming of climate change across sectors. Cambodia adopted an Energy Sector Develop-ment Plan (2005-2024) and a National Policy on Green Growth and National Green Growth StrategicPlan (2013-2030) in order to mainstream climate change action across sectors.
Climate Change Institutional Framework
In 2006, the National Climate Change Committee (NCCC) was set up under the Ministry of Environmentas the main public entity responsible for planning and implementing policies, programs, and strategiesfor climate change issues in Cambodia. To support and advise the Committee, a Climate Change Technical Team (CCTT) was also established. The NCCC functioned as the inter-ministerial coordinationmechanism for climate change activities until May 2015, but recently its functions were overtaken bythe newly set up National Council for Sustainable Development (NCSD) (GSSD, 2015).
The Ministry of Environment also has a dedicated climate change department called the Cambodia Climate Change Office (CCCO) which was established in 2003. The CCCO is responsible for various activities including the: “… formulation of draft climate change plans and policies, implementation ofthe UNFCCC, assessment of new technologies to adapt to the adverse effects of climate change or tomitigate GHG emissions, and capacity building and awareness raising” (ibid, p.34). The main govern-ment body responsible for managing the REDD+ process is the REDD+ Taskforce and its Secretariat,but other bodies are also involved in implementation.
The government of Cambodia is also committed to supporting international climate efforts, and worksclosely with developed countries (Sweden, Denmark), international organisations (UNDP) and other regional partnerships (EU, Energy and Environment Partnership Mekong). The Cambodia ClimateChange Alliance was created as the umbrella organisation to bring together multiple players.
Climate Actions
The majority of identified climate activities are targeting adaptation, with special focus on the agriculturesector. Initiatives include water management, flood prevention measures and enhanced resistance toclimate change variables.

70
- Adaptation
- Mitigation
- Disaster Risk Management
- CDM - Clean Development Mechanism
- Low Carbon Technologies
- REDD - Reducing Emissions from Deforestation and forest Degradation
- Climate / UNFCCC Negotiations
- Climate Finance
25
11
7
7
4
3
1
1
Source: Southeast Asia Network of Climate Change Offices, 2016
Project examples include the Cambodia Community-Based Adaptation Program, the Harvest Projectfunded by USAID; the Climate Change and Adaptation Initiative of the Mekong River Commission; therecently concluded Pilot Program for Climate Resilience funded by the Climate Investment Funds or thecurrently ongoing ADB project on Mainstreaming Climate Resilience into Development Planning.
Institutional governance has been identified as one of the major implementation challenges, includingboth the lack of infrastructural and operational capacity. Besides, the second National Communicationto the UNFCCC (GSSD, 2015) noted technical and financial constraints in addressing mitigation andadaptation challenges.
Intended Nationally Determined Contribution
Cambodia submitted its INDC on 30 September 2015 (Kingdom of Cambodia, 2015). The INDC includesboth adaptation and mitigation actions based on its national circumstances. It comprises five sectionsthat include national context; adaptation; mitigation; planning and implementation processes; andmeans of implementation.
As per the INDC, Cambodia will achieve a maximum emissions reduction of 3,100 GgCO2-eq as compared to a baseline scenario with emissions of 11,600 GgCO2-eq by 2030. This is equivalent to areduction of 27% below BAU levels. The breakdown of the target is as follows:
Table 18: Cambodia’s INDC in sectoral breakdown
Figure 18: Number of climate projects and activities in Cambodia, by theme
Sectors Target Base year Target year
Energy Industries 16% n.a. 2030
Manufacturing industries 7% n.a. 2030
Transport 3% n.a. 2030
Other (e.g. waste and buildings) 1% n.a. 2030
Note: Greenhouse gases included are carbon dioxide, methane and nitrous oxide.

71
In addition the estimated contribution of the LULUCF sector will be 4.7tCO2-eq/ha/year, which the government plans to achieve by increasing forest cover to 60% of national land area from the 2010level of 57%. The INDC further notes that while LULUCF accounted for sequestration of 18,492 GgCO2in 2010, this can drop to 7,897 GgCO2 by 2030 if no action is taken, hence achieving the LULUCF targets is important.
Country References Used
• Am et al. (2013) Mainstreaming Climate Change Resilience into Development Planning inCambodia
• ASIA Leds Partnership (2014) Country Profile
• Kingdom of Cambodia (2015) Cambodia’s Intended Nationally Determined Contribution
• Cambodia REDD+ Official Website (2014)
• GSSD (2015) Cambodia’s Second National Communication under the United NationsFramework Convention on Climate Change. General Secretariat, National Council for Sustainable Development/Ministry of Environment, Kingdom of Cambodia, Phnom Penh
• Royal Government of Cambodia (2006) National Adaptation Programme of Action on Climate Change
• Royal Government of Cambodia (2007) National Development Plan
• Royal Government of Cambodia (2008) Rectangular Strategy for Growth, Employment, Equity and Efficiency
• Royal Government of Cambodia (2013) Cambodia Climate Change Strategic Plan 2014-2023
• Royal Government of Cambodia, Ministry of Environment (2016) Climate Change ActionPlan 2016 – 2018
• Southeast Asia Network of Climate Change Offices (2016) ASEAN Climate Change ActionDatabase
• McSweeney (2010) UNDP Climate Change Country Profiles: Cambodia
• UNDP Cambodia (2014) Cambodia Climate Change Alliance
• World Bank (2016) World Development Indicators
• WRI (2016) CAIT Climate Data Explorer
[The full references are included in the bibliography.]

72
INDONESIA
Table 19: Indonesia’s national statistics
Country Parameters 2014
GDP per capita (current USD) 3495
Population (million) 242,326
Population density (people per km2 of land area) 126.80
Share of urban population (% of total) 51.50*
Percentage of people under poverty line 43.30
*Data is for 2012Source: UN Statistics, 2014 and World Bank 2014b
Indonesia achieved rapid economic growth in the last decade, but about 40% of the population stilllives under the poverty line of USD 2 per day. The rapid urbanization and industrialization, high population density – especially in low-lying areas – and the economic dependence on natural resources,all make Indonesia very vulnerable to climate change. The poor will be affected the most by its impacts(World Bank, 2014).
Observed and Projected Climate Impacts
Floods and sea level rise pose a major risk to highly populated urban centers and low-lying island areas.Data from 2011 show that 11.2% of the population live on land areas below 5m in height (World Bank,2011). The country is also affected by droughts caused largely by El Niño, which negatively impact agricultural production. In the future, flood and drought events may worsen and will result in decreasedfood security, higher mortality rates, and increased disaster risk management expenses.
Table 20: Observed and projected changes in temperature and precipitation
Observed Projected
Temperature 0.3°C increase since 1990 0.3°C increase in each decade
Rainfall 2-3% increase since 1990 Changes in precipitation patterns
Sea level rise 5mm per year a total 0,4 to 1,75m by 2100
Source: World Bank, 2014, Republic of Indonesia National Action Plan for Climate Change Adaptation, 2013

73
Adaptation Needs
Priority adaptation areas consist of (World Bank, 2014):
• Agriculture and food security: improved farming practices, improved institutional co-ordi-nation, data and information development, research and awareness raising activities.
• Protection of coastal eco-systems: vulnerability studies, capacity building of fishermen, in-tegrated coastal zone management practices, protection of mangrove forests and im-proved forestation policies.
• Water stress: improved infrastructure and management practices should be developed.
GHG Emissions
The latest available UNFCCC emissions data is from 2012. While the emissions are relatively high, 60%of the GHG and 74% of CO2 emissions were from LUCF. Since 2000, Indonesia considerably increasedits CO2 emissions, but the per capita CO2 emissions are still well below the global level. The GHG emissions calculation of the WRI indicates that the overall GHG emissions have also increased since2000.
Table 21: Emissions summary for Indonesia
Total GHG/CO2 emissions2012
(UNFCCC)2011
(World Bank)2012 (WRI)
CO2 emissions without LUCF (kt) 527,174 563,985.00 45,605.00
CO2 net emissions/removals by LUCF (kt)
CO2 net emissions/removals with LUCF (kt) 1,222,152
GHG emissions without LUCF (kt) 758,979 760,810.00
GHG net emissions/removals by LUCF (kt)
GHG net emissions/removals with LUCF (kt) 1,453,957 1,981,000.00
CO2 emissions per capita emissions withoutLUCF (metric ton)
2.30 3.08
Source: Republic of Indonesia, 2015a; World Bank, 2016 and WRI, 2016
Climate Change Strategic Planning
Indonesia signed the UNFCCC on 5 June 1992 and ratified it on 23 August 1994. It entered into forceon 21 November 1994. As for the Kyoto Protocol, Indonesia signed it on 13 July 1998, ratified it on 3December 2004 and it entered into force on 3 March 2005.
Indonesia included both mitigation and adaptation objectives into its long-term National DevelopmentPlan (2005-2025). Objectives relate to food security, development of clean energy technologies, andenvironmental and disaster management. To feed the second mid-term national development plan(2009-2014) with a long-term guidance on climate change policies, Indonesia adopted the ClimateChange Sectoral Roadmap in 2010. The latest National Medium Term Development Plan 2015-2019

74
(RPJMN 2015-2019) specifies that the sustainable and inclusive economy is to be the foundation ofIndonesia’s development programme and it aims to promote green cities and the development of ruralareas; tackle illegal extraction of natural resources and improve natural resources management.
In 2011, Indonesia also approved a National Action Plan for Greenhouse Gas Emission Reductions witha 26-41% GHG emission reduction commitment by 2020, and introduced targets for renewable energyand biofuels as well as energy conservation. In line with these commitments, Indonesia has alreadyregistered 2 NAMAs to the UNFCCC NAMA Registry. The first one is the Sustainable Urban TransportInitiative (registered in 2012), and the second one is the Smart Street Lighting Initiative (registered in2014).
In 2013, a National Action Plan for Climate Change Adaptation was published. As a cross-cutting thematic plan, it targets food and energy security, health, settlements, infrastructure, and urban andcoastal areas.
In the forestry sector, legislative, planning and enforcement activities still represent a concern, althoughseveral programmes have been implemented by the government, the private sector and communitiesaffected by deforestation (London School of Economics, 2015 and Republic of Indonesia, 2015).
Climate Change Institutional Framework
In 2014, after the election of President Joko Widodo, the institutional framework for climate change issues has been considerably changed (World Bank, 2016c). Before 2014, the National DevelopmentPlanning Agency was responsible for the development of climate change strategic documents. Involving17 ministers and the Head of the Planning Agency, the National Council on Climate Change was estab-lished with the mandate to coordinate the implementation of climate change activities in Indonesia. InJanuary 2015, the National Council on Climate Change (DNPI) and the REDD+ body (Badan REDD+)become part of the Directorate General of Climate Change of the Ministry of Environment and Forestry(London School of Economics, 2015 and World Bank, 2016c). The Directorate is responsible for policyformulation, implementation, monitoring and international co-operation in the field of climate change.
The Ministry of Environment also operates a National GHG Inventory System and the Indonesian ClimateChange Center provides technical input on low-emission development strategies, MRV, and climate resilience. In 2005, the National Commission on Clean Development Mechanisms (KOMNAS MPB) wasalso established. Most recently, the Peatland Restoration Agency was established with support fromthe Norway-Indonesia bilateral partnership (Royal Norwegian Embassy in Jakarta, 2016).
A variety of NGOs also function in Indonesia, such as the Renewable Energy Society, the GeothermalAssociation and the Biofuels Association.
Climate Change Activities
Indonesia undertakes a variety of mitigation and adaptation activities. To mitigate emissions, Indonesiaprimarily plans to improve emissions from the LULUCF and peatlands. The REDD+ and the CDM mechanisms are considered as important programmes in this regard. Many of the adaptation activitiesconcentrate on the most vulnerable agricultural sectors to improve water-management, introduce moreclimate resilient crops, introduce risk-management schemes, and increase awareness among farmers.

75
- REDD - Reducing Emissions from Deforestation and forest Degradation 33
- Climate Finance 26
- Adaptation 25
- Mitigation 25
- Low Carbon Technologies 21
- CDM - Clean Development Mechanism 14
- Disaster Risk Management 9
- Green Growth 8
- Climate / UNFCCC Negotiations 5
- Climate Science 4
- GHG Data/Accounting & Reporting 3
- Applicable to All/ General 1
- NAMAs - Nationally Appropriate Mitigation Action 1
Figure 19: Number of climate projects and activities in Indonesia, by theme
Source: Southeast Asia Network of Climate Change Offices, 2016
The Climate Change Trust Fund and the Climate Change Programme Loan provides funding for a varietyof climate objectives in Indonesia. In 2013, Indonesia initiated a unilateral Joint Crediting Mechanismwith Japan, to encourage Japanese companies to invest in projects in Indonesia. An emissions tradingscheme, the Nusantara Carbon Scheme (NCS) (ETS Skema Karbon Nusantara), was also introducedto facilitate voluntary carbon trading in the country (Jakarta Post, 2013). Supported by the World Bankled initiative, PMR, the scheme is being developed by the Carbon Trade Mechanism Division of the National Council on Climate Change (DNPI). Leading up to 2018, Indonesia is building market readinessand strengthening the fundamental infrastructure for carbon markets, particularly technical readinessaround MRV framework (ADB, 2016).
Main implementation challenges are the lack of coordination between government institutions, the decentralisation of environmental management tasks, and limited mainstreaming of climate changepolicies into development plans, especially in public investment and regional planning. Mitigation-specific implementation challenges include government subsidies on fuels and lack of capacity-buildingsupport in applying for funds earmarked for the development of renewables. As for adaptation activities,local government agencies often lack management capacities and there is also a lack of knowledgeabout existing adaptation activities and lessons learnt from these. The poor institutional and financialcapacities also hamper monitoring and enforcement of deforestation policies.
Intended Nationally Determined Contribution
Indonesia submitted its INDC on 24 September 2015. In its INDC, Indonesia pledged to reduce uncon-ditionally 26% of its GHG against a BAU scenario of 2,881 GtCO2e by 2020 and 29% compared to thesame BAU scenario by 2030. The INDC contains a conditional intended contribution of 41% reductionin emissions below BAU by 2030. This additional 12% is subject to provision in the global agreementincluding through bilateral cooperation, covering technology development and transfer capacity building,payment for performance mechanisms, technical cooperation, and access to financial resources. TheINDC also states sectoral commitments, particularly in the forestry, energy and waste sectors:

Table 22: Indonesia’s INDC in sectoral breakdown
76
Sectors Target Base year Target year
ForestryMoratorium on the clearing of primary forests andprohibiting conversion of peat lands
2010 2016
Energy23% of energy use from new and renewable energyby 2025
n.a. 2025
Waste
Strengthen institutional capacities at the local leveland for urban waste water management; to reducelandfill waste and to develop waste-to-energy tech-nologies
n.a. 2020
As for adaptation, Indonesia’s INDC notes that the Government of Indonesia has developed a NationalAction Plan on Climate Change Adaptation and has mainstreamed this into the National DevelopmentPlan. Indonesia plans to strengthen institutional capacity and implement its medium-term goal of adaptation strategy to reduce risks on all development sectors (agriculture, water, energy security,forestry, maritime and fisheries, heath, public service infrastructure and urban system) by 2030. TheINDC also contains an Annex with Indonesia’s Climate Resilience Strategy, in which it describes thearchipelagic country’s vulnerability to the adverse impacts of climate change and the need to strengthenclimate resilience by integrating adaptation and mitigation efforts in its development planning and implementation.
Indonesia’s INDC describes its planning process, its commitment to institutional development and itsenhanced coordination and synergy between the Ministry of Environment and Forestry, the Ministry ofNational Development Planning (BAPPENAS) and the Ministry of Foreign Affairs in the context of climatechange.
Country References Used
• ASIA Leds Partnership (2014) Country Profile
• Case et al. (2007) Climate Change in Indonesia
• Indonesia Ministry of National Development Planning (N.D.) Development of the Indonesian NAMA’s Framework
• London School of Economics (2015) Climate Change Legislation in Indonesia: An ExcerptFrom The 2015 Global Climate Legislation Study A Review of Climate Change Legislationin 99 Countries
• McSweeney et al. (2010) UNDP Climate Change Country Profiles: Indonesia
• Royal Norwegian Embassy in Jakarta (2016) Indonesia and Norway Collaboration for Peatland Protection and Restoration
• Republic of Indonesia (2015a) First Biennial Update Report (BUR) Under the United Nations Framework Convention on Climate Change

77
• Republic of Indonesia (2015b) National Medium Term Development Plan 2015-2019(RPJMN 2015-2019)
• Republic of Indonesia (2015c) Intended Nationally Determined Contribution
• Republic of Indonesia, Ministry of Environment (2010): Indonesia Second National Communication under the UNFCCC
• Republic of Indonesia (2013) National Action Plan for Climate Change Adaptation.
• Republic of Indonesia (2009) Indonesia Climate Change Sectoral Roadmap
• Republic of Indonesia (2007) National Action Plan on Addressing Climate Change
• Southeast Asia Network of Climate Change Offices (2016) ASEAN Climate Change ActionDatabase
• World Bank (2011) Indonesia: Climate Risk and Adaptation Country Profile.
• UNFCCC (2014) GHG emissions country profile
• UNSD (2014) UN Data
• World Bank (2014) Climate Change Knowledge Portal
• World Bank (2014b) Open Database
• World Bank (2016) Partnership for Market Readiness
[The full references are included in the bibliography.]

Source: Lao PDR National Statistics Bureau, 2015
In recent years, Lao PDR has experienced rapid economic growth (7.5% in 2014). The country is alsorich in natural resources, but its extensive forest cover has been negatively impacted by deforestationwith an estimated average deforestation rate of 1.2 - 1.3% between 1992 and 2002 (The REDD Desk,2016). Since the livelihood of the majority of the population depends on natural resources, the govern-ment aims to promote low-carbon economic development (World Bank, 2014).
In its 8th Five-Year National Socio-Economic Plan (2016-2020) with a Vision to 2030, Lao PDR sets outits long term goal of transiting from a Least Developed Country to a middle income country by 2030,supported by sustainable growth.
Observed and Projected Climate Impacts
The frequency of floods and droughts has increased in the last two decades. In the future, it is expectedthat precipitation changes will increase the frequency of flooding, while temperature increases willresult in more frequent occurrences of disease and water stress. Floods and droughts will negativelyimpact agricultural lands and production, the main livelihood of the rural poor.
Table 24: Observed and projected changes in temperature and precipitation
78
LAO PDR
Table 23: Lao PDR national statistics
Country Parameters 2015
GDP per capita (current USD ) 1,725
Population (million) 6,492
Population density (people per km2 of land area) 27
Share of urban population (% of total) 37
Percentage of people under poverty line (%) 30
Observed Projected
Temperature0.1-0.3 °C increase per decade since1950
Up to 2.6 °C
RainfallDecrease in total rainfall between 1961and 1998
10-30% increase in the eastern andsouthern areas
Source: World Bank, 2014

79
Adaptation Needs
The INDC of the Lao PDR states that the country is highly vulnerable to the impacts of climate changeas its “economy and over 70% of its population are dependent on natural resources for their livelihoodand food supply”(Lao PDR Ministry of Natural Resources and Environment, 2015, p 5). As a result, LaoPDR has developed a National Adaptation Programme of Action (2009) to address current and futureadaptation requirements in the crucial sectors of agriculture, forestry, water and healthcare. Thus, thefollowing needs and programmes are identified in the INDC (Lao PDR Ministry of Natural Resourcesand Environment, 2015, p 6):
• Agriculture and forestry: Promotion of climate resilient management practices and adap-tation technologies.
• Water resources: Improvements to the information system; promotion of climate resiliencein water management practices and in infrastructure development.
• Transport: Increasing infrastructure resilience.
• Healthcare: Infrastructure and disease control programs.
GHG Emissions
Although latest available UNFCCC data (2000) show that most of Lao PDR’s emissions were from LUCF,and that the country was a carbon sink until the early 1990s, LULUCF emissions from WRI data showthat emissions keep rising and falling. The maximum value is for 2010 (29.74 MT CO2e) and the nexthighest value is for 2007 (28.28 MT CO2e). Values for 2011 and 2012 are lower than 2010.
Table 25: Emissions Summary for Lao PDR
Total GHG/CO2 emissions2000
(UNFCCC)2011
(World Bank)2012 (WRI)
CO2 emissions without LUCF (kt) 1,052.20 1,202.77 1,620.00
CO2 net emissions/removals by LUCF (kt) 40,711.80
CO2 net emissions/removals with LUCF (kt) 41,764.00
GHG emissions without LUCF (kt) 8,898.20 10,870.00
GHG net emissions/removals by LUCF (kt) 41,919.80
GHG net emissions/removals with LUCF (kt) 50,818.00 36,280.00
CO2 emissions per capita emissions withoutLUCF (metric ton)
0.19 0.24
Source: Lao PDR Ministry of National Resources and Environment, 2013; World Bank, 2016 and WRI, 2016
Climate Change Strategic Planning
Lao PDR acceded to the UNFCCC on 4 January 1995 and it entered into force on 4 April 1995. On 6February 2003, Lao PDR acceded to the Kyoto Protocol and on 16 February 2005, it entered into force.

In line with the national sustainable development objectives, Lao PDR adopted a Climate Change Strategy in 2010, focusing on seven key areas in terms of adaptation and mitigation actions. A NationalAdaptation Programme of Action (NAPA) was also developed in 2009, identifying the agriculture, water,health and forestry sectors as the most vulnerable. It also took a strategic approach towards disasterrisk management by adopting a National Disaster Management Plan for the period 2012-2015. Thedevelopment of a green economy strategy is also under discussion, since Lao PDR aims to exploit itspotential in solar, wind and hydro energy in a variety of sectors.
Lao PDR has also developed strategic action plans for environmental management, environmental education, biodiversity and forestry, water, and land resource management. One such policy is theForestry Strategy to the Year 2020 that was finalized in June 2004. The Renewable Energy DevelopmentStrategy was adopted in 2011 (Lao PDR, 2011).
A Climate Change and Disaster law is being developed to provide an overarching legal framework forclimate change and disaster management. It is expected to be approved in 2017.
Climate Change Institutional Framework
The National Steering Committee on Climate Change aims to mainstream climate change into the national development plan and identify priority actions across the seven key areas identified in the National Climate Change Strategy (Lao PDR, 2010). The National Environment Committee (NEC) is responsible for the verification of the National GHG Inventory. The Ministry of Natural Resources manages the CDM and Environment (MoNRE), while a separate Task Force and supporting office wascreated for the REDD+ mechanism.
Climate Change Activities
Lao PDR promotes renewable energy deployment and has supported the implementation of numeroushydropower projects in remote rural areas, which provide low-cost electricity. A variety of adaptationprojects have been financed from international sources to develop sectoral strategies, address vulner-abilities, and improve capacities to tackle the climate challenge. The agricultural sector and disasterrisk management are priority areas.
Project examples include a Flood Vulnerability Assessment and Mapping Project by the Mekong RiverCommission, a UNDP-GEF project for Improvement of the Resilience of the Agriculture Sector to ClimateChange Impacts, and a Capacity Enhancement for Coping with Climate Change project funded by ADBand the Nordic Development Fund for Community Based Disaster Preparedness Program (2007-2011).
Implementation barriers include the lack of co-ordination between different government levels, the lackof financial and human capacities within government institutions, and low levels of public awareness.
Intended Nationally Determined Contribution
Lao PDR submitted its INDC on 1 October 2015 (Lao PDR Ministry of Natural Resources and Environ-ment, 2015). In the INDC, mitigation activities under forestry, renewable energy, rural electrification,transport and large-scale hydropower are proposed. Examples of activities and objectives in the listedareas are as follows:
80

81
Sectors Target Base year Target year
Energy
Increase renewable energy share to 30% of energyconsumption
2011 2025
Increase large hydro capacity to 5.5 GW by 2020and further 20 GW by 2030
2015 2030
Rural electrification programme to 90% of households
2010 2020
Forestry Increase forest cover to 70% of land area 2000 2020
Transport Increase share of biofuels to 10% of fuel demand 2011 2025
The INDC also contains a section on adaptation, which highlights the National Adaptation Programmeof Action (2009) and the National Strategy on Climate Change (2010) in addressing immediate andprojected climate change adaptation requirements in agriculture, forestry, water resources, transportand urban development and public health sectors.
The implementation will be coordinated by a cross-ministerial National Disaster Management Committee (NDMC) and the Ministry of Natural Resources and Environment (MoNRE), which will act asa Secretariat. The INDC’s Annex I contains implementation plans, barriers, support required and estimated costs.
Country References Used
• ASIA Leds Partnership (2014) Country Profile
• Lao PDR (2011) Renewable Energy Development Strategy in Lao PDR
• Lao PDR, Ministry of National Resources and Environment (2012) National Rio+20 Reportfor Lao PDR
• Lao PDR Ministry of National Resources and Environment (2013) Second National Communication on Climate Change of Lao PDR
• Lao PDR (2009) National Adaptation Programmes of Action to Climate Change
• Lao PDR (2004) Forestry Strategy to the Year 2020 of the Lao PDR
• Lao PDR Ministry of Natural Resources and Environment (2015) Intended Nationally Determined Contribution
• Southeast Asia Network of Climate Change Offices (2016) ASEAN Climate Change ActionDatabase
• The REDD Desk (2016) REDD in Lao PDR
• UNFCCC (2014) GHG emissions country profile
• UNSD (2014) UN Data
• World Bank (2016) World Development Indicators
• WRI (2016) CAIT Climate Data Explorer
[The full references are included in the bibliography.]
Table 26: Lao PDR’s INDC in sectoral breakdown

82
MALAYSIA
Table 27: Malaysia’s national statistics
Country Parameters 2014
GDP per capita (current USD ) 11,307.00
Population (million) 29.90
Population density (people per km2 of land area) 91.00
Share of urban population (% of total) 74.00
Percentage of people under poverty line (%) 0.60
Source: UNSD, 2014 and World Bank, 2014b
Malaysia experienced steady economic and population growth over the last decade. These trends, alongwith high population densities and high levels of urbanization, have put growing pressure on the country’s natural resources and rich biodiversity.
Observed and Projected Climate Impacts
The total amount of rainfall has not increased noticeably, but rain storms have become more intenseand are expected to further intensify and result in more extreme weather changes in the future. Sealevels have been rising, with a 1.3 mm annual increase observed during the 1986-2006 period. By2050 a 0.5m total rise is expected (Malaysia, Ministry of Natural Resources and Environment, 2011).
Table 28: Observed and projected changes in temperature and precipitation
Observed Projected
Temperature 0.6-1.2 °C increase since 1969 1.5-2 °C increase by 2050
Rainfall No noticeable increase More intense rainfalls
Sea-level rise 1m by 2100
Source: World Bank, 2014; Government of Malaysia, 2015
Malaysia is especially vulnerable to increased water stress and sea level rise. In the second NationalCommunication to the UNFCCC (2011), it identified 6 main priority adaptation areas. These compriseextreme weather events including droughts and floods, agriculture production losses, human healthproblems, biodiversity, and coastal and marine habitat losses.
Adaptation Needs
Malaysia’s INDC identifies its adaptation needs, having experienced increased surface mean temper-ature increase over the last five decades (Government of Malaysia, 2015). Malaysia aims to build

83
resilience and to mainstream adaptation to climate change into its development plans. The INDC notesMalaysia’s intention to develop a national adaptation plan “to provide greater coordinated implemen-tation” (ibid p.4).
According to the Adaptation Knowledge Platform (2011) and Malaysia’s INDC (2015), priority areas foradaptation include:
• Flood Risks: Mitigating annual direct loss from monsoon and flash floods, strengthen dis-aster risk management and resilience of infrastructure, revision of flood managementplans, improved rainfall and flood forecasting, disaster warning systems, and flood hazardmapping.
• Water Security: Management of vital water catchment areas, strengthen the regulatoryframework of the water services industry, expand the water supply network and treatmentcapacity infrastructure in order to enhance water supply efficiency, demand managementpractices.
• Food Security and Agriculture: Improve agriculture and agro-based industries, expand im-plementation of good agricultural practices, intensify research and development for im-proving agriculture production, efficient irrigation and draining infrastructureimprovements.
• Coastlines: Develop hard and soft engineering approaches and implement the IntegratedShoreline Management Plans.
• Biodiversity: Create conservation and protection corridors, protection of genetic resourcevia gene banks, and rehabilitation centers for fauna.
• Health: Implement surveillance programmes and detection mechanisms for vector andwaterborne diseases, and community involvement in defense strategies, disaster man-agement systems.
GHG Emissions
While Malaysian forests were still major carbon sinks in 2000, based on emission estimations, Malaysiabecame a net emitter by 2005 (see WRI calculations for 2012). By 2012, the CO2 emissions per capitawere above the level of other countries in the region, but still below the global average.
Table 29: Emissions summary for Malaysia
Total GHG/CO2 emissions2011
(UNFCCC)2011
(World Bank)2012 (WRI)
CO2 emissions without LUCF (kt) 208,256 225,693 207 860
CO2 net emissions/removals by LUCF (kt) -260,457
CO2 net emissions/removals with LUCF (kt) -52,201
GHG emissions without LUCF (kt) 290,230 288,130
GHG net emissions/removals by LUCF (kt) -262,946
GHG net emissions/removals with LUCF (kt) 27,282 433,330
CO2 emissions per capita emissions withoutLUCF (metric ton)
9.888 7.9 7.11
Source: UNFCCC, 2014b; World Bank, 2014, WRI, 2014; Government of Malaysia, 2016

Climate Change Strategic Planning
Malaysia signed the United Nations Framework Convention on Climate Change (UNFCCC) on 9 June1993 and ratified it on 17 July 1994. It ratified the Kyoto Protocol on 4 September 2002 and it enteredinto force on 16 February 2005.
Malaysia recognised sustainable development as one of the three main pillars of the New EconomicModel (2010). In line with this, the government advocates a holistic approach to deal with climatechange and considers green technology deployment as key to sustainable development. The 10thMalaysia Plan (2011-2015) focused on sustainable growth and introducing mitigation strategies to reduce GHG emissions. The 11th Malaysia Plan (2016-2020) defines the country’s aspiration to become an inclusive and sustainable nation by 2020 and emphasises the importance of green growthfor protecting the environment and securing development. (Government of Malaysia, 2015a).
The government developed and approved the National Policy on Climate Change and the Green Technology Policy in 2009 to provide a comprehensive framework for addressing climate change andpromoting low-carbon development. In 2009, Malaysia also pledged to reduce its emissions intensityby up to 40% by 2020 (compared to 2005). It also adopted legislation related to renewable energy in2011. In 2014, a Roadmap of Emissions Intensity Reduction in Malaysia was published, presentingvarious sectoral measures that can support the country in reaching the 40% emissions intensity reduction target of the country (Government of Malaysia, 2015b).
Climate Change Institutional Framework
The Ministry of Energy, Green Technology and Water and the Ministry of Natural Resources and Environment are both involved in climate activities (green technology development and adaptationmeasures, respectively). The Ministry of Natural Resources and Environment is also responsible for theREDD+ programme. Led by the Prime Minister, the National Green Technology and Climate ChangeCouncil was established in 2010 to co-ordinate implementation of the Climate and Green Technologystrategies. In 2011, a statutory body called the Sustainable Energy Development Authority was established to co-ordinate the implementation of the feed-in tariff mechanism, mandated under theRenewable Energy Act 2011 (Sustainable Energy Development Authority Portal, 2011).
A variety of NGOs and associations also function in Malaysia, such as the Business Council on Sustain-able Development Malaysia, the Malaysia Environmental NGOs (MENGO), the Environmental ProtectionSociety of Malaysia, and the Malaysian Youth Climate Justice Network.
Climate Change Activities
Since 2007, Malaysia has implemented various mitigation and adaptation programmes in 17 differentsectors. Measures to improve public awareness and build infrastructure (especially for water resources)are considered of strategic importance. Agriculture and food security, as well as public health measures,are also prioritised. As for mitigation, renewable energy investments, especially in solar energy, are promoted.
84

85
Mitigation 20
Adaptation 13
CDM - Clean Development Mechanism 5
GHG Data/ Accounting & Reporting 3
Disaster Risk Management 3
Climate Finance 3
Climate Science 3
REDD - Reducing Emissions from Deforestation and forest Degradation 2
Low Carbon Technologies 2
Source: Southeast Asia Network of Climate Change Offices, 2016
Malaysia aimed to promote sustainability measures through the use of three financial tools. Firstly, afeed in-tariff mechanism (FiT) was formulated simultaneously with the Renewable Energy Policy andAction Plan (2010) in order to fund renewable energy projects. Other measures included providing fiscalincentive and support for investments in green technology as well as projects eligible for carbon credits.Moreover, the Central Forest Spine (CFS) and the “Heart of Borneo” initiatives were introduced in theforestry sector with a goal of encouraging sustainable forest management practices and sustainableuse of natural resources.
In 2012, The Ministry of Environment, Green Technology and Water published the Low Carbon CitiesFramework and Assessment System to provide cities and urban settlements with direction and technicalguidance towards reducing their carbon emissions (Kementerian Tenaga, Teknologi Hijau dan Air, 2012).
However, several implementation challenges remain and these include insufficient institutional coor-dination, institutional capacity, public participation, and monitoring mechanisms.
Intended Nationally Determined Contribution
Malaysia submitted its INDC on 27 November 2015. The INDC states Malaysia’s intention to “reduceits greenhouse gas (GHG) emissions intensity of GDP by 45% by 2030, relative to the emissions inten-sity of GDP in 2005. This consists of 35% on an unconditional basis and a further 10% conditionalupon receipt of climate finance, technology transfer and capacity building from developed countries”(Government of Malaysia 2015, p.1).
The gases covered include carbon dioxide, methane and nitrous oxide, and the coverage is economy-wide in the energy, industrial processes, waste, agriculture and land use and land use change andforestry (LULUCF).
The INDC notes that Malaysia took early action by introducing climate mitigation measures via its 9thand 10th national development plans (from 2006 onwards) and will continue to aim for green growthvia its 11th national development plan (ibid p.1).
In terms of adaptation, Malaysia plans to develop an adaptation plan to provide greater coordinatedimplementation. In particular, susceptibility to seasonal monsoon floods, water and food security, coast-line erosion and public health were identified.
Figure 20: Number of climate projects and activities in Malaysia
86
Country References Used
• Adaptation Knowledge Platform (2011) Scoping Assessment on Climate Change Adapta-tion in Malaysia
• Kementerian Tenaga, Teknologi Hijau dan Air (KeTTHA) (2012) Low Carbon Cities Framework and Assessment System
• Government of Malaysia (2016) Malaysia Biennial Update Report to the UNFCCC
• Government of Malaysia (2015a) Eleventh Malaysia’s Plan 2016-2020
• Government of Malaysia (2015b) Intended Nationally Determined Contribution of the Government of Malaysia
• London School of Economics (2015) Climate Change Legislation in Malaysia
• Ministry of Natural Resources and Environment (2011) Second National Communicationto the UNFCCC
• Southeast Asia Network of Climate Change Offices (2016) ASEAN Climate Change ActionDatabase
• Sustainable Energy Development Authority Portal (2011) Sustainable Energy DevelopmentAuthority Act 2011
• UNFCCC (2014) GHG emissions country profile
• UNSD (2014) UN Data
• World Bank (2014) Climate Change Knowledge Portal
• World Bank (2014b) Open Database
[The full references are included in the bibliography.]

87
MYANMAR
Table 30: Myanmar’s national statistics
Country Parameter 2014
GDP per capita (current USD ) 1,203
Population (million) 51.48
Population density (people per km2 of land area) 76.10
Share of urban population (% of total) 30
Percentage of people under poverty line n.a.
Source: UNSD, 2014; World Bank, 2014 and Myanmar Census Report vol 2, 2015
Myanmar has experienced rapid economic growth since 2010. The economy is primarily based on agri-cultural production, with the livelihood of the rural population largely dependent on natural resources.
Observed and Projected Climate Impacts
Myanmar has become highly vulnerable to climate change over the last six decades (GLOBE, 2015).Observed climate change impact include an increase in temperature, total precipitation, a shortersouth-west monsoon season and increased occurrence of extreme weather events (Chit, O. K. & Soe,M. M., 2015).
Future effects of climate change in Myanmar are expected to vary by regions, seasons and differentclimate scenarios. Climate risks include increased frequency of extreme weather events, flood andstorm surges, more intense rainfall, extreme daytime temperatures, drought and sea level rise.
Table 31: Observed and projected changes in temperature and precipitation
Observed Projected
Maximum Temperature
1.2 °C increase between 1981-20101.3 – 2.0°C increase by 2060 and1.9 – 2.6 °C by 2100
Minimum Temperature
0.5 °C increase between 1981-20101.4 – 2.0°C increase by 2060 and2.1 – 2.7°C by 2100
Rainfall 11% increase between 1981- 20105 – 10% increase by 2060 and 19 –36% by 2100
Source: New Climate Change Projection by DMH

88
Agriculture, water resources, public health, forests, coastal zones, and biodiversity are identified as thesectors most prone to climate change.
Adaptation Needs
In Myanmar, the most prioritized adaptation sectors include agriculture, forestry, disaster risk reduction,public health, and water resources. Necessary adaptation actions are as follows (World Bank, 2014):
• Agriculture: Crop diversification and climate-resilient varieties, and diversification of production.
• Disaster risk reduction: Improved weather observation capacity, flood and drought earlywarning systems, and assessment of the hydrological impact of climate change on riversystems.
• Forests: Reforestation, community reforestation in watershed areas, and community-based mangrove restoration.
• Public health: Climate-resilient health facilities, prevention of heat-related disorders inagricultural and industrial sectors, Intensive Care Units (ICU) in hospitals to treat heat-related disorders, and safe water supplies and sanitary latrines.
• Water resources: Assessment of the status of dams and regional rainfall-runoff relation-ships, construction of small-scale water impoundments, channel improvements, and adaptation.
GHG Emissions
According to the latest available UNFCCC data (for 2000), Myanmar is a carbon sink, with total net GHGand CO2 emissions removal. The CO2 emissions have not increased radically in the recent years: in2011 CO2 emissions per capita were 0.2 metric tons (World Bank, 2011).
Table 32: Emissions summary for Myanmar
Total GHG/CO2 emissions2000
(UNFCCC)2011
(World Bank)2012 (WRI)
CO2 emissions without LUCF (kt) 8 264.6 10,440 11 740
CO2 net emissions/removals by LUCF (kt) -95 774.7
CO2 net emissions/removals with LUCF (kt) -87 510.1
GHG emissions without LUCF (kt) 38 374.9 98 930
GHG net emissions/removals by LUCF (kt) -95 774.7
GHG net emissions/removals with LUCF (kt) -57 399.8 184 710
CO2 emissions per capita emissions withoutLUCF (metric ton)
0.2 0.22
Source: Republic of the Union of Myanmar, 2012; World Bank, 2016 and WRI, 2016

89
Climate Change Strategic Planning
Myanmar signed the UNFCCC on 11 June 1992, ratified it on 25 November 1994. The UNFCCC enteredinto force on 23 February 1995. Myanmar later acceded to the Kyoto Protocol on 13 August 2003,which entered into force on 16 February 2005.
Myanmar has mainstreamed green economy and climate change considerations into its latest nationaldevelopment strategies, e.g. in the National Comprehensive Development Plan for 2011-30. In 2012it also adopted an Environmental Conservation Law and developed its National Adaptation Programmeof Action (NAPA). The Programme defines 5 strategic objectives including mitigating GHG emissions,adapting to climate change, developing underlying policies and plans, supporting climate research,and mainstreaming climate objectives into national development plans. An inter-ministerial task forcealso prepared the Myanmar Action Plan on Disaster Risk Reduction for 2009-2015.
Myanmar is currently developing a National Climate Change and a Green Economy Strategy and underlying action plans. In 2016 it is also planning to develop a National Adaptation Plan (Republic ofthe Union of Myanmar, 2015). The government is also developing a Long-Term Energy Master Plan anda National Electrification Plan and aims reduce energy consumption (by 5% and 8%, respectively, to2020 and 2030); to improve energy efficiency by 16% to 2030 and promote renewable energy use by15% to 2020 (GLOBE, 2015b).
Myanmar aims to reduce energy consumption by 5% by 2020 and 8% by 2030, from 2005 levels. Italso aims to improve energy efficiency by 16% in all sectors by 2030.
Climate Change Institutional Framework
The National Environmental Conservation Committee had been the primary coordinator of implemen-tation of environmental objectives since 2011. The Ministry of Environmental Conservation and Forestryand the Ministry of Foreign Affairs were responsible for the UNFCCC negotiations. The Ministry of Environmental Conservation and Forestry was also responsible for tackling deforestation and promotingafforestation (i.e. REDD task force, where a Dry Zone Greening Department was also established). In2013, a National Energy Management Committee was established to develop energy policies and plansfor the country and to co-ordinate the development of the energy-sector (GLOBE, 2015).
In 2013, with the support of the EU, the Myanmar Climate Change Alliance was established within theMinistry of Environmental Conservation and Forestry.
In 2016, the National Environmental Conservation and Climate Change Committee was formed by thenew government with the leadership of the Vice President as honorable chair. All the environmentaland climate change concerned Ministries are involved in the committee and the Ministry of Natural Resources and Environmental Conservation takes a focal role and serves as a secretary of the committee. The regional and state level committees are organized under the national committee.
The activities of the NGO sector have also increased in recent years, mainly in forest rehabilitation, environmental conservation, and climate change mitigation and adaptation.
Climate Change Activities
Myanmar has implemented various climate activities to date, but considers reforestation as its mainpriority. An example for REDD+ activities is a reforestation project in the Bago Yoma Region, financedby the Republic of Korea.
Mitigation activities include rural electrification, renewable energy promotion, and decreasing the emissions from the agricultural sector. Adaptation efforts target the agriculture and forest sector, development of early warning systems, improvement of public health, improvement of water resourcemanagement and protection of coastal zones.

90
Implementation challenges comprise public and private financing constraints, insufficient governmen-tal presence and coordination, lack of emissions data, insufficient promotion of renewable energy andenergy efficiency measures in specific sectors (e.g. for industries), and lack of human and technicalcapacities.
Intended Nationally Determined Contribution
Myanmar submitted its INDC on 28 September 2015. The INDC was prepared with political guidancefrom the highest institutional level within the Government of the Republic of the Union of Myanmar.The Ministry of Environmental Conservation and Forestry (MOECAF) acted as the INDC focal point, facilitating input from other ministries.
Myanmar’s INDC contains a mitigation contribution based on actions in the forestry and energy sectors.These are listed below:
Table 33: Myanmar’s INDC in sectoral breakdown
Sectors Target Base year Target year
Energy
Increase share of hydro to 9.4 GW n.a. 2030
Increased rural electrification through 30% renew-able energy
n.a. 2030
Realize 20% electricity saving potential of the totalforecast electricity consumption
n.a. 2030
Distribute 260,000 energy efficient cookstoves n.a. 2030
Forestry
Reserved Forest (RF) and Protected Public Forest(PPF) areas to cover 30% of total national land area
n.a. 2030
Protected Area Systems (PAS) to account for 10% oftotal national land area
n.a. 2030
The forestry targets are intended to be implemented in the 30-Year National Forestry Master Plan (2001-30). Collaborations with the UN-REDD Programme and European Union’s Forest Law Enforcement Governance Trade Programme are among the efforts to implement underlying actions.
The INDC also has an adaptation section which describes the country’s vulnerability to climate change,climate variability and natural disasters. Adaptation to the changing climate is a priority. However, thecapacity to reduce risk and mitigate the effects of climate change is limited due to lack of technical,human resources, financial and legislative processes. This results in significant loss and damage, hampering the process of national development. The INDC covers Myanmar’s priorities for adaptationin the agriculture, public health, water, energy and industry sectors, as well as for biodiversity andcoastal zones. It outlines current and planned adaptation efforts at the policy, legal and programmelevel.
National Climate Change Strategy and Action Plans (NCCS&APs)
With the support of the Myanmar Climate Change Alliance (MCCA), a National Climate Change Strategyand Action Plan has been developed since April 2015. The goal of the strategy is that “Myanmar implements a climate resilient and low-carbon development pathway by 2030 to achieve inclusive andsustainable development. It has 2 main objectives: 1) To increase adaptive capacity of vulnerable communities and sectors so that they are resilient to the impacts of climate change; and 2) To maximise

91
opportunities for sectors to follow a low carbon development pathway ensuring benefits to all, householdand economy, focusing on 6 thematic areas.
These are: i) Climate smart agriculture, fishery, livestock, food and livelihood security; ii) Healthy eco-system services and sustainable management of the environment; iii) Sustainable energy, transportand industrial systems; iv) Resilient and sustainable cities and buildings; v) Resilient society throughdisaster risk reduction and health; and vi) Climate responsive society through education, awareness,science and technology. The objectives will be met through six prioritized actions. The priority actionswill be establishment of a policy framework, strengthening of institutional mechanisms, establishmentof financial frameworks, access to technology, improvement of awareness and capacity, education, research, data, and innovation, and promotion of multi-stakeholder partnerships.
The National Climate Change Strategy (NCCS) and Action Plan (AP) will be validated by 2016.
Country References Used
• ASIA Leds Partnership (2014) Country Profile
• Chit, O. K. & Soe, M. M. (2015) Development Planning and Climate Change in Myanmar
• Department of Population, Ministry of Immigration and Population, The 2014 MyanmarPopulation and Housing Census, The Union Report, Census Report Volume 2
• Republic of Union of Myanmar, Ministry of Transport Department of Meteorology and Hydrology, (2012) Myanmar’s National Adaptation Programme of Action (NAPA) to ClimateChange
• Republic of Union of Myanmar, Ministry of Transport and Communications Department ofMeteorology and Hydrology (DMH), New Climate Change Projection (June 2016)
• GLOBE (2015) The 2015 Global Climate Legislation Study – A Review of Climate ChangeLegislation in 99 countries
• GLOBE (2015b) Myanmar, An Excerpt from The 2015 Global Climate Legislation Study – A Review of Climate Change Legislation in 99 countries
• Republic of Union of Myanmar, Ministry of Transport Department of Meteorology and Hydrology, (2012) Myanmar’s National Adaptation Programme of Action (NAPA) to ClimateChange
• Republic of the Union of Myanmar, Ministry of Environmental Conservation (2012) Myanmar’s Initial National Communication under the United Nations Framework Conven-tion on Climate Change
• Republic of the Union of Myanmar (2015) Myanmar’s Intended Nationally DeterminedContribution
• Southeast Asia Network of Climate Change Offices (2016) ASEAN Climate Change ActionDatabase
• UNEP-Risoe Center (2013) Emissions Reduction Profile: Myanmar.
• UNFCCC (2014) GHG emissions country profile
• UNSD (2014) UN Data
• World Bank (2016) World Development Indicators
• WRI (2016) CAIT Climate Data Explorer
[The full references are included in the bibliography.]

92
*Data is for 2012Source: UNSD, 2014 and World Bank, 2014b
The Philippines has experienced strong economic growth in recent years. However, its socio-economicdevelopment is heavily affected by various extreme weather events and natural disasters, and is considered as one of the most climate change- and disaster-prone countries.
Observed and Projected Climate Impacts
Major future climate impacts include increased temperature, landslides, and floods, tropical cyclones,and decreased rice yield. It is also expected that the more frequent occurrence of El Niño will increasedroughts. Sea level is projected to rise by 0.35m by 2090-2100. Heavy rainfall and typhoons are likelyto intensify due to rising sea surface temperatures.
Table 35: Observed and projected changes in temperature and precipitation
PHILIPPINES
Table 34: The Philippines’ national statistics
Country Parameters 2014
GDP per capita (current USD ) 2,872
Population (million) 99.138
Population density (people per km2 of land area) 332.5
Share of urban population (% of total) 44
Percentage of people under poverty line (%) 25.2*
Observed Projected
Temperature+0.3°C per decade between 1971-2000 in the South Pacific
0.9°C to 1.1°C by 2020 and 1.8°C to2.2°C by 2050 under the A1B scenario.
RainfallNumber of rainy days and tendency forheavy rainfall increased since 1990
Increased seasonal variation (-39.8% to72.5%) under the A1B scenario.
Source: World Bank, 2014; IACCC, Philippines, 2014
Droughts will negatively impact agricultural production and food security, and thus economic development.
Adaptation Needs
The Philippines prioritises adaptation actions in the agriculture sector, and in watersheds and coastalareas, and in the area of human health:

93
• Agriculture and food security: Initiatives to reduce the vulnerability of rice production suchas using drought resistant varieties, improved irrigation and fertilization, and use of otherpost-harvest facilities; along with other initiatives such as providing weather based insur-ance, use of GIS technology to match soil type with crops, and modifying subsidies forseeds, fertilizers etc.
• Watersheds: Rehabilitation of degraded areas through reforestation and facilitating naturalregeneration.
• Coastal areas: Research on salt water intrusion impacts, implementing the IntegratedCoastal Management program, and large scale reforestation including mangroves.
• Health: Early warning systems for heat waves and other extreme events, climate proofhousing development, and improved surveillance of disease outbreaks and related indicators such as mosquito numbers.
GHG Emissions
The latest available UNFCCC GHG emissions data is for 2000. According to the World Bank and WRIcalculations (2011 and 2012), there has been a 50% increase in the CO2 and GHG emissions, whilethe per capita CO2 emissions is still low (0.91 metric tons in 2011).
Table 36: Emissions Summary for the Philippines
Total GHG/CO2 emissions2000
(UNFCCC)2011
(World Bank)2012 (WRI)
CO2 emissions without LUCF (kt) 57 932 82 012 87 830
CO2 net emissions/removals by LUCF (kt) -2 774
CO2 net emissions/removals with LUCF (kt) 55 158
GHG emissions without LUCF (kt) 100 866.6 159 230
GHG net emissions/removals by LUCF (kt) -126.5
GHG net emissions/removals with LUCF (kt) 100 740.1 157 590
CO2 emissions per capita emissions withoutLUCF (metric ton)
0.86 0.91
Source: UNFCCC, 2014; World Bank, 2016 and WRI, 2016
Climate Change Strategic Planning
The Philippines signed the UNFCCC on 12 June 1992 and ratified it on 2 August 1994. The Conventioncame into force on 31 October 1994. Subsequently, the Philippines signed the Kyoto Protocol on 15April 1998, ratified it on 20 November 2003 and it entered into force on 16 February 2005.
In 2009, the Philippines passed the Climate Change Act, which established the Climate Change Commission (CCC) to lead policy development and coordinate, monitor and evaluate climate responses.An amendment of this law also led to the introduction of the Peoples’ Survival Fund allocating nationalbudget for adaptation needs of local communities and local governments in 2012.

94
The CCC developed the National Framework Strategy on Climate Change (NFSCC) (2010), which laidthe foundation and roadmap for addressing climate change. The issuance of the National ClimateChange Action Plan (2011) set the direction for concrete mitigation and adaptation actions for 2011–28.
Various legislations targeting renewable energy development have been enacted, including the Renewable Energy Act of 2008 and the Biofuels Act of 2008. The Philippines has also committed to a5% voluntary emission reduction target by 2012 (compared to 1990 levels). In addition, the PhilippineEnergy Plan aims for a 10% reduction in energy consumption by 2028.
Climate Change Institutional Framework
Chaired by the President of the Republic, the Climate Change Commission is responsible for developing,coordinating, monitoring, and evaluating climate change strategies and programmes. A cross-sectoraladvisory board from government agencies, local governments, academia, business and NGOs supportthe activities of the Commission.
The Cabinet Cluster on Climate Change Adaptation and Mitigation has also been created to improvecoordination among government agencies involved in adaptation and mitigation activities.
Climate Change Activities
The Philippines implements both mitigation and adaptation actions for food, water and human security,ecological and environmental stability, green industries and services, sustainable energy, and knowledge and capacity development.
Figure 21: Number of climate projects and activities in the Philippines, by theme
- Mitigation 40
- Low Carbon Technologies 39
- CDM - Clean Development Mechanism 38
- Adaptation 3
- Green Growth 1
- Disaster Risk Management 1
- Climate Science 1
- GHG Data/Accounting & Reporting 1
Source: Southeast Asia Network of Climate Change Offices, 2016
Project examples include the implementation of the Low-Cost Warning System for Flood/Slide-ProneCommunities; the preparation of a National Wetlands Action Plan, and extensive national educationprogrammes for schools and local authorities.
The main implementation challenge is the extreme diversity of the archipelago, which makes the adoption of a homogeneous strategy difficult.
95
Intended Nationally Determined Contribution
The Philippines submitted their INDC on 1 October 2015. The Philippines intends to reduce its GHGemissions by approximately 70% as compared to emissions under a BAU scenario by 2030 (Republicof the Philippines, 2015). Energy, transport, waste, forestry and industry sectors will contribute towardsachieving the emission reductions. The achievement of mitigation contributions will be contingent onthe extent of support, including technology development & transfer, and capacity building, that will bemade available.
The INDC emphasises the Philippines’ vulnerability to the impacts of climate change and highlights priority measures that would need implementation support. These include strengthening institutionsfor climate modelling and monitoring; including climate risk and vulnerability in development plans andprojects; development of climate resilience in agriculture, water and healthcare; and further researchon climate change impacts.
Country References Used
• Asian Development Bank (2009) The Economics of Climate Change in Southeast Asia.
• ASIA Leds Partnership (2014) Country Profile
• Climate Change Commission of the Philippines (2011) National Climate Change ActionPlan 2011-2028
• ILO (2012) Strengthening the Philippines’ Institutional capacity to adapt to climate change– Final Joint Evaluation
• Office of the President of the Philippines-Climate Change Commission (2012) NationalFramework Strategy on Climate Change 2010-2022
• Republic of the Philippines (2014) Second national communication to the United NationsFramework Convention on Climate Change
• Republic of the Philippines (2015) Intended Nationally Determined Contributions Commu-nicated to the UNFCCC on October 2015
• Senate of the Republic of the Philippines (2007) Climate Change Report
• Southeast Asia Network of Climate Change Offices (2016) ASEAN Climate Change ActionDatabase
• UNFCCC (2014) GHG emissions country profile
• UNSD (2014) UN Data
• World Bank (2016) World Development Indicators
• WRI (2016) CAIT Climate Data Explorer
[The full references are included in the bibliography.]

96
SINGAPORE
Table 37: Singapore’s national statistics
Country Parameters 2014
GDP per capita (current USD ) 56,284
Population (million) 5.470
Population density (people perkm2 of land area) 7,736.5
Share of urban population (% of total) 100
Percentage of people under poverty line N/A
Source: UNSD, 2014 and World Bank, 2016
Singapore is a small, densely-populated urban city state. It relies heavily on external energy sources,given its alternative energy constraints. In addition, its growth puts increasing pressure on its limitednatural resources and the ecosystem.
Observed and Projected Climate Impacts
Singapore has undertaken two National Climate Change Studies to better understand the potential impact of climate change on the country. The first study was completed in 2013 and was based on thedata and scenarios from the IPCC AR4.
The second study updated the projections for Singapore, based on the data and scenarios from theIPCC AR5. Phase 1 of the study was completed in 2015 and its findings were consistent with thosefrom the IPCC AR5, which predicted global sea level rise, as well as higher temperatures and more extreme rainfall. For Singapore, it is predicted that the long-term effects of climate change would leadto a temperature increase of 1.4°C to 4.6°C and a rise in mean sea level of 0.25m to 0.76m for theperiod of 2070-99 (relative to 1980-2009).
Table 38: Observed and projected changes in temperature and precipitation
Observed Projected
TemperatureAnnual average temperature has in-creased from 26.6 to 27.7°C from 1972to 2014
1.4 to 4.6 °C increase in daily mean tem-perature for the period of 2070 – 2099(relative to 1980-2009)
RainfallGeneral uptrend from 2192 mm in 1980to 2727 mm in 2014
Increasing trends in both intensity andfrequency of heavy rainfall events
Sea-level riseRose at a rate of 1.2–1.7 mm yr−1 in theperiod 1975-2009
+0.25 to +0.76 m for the for the periodof 2070 – 2099 (relative to 1980-2009)
Source: Centre for Climate Research Singapore, 2015

97
Adaptation Needs
As a low-lying and densely populated island city-state, Singapore is particularly vulnerable to the impactsof climate change. It is therefore important for Singapore to prepare for and adapt to climate change.Singapore’s public sector has taken the lead on this by developing a range of climate change adaptationmeasures to protect its coastal areas, manage water supply and minimize floods, protect biodiversityand greenery, strengthen resilience in public health and food supply, keep essential services runningwell as well as keep its buildings and infrastructure safe.
GHG Emissions
According to the latest available climate information, Singapore had per capita emissions of 4.3 metrictons in 2011. It must be noted, however, that as an island country, nearly all of its fuel and energy isimported from nearby countries.
Table 39: Emissions summary for Singapore
Total GHG/CO2 emissions2010
(UNFCCC)2011
(World Bank)2012 (WRI)
CO2 emissions without LUCF (kt) 45,202.88 22,394.00 49,750.00
CO2 net emissions/removals by LUCF (kt)
CO2 net emissions/removals with LUCF (kt)
GHG emissions without LUCF (kt) 46 831.68 56,120.00
GHG net emissions/removals by LUCF48 (kt)
GHG net emissions/removals with LUCF (kt) 56,130.00
CO2 emissions per capita emissions without LUCF(metric ton)
4.3 9.36.00
Source: Singapore National Environment Agency, 2014; World Bank, 2016 and WRI, 2016
Climate Change Strategic Planning
Singapore signed the UNFCCC on 13 June 1992, ratified it on 29 May 1997. The UNFCCC entered intoforce on 27 August 1997. Singapore acceded to the Kyoto Protocol on 12 April 2006, which enteredinto force on 11 July 2006.
In 2016, Singapore released its Climate Action Plan titled Take Action Today, for a Sustainable Future,which contains information on how Singapore intends to reduce greenhouse gas emissions and increase energy efficiency to meet its 2030 climate pledge. The second publication, A Climate-ResilientSingapore, for a Sustainable Future, explains how Singapore may be affected by climate change andits strategy to prepare for them.
The Sustainable Singapore Blueprint, issued in 2009 and updated in 2014, outlines Singapore’s national vision and plans for a more livable and sustainable Singapore. These plans include initiativesto reduce our carbon emissions, reduce resource consumption, grow a greener economy, adapt to climate change effects, and participate in multilateral efforts.
48 Singapore has begun a long-term programme to monitor and report carbon storage and carbon fluxes related to land usechange and forestry. Given Singapore’s small land size and highly urbanized landscape, the greenhouse gas emissionsfrom land-use change and forestry sectors are anticipated to be small in comparison with the size of carbon stocks andin comparison with other economic sectors.

98
The 2030 targets laid out in the Sustainable Singapore Blueprint show Singapore’s ambition in prac-ticing sustainable development. These include a target of a 35% energy efficiency improvement by2030 (from 2005 levels). To promote this objective, an Energy Conservation Act was introduced in 2013to regulate large-scale energy consumers. Within the NAMA framework, Singapore has also pledged toreduce its greenhouse gas emissions by 16% from business-as-usual levels by 2020. The National Climate Change Strategy was published in 2012 and covers both mitigation and adaptation aspects.
Climate Change Institutional Framework
Under the Prime Minister’s Office, the National Climate Change Secretariat (NCCS) was established in2010 to co-ordinate the implementation of climate activities with public and private organizations. TheNCCS is also secretariat to the Inter-Ministerial Committee on Climate Change (IMCCC), which overseesthe work of three working groups. The International Negotiations Working Group (INWG) develops Singapore's international climate change negotiations strategy under the UNFCCC. The Long-Term Emissions and Mitigation Working Group (LWG) examines options to stabilise Singapore’s long-termemissions and identifies the capabilities, infrastructure and policies needed for long-term mitigation.The Resilience Working Group (RWG) studies Singapore's vulnerability to the effects of climate changeand recommends long-term plans that ensure the nation’s adaptation to future environmental changes.
Climate Change Activities
Singapore finances its own green initiatives and undertakes a variety of activities. Research and investment is prominent in solar energy deployment and Singapore has plans to increase the adoptionof solar power to 350MWp by 2020. Energy efficiency and clean energy deployment have also increasedby introducing market competition in the energy sector. To assist industrial sites increase their energyperformance, there are a suite of incentives and grants, mandatory energy management requirementsunder the Energy Conservation Act, and capability building training, workshops and resources.
Besides industry, energy efficiency and savings measures are also promoted in the public transport,building, and household sectors. As part of the Energy Innovation Challenge, Singapore commissionedseven technology roadmaps to discuss potential pathways for research and deployment in the followingsectors: solar photovoltaic, building energy efficiency, energy efficient data centers, industrial energyefficiency, and carbon capture, storage and utilization (CCSU),49 electro-mobility, and solid waste management.
The main implementation challenge in achieving clean energy deployment is the limited renewable de-velopment capacity of the country, due to its small size.
Singapore also developed a range of climate change adaptation measures, designed with the protectionof Singapore and Singaporeans in mind. These aim to minimize the adverse effects that climate changecould have on the community, economy, and daily lives of Singaporeans. In order to protect its coastalareas, Singapore has required all new reclaimed land to be reclaimed to a higher level and has raisedsome coastal roads. To manage its water needs, Singapore has diversified its water sources and builtdesalination and NEWater plants, which are less weather dependent. To safeguard biodiversity andgreenery, Singapore has set up coastal and marine protected areas. In terms of the public health effectsof climate change, Singapore has taken steps to reduce the risk of vector-borne diseases such asdengue. Moreover, Singapore is diversifying its food supply and is encouraging research to improve itsfood security. In addition, to keep essential services running well, strict codes and performance standards are being developed. Buildings, rail and road infrastructure are already subject to strict regular inspection and maintenance.
49 More information available at Singapore National Research Foundation (2016) Singapore’s Energy TechnologyRoadmaps..URL:www.nrf.gov.sg/about-nrf/programmes/national-innovation-challenges/energy-technology-roadmaps

99
Intended Nationally Determined Contribution
Singapore submitted its INDC to the UNFCCC on 3 July 2015. The INDC stated Singapore’s intention toreduce its emissions intensity by 36% from 2005 levels by 2030, and to stabilise emissions with theaim of peaking around 2030 (Singapore National Climate Change Secretariat, 2015 p.1). This buildson Singapore’s pledge in 2009 to reduce its emissions by 16% below business-as-usual levels (BAU-16%) by 2020 if there is a legally binding global agreement. (Singapore National Climate ChangeSecretariat, 2015 p.1).
Singapore described its commitment as a stretch target, given constraining factors such as its earlyactions it took to develop in a sustainable manner and its limited access to alternative energy options.Singapore's INDC is not conditional on external support.
The INDC contains an Annex with accompanying information on Singapore’s national circumstancesand adaptation efforts. Singapore underscored its national conditions as being alternative energy-dis-advantaged and highlighted the efforts it has taken and is currently taking to ensure carbon efficiency.This includes not subsidising energy costs, strong pollution control laws to encourage industries toswitch to cleaner fuel sources such as natural gas, and the adoption of energy efficiency technologiesthrough grants and other policy tools. Regarding adaptation efforts and challenges, it identifies keyadaptation measures that Singapore is undertaking in the field of food security; infrastructure re-silience; public health; flood risk management; water security; coastline protection; biodiversity protec-tion and regional climate modeling.
Country References Used
• Center for Climate Research Singapore (2015) Singapore’s Second National ClimateChange Study – Climate projections to 2100 (Report for stakeholders)
• Singapore National Environment Agency (2014) Singapore’s 3rd National Communicationsand 1st Biennial Update Report
• Singapore National Environment Agency (2010) Singapore’s 2nd National Communicationunder the UNFCCC
• Singapore Ministry of Foreign Affairs (2010) Nationally Appropriate Mitigation Actions.
• Singapore National Climate Change Secretariat (2015): Singapore’s Intended NationallyDetermined Contribution (INDC) and Accompanying Information
• Singapore National Climate Change Secretariat (2016) Climate Action Plan: Take ActionToday, for a Sustainable Future
• Singapore National Climate Change Secretariat (2016b) A Climate-Resilient Singapore,for a Sustainable Future
• Singapore National Climate Change Secretariat (2012) National Climate Change Strategy.
• Singapore Ministry of the Environment and Water Resources (2006) The Singapore GreenPlan 2012
• UNFCCC (2014) GHG emissions country profile
• UNSD (2014) UN Data
• World Bank (2016) World Development Indicators
• WRI (2016) CAIT Climate Data Explorer
[The full references are included in the bibliography.]

100
THAILAND
Table 40: Thailand’s national statistics
Country Parameters 2014
GDP per capita (current USD ) 5,977.4
Population (million) 67.73
Population density (people per km2 of land area) 132.6
Share of urban population (% of total) 49
Percentage of people under poverty line (%) 10.5
Source: UNSD, 2014 and World Bank, 2014b
Thailand’s economy has been rapidly growing, but climate change could seriously affect the country’sfuture growth potential. The agricultural sector, which provides the livelihood of 40% of the population,and the country’s 2,600km coastline – an ecosystem that is highly important to the socio-economicdevelopment of the country – are especially vulnerable to climate impacts (World Bank, 2014).
Observed and Projected Climate Impacts
Table 41: Observed and projected changes in temperature and precipitation
Observed Projected
Temperature 0.1-0.2 °C per decade since 1960 1.7 to 2.1 °C increase by 2045-2065
RainfallVariability has been large, both within ayear and between years
-109 to 76 mm change by 2045 -2065
Source: World Bank, 2014
In the future, increased occurrence of droughts and floods are expected due to fluctuating rainfall andincreasing level of sea surface water. The agriculture sector, especially maize and rice production, maybe heavily impacted by climate change. Sea-level rise will negatively affect coastal ecosystems. Publichealth will be impacted by enhanced potential spread of malaria and dengue disease. The type andstructure of forests, forest ecosystems, and the biological diversity of the fauna and flora can also beaffected by climate change.
Adaptation Needs
Thailand has identified the following adaptation needs in its key sectors (Thailand Office of Natural Resources and Environmental Policy and Planning, 2015):

101
• Agriculture and food security: Promotion of sustainability agricultural and land use practices.
• Water resource use: Integrated Water Resource Management; infrastructure improve-ments; flood and drought risk management.
• Forests and biodiversity: Introduction of community forest management practices; restora-tion of protected areas and coastal areas; climate proofing of coastal infrastructures; promotion of sustainable tourism.
• Disaster risk management: Increase awareness about disasters and improve managementof disasters; early warning systems and improved technologies for risk assessments.
GHG Emissions
Thailand almost doubled its CO2 emissions between 2000 and 2010. Its per capita CO2 emissionsrose to 4.53 metric tons in 2011.
Table 42: Emissions summary for Thailand
Total GHG/CO2 emissions2011
(UNFCCC)2011
(World Bank)2012 (WRI)
CO2 emissions without LUCF (kt) 228,449 303,370.91 273,090
CO2 net emissions/removals by LUCF (kt) -114,127
CO2 net emissions/removals with LUCF (kt) 157,019
GHG emissions without LUCF (kt) 305,523 375,700
GHG net emissions/removals by LUCF (kt) -114,127
GHG net emissions/removals with LUCF (kt) 234,584 375,710
CO2 emissions per capita emissions without LUCF(metric ton)
4.53
Source: Thailand Office of Natural Resources and Environmental Policy and Planning, 2015b; World Bank, 2016 and WRI, 2016
Climate Change Strategic Planning
Thailand signed the UNFCCC on 12 June 1992 and ratified it on 28 December 1994. The Conventionentered into force on 28 March 1995. Later, Thailand signed the Kyoto Protocol on 2 February 1999and ratified it on 28 August 2002. The Protocol came into force on 16 February 2005.
Thailand introduced the “Sufficiency Economy” principle, which considers moderation in co-existencewith nature as a way to tackle climate change. Thailand also has a long-term, National Master Plan onClimate Change 2015-205050 and a short-term strategy for 2008-2012 (GLOBE, 2015). Following aWorld Bank-supported study of the Bangkok Metropolitan Region, the country initiated a city-level climate action plan for the nation’s capital. The Bangkok Metropolitan Administration (BMA) ActionPlan on Global Warming Mitigation 2007-2012 comprises 5 major initiatives; namely 1) Expand MassTransit and Improve Traffic System; 2) Promote the Use of Renewable Energy; 3) Improve Building Electricity Consumption Efficiency; 4) Improve Solid Waste Management and Wastewater TreatmentEfficiency; and 5) Expand Park Areas. The Action Plan was aimed at reducing greenhouse gas emissionsby approximately 15% of the total emission anticipated in the year 2012, under a business-as-usual
50 The Master Plan on Climate Change (2015–2050) was approved by Cabinet on 14 July 2015.

102
projection which equates to almost 39mtCO2-e or 7.1tCO2-e per capita per year (Japan InternationalCooperation Agency, 2012). In March, BMA and JICA jointly evaluated a 3 year capacity building projectfunded by JICA and found that Bangkok achieved approximately 3.67mtCO2e reduction from 2007-2011 (JICA, 2012).
The 11th National Economic and Social Development Plan (2012-2016) aims to promote green economydevelopment, along with an Alternative Energy Development Plan 2012-2021 (AEDP) and a 20-yearEnergy Efficiency Plan 2010-2030. These energy strategies aim for a 30% share for alternative energyof final energy consumption by 2036 and 30% energy intensity reduction from 2010 to 2036 (ThailandOffice of Natural Resources and Environmental Policy and Planning, 2015b).
In addition, as part of the Environmentally Sustainable Transport System Plan, Thailand will impose a“carbon-based vehicle excise tax” (Thailand Office of Natural Resources and Environmental Policy andPlanning, 2015b p51) and further develop rail infrastructure. Furthermore, a Thailand Climate ChangeStrategic Plan in the Agricultural Sector for 2013-2016 has also been developed.
Climate Change Institutional Framework
The National Climate Change Committee consists of a Negotiation, Technical, and Integrated Policyand Plan sub-committees, and is chaired by the Prime Minister. Thailand also established an Office ofClimate Change Co-ordination and with a royal decree, the Thailand Greenhouse Gas Management Organization as the designated national CDM body.
An Energy Policy and Planning Office was established within the Ministry of Energy. The Department ofNational Parks, Wildlife and Plant Conservation in the Ministry of Environment co-ordinates the country’sREDD+ activities.
Climate Change Activities
Mitigation activities aim to promote energy security, energy savings and renewable, clean energysources. They also aim to support emissions reduction by improvements in the forestry sector, and bymeasuring the carbon footprint of products and services. A carbon tax system imposing new tax rateson cars computed on the basis of the rate of carbon dioxide emissions, instead of the engine capacitywas announced in 2015 and low-carbon growth of cities is being promoted.
Adaptation actions aim to collect climate information, develop financial mechanisms to support policyintegration, and capacity building activities. In addition, multi-country projects are implemented for various sectors for capacity building, vulnerability assessment, research, and policy integration and formulation.
Figure 22: Number of climate projects and activities in Thailand, by theme
- Mitigation 28
- Adaptation 24
- Low Carbon Technologies 21
- Green Growth 14
- CDM - Clean Development Mechanism 10
- Climate Science 9
- Climate Finance 7
- Disaster Risk Management 5
- Climate Negotiations 4
- GHG Data/ Accounting & Reporting 3
- REDD - Reducing Emissions from Deforestation and forest Degradation 1
- NAMAs - Nationally Appropriate Mitigation Action 1
Source: Southeast Asia Network of Climate Change Offices, 2016
103
Mitigation project examples include feasibility studies for waste management, renewable energy development, energy efficiency improvements, solar power and biogas installations, energy efficiencymeasures implementation, capacity building, and awareness-raising projects on various themes. AnEnergy Performance Certificate (EPC) scheme has been introduced in energy-intensive sectors, andpreparations are underway to ensure legal, technical and institutional readiness to implement thescheme. A Carbon Footprint and a Carbon Reduction Label Program has also been introduced underwhich products that reduce their emissions by more 2% as compared to their base year emissions canregister themselves. As of October 2015, the program has registered 112 products.
The Thailand Greenhouse Gas Management Organization (TGO) is currently developing the ThailandVoluntary Emissions Trading Scheme (Thailand V-ETS) by collaborating with Partnership for MarketReadiness (PMR) hosted by the World Bank – an initiative that provides knowledge and funding to support the establishment of ETSs (International Carbon Action Partnership, 2016). This voluntary domestic carbon crediting scheme has been implemented to issue credits for GHG reduction projects.As of 2016, the scheme has seen 20 registered projects have led to annual emissions reductions ofmore than 700,000 tons CO2e (Thailand Office of Natural Resources and Environmental Policy andPlanning, 2015b). The TGO is also developing a Low Carbon City (LCC) Program as part of the WorldBank’s PMR to help Thai provinces, cities, and municipalities to build a GHG inventory along with anMRV system for citywide emissions and set reduction targets. The TGO will translate these mitigationactions into emissions reduction certificates (“Certificates”) under the TVER.
Adaptation project examples include flood and water resource management projects, feasibility studies,and various climate vulnerability and impact studies. A Sustainable Tourism action plan has been developed.
Implementation challenges include improvement of GHG inventory for major sectors, development of sub-national, local GHG inventories, and development of specific know-how related to mitigation activities in different sectors. Especially for large scale deployment of renewable energy and energy efficiency projects, barriers that are common to most developing countries such as lack of finance andinadequate avenues for technology transfer are applicable to Thailand as well.
In terms of climate scenarios, there is a lack of capacity to downscale available information and a lackof research techniques, to prioritise key sectors and analyse best alternatives for adaptation. Moreover,the integration of adaptation options of risk-prone communities should be further studied.
Intended Nationally Determined Contribution
Thailand submitted its INDC on 1 October 2015, under which it has pledged to reduce its GHG emissions by 20% as compared to a BAU scenario with 2005 as the reference year. This is equivalentto approximately 555 MtCO2-eq by 2030. The ambitiousness of the pledge can be further increasedto 25% “subject to adequate and enhanced access to technology development and transfer, financialresources and capacity building support through a balanced and ambitious global agreement underthe UNFCCC” (Thailand Office of Natural Resources and Environmental Policy and Planning 2015, p1).Some of the key sectoral level targets are outlined in the table below:

104
Table 43: Thailand’s INDC in sectoral breakdown
Sectors Target Base year Target year
Energy
20% of power generation from renewable sources n.a. 2036
30% share of renewable energy in total final energyconsumption
n.a.
30% reduction in energy intensity 2010
Forestry Increase national forest cover to 40% n.a. n.a.
Thailand’s INDC further notes that it has already achieved a 4% emission reduction from 2020 BAUlevels and is in line to successfully achieve the 7% target pledged as its voluntary domestic effort by2020. On market mechanisms, Thailand’s INDC states that it will continue to consider utilization ofmarket or non-market approaches to enable higher amounts of technology transfer, further capacitybuilding and improved access to finance. Furthermore, the INDC notes that means of implementationfor adaptation will also be necessary.
Country References Used
• ASIA Leds Partnership (2014) Country Profile
• GLOBE (2015) The 2015 Global Climate Legislation Study – A Review of Climate ChangeLegislation in 99 countries.
• Southeast Asia Network of Climate Change Offices (2016) ASEAN Climate Change ActionDatabase
• Thailand Ministry of Natural Resources and Environment (2011) Second National Com-munication to the UNFCCC
• Thailand National Science Technology and Innovation Policy Office (2012) TechnologyNeeds Assessment Report for Climate Change
• Thailand Office of Natural Resources and Environmental Policy and Planning (2015) Thai-land’s Intended Nationally Determined Contribution (INDC)
• Thailand Office of Natural Resources and Environmental Policy and Planning (2015b) Thai-land’s First Biennial Update Report under the United Nations Framework Convention onClimate Change
• Thailand Greenhouse Management Organization (2014) Thailand’s Overview of NationalPolicies, Laws and Arrangements on Climate Change
• UNFCCC (2014) GHG emissions country profile
• UNSD (2014) UN Data
• World Bank (2016) World Development Indicators
• WRI (2016) CAIT Climate Data Explorer
[The full references are included in the bibliography.]

105
VIET NAM
Table 44: Viet Nam’s national statistics
Country Parameters 2014
GDP per capita (current USD ) 1,907
Population (thousands) 90,728.9
Population density (people per km2 of land area) 274.0
Share of urban population (% of total) 33
Percentage of people under poverty line 13.5
Source: Statistical Yearbook of Viet Nam 2014 (www.gso.gov.vn)
Viet Nam’s economy has been steadily growing and rapidly industrialising in recent years, but 60% ofthe overall population still relies primarily on agriculture, particularly on rice production. Viet Nam isamong the countries that are likely to be most affected by climate change. This vulnerability is heightened since the major part of the population and the main economic and production centres arelocated along the country’s 3,260 km coastline which is heavily affected by the impacts of climatechange.
Observed and Projected Climate Impacts
The coastline of the country is frequently affected by storms, and many of the provinces are exposedto water stress as a result of droughts. By 2050, 0.28-0.33m sea level rise is projected, which will alsoincrease coastal flooding and salt-water intrusion.
Table 45: Changes in temperature and precipitation in Viet Nam
Observed Projected
Mean annualtemperature
0.5°C increase since 1966 1.7-4.0°C by 2100
Mean annualrainfall
The variation and the intensityof rainfalls have increased
Winter and summer rainfall is expected to increase,and the frequency of heavy and extreme rainfallsand flooding will also rise
Sea level rise 0.2 m since 1966 28-106 cm by 2100
Source: World Bank, 2014 and Viet Nam Ministry of Natural Resources and Environment, 2015.

106
Adaptation Needs
Adaptation activities need to improve the resilience of the agriculture and the forestry sectors, to develop disaster-resistant energy services, and to protect and improve coastal areas and biodiversity(World Bank, 2014):
• Agriculture: Changes in cultivation practices and cropping patterns, more efficient landand water management, agricultural incentives and insurances, and research in agricul-tural technology will also be needed to reduce vulnerability in the long term.
• Coastal ecosystems: Aquaculture plans, heat-tolerant varieties in aqua farming, improvedaqua farming management capacities, additional storm shelters for fishing ships, and improve hazard warning communication.
• Energy and transportation: Energy efficiency and conservation measures, assessment offuture energy demand at provincial level, planning and design of climate-resilient energy,and transport infrastructure needs to be geared to handle potential changes in climateand hydrological variables.
• Forests: Improved sustainable forest management, research to identify resilient plant andtree species, improved timber use efficiency, afforestation and reforestation programs,and poverty reduction in upland forest areas.
GHG Emissions
Since 2000, Viet Nam almost tripled its CO2 emissions and doubled its total GHG emissions (withoutLUCF). Till 2011, the CO2 emissions per capita have reached 1.97 metric tons.
Table 46: Emissions summary for Viet Nam
Total GHG/CO2 emissions2010
(UNFCCC)2011
(World Bank)2012 (WRI)
CO2 emissions without LUCF (kt) 146,036.78 173,210.74 173,050
CO2 net emissions/removals by LUCF (kt) -20,347.59
CO2 net emissions/removals with LUCF (kt) 125,689.19
GHG emissions without LUCF (kt) 266,049.24 264,200
GHG net emissions/removals by LUCF (kt) -19,218.59
GHG net emissions/removals with LUCF (kt) 246,830.64 251,180
CO2 emissions per capita emissions without LUCF(metric ton)
1.97 1.95
Source: Viet Nam Ministry of Natural Resources and Environment, 2014; World Bank, 2016 and WRI, 2016
Climate Change Strategic Planning
Viet Nam signed the UNFCCC on 11 June 1992 and ratified it on 16 November 1994. The Conventioncame into force on 14 February 1995. The Kyoto Protocol was signed by Viet Nam on 3 December 1998and the country ratified it on 25 September 2002. The Protocol came into force on 16 February 2005.
To implement the UNFCCC and the Kyoto Protocol, Viet Nam set up a National Steering Committee;submitted its Initial National Communication (2003), Second National Communication (2010), and

107
Initial Biennial Update Report (2014) to the UNFCCC Secretariat. These efforts reflect the latest climatechange response efforts and GHG inventories in Viet Nam.
In 2011, the National Climate Change Strategy was issued, outlining the objectives for 2011-2015 and2016-2050, and priority projects to be implemented in the period of 2011-2015. A National Strategyon Environment and a National Green Growth Strategy was also developed and adopted in 2012. Theobjectives of the latter include the reduction of GHGs, greening lifestyles, promoting sustainable consumption, and adopting communication and awareness strategies. In 2014, the revised Law of Environment Protection was passed, including a chapter on climate change activities (GLOBE, 2015).
There are no binding targets, but the country adopted a voluntary 20% GHG emissions mitigation targetto be achieved by 2020 (compared to 2005 levels). In its statement at the COP18, it also pledged toreduce the national GHG emissions intensity by 8 to 10% (compared to 2010); energy consumptionper unit of GDP by 1-1.5% per year, and GHG emissions from energy activities by 10% to 20%.
As a response to the effects of climate change on agriculture and rural development, an Action Planfor 2011-2015 and a Vision until 2050 was issued by the Ministry of Agriculture and Rural Developmentin 2011.
Climate Change Institutional Framework
The Ministry of Natural Resources and Environment was appointed by the government as the NationalFocal Point to implement the UNFCCC and Kyoto Protocol. It also serves as the permanent agency ofthe National Committee for Climate Change; the main coordination body for implementation of the National Climate Change Strategy.
Institutional arrangements for NAMA and for MRV activities are under development.
Climate Change Activities
Viet Nam’s climate activities focus on a wide variety of sectors including agriculture, forestry, aquaculture, energy, transportation, and public health. Greenhouse gas mitigation is also promoted byidentifying energy efficiency and conservation, as well as emissions mitigation areas and implementa-tion of renewable energy projects. Education, training and public awareness raising activities on mitigation and adaptation are also carried out.
Figure 23: Number of climate projects and activities in Viet Nam, by theme
Adaptation 37
Disaster Risk Management 26
Mitigation 19
REDD - Reduang Emissions from Deforestation and forest Degradation 7
Climate Science 7
Low Carbon Technologies 7
CDM - Clean Development Mechanism 5
GHG Data/Accounting & Reporting 4
NAMAs - Nationally Appropriate Mitigation Action 3
Climate / UNFCCC Negotiations 3
Climate Finance 2
Green Growth 2
Gender 1
Source: Southeast Asia Network of Climate Change Offices, 2016

There are numerous public and private funded climate initiatives in Viet Nam. The Ministry of Environment and Natural Resources introduced a National Target Program to Respond to ClimateChange. The National Program on Energy Efficiency and Conservation aims to achieve energy targetsset by the government.
As of June 2015, Viet Nam had 254 accredited and registered Clean Development Mechanism (CDM)projects that account for total reduction of approximately 137.4 million tCO2e in their crediting periods.87.6% of these projects are related to energy while waste treatment projects account for 10.2%, reforestation and afforestation for 0.4% and other projects for 1.8%. To date, these CDM projects havesecured more than 12 million Certified Emission Reductions (CERs).
Whilst Viet Nam has implemented a number of mitigation activities (Viet Nam accounts for the fourthhighest number of registered CDM projects and ranks eleventh in terms of number of CERs issued), itfaces a number of challenges in implementing mitigation actions. These include insufficient capacityto establish a national GHG inventory system and other MRV systems; lack of technologies to reduceemissions, especially from agriculture; and inability to tap international and domestic sources of finance.
With assistance from the World Bank’s PMR program, Viet Nam is considering the introduction of asector-based cap-and-trade program in the steel sector, which could start in 2020. The project, worthUSD 3.6 million (USD 3 million funded by the World Bank and USD 600,000 from the Vietnamese Government), was approved by Prime Minister Nguyen Tan Dung in October 2015 following an applica-tion from the Ministry of Planning and Investment (Vietnam News, 2015). Under the project, over USD1.2 million will be allocated to the Ministry of Natural Resources and Environment; USD 760,000 tothe Ministry of Industry and Trade; USD 700,000 to the Ministry of Construction; USD 140,000 to theMinistry Of Planning And Investment; and USD 140,000 to the Ministry of Finance. The environmentministry has been assigned to co-operate with relevant agencies to run the 36-month project. Immediateactions identified by Viet Nam included the need to scale-up crediting work both in the domestic andinternational contexts. Viet Nam has also identified the need to mobilize resources for awareness raisingand capacity building for leaders at the central level in order to enhance political will to implement thecarbon market by 2020 (Socialist Republic of Viet Nam Ministry of Natural Resources and Environment,2016).
Regarding adaptation, the INDC mentions the following implementation challenges: insufficient legalframework; limited institutional co-ordination; insufficient financing from domestic sources and limitedinternational public and private sources; human and technological capacity constraints.
Intended Nationally Determined Contribution
Viet Nam submitted its INDC on 30 September 2015. As per the INDC, Viet Nam has pledged to uncon-ditionally reduce domestic emissions by 8% by 2030 as compared to a Business As Usual scenario.
Table 47: Viet Nam’s INDC in sectoral breakdown
108
Sectors Target Base year Target year
Emissions 20% emissions intensity (of GDP) 2010 2030
Forestry Increase national forest cover to 45% n.a. 2030
Source: Socialist Republic of Viet Nam Ministry of Natural Resources and Environment (2015)

109
There is a conditional contribution of increasing the emissions intensity reduction to 25% should VietNam receive international support through bilateral and multilateral cooperation, and to 30% shouldthe new mechanisms under the Paris Agreement be implemented (Socialist Republic of Viet Nam Ministry of Natural Resources and Environment, 2015).
The coverage of the INDC is the entire economy, including the energy, agriculture, land use, land usechange and forestry (LULUCF) and waste sectors. Gases include carbon dioxide, methane, nitrous oxide,hydroflourocarbons, perflourocarbons, and sulfure hexafluoride.
The adaptation component in the INDC describes the climate change adaptation actions that are currently being implemented. Furthermore, it identifies adaptation gaps in sectors such as developmentof institutions and policy frameworks, human resource capability, and financing and technology. It alsoprovides a list of adaptation measures to be implemented between 2021 and 2030. Viet Nam estimatesthat it will be able to cover only one-third of the costs of implementing these measures, whereas therest will have to be financed through international and private sector investment.
The INDC also details the underlying policy framework and the planned actions to achieve the reductiontargets. For mitigation, this latter includes the improvement of institutional capacities; the enhancementof energy technologies; the diversification of energy sources and renewables deployment, the promotionof sustainable agriculture and forest management practices; improved waste management; communi-cation and awareness raising as well as improvement of international cooperation in the field of research, investments and external support. For adaptation, it notes the need for improved early warningsystems and disaster management capacities; improved social resilience and better management ofsea-level increase and flooding events.
Country References Used
• ASEAN Statistics (2015) Selected key basic ASEAN indicators
• GLOBE (2015) The 2015 Global Climate Legislation Study – A Review of Climate ChangeLegislation in 99 countries
• McSweeney et al. (2010) UNDP Climate Change Country Profiles: Viet Nam
• Socialist Republic of Viet Nam (2011) National Strategy on Climate Change
• Socialist Republic of Viet Nam Ministry of Natural Resources and Environment (2014) TheInitial Biennial Update Report of Viet Nam to the United Nations Framework Conventionon Climate Change
• Socialist Republic of Viet Nam Ministry of Natural Resources and Environment (2015) Intended Nationally Determined Contribution of Viet Nam
• Southeast Asia Network of Climate Change Offices (2016) ASEAN Climate Change ActionDatabase
• UNFCCC (2014) GHG emissions country profile
• UNSD (2014) UN Data
• World Bank (2011) Climate-Resilient Development in Viet Nam Strategic Directions fromthe World Bank.
• World Bank (2016) World Development Indicators
• WRI (2016) CAIT Climate Data Explorer
[The full references are included in the bibliography.]
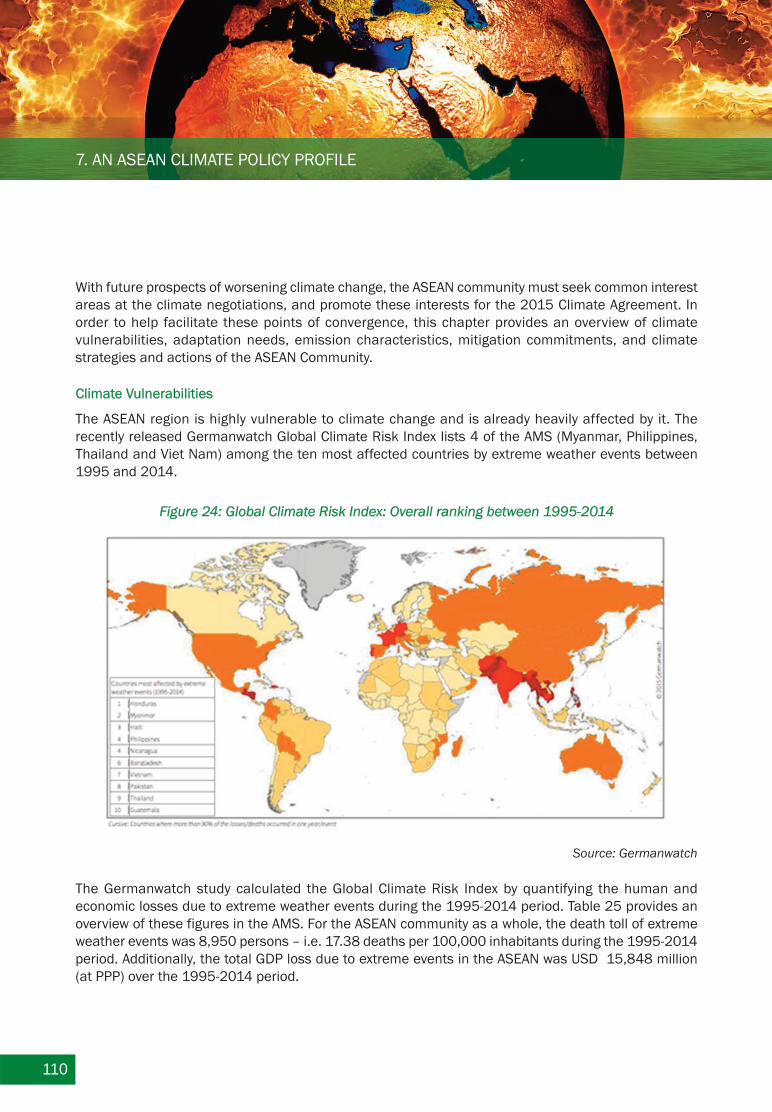
110
With future prospects of worsening climate change, the ASEAN community must seek common interestareas at the climate negotiations, and promote these interests for the 2015 Climate Agreement. Inorder to help facilitate these points of convergence, this chapter provides an overview of climate vulnerabilities, adaptation needs, emission characteristics, mitigation commitments, and climate strategies and actions of the ASEAN Community.
Climate Vulnerabilities
The ASEAN region is highly vulnerable to climate change and is already heavily affected by it. The recently released Germanwatch Global Climate Risk Index lists 4 of the AMS (Myanmar, Philippines,Thailand and Viet Nam) among the ten most affected countries by extreme weather events between1995 and 2014.
Figure 24: Global Climate Risk Index: Overall ranking between 1995-2014
7. AN ASEAN CLIMATE POLICY PROFILE
Source: Germanwatch
The Germanwatch study calculated the Global Climate Risk Index by quantifying the human and economic losses due to extreme weather events during the 1995-2014 period. Table 25 provides anoverview of these figures in the AMS. For the ASEAN community as a whole, the death toll of extremeweather events was 8,950 persons – i.e. 17.38 deaths per 100,000 inhabitants during the 1995-2014period. Additionally, the total GDP loss due to extreme events in the ASEAN was USD 15,848 million(at PPP) over the 1995-2014 period.
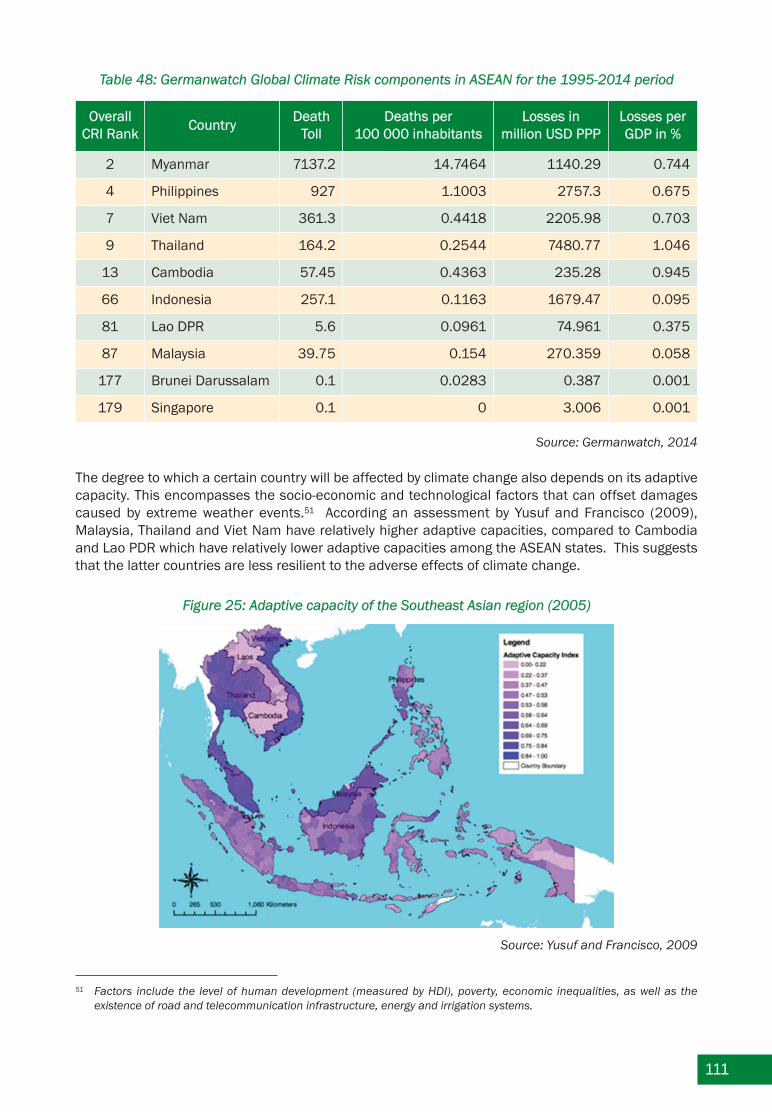
111
Table 48: Germanwatch Global Climate Risk components in ASEAN for the 1995-2014 period
OverallCRI Rank
CountryDeath
TollDeaths per
100 000 inhabitantsLosses in
million USD PPPLosses per GDP in %
2 Myanmar 7137.2 14.7464 1140.29 0.744
4 Philippines 927 1.1003 2757.3 0.675
7 Viet Nam 361.3 0.4418 2205.98 0.703
9 Thailand 164.2 0.2544 7480.77 1.046
13 Cambodia 57.45 0.4363 235.28 0.945
66 Indonesia 257.1 0.1163 1679.47 0.095
81 Lao DPR 5.6 0.0961 74.961 0.375
87 Malaysia 39.75 0.154 270.359 0.058
177 Brunei Darussalam 0.1 0.0283 0.387 0.001
179 Singapore 0.1 0 3.006 0.001
Source: Germanwatch, 2014
The degree to which a certain country will be affected by climate change also depends on its adaptivecapacity. This encompasses the socio-economic and technological factors that can offset damagescaused by extreme weather events.51 According an assessment by Yusuf and Francisco (2009),Malaysia, Thailand and Viet Nam have relatively higher adaptive capacities, compared to Cambodiaand Lao PDR which have relatively lower adaptive capacities among the ASEAN states. This suggeststhat the latter countries are less resilient to the adverse effects of climate change.
Figure 25: Adaptive capacity of the Southeast Asian region (2005)
51 Factors include the level of human development (measured by HDI), poverty, economic inequalities, as well as the existence of road and telecommunication infrastructure, energy and irrigation systems.
Source: Yusuf and Francisco, 2009

There are several other varying studies and assessments evaluating the extent of a nation’s adaptivecapacity to climate change. For example, a recent study conducted by the Stockholm Environment Institute (SEI) (2016) assesses “adaptation readiness” through components such as political leader-ship, scientific research, available funding for planning and public support. The assessment categorizedASEAN nations into three main groups being: (1) the adaptation pioneers; (2) the emerging champions;and (3) the wait-and-see-adaptors.
According to researchers at SEI, “adaptation pioneers” are countries that regard adaptation with greaturgency and have already established institutional frameworks to address it. This group is comprisedof the Philippines and Viet Nam, where there have been disaster occurrences that have triggered andstimulated policy engagement. The second group, the “emerging champions”, include Cambodia, Indonesia and Myanmar that use novel adaptation tactics to increase their adaptation readiness. Finally, the “wait-and-see adaptors” are mainly upper middle-income nations – most notably Malaysiaand Thailand – that are relatively less exposed and vulnerable to climatic disasters and therefore lessfocused on adaptation compared to their neighbours.
Adaptation Needs and Actions
While some of the expected climate impacts are country-specific, other sectors and areas will be affected throughout most of the ASEAN region. Table 47 gives an overview of the most vulnerable sectors in each of the AMS.
Table 49: Key vulnerable sectors to climate change in the ASEAN
112
Agric
ultu
re F
ood
Secu
rity
Coas
tal Z
ones
Mar
ine
ecos
yste
ms
Terr
estr
ial E
cosy
stem
s
Fore
stry
Dis
aste
rs
Ener
gy
Publ
ic H
ealth
Was
te S
ecto
r
Wat
er R
esou
rces
Infr
astr
uctu
re
Brunei Darussalam ¨ ¨ ¨ ¨ ¨ ¨
Cambodia ¨ ¨ ¨ ¨ ¨
Indonesia ¨ ¨ ¨ ¨ ¨
Lao PDR ¨ ¨ ¨ ¨ ¨
Malaysia ¨ ¨ ¨ ¨ ¨ ¨ ¨ ¨ ¨
Myanmar ¨ ¨ ¨ ¨ ¨ ¨ ¨ ¨ ¨
Philippines ¨ ¨ ¨ ¨ ¨
Singapore ¨ ¨ ¨ ¨ ¨
Thailand ¨ ¨ ¨ ¨ ¨ ¨ ¨ ¨
Viet Nam ¨ ¨ ¨ ¨ ¨ ¨ ¨ ¨ ¨
Source: ALM Country Profiles, World Bank Climate Change Knowledge Portal, 2014; INDC’s for each AMS (UNFCCC).

113
Due to similar regional characteristics, there are some adaptation areas that are prioritised in the majority of the AMS. These include coastal zones, coastal and marine ecosystems, public health, agriculture and food security, as well as forestry. Identified adaptation solutions throughout the AMSinclude (but are not limited to) the following:
• Agriculture: Climate-resilient crop varieties, diversified production, improved managementof soil and water resources, drainage systems, irrigation facilities, and flood and droughtmonitoring systems.
• Forestry: Research and provision of climate information and forest degradation, communityreforestation programmes, improved sustainable forest management, and poverty reduction in forest areas.
• Coastal areas: Integrated coastal resources management, and improved observation andresearch on coastal environmental change.
• Disaster risk reduction: Improved weather observation capacities, flood and drought earlywarning systems, and assessment of the hydrological impact of climate change on riversystems.
• Public Health: Health education programmes, health extension services and malaria surveillance systems, infrastructure and disease control programmes, community involve-ment in defense strategies, climate-resilient health facilities, safe water supplies, and sanitary latrines.
• Water resource management: Quality and quantity assessment studies, improved forecasting, water and watershed management practices, and flood prevention infrastruc-tures.
• Infrastructure: Finance for the maintenance of infrastructure, build resilient infrastructurebased on potential climate change impacts, resettle communities under immediate threat,improve standards for infrastructure and continuously inspect existing infrastructure.
GHG Emissions
For most of the AMS, the latest UNFCCC GHG emissions data is available for the year 2010.
More up-to-date GHG emissions data is available via the World Resource Institute’s Climate AnalysisIndicators tool (CAIT), however the data collection and calculation is not identical to the one used bythe UNFCCC, creating some difficulties in making comparisons.
Nevertheless the data collected by CAIT gives a good approximate indication of the latest emissionstrends. According to this dataset, in 2012, the GHG emissions in the ASEAN region reached 2.05 billiontCO2, excluding LUCF, and 3.55 billion tCO2 including LUCF.

Figure 26: Total GHG emissions of ASEAN Member States - 2012 (MtCO2)
114
Brunei
Cambodia
Indonesia
Laos
Malaysia
Myanmar
Philippines
Singapore
Thailand
Vietnam
0 500 1000 1500 2000
Total GHG Emissions Including LULUCF 2012
Total GHG Emissions Excluding LULUCF 2012
Source: WRI, 2016
The CAIT calculations also indicate that the relative share of GHG emissions in the ASEAN region differconsiderably from the world average, with a higher share of methane and nitrous oxide gases, originat-ing from the forestry and agriculture sectors. Although the majority of GHG emissions (62%) originatefrom CO2 emissions in the ASEAN region, methane and nitrous oxide gases also had a significant shareof 28% and 9%, respectively. However, as compared to 2011, the share of CO2 emissions has risenfrom 58% to 62%, while the share of nitrous oxide has fallen from 14% to 9%.
Figure 27: GHG emissions by Gas – 2012 (MtCO2) in the ASEAN region
Total N20 - 2012
9%
Total CH4 -
2012
28%
Total CO2
(excluding
LULUCF) -
2012
62%
Total F-Gas - 2012
1%
Source: CAIT, 2016

115
CO2 emissions per capita data was collected from the World Bank’s World Development Indicators data-base. According to these calculations, the per capita CO2 emissions in the region have been increasing since 1990 (except for Singapore), however these are still well below the world average (4.94metric tonnes in 2011), except in Brunei Darussalam and Malaysia.
Figure 28: Carbon dioxide emissions per capita in ASEAN Member States - metric tons of CO2 per capita
30
25
20
15
10
5
0
Brunei D
aruss
alam
Cambodia
Indonesi
a
Lao PD
R
Mala
ysia
Myanm
ar
Philippin
es
Singapore
Thailand
Vietn
am
1990 2000 2005 2011
Source: World Bank, 2016
Commitments to Mitigate GHG Emissions
To slow down the increase of GHG emissions, many of the AMS have pledged to contribute to interna-tional GHG mitigation efforts. Table 48 outlines these commitments, including overall GHG emissionreduction pledges, energy consumption improvements, and reforestation and afforestation targets.

Table 50: Overview of ASEAN Member States climate targets
116
Country Sector NAMA Target for 2020 INDC Target for 2030
Brunei Darussalam
Energy
n.a
• Reduce energy consumption è 63% by2035 BAU
• Reduce energy intensity è 45% by 2035
• Increase the share of renewables è 10%
Land TransportCO2 from morning peak hour vehicle use è 40% below BAU by 2035
Forestry Gazette forest reserves è 55% of total land are
Cambodia
Energy
n.a
Reduce emissions è 16%
Manufacturing Reduce emissions è 7%
Transport Reduce emissions è 3%
Other (e.g. wasteand buildings) Reduce emissions è 1%
Forest Cover Increase by 60% total land area by 2030
Indonesia
Overall Emissions Reduction
Reduction of GHG Emissions
è 26% (Unconditional)
è 15% (Conditional)
Reduction in emissions
è 29% BAU by 2030 (Unconditional)
è 41% BAU by 2030 (Conditional)
Energy n.a Renewable Energy è 23% of energy use by 2025
Forestry
n.a
Moratorium on the clearing of primary forestand prohibiting conversion of peat lands by2016
WasteStrengthen institutional capacities for urban waste by 2020
Lao PDR
Forestry70% for total land areaby 2020
70% for total land area by 2020
Energy n.a
• Increase renewable energy è 30% oftotal energy consumption
• Increase large hydro capacity to 5.5 GWby 2020 and 20 GW by 2030
• Rural electrification è 90% of households
Transport Increase biofuels è 10% of fuel demand
MalaysiaOverall Emissions Reduction
Reduction emission intensity
è 40% by 2020 (2005base level)
Reduction in GHG emissions intensity
è 45% by 2030 relative to emissions 2005 (Conditional)
è 35% (Unconditional)

117
Country Sector NAMA Target for 2020 INDC Target for 2030
EnergyIncrease renewable energy è 11% by 2020
n.a
Myanmar
Energy
n.a
• Increase share of hydro è 9.4 W by 2030
• Increase rural electrification è 30% renewable energy
• Electricity saving potential è 20%
Forestry
• Reserved Forest (RF) & Protected Forest(PF) è 30% of total land area
• Protected Area Systems (PAS) è 10% oftotal land area
PhilippinesOverall Emissions Reduction
Reduction in emissions
è 5% by 2012 (1990 levels)
è 10% by 2028 (later withdrawn)
GHG emissions reduction
è 70% by 2030 to BAU scenario
Singapore
Overall Emissions Reduction
Reduce GHG emissions
è 7-11% BAU by 2020 (Unconditional)
è 16% BAU by 2020 (Conditional)
Reduce emission intensity è 36% from 2005 levels by 2030
Energy
• Increase energy efficiency è35% by 2030 (from 2005)
• Contingent on a legallybinding global agreementin which all countries implement their commit-ments in good faith.
Stabilize emissions è aim to peak around2030
Thailand
EnergyIncrease alternative energyshare è 25% by 2021
• 20% of power generation from renewablesources
• 30% share of renewable energy in totalfinal energy consumption
• 30% reduction in energy intensity by 2036
Forestry n.a Increase national forest cover to 40%
OverallEmissionsReduction
Reduction GHG emissions è 20% by 2020
Reduce GHG emissions è 8% BAU by 2030 (Conditional) è 25% BAU by 2030 (Unconditional)
Viet NamEnergy
• Energy: 8% | Agriculture:20% | Water: 5% | LULUCF:20%
• Reduce GHG emissions intensity è 8-10% (compared to 2010)
• Reduce energy consumption per unit ofGDP è 1-1.5% per year
Reduce emission intensity
è 20% below 2010 levels (Conditional)
è 30% (Unconditional)
Forestry n.a Increase to 45% of total land area

118
As explained in Chapter 2 Global Climate Negotiations, efforts to promote sustainable development,improve capacity building, technology and finance, and stabilize and reduce greenhouse gas emissionsfor developing nations were established under the label of Nationally Appropriate Mitigation Actions(NAMAs). The NAMAs were originally signed through the Bali Action Plan and were recognized as voluntary pledges (Table 48). Currently there are 165 NAMAs being implemented. They are a flexibletool to encourage low carbon developments. However, it is remains unclear as to how NAMAs will belinked with the current INDC and climate agreements beyond 2020. The recently submitted mitigationambitions, INDCs, are target strategies for a post-2020 climate regime. Nonetheless, a third of devel-oping countries include NAMA’s role within their INDCs, especially low-income countries.
NAMAs and INDCs vary in their intent. For instance, INDCs are a country’s goal at a national level, whileNAMAs are national or individual voluntary action within single sectors. Additionally, it is mandatoryunder the Paris Agreement for Parties to pursue domestic mitigation measures and to take responsi-bility for accounting for their respective INDCs. Additionally, the agreement mandates Parties to regularlyreport progress on their pledges. However, NAMAs do not mandate but instead offer an open invitationfor countries to communicate NAMAs. Despite their differences, the NAMAs could possibly give an earlyindication whether the 2030 targets of the INDCs are on track or whether additional resources mustbe mobilized to support the mitigation strategies.
NAMAs could also be seen as a stepping-stone to achieve the INDCs. It is possible for NAMAs to play arole as an implementation tool by meeting the targets of INDC through specific mitigation targets. Therefore in the end both the NAMAs and INDCs can together mutually reinforce each other.
Mitigation commitments are also enhanced by regional co-operation among the AMS in the field of energy, agriculture and forestry as well as carbon trading:
• Energy measures: The ASEAN Plan of Action for Energy Cooperation (APAEC) 2016-2020recognizes energy as the key to achieving the ASEAN Economic Community (AEC). Theplan aims to enhance energy connectivity and market integration to ensure energy securitycoupled with accessibility, affordability and sustainability. The main initiatives underAPAEC include establishing multilateral electricity trading across ASEAN to accomplish theASEAN Power Grid (APG) and expanding the Trans-ASEAN Gas Pipeline (TAGP) to also include liquefied natural gas (LNG). The plan further emphasizes energy efficiency by intensifying renewable energy use and exploring nuclear energy capabilities. These objectives will be achieved through a two-phase strategy.
• Agriculture and forestry: Agriculture plays a critical role in the ASEAN region, yet the sectorremains highly vulnerable to climate change. At the same time, this sector is also respon-sible for a significant share of the region’s total GHG emissions. Thus the ASEAN memberstates have embarked on measures to enhance regional integration to ensure food secu-rity (Ewing, 2016). ASEAN adopted the Multi-Sectoral Framework on Climate Change: Agriculture, Fisheries and Forestry Towards Food Security in 2009 (Letchumanan, 2009).Additionally, ASEAN formulated the Vision and strategic plan of ASEAN Cooperation in food,agriculture and forestry towards (2016-2025) in 2013. This plan incorporates the pressures induced by climate change on nations and food security by increasing resilience,mitigation and adaptation of climate change by prioritizing capacity building to reducelosses due to disasters and emergencies by tapping into national, regional and interna-tional cooperation (ASEAN, 2015).
• Carbon Trading: The ASEAN region has benefited from the CDM mechanism since 2001and has also undertaken regional cooperation efforts to increase the number of projectsand their positive outcomes in the AMS. Since 2012, economy-wide carbon market initia-tives have also gained importance in the region, especially after the Republic of Koreaadopted a law for the launch of national carbon trading from 2015 onwards (Townshend,2014). To date, a few regional and national initiatives have been launched. At the regionallevel, bi-lateral carbon trading between Japan and some AMS via the Joint Crediting

119
Mechanism is already operational. At the national level, both Indonesia and Thailand arein the process of introducing voluntary emission trading schemes (Hsieh, 2014).
Climate Change Policies and Programmes
The AMS ratified both the UNFCCC and the Kyoto Protocol, and participate at the COPs. Furthermore,the challenge of climate change is also outlined and addressed in their national development plans.Except Brunei Darussalam and Myanmar, to date all AMS have adopted a national climate change strategy and assigned a committee or council to co-ordinate the implementation of the strategy. Manyof them have also developed adaptation plans or programmes.
Table 51: Climate Change strategic and institutional frameworks in among ASEAN Member States
UNFCCC andKyoto
Protocol
Climate change mentioned in the
developmentplan
ClimateChangeStrategy
ClimateChange
Committeeor Council
AdaptationAction Plan or
Programme
Brunei Darussalam ¨ ¨ ¨ ¨
Cambodia ¨ ¨ ¨ ¨ ¨
Indonesia ¨ ¨ ¨ ¨ ¨
Lao PDR ¨ ¨ ¨ ¨ ¨
Malaysia ¨ ¨ ¨ ¨
Myanmar ¨ ¨ ¨
Philippines ¨ ¨ ¨ ¨ ¨
Singapore ¨ ¨ ¨ ¨
Thailand ¨ ¨ ¨ ¨
Viet Nam ¨ ¨ ¨ ¨ ¨
Source: Adapted from Yuen et al. (2009), UNFCCC (2015)
The implementation of climate change mitigation and adaptation activities has also accelerated in recent years. For example, the number of implemented climate projects has considerably increased.Prominent activities include climate research, CDM and REDD+ projects, disaster risk managementprojects, development of GHG emissions inventories, and low carbon technology deployment.

120
Source: ASEAN Climate Change Action Database (ACCAD)
All these trends point towards a positive momentum in AMS in addressing the current and future challenges of climate change. However, in order to maintain such momentum, there is a need for coun-tries and communities to ensure specific regional and national challenges are dealt with in a timelymanner.
Given the current unprecedented rate of the world’s climate changing, it is now most urgent and crucialto support vulnerable communities, especially those in Southeast Asia that are increasingly being exposed to extreme weather events. Increasing investment in adaptive capacity, will aid in safeguardingeconomic progress, strengthening the climate resilience and significantly reducing disaster risks. Currently, the established adaptation policies in AMS are still new. Nonetheless, the efforts are increas-ing. For instance, all the AMS have encompassed adaptation strategies within their INDCs, such as Indonesia’s goal to strength institutional capacity and implement an adaptation strategy aimed at re-ducing risks on all development sectors, and Lao PDR’s INDC which includes the National AdaptationProgramme of Action (2009) and the National Strategy on Climate Change (2010). However, in orderto achieve coherent national adaptation strategies, member states must continue to strengthen fundingfor adaptation planning, establish monitoring and evaluating systems to assess adaptation efforts, enable sharing of adaptation expertise, insights and experiences and work towards building public support for adaptation.
As presented in this Handbook, many of the AMS already face or will face a variety of challenges, whichcan be linked to climate change. Their high vulnerability to climate change may severely affect theirsocio-economic development and potentially also their political stability. In addition, such negative developments may not remain solely a national-level problem, but spill over to other countries in theregion as well. At the same time, it has been recognised that many of the most vulnerable sectors (suchas agriculture, forestry, healthcare or water management) require a prioritisation of adaptation needs,which are relatively similar across AMS countries. These challenges can provide the AMS with a varietyof opportunities for co-operation and identification of common solutions.
Such co-operation opportunities can also be identified for the mitigation of GHG emissions in the region.With many rapidly growing economies, the region is making an increasing large contribution to globalemissions, and this accelerates the need for ensuring greener, low-carbon development. Important co-operation areas in this regard include the energy and forest sectors, and the establishment of carbontrading mechanisms.
Cambodia Indonesia LaoPDR
Malaysia Myanmar Philippines Singapore Thailand VietnamN
umbe
r of P
roje
cts
60
40
20
01995 1996 1997 1998 1999 2000 2001 2002 2003 2004 2005 2006 2007 2008 2009 2010 2011 2012 2013 2014
Figure 29: Growth trends of climate projects in ASEAN Member States

121
• Asian Development Bank (2016), Emissions Trading Schemes and their Linking: Challenges and Opportunities in the Asia and the Pacific. Accessed From:
http://www.adb.org/sites/default/files/publication/182501/emissions-trading-schemes.pdf
• Ad Hoc Working Group on the Durban Platform for Enhanced Action (2014), Reflections on progressmade at the fifth part of the second session of the Ad Hoc Working Group on the Durban Platformfor Enhanced Action. Note by the Co-Chairs.
Accessed From: http://unfccc.int/resource/docs/2014/adp2/eng/5infnot.pdf
• Adaptation Fund (2016), Parties’ Designated Authorities. Accessed From:
https://www.adaptation-fund.org/apply-funding/designated-authorities/
• Adaptation Knowledge Platform (2011), Scoping Assessment on Climate Change Adaptation inMalaysia. Accessed From:
http://www.climateadapt.asia/upload/publications/files/4f27b1074e7aeMalaysia.pdf
• Adaptation Learning Mechanism website (2009), Country Profiles. Accessed From:
http://www.adaptationlearning.net/country-profiles
• African Group (2013), Submission by Sudan on behalf of the Africa Group: Elements of the draft negotiation text under the ADP.
Accessed From: http://unfccc.int/files/bodies/application/pdf/adp_w1_elements_african-group.pdf
• Alliance of Small Island States (AOSIS) proposal to the AWG-LCA (2008), Multi-window Mechanismto Address Loss and Damage from Climate Change Impacts. Accessed From:
http://unfccc.int/files/kyoto_protocol/application/pdf/aosisinsurance061208.pdf
• Am, P., Cuccillato, E., Nkem, J., Chevillard, J. (2013), Mainstreaming Climate Change Resilience intoDevelopment Planning in Cambodia, IIED country report. Accessed From:
http://pubs.iied.org/10047IIED
• ASEAN (2015) Declaration on ASEAN Post-2015 Environmental Sustainability and Climate ChangeAgenda on the occasion of the 27th ASEAN Summit in Kuala Lumpur, Malaysia, 21 November 2015.Accessed From: http://environment.asean.org/download/climate-change/agreement/Declaration-on-ASEAN-Post-2015-Environmental-Sustainability-and-Climate-Change-Agenda.pdf
• ASEAN (2015b) ASEAN Joint Statement on Climate Change to the 21st Session of the Conferenceof the Parties to the United Nations Framework Convention on Climate Change (COP21), adoptedon the occasion of the 27th ASEAN Summit in Kuala Lumpur, Malaysia, 21 November 2015
Accessed From: http://environment.asean.org/download/climate-change/agreement/ASEAN-Joint-Statement-on-Climate-Change-Adopted.pdf
• ASEAN (2014), Submission by Brunei Darussalam, Cambodia, Indonesia, Lao PDR, Malaysia, Myan-mar, Philippines, Singapore, Thailand and Vietnam as members of the Association of South East
BIBLIOGRAPHY

122
Asian Nations (ASEAN) on Methodological guidance for activities relating to reducing emissions fromdeforestation and forest degradation and the role of conservation, sustainable management offorests and enhancement of forest carbon stocks (REDD+) in developing countries. Accessed From:http://unfccc.int/files/methods/redd/submissions/application/pdf/20140330_subm_redd_in-donesia-asean.pdf
• ASEAN (2014b), Submission by Indonesia on behalf of Brunei Darussalam, Cambodia, Indonesia,Lao PDR, Malaysia, Myanmar, Philippines, Singapore, Thailand, and Vietnam as members of the Association of South East Asian Nations (ASEAN) on Policy approaches and positive incentives onissues relating to reducing emissions from deforestation and forest degradation in developing countries; and the role of conservation, sustainable management of forests and enhancement offorest carbon stocks in developing countries. Accessed From:
https://unfccc.int/files/documentation/submissions_from_parties/application/pdf/indonesia_asean_redd.pdf
• ASEAN (2012), Joint Statement of ASEAN Environment Ministers for the 11th Meeting of the Conference of the Parties to the Convention on Biological Diversity.
Accessed From: http://asean.org/joint-statement-of-asean-environment-ministers-for-the-eleventh-meeting-of-the-conference-of-the-parties-to-the-convention-on-biological-diversity/
• ASEAN Working Group on Climate Change (2012b), Report of the third meeting of the ASEAN WorkingGroup on Climate Change. Accessed From:
http://203.150.224.249/monre_asean/ewt/asean_intra/ewt_news.php?nid=42&filename=index
• ASEAN (2012c), Bangkok Resolution on ASEAN Environmental Cooperation, on the occasion of the12th ASEAN Ministerial Meeting on the Environment.
Accessed From: http://environment.asean.org/wp-content/uploads/2015/06/ADOPTED-Bangkok_Resolution_12AMME-26Sep.pdf
• ASEAN (2011), ASEAN Leaders’ Statement on Climate Change to COP17 to the UNFCCC and CMP7to the Kyoto Protocol,on the occasion of the 19th ASEAN Summit in Indonesia. Accessed From:http://environment.asean.org/wp-content/uploads/2015/06/ASEAN_Leaders_Statement_on_Cli-mate_Change.pdf
• ASEAN ( 2010), ASEAN Leaders’ Statement on Joint Response to Climate Change (16th ASEAN Summit, 2010). Accessed From: http://environment.asean.org/documentation/
• ASEAN (2009), ASEAN Joint Statement on Climate Change to COP15 to the UNFCCC and CMP5 tothe Kyoto Protocol (15th ASEAN Summit, 2009).
Accessed From: http://environment.asean.org/documentation/
• ASEAN (2007), ASEAN Declaration on the 13th session of the Conference of the Parties to the UNFCCC and the 3rd session of the CMP to the Kyoto Protocol.
Accessed From: http://environment.asean.org/documentation/
• ASEAN Statistics (2015), Selected basic ASEAN indicators. Accessed From:
http://www.asean.org/storage/2015/09/selected_key_indicators/table1_as_of_Aug_2015.xls
• Asian Development Bank (2009), The Economics of Climate Change in Southeast Asia: A
• Regional Review. Accessed From: http://www.adb.org/Documents/Books/Economics-Climate-Change-SEA/PDF/Economics-Climate-Change.pdf
• Baker & McKenzie (2016), The Paris Agreement: Putting the first universal climate change treaty incontext. Accessed From: http://www.bakermckenzie.com/files/Uploads/Documents/Environmen-tal/ar_global_climatechangetreaty_jan16.pdf

123
• Bello, W. (2015), ‘The Dilemmas Faced by Climate-Vulnerable Developing Countries’, Counter Punch,January 20. Accessed From: http://www.counterpunch.org/2015/01/20/the-dilemmas-faced-by-climate-vulnerable-developing-countries/.
• Brunei Darussalam (2012), Country Statement at the18th session of the Conference of the Parties(COP18) to the United Nations Framework for Climate Change Convention (UNFCCC) and the 8thsession of the Conference of the Parties to the Meeting of Parties (CMP8) to the UNFCC. AccessedFrom: http://unfccc.int/resource/docs/cop18_cmp8_hl_statements/Brunei%20Darussalam% 20Country%20Statement%20COP18CMP8%20Doha%202012.pdf
• Brunei Darussalam Ministry of Development (2015), Brunei Darussalam’s Intended Nationally Determined Contribution (INDC). Accessed from: http://www4.unfccc.int/Submissions/INDC/Pub-lished%20Documents/Brunei/1/Brunei%20Darussalam%20INDC_FINAL_30%20November%202015.pdf
• Brunei Darussalam Ministry of Development (2016), Department of Environment, Parks and Recre-ation Environmental Acts and Guidelines. Accessed From: http://www.env.gov.bn/SitePages/Envi-ronmental%20Acts%20and%20Guidelines.aspx
• Brunei Times (2011), National Council on Climate Change set up with His Majesty's consent. Accessed From: http://www.bt.com.bn/news-national/2011/02/14/national-council-climate-change -set-his-majestys-consent
• CAIT Climate Data Explorer (2016). Accessed from: http://cait.wri.org/historical
• Cambodia REDD+ Official Website (2014). Accessed From: http://www.cambodia-redd.org/cate-gory/national-redd-framework/program-structure
• Carbon Brief (2016), Paris 2015: Tracking requests for climate finance - Updated 23 October 2015.Accessed From: http://www.carbonbrief.org/paris-2015-tracking-requests-for-climate-finance
• Case, M., Ardiansyah F. and Spector E. (2007), Climate Change in Indonesia. Implications for Humansand Nature (Gland, Switzerland: WorldWide Fund for Nature (WWF).
Accessed From: http://assets.panda.org/downloads/inodesian_climate_change_impacts_re-port_14nov07.pdf
• CBC News (2011), “Canada pulls out of Kyoto Protocol”, 12 December 2011. Accessed From:http://www.cbc.ca/news/politics/canada-pulls-out-of-kyoto-protocol-1.999072
• Chit, O. K. & Soe, M. M. (2015), “Development Planning and Climate Change in Myanmar”, CapacityBuilding on Climate Change Impacts, Assessments and Adaptation Planning in the Asia Pacific Re-gion: Needs and Challenges for Designing and Implementing Climate Action, Bangkok. AccessedFrom: http://www.asiapacificadapt.net/sites/default/files/2015/oct-workshop/10%20D1_S3a_P2_1%20Myanmar%20[Oo%20Ko].pdf
• Climate Change Commission of the Philippines (2011), National Climate Change Action Plan 2011-2028. Accessed From: http://adaptationmarketplace.org/data/library-documents/NCCAP_Tech-Doc.pdf
• Climate Group (2011), Durban: Post-COP17 Briefing. Accessed From:
http://www.theclimategroup.org/_assets/files/COP17---Post-COP-briefing---Dec23.pdf
• Climate Policy Initiative, CPI (2015), The Global Landscape of Climate Finance, 2015.
Accessed From: http://climatepolicyinitiative.org/wp-content/uploads/2015/11/Global-Land-scape-of-Climate-Finance-2015.pdf
• Conference of the Parties to the Kyoto Protocol (2012), Doha Amendment to the Kyoto Protocol. Accessed From: http://unfccc.int/files/kyoto_protocol/application/pdf/kp_doha_amendment_eng-lish.pdf
124
• Council of the European Union (2013), Conclusions on Preparations for the 19th session of the Con-ference of the Parties (COP 19) to the United Nations Framework Convention on Climate Changeand the 9th session of the Meeting of the Parties to the Kyoto Protocol (Warsaw, 11 - 22 November2013). Accessed From:
http://www.consilium.europa.eu/uedocs/cms_Data/docs/pressdata/en/envir/139002.pdf
• Deutsche Klimafinanzieurg (2015), OECD report on climate finance: Fit for purpose or well on theway to meet the $100 billion promise? October 8, Accessed From: http://www.germanclimatefi-nance.de/2015/10/08/well-way-meet-100-billion-promise/
• Duyck, S. (2013), Mapping negotiating coalitions’ positions on responsibility for climate action. Accessed From: http://adoptanegotiator.org/2013/04/30/mapping-negotiating-coalitions-posi-tions-on-responsibility-for-climate-action/
• Duyck, S. (2013b), Visualization of countries positions ahead of the COP-19 – developing countries.Accessed From: http://adoptanegotiator.org/2013/10/22/visualization-of-countries-positions-ahead-of-the-cop-19/
• Environmental Integrity Group (2013), Submission on Means of Implementation.Accessed From:http://unfccc.int/files/documentation/submissions_from_parties/adp/application/pdf/adp_eig_workstream_1_20130923.pdf
• European Commission (2015), “Historic climate deal in Paris: EU leads global efforts”, Press Release,December 12. Accessed From: http://europa.eu/rapid/press-release_IP-15-6308_en.htm
• Freidrich, J. &Damassa, T. (2014), The History of Carbon Dioxide Emissions. Accessed From:http://www.wri.org/blog/2014/05/history-carbon-dioxide-emissions
• General Secretariat, National Council for Sustainable Development/Ministry of Environment, King-dom of Cambodia (GSSD) (2015), Cambodia’s Second National Communication under the UnitedNations Framework Convention on Climate Change. Accessed From:
http://unfccc.int/resource/docs/natc/khmnc2.pdf
• General Secretariat, National Council for Sustainable Development (2015), Cambodia’s Second National Communication under the United Nations Framework Convention on Climate Change. Ministry of Environment, Kingdom of Cambodia, Phnom Penh.
• Global Environmental Facility (2016), Homepage. Accessed From: www.thegef.org
• GLOBE (2015), The 2015 Global Climate Legislation Study – A Review of Climate Change Legislationin 99 countries. Accessed From: http://www.lse.ac.uk/GranthamInstitute/legislation/
• GLOBE (2015b), Myanmar: An Excerpt from the 2015 Global Climate Legislation Study – A Reviewof Climate Change Legislation in 99 countries. Accessed From: http://www.lse.ac.uk/GranthamIn-stitute/wp-content/uploads/2015/05/MYANMAR.pdf
• Gosden E. (2015), “Paris climate agreement ‘a major leap for mankind’”, The Telegraph, December12. Accessed From:
http://www.telegraph.co.uk/news/earth/paris-climate-change-conference/12047909/Paris-cli-mate-change-agreement-a-major-leap-for-mankind.html
• Government of Malaysia (2016), Malaysia Biennial Update Report to the UNFCCC. Accessed From:http://unfccc.int/resource/docs/natc/malbur1.pdf
• Government of Malaysia (2015a), Eleventh Malaysia’s Plan 2016-2020 Accessed From:http://rmk11.epu.gov.my/book/eng/Elevent-Malaysia-Plan/RMKe-11%20Book.pdf
• Government of Malaysia (2015b), Intended Nationally Determined Contribution of the Governmentof Malaysia. Accessed From: http://www4.unfccc.int/submissions/INDC/Published%20Docu-ments/Malaysia/1/INDC%20Malaysia%20Final%2027%20November%202015%20Revised%20Final%20UNFCCC.pdf

125
• Green Climate Fund (2014), Homepage. Accessed From: www.gcfund.org
• Green Climate Fund (2016), National Designated Authority (NDA) and focal point designations. Accessed From: http://www.greenclimate.fund/documents/20182/318991/NDA_and_Focal_Point_nominations_for_the_Green_Climate_Fund.pdf/eeace75b-aa59-489c-8914-c0940debe01f
• High Level Segment statements by Heads of States and Governments and IGOs and NGOs at COP18/ CMP8 (2012), Accessed From:
https://unfccc.int/meetings/doha_nov_2012/statements/items/7324.php
• High Level Segment statements by Heads of States and Governments and IGOs and NGOs at COP19/ CMP9 (2013). Accessed From:
http://unfccc.int/meetings/warsaw_nov_2013/statements/items/7878.php
• Hsieh, S. (2014), Preparing for Emissions Trading Schemes in Indonesia and Thailand: Progress andChallenges. Accessed From: http://ntsblog.wordpress.com/2014/05/18/preparing-for-emissions-trading-schemes-in-indonesia-and-thailand-progress-and-challenges/
• IETA website (2016). Accessed From: http://www.ieta.org/The-Worlds-Carbon-Markets
• IFAD (2009), Climate change impacts - Southeast Asia. Accessed From:
http://www.ifad.org/events/apr09/impact/pacific.pdf
• IISD (2013), “Summary of the Warsaw Climate Change Conference: 11 – 23 November 2013”, EarthNegotiations Bulletin Vol. 12 No. 594. Accessed From:
http://www.iisd.ca/download/pdf/enb12594e.pdf
• IISD (2015), “Summary of the Paris Climate Change Conference: 29 November – 13 December2015)”, Earth Negotiations Bulletin Vol. 12 No. 663. Accessed From:
http://www.iisd.ca/download/pdf/enb12663e.pdf
• Inter-Agency Committee on Climate Change (2016), Second National Communications to the UnitedNation Convention on Climate Change. Accessed from:
http://unfccc.int/resource/docs/natc/phlnc2.pdf
• International Carbon Action Partnership (2016), Factsheet.Accessed From: https://icapcarbonac-tion.com/en/?option=com_etsmap&task=export&format=pdf&layout=list&systems%5B%5D=81
• ILO (2012), Strengthening the Philippines’ Institutional capacity to adapt to climate change – FinalJoint Evaluation.Accessed From: http://www.ilo.org/wcmsp5/groups/public/---ed_mas/---eval/doc-uments/publication/wcms_188590.pdf
• IPCC Fifth Assessment Report (2013), First Working Group Report. Accessed From: http://www.cli-matechange2013.org/images/report/WG1AR5_SPM_FINAL.pdf
• IPCC Fifth Assessment Report (2014), Second Working Group Report.
Accessed From: http://ipcc-wg2.gov/AR5/images/uploads/WG2AR5_SPM_FINAL.pdf
• IPCC website (N.D). Accessed From: http://www.ipcc.ch/
• The Jakarta Post (2013), “Carbon trading and its challenges for Indonesia”. Accessed From:http://www.thejakartapost.com/news/2013/08/31/carbon-trading-and-its-challenges-indonesia.html
• Jasparro, C. and J. Taylor (2008), Climate change and regional vulnerability to transnational securitythreats in Southeast Asia. Geopolitics, 13 (2).232-256.
• KementerianTenaga, TeknologiHijaudan Air (KeTTHA) (2012), Low Carbon Cities Framework and Assessment System. Accessed From: http://esci-ksp.org/wp/wp-content/uploads/2012/04/Low-Carbon-Cities-Framework-and-Assessment-System.pdf

126
• King, E. (2015), “Kyoto Protocol: 10 years of the world’s first climate change treaty”, Climate Home,February 16. Accessed From: http://www.climatechangenews.com/2015/02/16/kyoto-protocol-10-years-of-the-worlds-first-climate-change-treaty/
• Kingdom of Cambodia (2015), Cambodia’s Intended Nationally Determined Contribution. AccessedFrom: http://www4.unfccc.int/submissions/INDC/Published%20Documents/Cambodia/1/Cam-bodia's%20INDC%20to%20the%20UNFCCC.pdf
• Kirby A. (2001), “US blow to Kyoto hopes”, BBC News, 28 March 2001. Accessed From:
http://news.bbc.co.uk/2/hi/science/nature/1247518.stm
• Kreft, Sonke et al. (2016), Briefing Paper Global Climate Risk Index 2016. Accessed from:
https://germanwatch.org/fr/download/13503.pdf
• Lao PDR, Ministry of Natural Resources and Environment (2015), Intended Nationally DeterminedContribution. Accessed From: http://www4.unfccc.int/submissions/INDC/Published%20Docu-ments/Lao PDR/1/Lao%20PDR%20INDC.pdf
• Lao PDR, Ministry of National Resources and Environment (2013), Second National Communicationon Climate Change of Lao PDR. Accessed From: http://www.la.undp.org/content/dam/laopdr/docs/Reports%20and%20publications/2013/SNC_Eng.pdf
• Lao PDR, Ministry of National Resources and Environment (2012), National Rio+20 Report for LaoPDR. Accessed From: http://sustainabledevelopment.un.org/content/documents/1017laonation-alreport.pdf
• Lao PDR (2011), Renewable Energy Development Strategy in Lao PDR. Accessed From:http://www.eepmekong.org/index.php/resources/country-reports/Lao PDR/57-Lao PDR-06/file
• Lao PDR (2010), Strategy on Climate Change of the Lao PDR. Accessed From: http://www.forest-carbonasia.org/wp-content/uploads/2011/10/1.-Strategy-on-Climate-Change-of-the-Lao-PDR.doc
• Lao PDR (2009), National Adaptation Programmes of Action to Climate Change. Accessed From:https://unfccc.int/adaptation/workstreams/national_adaptation_programmes_of_action/items/4585.php
• Least Developed Countries Submission by the Nepal on behalf of the Least Developed CountriesGroup (2014), Views and proposals on the work of the Ad Hoc Working Group on the Durban Platformfor Enhanced Action (ADP). Accessed From:
https://unfccc.int/files/bodies/awg/application/pdf/submission_by_nepal_on_behalf_of_ldc_group_on_views_and_proposals_on_the_work_of_the_adp.pdf
• Letchumanan, R. (2010), Is there an ASEAN policy on climate change?
Accessed From: http://www.lse.ac.uk/IDEAS/publications/reports/pdf/SR004/ASEC.pdf
• Like Minded Developing Countries on Climate Change (2013), Implementation of all the elementsof decision 1/CP.17, (a) Matters related to paragraphs 2 to 6; Ad-Hoc Working Group on the DurbanPlatform for Enhanced Action (ADP) .Submission by the Like-Minded Developing Countries on ClimateChange (LMDC). Accessed From: https://unfccc.int/files/documentation/submissions_from_par-ties/adp/application/pdf/adp_lmdc_workstream_1_20130313.pdf
• London School of Economics (2015), Climate Change Legislation in Indonesia: An Excerpt From The2015 Global Climate Legislation Study A Review of Climate Change Legislation in 99 Countries. Accessed From:
http://www.lse.ac.uk/GranthamInstitute/wp-content/uploads/2015/05/INDONESIA.pdf

127
• London School of Economics (2015), Climate Change Legislation in Malaysia. Accessed From:http://www.lse.ac.uk/GranthamInstitute/wp-content/uploads/2015/05/MALAYSIA.pdf
• Malaysia, Ministry of Natural Resources and Environment (2011), Second National Communicationto the UNFCCC.Accessed From: http://www.nre.gov.my/Malay/Alam-Sekitar/Documents/Penerbi-tan/SECOND%20NATIONAL%20COMMUNICATION%20TO%20THE%20UNFCCC%20(NC2).pdf
• Mansell, A. (2015), Addressing Finance in a 2015 Climate Agreement. Accessed From:http://www.c2es.org/docUploads/finance-brief-06-2015.pdf
• McSweeney, C., New, M., Lizcano, G. & Lu, X. (2010), The UNDP Climate Change Country ProfilesImproving the Accessibility of Observed and Projected Climate Information for Studies of ClimateChange in Developing Countries. Bulletin of the American Meteorological Society, 91, 157-166.
• McSweeney, C., New, M. &Lizcano, G. (2010), UNDP Climate Change Country Profiles: Cambodia.Accessed From:
http://www.geog.ox.ac.uk/research/climate/projects/undp-cp/UNDP_reports/Cambodia/Cambo-dia.lowres.report.pdf
• McSweeney, C., New, M. &Lizcano, G. (2010), UNDP Climate Change Country Profiles: Indonesia.Accessed From: http://www.geog.ox.ac.uk/research/climate/projects/undp-cp/UNDP_reports/In-donesia/Indonesia.hires.report.pdf
• McSweeney, C., New, M. &Lizcano, G. (2010), UNDP Climate Change Country Profiles: Vietnam. Accessed From: http://www.geog.ox.ac.uk/research/climate/projects/undp-cp/UNDP_reports/Viet-nam/Vietnam.lowres.report.pdf
• Meteorological Service Singapore and Met Office Hadley Centre (2014), A Regional Climate ModelingExperiment for Southeast Asia. Accessed From: http://ccrs.weather.gov.sg/wp-content/uploads/2015/03/Regional-Climate-Modelling-Experiment-for-Southeast-Asia.pdf
• Ministry of Finance, Government of India (2015), Climate Change Finance, Analysis of a RecentOECD Report: Some Credible Facts Needed. Accessed From:
http://finmin.nic.in/the_ministry/dept_eco_affairs/economic_div/ClimateChangeOEFDReport.pdf
• Morel, R. &Shishlov, I. (2014), Ex-Post Evaluation of the Kyoto Protocol: Four key lessons for the2015 Paris Agreement. Accessed From: http://www.cdcclimat.com/IMG/pdf/14-05_climate_re-port_no44_-_analysis_of_the_kp-2.pdf
• National Geographic (2014), West Antarctica Glaciers Collapsing, Adding to Sea-Level Rise.AccessedFrom: http://news.nationalgeographic.com/news/2014/05/140512-thwaites-glacier-melting-col-lapse-west-antarctica-ice-warming/?utm_source=Facebook&utm_medium=Social&utm_content=link_fb20140512news-glacmelt&utm_campaign=Content
• Noordwijk, M. (2010), Climate Change, Biodiversity, Livelihoods, and Sustainability in SoutheastAsia. In: Moving Forward: Southeast Asia Perspectives on Climate Change and Biodiversity [Sajise,P.E., M.V. Ticsay, and G.C. Saguigut (eds.)], p. 25.
• Northrop E. and Krnjaic M. (2016), After COP21: 7 Key Tasks to Implement the Paris Agreement. Accessed From: http://www.wri.org/blog/2016/03/after-cop21-7-key-tasks-implement-paris-agree-ment
• Pearce, R. (2014), ‘Infographic: Mapping country alliances at the international climate talks’, 10 December 2014, Carbon Brief. Accessed From: http://www.carbonbrief.org/infographic-mapping-country-alliances-at-the-international-climate-talks
• Royal Norwegian Embassy in Jakarta (2016), Indonesia and Norway Collaboration for Peatland Pro-tection and Restoration, 4 February 2016. Accessed From: http://www.norway.or.id/Norway_in_In-donesia/Environment/Indonesia-and-Norway-Collaboration-for-Peatland-Protection-and-Restoration/#.Vx44T4TlHF8http://en.tempo.co/read/news/2016/01/29/206740444/Establishment-of-In-donesias-Peatland-Restoration-Agency-Lauded

128
• OECD (2015), Climate Finance in 2013-14 and the USD 100 Billion Goal. Accessed From: http://cli-matepolicyinitiative.org/publication/climate-finance-in-2013-14-and-the-usd-100-billion-goal/
• Office of the President of the Philippines-Climate Change Commission (2012), National FrameworkStrategy on Climate Change 2010-2022. Accessed From: http://www.neda.gov.ph/wp-content/up-loads/2013/10/nfscc_sgd.pdf
• Official website of the ASEAN Co-operation on Environment (2014), Accessed From: http://environ-ment.asean.org
• Official website of the ASIA Leds Partnership (2014), Accessed From: http://asialeds.org
• Official website of the United Nations Framework Convention on Climate Change (UNFCCC) (2014).Accessed From: http://unfccc.int/2860.php
• Overseas Development Institute (2013), Understanding the effectiveness of international climatefunds: synthesis note. Accessed Fro6m: http://www.odi.org/sites/odi.org.uk/files/odi-assets/pub-lications-opinion-files/8900.pdf
• The REDD Desk (2016), Redd in Lao PDR. Accessed from: http://theredddesk.org/countries/LaoPDR Republic of Indonesia (2015) First Biennial Update Report (BUR) Under the United NationsFramework Convention on Climate Change. Accessed From:
http://unfccc.int/resource/docs/natc/idnbur1.pdf
• Republic of Indonesia (2009), Indonesia Climate Change Sectoral Roadmap.
Accessed From: http://climatechange-asiapac.com/resource/indonesia-climate-change-sectoral-roadmap
• Republic of Indonesia (2015), Intended Nationally Determined Contribution. Accessed From:http://www4.unfccc.int/submissions/INDC/Published%20Documents/Indonesia/1/INDC_REPUB-LIC%20OF%20INDONESIA.pdf
• Republic of Indonesia, Ministry of Environment (2010), Indonesia Second National Communicationunder the UNFCCC. Accessed From: http://unfccc.int/files/national_reports/non-annex_i_natcom/submitted_natcom/application/pdf/indonesia_snc.pdf
• Republic of Indonesia, Ministry of National Development Planning (BAPPENAS) and DeutscheGesellschaftfurInternationaleZusammenarbeit (GIZ) GmbH (N.D) Development of the IndonesianNAMA’s Framework. Accessed From: http://mitigationpartnership.net/sites/default/files/indone-sian-nama-framework-development-full-report.pdf
• Republic of Indonesia (2013), National Action Plan for Climate Change Adaptation. Accessed From:https://gc21.giz.de/ibt/var/app/wp342deP/1443/wp-content/uploads/filebase/programme-info/RAN-API_Synthesis_Report_2013.pdf
• Republic of Indonesia (2007), National Action Plan on Addressing Climate Change.
Accessed From: http://www.project-catalyst.info/images/publications/indonesia_national.pdf
• Republic of Indonesia (2015), National Medium Term Development Plan 2015-2019 (RPJMN 2015-2019). Accessed From: http://www.lse.ac.uk/GranthamInstitute/law/national-medium-term-devel-opment-plan-2015-2019-rpjmn-2015-2019/
• Republic of the Philippines (2015), Intended Nationally Determined Contributions - Communicatedto the UNFCCC on October 2015. Accessed From: http://www4.unfccc.int/submissions/INDC/Pub-lished%20Documents/Philippines/1/Philippines%20-%20Final%20INDC%20submission.pdf
• Republic of the Philippines (2014), Second national communication to the United Nations FrameworkConvention on Climate Change. Accessed From: http://unfccc.int/resource/docs/natc/phlnc2.pdf

129
• Republic of the Union of Myanmar (2015), Myanmar’s Intended Nationally Determined Contribution.Accessed From:
http://www4.unfccc.int/submissions/INDC/Published%20Documents/Myanmar/1/Myanmar's%20INDC.pdf
• Republic of the Union of Myanmar, Ministry of Environmental Conservation (2012), Myanmar’s InitialNational Communication under the United Nations Framework Convention on Climate Change. Accessed From: http://unfccc.int/resource/docs/natc/mmrnc1.pdf
• Republic of the Union of Myanmar, Ministry of Transport, Department of Meteorology and Hydrology(2012), Myanmar’s National Adaptation Programme of Action (NAPA) to Climate Change (2012). Accessed From: http://unfccc.int/resource/docs/napa/mmr01.pdf
• Royal Government of Cambodia (2009), National Development Plan update for 2009-2013. Ac-cessed From:
http://www.gafspfund.org/sites/gafspfund.org/files/Documents/Cambodia_6_of_16_ STRAT-EGY_National_Strategic_%20Development_Plan.NSDP__0.pdf
• Royal Government of Cambodia (2013), Cambodia Climate Change Strategic Plan 2014-2023
• Royal Government of Cambodia (2008), Rectangular Strategy for Growth, Employment, Equity andEfficiency.Accessed From:
http://theredddesk.org/sites/default/files/rectangular_strategy_for_growth_employment_equity_and_efficiency_phase_ii_cambodia_2.pdf
• Royal Government of Cambodia (2006), National Adaptation Programme of Action on ClimateChange. Accessed From: http://unfccc.int/resource/docs/napa/khm01.pdf
• Royal Government of Cambodia, Ministry of Environment (2016), Climate Change Action Plan 2016– 2018. Accessed From:
http://sustinatgreen.com/uploads/274b175e996110994c946304d59dcbf62d0732e1.pdf
• Sahraie, M. (2011), The ASEAN Actions on Climate Change: Recognizing or pro-actively addressingthe issue in Sustainable Development Law on Climate Change Working Series.
Accessed From: http://cisdl.org/public/docs/news/5._Melodie_Sahraie_2.pdf
• Schiermeir, Q. (2012), “The Kyoto Protocol: Hot Air”, Nature, Vol 491, pp. 656-658, issue 7426, 28Nov 2012. Accessed From: http://www.ncbi.nlm.nih.gov/pubmed/23192127
• Secretariat of the Pacific Regional Environment Programme (2013), Multilateral EnvironmentalAgreement Negotiator's Handbook for the Pacific Region.
Accessed From:http://www.sprep.org/attachments/Publications/EMG/MEA_Handbook_2013.pdf
• Senate of the Republic of the Philippines (2007), Climate Change Report
Accessed From: http://www.senate.gov.ph/publications/AAG%202013-03%20GHG%20emission.pdf
• Singapore Ministry of Foreign Affairs (2010), Nationally Appropriate Mitigation Actions. AccessedFrom: http://unfccc.int/files/meetings/cop_15/copenhagen_accord/application/pdf/singaporecphac-cord.pdf
• Singapore Ministry of the Environment and Water Resources (2006), The Singapore Green Plan2012. Accessed From:http://www.uncsd2012.org/content/documents/The%20Singapore%20Green%20Plan%202012.pdf

130
• Singapore National Climate Change Secretariat (2016), Climate Action Plan: Take Action Today, fora Sustainable Future.Accessed From: https://www.nccs.gov.sg/sites/nccs/files/NCCS_Mitigation_FA_webview%2027-06-16.pdf
• Singapore National Climate Change Secretariat (2016b), A Climate-Resilient Singapore for a Sus-tainable Future. Accessed From: https://www.nccs.gov.sg/sites/nccs/files/NCCS_Adaptation_FA_webview%2027-06-16.pdf
• Singapore National Climate Change Secretariat (2015), Singapore’s Intended Nationally DeterminedContribution (INDC) and Accompanying Information. Accessed From: http://www4.unfccc.int/sub-missions/INDC/Published%20Documents/Singapore/1/Singapore%20INDC.pdf
• Singapore National Climate Change Secretariat (2012), National Climate Change Strategy.
Accessed From: http://app-stg.nccs.gov.sg/data/resources/docs/Documents/NCCS-2012.pdf
• Singapore National Environment Agency (2010), Singapore’s Second National Communication underthe UNFCCC. Accessed From: http://unfccc.int/files/national_reports/non-annex_i_natcom/sub-mitted_natcom/application/pdf/singapore_snc.pdf
• Singapore National Environment Agency (2014), Singapore’s 3rd National Communications and1st Biennial Update Report. Accessed From: https://www.nccs.gov.sg/sites/nccs/files/NCBUR2014_1.pdf
• Singapore National Research Foundation (2016), Singapore’s Energy Technology Roadmaps. Ac-cessed From: http://www.nrf.gov.sg/about-nrf/programmes/national-innovation-challenges/en-ergy-technology-roadmaps
• Socialist Republic of Viet Nam (2011), National Strategy on Climate Change. Accessed From:http://chinhphu.vn/portal/page/portal/English/strategies/strategiesdetails?categoryId=30&arti-cleId=10051283
• Socialist Republic of Viet Nam Ministry of Natural Resources and Environment (2016), Introductionto Sectoral Baseline Setting in the Context of NDCs: Perspective of Vietnam
• Technical workshop on Scaled-up crediting approaches, The Implications of the Paris Agreementfor a New Generation of International Market Mechanisms. Accessed From: https://www.thepmr.org/system/files/documents/Vietnam-%20Introduction%20to%20Sec-toral%20Baseline%20Setting%20in%20the%20Context%20of%20NDC.pdf
• Socialist Republic of Viet Nam Ministry of Natural Resources and Environment (2015), IntendedNationally Determined Contribution of Viet Nam. Accessed From: http://www4.unfccc.int/submissions/INDC/Published%20Documents/Viet%20Nam/1/VIET-NAM'S%20INDC.pdf
• Socialist Republic of Viet Nam Ministry of Natural Resources and Environment (2014), The InitialBiennial Update Report of Viet Nam to the United Nations Framework Convention on Climate Change.Accessed From: http://unfccc.int/resource/docs/natc/vnmbur1.pdf
• Southeast Asia Network of Climate Change Offices (2016), ASEAN Climate Change Action Database(ACCAD). Accessed From: http://accad.sean-cc.org
• Southeast Asia Network of Climate Change Offices (2014), ASEAN Climate Change Action Database(ACCAD). URL: http://accad.sean-cc.org
• Strategy on Climate Change of the Lao People’s Democratic Republic (2010). Accessed From:http://www.la.undp.org/content/dam/laopdr/docs/Reports%20and%20publications/UNDP_LA_National_Strategy%20on%20Climate%20Change_Lao%20PDR_2010.pdf
• Sustainable Energy Development Authority Portal (2011), Sustainable Energy Development AuthorityAct 2011. Accessed From: www.seda.gov.my/overview_of_seda.html

131
• Thailand Greenhouse Management Organization (2014), Thailand’s Overview of National Policies,Laws and Arrangements on Climate Change. Accessed From:http://conference.tgo.or.th/download/tgo_or_th/seminar/presentation/2014/Mar/2728/01_TH_Overview_27_March_2014.pdf
• Thailand Ministry of Natural Resources and Environment (2011), Second National Communicationto the UNFCCC. Accessed From: http://unfccc.int/resource/docs/natc/thainc2.pdf
• Thailand National Science Technology and Innovation Policy Office (2012), Technology Needs Assessment Report for Climate Change. Accessed From: http://unfccc.int/ttclear/sunsetcms/stor-age/contents/stored-file-20130327165947778/TechnologyNeedsAssessment-Mitigation_Thai-land.pdf
• Thailand Office of Natural Resources and Environmental Policy and Planning (2015), Thailand’s Intended Nationally Determined Contribution (INDC). Accessed From: http://www4.unfccc.int/sub-missions/INDC/Published%20Documents/Thailand/1/Thailand_INDC.pdf
• Thailand Office of Natural Resources and Environmental Policy and Planning (2015b), Thailand’sFirst Biennial Update Report under the United Nations Framework Convention on Climate Change.Accessed From: http://unfccc.int/resource/docs/natc/thabur1.pdf
• The Washington Post (2015), “With the Paris climate pact, critics now have no basis to say action ispointless”, December 12. Accessed From: https://www.washingtonpost.com/opinions/with-the-paris-climate-pact-critics-now-have-no-basis-to-say-action-is-pointless/2015/12/12/bd190e7c-a107-11e5-a3c5-c77f2cc5a43c_story.html
• The World Bank (2016), Partnership for Market Readiness Portal – Indonesia
Accessed From: https://www.thepmr.org/country/indonesia-0
• Townshend, T. (2014), Asia-Pacific leading the world on carbon emissions trading in the JakartaPost.Accessed From: http://www.thejakartapost.com/news/2014/01/13/asia-pacific-leading-world-carbon-emissions-trading.html
• Trevisan, J. (2013), The common framework for climate policy in South-East Asia, ICCG ReflectionNo. 13/2013, International Center for Climate Governance, January 2013.Accessed From:http://www.iccgov.org/wp-content/uploads/2015/05/13_Reflection_January_2013.pdf
• UNDP Cambodia (2014), Cambodia Climate Change Alliance Accessed From:http://www.kh.undp.org/content/cambodia/en/home/operations/projects/environment_and_energy/cambodia-climate-change-alliance/
• UNEP (2015), The Emissions Gap Report 2015. Accessed From:http://uneplive.org/media/docs/theme/13/EGR_2015_Technical_Report_final_version.pdf
• UNEP (2012), Building a Green Economy in the Heart of Borneo: South-South Cooperation betweenBrunei Darussalam, Indonesia and Malaysia. Accessed From: http://unep.org/french/south-south-cooperation/case/casefiles.aspx?csno=69
• UNEP (2009), Guide for Negotiators of Multilateral Environmental Agreements MEA.Accessed From:https://www.cbd.int/doc/guidelines/MEAs-negotiators-guide-en.pdf
• UNEP DTU (2016), CDM Pipeline. Accessed From: http://www.cdmpipeline.org/cers.htm
• UNEP-Risoe Center (2013), Emissions Reduction Profile: Myanmar. Accessed From: http://www.acp-cd4cdm.org/media/363090/emissions-reduction-profile-myanmar.pdf
• UNFCCC (2014b), GHG emission profiles for non-Annex I Parties.
Accessed From: https://unfccc.int/ghg_data/ghg_data_unfccc/ghg_profiles/items/4626.php
• UNFCCC (2014c), National Adaptation Programmes of Action received by the secretariat. Ac-cessed From:

132
https://unfccc.int/adaptation/workstreams/national_adaptation_programmes_of_action/items/4585.php
• UNFCCC (2016), Decision 1/CP.21, Adoption of the Paris Agreement, UN Doc. FCCC/CP/2015/10/Add.1,29 January 2016. Accessed From:http://unfccc.int/resource/docs/2015/cop21/eng/10a01.pdf
• UNFCCC (2016b), Background on the UNFCCC: The international response to climate change. Accessed From: http://unfccc.int/essential_background/convention/items/6036.php
• UNFCCC (2016c), Kyoto Protocol to the United Nations Framework Convention on Climate Change.Accessed From: http://unfccc.int/essential_background/kyoto_protocol/items/1678.php
• UNFCCC (2016d), Status of the Doha Amendment. Accessed From: http://unfccc.int/kyoto_proto-col/doha_amendment/items/7362.php
• UNFCCC (2016e), About the Standing Committee on Finance. Accessed From: http://unfccc.int/co-operation_and_support/financial_mechanism/standing_committee/items/6878.php
• UNFCCC (2016f), The Doha Climate Gateway. Accessed From: http://unfccc.int/key_steps/doha_cli-mate_gateway/items/7389.php
• UNFCCC (2016g), Progress tracker: Work programme resulting from the relevant requests containedin decision 1/CP.21, 18 July 2016. Accessed From: http://unfccc.int/files/paris_agreement/appli-cation/pdf/progress_tracker_180716_1530.pdf
• UNFCCC (2015), Work of the Contact Group on Item 3: Negotiating text, Advance unedited version12 February 2015. Accessed From: https://unfccc.int/files/bodies/awg/application/pdf/[email protected]
• UNFCCC (2015b), Draft agreement and draft decision on workstreams 1 and 2 of the Ad Hoc WorkingGroup on the Durban Platform for Enhanced Action, Work of the ADP contact group. Edited versionof 6 November 2015, UN Doc. ADP.2015.11.InformalNote. Accessed From: http://unfccc.int/re-source/docs/2015/adp2/eng/11infnot.pdf
• UNFCCC (2014), Decision 1/CP.20, Lima Call for Climate Action, UN Doc. FCCC/CP/2014/10. Add.1.Accessed From: http://unfccc.int/resource/docs/2014/cop20/eng/10a01.pdf
• UNFCCC (2014b), UNFCCC Country Brief 2014: Brunei Darussalam. Accessed From: http://news-room.unfccc.int/media/518179/country-brief-brunei.pdf
• UNFCCC (2014d), Non-Annex I National Communications.
Accessed From: http://unfccc.int/national_reports/non-annex_i_natcom/items/2979.php
• UNFCCC (2010), Decision 1/CP.16, The Cancun Agreements: Outcome of the work of the Ad HocWorking Group on Long-term Cooperative Action under the Convention, UN Doc. FCCC/CP/2010/7/Add.1, 15 March 2011.Accessed From:http://unfccc.int/resource/docs/2010/cop16/eng/07a01.pdf
• UNFCCC (1998), Report of the Conference of the Parties on its Third Session, Kyoto, 1 to 11 December 1997, UN Doc. FCCC/CP/1997/7.Accessed From:https://unfccc.int/resource/docs/cop3/07a01.pdf
• UNFCCC (1996), Implementation of the Berlin Mandate: Comments from Parties, Note from the Sec-retariat, Addendum, Ad Hoc Group on the Berlin Mandate at its Fourth Session, Geneva, 9-19 July1996, UN Doc. FCCC/AGBM/1995/MISC.1/Add.2. Accessed From: http://unfccc.int/cop3/re-source/docs/1996/agbm/misc01a2.htm
• UNFCCC Standing Committee on Finance (2014), Synthesis report on the aggregate effect of theintended nationally determined contributions. AccessedFrom:http://unfccc.int/resource/docs/2015/cop21/eng/07.pdf
• United Nations (1992), United Nations Framework Convention on Climate Change UN Doc.

133
FCCC/INFORMAL/84/Rev.1, 9 May 1992. Accessed From: http://unfccc.int/files/essential_back-ground/background_publications_htmlpdf/application/pdf/conveng.pdf
• United Nations Statistics Division (UNSD) of the Department of Economic and Social Affairs (DESA)(2014), UN Data. Accessed From: http://data.un.orgViet Nam Ministry of
• Viet Nam, Ministry of Natural Resources and Environment (2015), Intended Nationally DeterminedContribution of Viet Nam. Accessed from: http://www4.unfccc.int/submissions/INDC/Pub-lished%20Documents/Viet%20Nam/1/VIETNAM'S%20INDC.pdf
• Vietnam News (2015),"PM approves plan for $3.6m carbon market". Accessed From: http://vietnamnews.vn/environment/277707/pm-approves-plan-for-36m-carbon-market.html#xdxZpbfgDxsZmYHQ.97
• Widerberg O. and Stenson D. (2013), Climate Clubs and the UNFCCC. Accessed From: http://fores.se/wp/wp-content/uploads/2013/11/ClimateClubsAndTheUNFCCC-FORES-Study-2013-3.pdf
• Wigley, T.M.L. (1998), The Kyoto Protocol: CO2, CH4 and climate implications, Geophysical Re-search Letters, vol. 25, pp. 2285–88. Accessed From: http://onlinelibrary.wiley.com/doi/10.1029/98GL01855/full
• Woodard, A. (2015), Special Edition - Summary of the detail and analysis of Paris COP 21 climatechange agreement. Accessed From: https://www.linkedin.com/pulse/special-edition-summary-de-tail-analysis-paris-cop-21-andrew-woodward
• World Bank (2016), World Development Indicators Accessed From:http://databank.worldbank.org/data/download/WDI_excel.zip
• World Bank (2016b), Partnership for Market Readiness Portal – Vietnam
Accessed From: https://www.thepmr.org/country/vietnam-0
• World Bank (2016c)) Partnership for Market Readiness Portal - Indonesia Accessed From:https://www.thepmr.org/country/indonesia-0
• World Bank (2014) Open Database Accessed From: http://data.worldbank.org
• World Bank (2011), Climate-Resilient Development in Vietnam Strategic Directions from the WorldBank. Accessed From: http://siteresources.worldbank.org/INTVIETNAM/Resources/CCStrategyVN-Final-Eng.pdf
• World Bank (2011), The Little Data Book on Climate Change. Accessed From: http://data.world-bank.org/sites/default/files/the-little-data-book-on-climate-change-2011.pdf
• World Bank (2010), Indonesia: Climate Change (Washington, DC: The World Bank,Online resource).Accessed From: http://go.worldbank.org/HQQFW5MV70
• World Resource Institute (2016), CAIT 2.0 Climate Data Explorer. Accessed From: http://cait.wri.org/
• Wuppertal Institute for Climate, Environment and Energy (2016), Phoenix from the Ashes – An Analy-sis of the Paris Agreement to the United Nations Framework Convention on Climate Change. Accessed From: http://wupperinst.org/fa/redaktion/downloads/publications/Paris_Results.pdf
• Yuen, B. and Kong, L. (2009) Climate Change and Urban Planning in Southeast Asia, S.A.P.I.EN.SOnline, Vol. 2, No. 3. Accessed From: https://sapiens.revues.org/pdf/881
• Yusuf A. and Francisco, H. (2009), Climate Change Vulnerability Mapping for Southeast Asia Accessed From: https://www.idrc.ca/sites/default/files/sp/Documents%20EN/climate-change-vul-nerability-mapping-sa.pdf

134
The Asia-Europe Foundation (ASEF) promotes understanding, strengthens relationships and facilitates cooperation among the people, institutions and organisations of Asia and Europe. ASEF enhances dialogue, enables exchanges andencourages collaboration across the thematic areas of culture, economy, education,governance, public health and sustainable development.
ASEF is an intergovernmental not-for-profit organisation located in Singapore.Founded in 1997, it is the only institution of the Asia-Europe Meeting (ASEM).
Together with about 750 partner organisations ASEF has run more than 700 projects, mainly conferences, seminars and workshops. Over 20,000 Asians andEuropeans have actively participated in its activities and it has reached much wideraudiences through its networks, web-portals, publications, exhibitions and lectures.
For more information, please visit www.asef.org
ASEM SMEs Eco-Innovation Center (ASEIC) was established in 2011 with the principal mandate of promoting Asia-Europe cooperation to create and enhance eco-innovation of small and medium sized enterprises (SMEs) in both regions. Having agreed upon the importance of SMEs as main engine of innovation and growth, ASEM member countries have joined together to createASEIC as international platform where growing environmental regulations and eco-innovative technologies are shared and new business opportunities are created, and ultimately implementing the vision of green growth around the globe.
For more information, please visit: www.aseic.org
The Hanns Seidel Foundation (HSF) is an official German Political Foundation. It isentrusted by the German Parliament with a mandate, which lies at the core of thetask of promoting democratic and sustainable structures worldwide. This mandateinvolves the strengthening of the relevant institutions and persons, procedures andnorms and the requisite attitudes enabling such development to take place. HSF isrepresented with project offices in more than 60 countries, conducting more than100 projects globally.
For more information, please visit www.hss.de or www.hss.de/southeastasia
Established in 1998, the Institute for Global Environmental Strategies (IGES) is anindependent, not-for-profit think tank, based in Japan. It goes beyond research toprovide practical ways to protect the earth's environment and to realise greater sustainability and equity in the global community. While the outlook of IGES isglobal, the principal geographical scope of its activities is Asia and the Pacific region, an area which is experiencing rapid economic development and which willaffect the global environment through its population growth, urban environmentalproblems and other environmental issues.
For more information, please visit www.iges.or.jp
This publication is co-funded by the European Union.
This publication was supported by the Government of Sweden through the Regional Asia Environment Conference Support Programme administered by Stock-holm Environment Institute (SEI).

This project is co-funded by the European Union
Paper comes from sustainable sources
PUBLISHED BY
HANNS SEIDEL FOUNDATION VIETNAM
UNIT 703, OPERA BUSINESS CENTER
60 LY THAI TO, HANOI, VIETNAM