hancock county flood diversion - ohio water … · steve wilson, pe, ps ... project review gap...
TRANSCRIPT

Hancock County Flood Diversion
November 10, 2016

Introductions
Steve Wilson, PE, PS
Project Manager
Maumee Watershed Conservancy District
Scott Peyton, PE
Project Manager
Stantec

Outline Project Background
Project Status
Project Future
Discussion

Project BackgroundFindlay
August 2007

Blanchard River
Flood Stage

Key River and
Stream Reaches
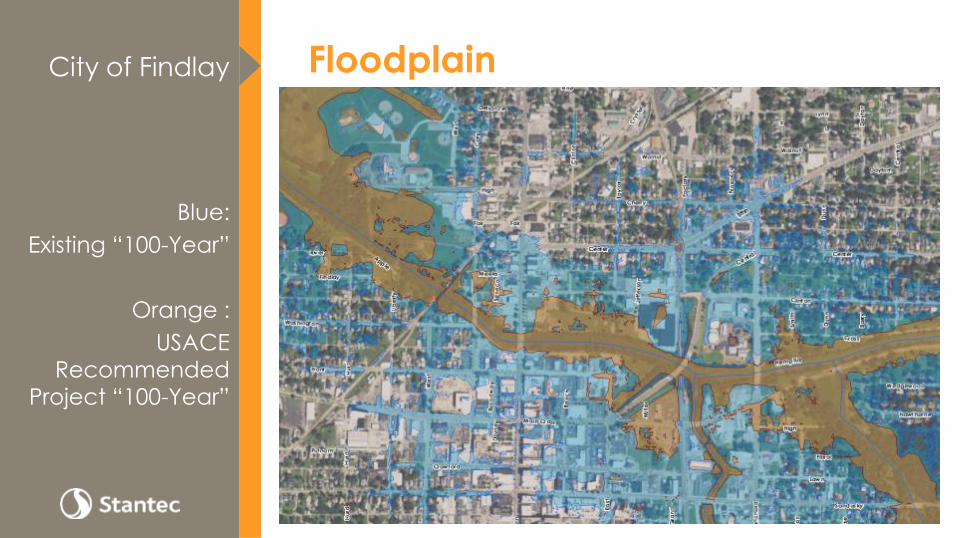
Floodplain
• Need zoomed in figure in town
City of Findlay
Blue:
Existing “100-Year”
Orange :
USACE Recommended
Project “100-Year”

100-yr Hypothetical and
2007 Calibrated HydrographWe’re active members of the communities we serve. That’s why at Stantec, we always design with community in mind.
Insert
Hydrographs

Viable Array of Plans – Findlay

Viable Array of Plans - Ottawa
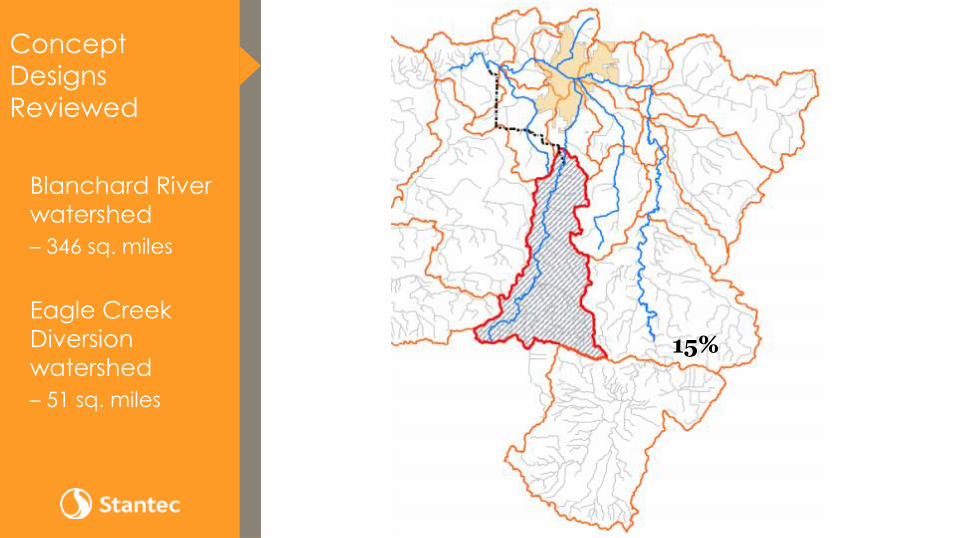
Concept
Designs
Reviewed
Blanchard River
watershed
– 346 sq. miles
Eagle Creek
Diversion
watershed
– 51 sq. miles
15%
Scope
• Gap Analysis
• Proof of Concept
• Field surveys and geotechnical explorations
• Preferred channel alignment
• Final design and construction plans
• Regulatory permitting
Current Work

Project Review
Gap Analysis
Data Reviewed
• Reports
• Files on USACE
External Hard Drive
• Public Data (USGS,
ODOT, etc.)
Project Components
• H&H
• Base Map Data
• Geotechnical
• Transportation
• Cost
• Economics
• Design
• Environmental
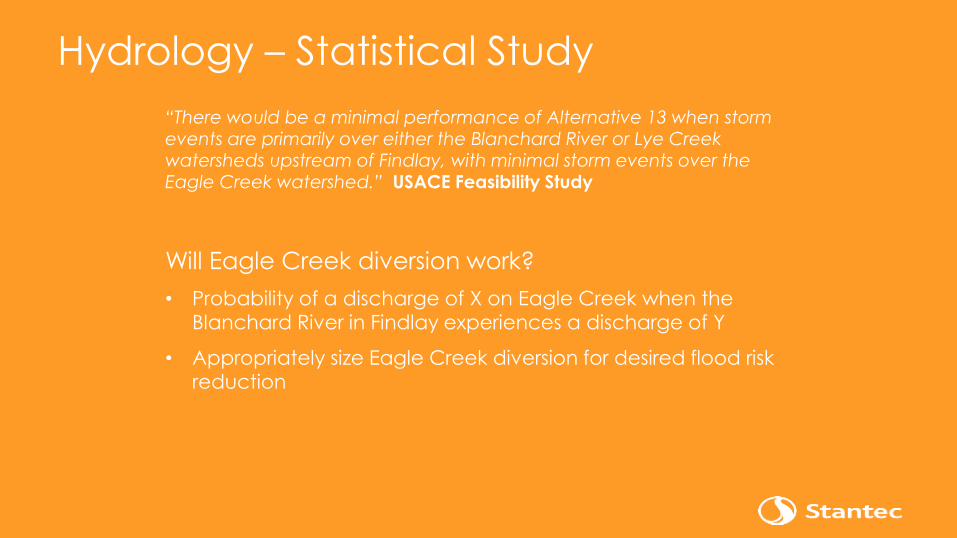
Hydrology – Statistical Study
“There would be a minimal performance of Alternative 13 when storm events are primarily over either the Blanchard River or Lye Creek watersheds upstream of Findlay, with minimal storm events over the Eagle Creek watershed.” USACE Feasibility Study
Will Eagle Creek diversion work?
• Probability of a discharge of X on Eagle Creek when the
Blanchard River in Findlay experiences a discharge of Y
• Appropriately size Eagle Creek diversion for desired flood risk
reduction

Hydrology – Statistical Study
Site Specific DataTemporal Pattern:
• Analysis of actual historic storm data
• SCS Type II -vs- Huff -vs- NOAA Atlas 14 -vs- local data
Storm Sizes:
• Defining “Small”, “Medium”, “Large” storms
Spatial Distribution:
• Actual storm data
Probability:
• Supports Monte Carlo Analyses

Hydrology – Statistical Study
Multi-variate analyses:Return Periods:
• 2-, 5-, 10-, 25-, 50-, 100-, 200-, and 500-year hypothetical storm events
Durations:
• 1-, 3-, 6-, 12-, 24-, 48-hour events
Temporal + Storm Size + Spatial Distribution:
• AWA + NOAA Atlas 14 temporal distribution
Storm Centering
• Multiple centers (at least 4)
Monte Carlo Simulation
• Risk Profile Development

Options ConsideredProject
Refinements
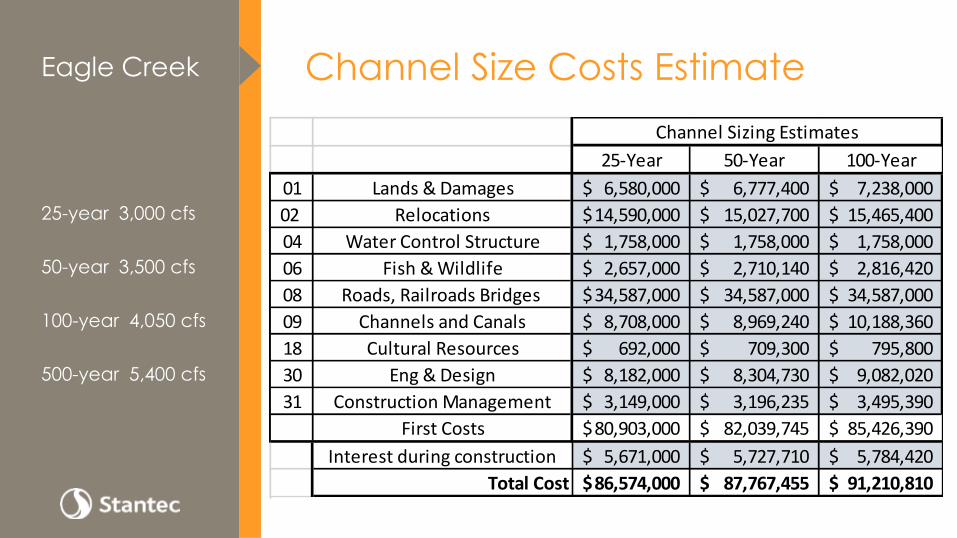
25-Year 50-Year 100-Year
01 Lands & Damages 6,580,000$ 6,777,400$ 7,238,000$
02 Relocations 14,590,000$ 15,027,700$ 15,465,400$
04 Water Control Structure 1,758,000$ 1,758,000$ 1,758,000$
06 Fish & Wildlife 2,657,000$ 2,710,140$ 2,816,420$
08 Roads, Railroads Bridges 34,587,000$ 34,587,000$ 34,587,000$
09 Channels and Canals 8,708,000$ 8,969,240$ 10,188,360$
18 Cultural Resources 692,000$ 709,300$ 795,800$
30 Eng & Design 8,182,000$ 8,304,730$ 9,082,020$
31 Construction Management 3,149,000$ 3,196,235$ 3,495,390$
First Costs 80,903,000$ 82,039,745$ 85,426,390$
Interest during construction 5,671,000$ 5,727,710$ 5,784,420$
Total Cost 86,574,000$ 87,767,455$ 91,210,810$
Channel Sizing Estimates
Channel Size Costs EstimateEagle Creek
25-year 3,000 cfs
50-year 3,500 cfs
100-year 4,050 cfs
500-year 5,400 cfs

Flow Table – Blanchard River
Event Flow (cfs) WSE WSE Δ from 100-Year Depth
500-Year 18,178 778.52 1.67 21.02
250-Year 15,770 777.80 0.95 20.3
100-Year 13,355 776.85 0 19.35
minus 1,000 cfs 12,355 776.23 -0.62 18.73
50-Year 11,550 775.78 -1.07 18.28
minus 2,000 cfs 11,355 775.67 -1.18 18.17
minus 3,000 cfs 10,355 775.03 -1.82 17.53
25-Year 9,848 774.64 -2.21 17.14
minus 4,000 cfs 9,355 774.16 -2.69 16.66
minus 5,000 cfs 8,355 773.53 -3.32 16.03
10-Year 7,495 772.71 -4.14 15.21
minus 6,000 cfs 7,355 772.65 -4.2 15.15
minus 7,000 cfs 6,355 771.62 -5.23 14.12
5-Year 5,653 770.79 -6.06 13.29
At Main Street Bridge - XS 295930

Riffle / Dam
Structures

Channel Modification

Norfolk & Southern BridgeConstrictions

• Questions
• Discussion
Closing