fargo-moorhead flood risk management project · · 2017-05-24fargo-moorhead area diversion...
TRANSCRIPT

3/13/2015
Design Documentation Report
Fargo-Moorhead Flood Risk Management Project
Reach 6 Bridge Channel
Engineering and Design Phase
Reach 6 95% ATR SUBMITTAL

Fargo-Moorhead Area Diversion Project Page i
Table of Contents Table of Contents ........................................................................................................................................... i
1 Introduction .......................................................................................................................................... 1
1.1 Project Location ............................................................................................................................ 1
1.2 Background ................................................................................................................................... 2
1.3 Project Features ............................................................................................................................ 2
1.3.1 Reach 6 .................................................................................................................................. 5
2 Design Data ........................................................................................................................................... 7
2.1 Surfaces and Survey Data.............................................................................................................. 7
2.2 Geotechnical Engineering and Geology ........................................................................................ 7
2.3 Hydrology ...................................................................................................................................... 9
2.4 Hydraulics .................................................................................................................................... 10
3 Channel Design ................................................................................................................................... 10
3.1 Diversion Channel ....................................................................................................................... 10
3.1.1 Meandering Low Flow Channel........................................................................................... 11
3.1.2 Scour Analysis at Bridges .................................................................................................... 11
3.2 Exterior Channels ........................................................................................................................ 16
3.2.1 Local Drainage Ditches ........................................................................................................ 16
3.2.2 Riprap Analysis at Culverts .................................................................................................. 16
4 Levees and Excavated Material Berms ............................................................................................... 16
5 Civil-Site............................................................................................................................................... 18
6 Structural ............................................................................................................................................ 19
6.1 Bridges ........................................................................................................................................ 20
7 Landscape and Recreational ............................................................................................................... 20
7.1 Vegetation ................................................................................................................................... 21
8 References .......................................................................................................................................... 24
Figures
Figure 1 - Fargo-Moorhead General Location ............................................................................................... 1
Figure 2 - Fargo USGS Gage Flood Event Comparison [1] ............................................................................. 2
Figure 3 - Fargo-Moorhead Metro Diversion Project ................................................................................... 4

Fargo-Moorhead Area Diversion Project Page ii
Figure 4 - USACE Map of Reach Locations .................................................................................................... 6
Figure 5 - USGS Peak Streamflow at Fargo Gage [1] ..................................................................................... 9
Figure 6 - Typical Cross-section ................................................................................................................... 13
Figure 7 - Typical Cross-section at BNSF Rail and County Road 20 Bridges with 24 foot Bench ................ 13
Figure 8 - ND Diversion Profiles .................................................................................................................. 14
Figure 9 – Riprap Layout at County Road 20 Bridge ................................................................................... 15
Figure 10 - Reach Sinuosity Coordination Detail......................................................................................... 19
Figure 11 - Artist Rendering of Reach 6 ...................................................................................................... 23
Tables
Table 1 - Results of Stability Analysis at County Road 20 Bridge .................................................................. 8
Table 2 - Results of Stability Analysis for Critical Section downstream of the BNSF Bridge ......................... 8
Table 3 - Estimated Total Embankment Settlement at Bridge Reaches ....................................................... 8
Table 4 - Estimated Total Bridge Settlements............................................................................................... 8
Table 5 – Existing Discharge-Frequency at Fargo ......................................................................................... 9
Table 6 – Shrink and Swell Factors for Excavation and Compaction .......................................................... 18
Table 7 - Bridge Geometry Summary .......................................................................................................... 20
Appendices
Appendix A Geospatial Information (not used)
Appendix B CAD Requirements (not used)
Appendix C Hydrology and Hydraulics
Appendix D Geotechnical Engineering and Geology
Appendix E Civil-Site
Appendix F Structural
Appendix G Mechanical (not used)
Appendix H Electrical (not used)
Appendix I Architectural (not used)
Appendix J Landscape and Recreational (not used)
Appendix K Environmental
Appendix L Quality Control Documentation (not used)
Appendix M MFRs and Guidance Memorandums
Appendix N Engineering Considerations (not used)

Fargo-Moorhead Area Diversion Project Page 1
Abstract
The Fargo-Moorhead Metropolitan Area Flood Risk Management Project consists of a 30-mile long
diversion channel with a 4-mile long connecting channel extending from the Red River to the diversion
inlet. The project will reduce the flood risk from the Red, Wild Rice, Sheyenne, Maple, Rush, and Lower
Rush Rivers for the cities of Fargo and Moorhead, as well as surrounding communities. This report
describes the design for bridges and associated diversion channel segments located in Reach 6 which lies
within the downstream portion of the diversion.
1 Introduction
1.1 Project Location
The cities of Fargo, located in southeast North Dakota, and Moorhead, located in northwest Minnesota,
straddle the North Dakota-Minnesota border, as shown in Figure 1. The metropolitan area is located
along the Red River and near the confluence of the Red and Sheyenne Rivers. The area encompasses
land approximately 12 miles west to five miles east of the Red River and from 20 miles north to 20 miles
south of Interstate 94. The total metropolitan area is approximately 90 square miles.
Figure 1 - Fargo-Moorhead General Location

Fargo-Moorhead Area Diversion Project Page 2
1.2 Background
The Red River Valley was once the bed of glacial Lake Agassiz and the resulting terrain is extremely flat
and prone to flooding. The National Weather Service (NWS) has designated 18 feet as the minor flood
stage at the Fargo USGS gage. This stage has been exceeded by the Red River in 49 of the past 110 years.
It was exceeded at least once per year from 1993 to 2011, and again in 2013. Figure 2 shows USGS
hydrographs from five recent flood events [1]. The Fargo-Moorhead metropolitan area is currently
provided flood risk reduction by several permanent levees as well as a series of emergency levees that
are constructed during flood events. Although the emergency flood risk reduction has been effective for
past flood events, the United States Army Corps of Engineers (USACE) has estimated that the damages
would be $194.8 million if emergency measures were to fail [2].
Figure 2 - Fargo USGS Gage Flood Event Comparison [1]
*USGS Gage height can be converted to sea level by adding 861.8 feet (NGVD 1929) or 862.74 (NAVD 1988)
According to the 2013 estimates, the populations of Fargo and Moorhead were 113,658 and 39,398
people, respectively. Fargo and Moorhead, along with the cities of West Fargo, Dilworth and several
smaller communities, make up the metropolitan area that is home to over 220,000 people. There was a
20 percent increase in population in the metropolitan area over the last decade [3].
1.3 Project Features
The project consists of constructing a diversion channel around the metropolitan area in combination
with a series of tie-back embankments and control structures that will divert a portion of the flood flows
around the cities. The Fargo-Moorhead Metropolitan Flood Risk Management Project shown in Figure 3
currently includes:

Fargo-Moorhead Area Diversion Project Page 3
1) A diversion channel with a meandering low flow channel
2) A connecting channel and embankment from the Wild Rice River to the diversion channel
3) Upstream storage and staging areas
4) A diversion inlet structure
5) An outlet structure near Georgetown, MN with a fish passage structure
6) A drop structure at the Rush River with a fish passage structure
7) Drop structures at the Lower Rush River and County Drain 14
8) Aqueduct structures at the Sheyenne and Maple Rivers
9) Control structures on the Red and Wild Rice Rivers
10) Embankments
11) Excavated Material Berms
12) Levees embedded within the right Excavated Material Berm
13) Recreational features
The project includes a connecting channel that begins at the Wild Rice River just west of Interstate 29.
The connecting channel extends west to the diversion inlet structure that is located just south of Horace,
ND at County Road 17. The diversion channel begins at the inlet structure and wraps around the cities of
Horace, West Fargo, Fargo, and Harwood, reentering the Red River near the city of Georgetown, MN.
The total length of the project is approximately 33 miles and the channel will cross the Wild Rice,
Sheyenne, Maple, Lower Rush, and Rush Rivers. Of the 33 miles of the project, Reach 6 accounts for
about half of a mile in the downstream half of the project.
Hydraulic structures will be constructed on the Red and Wild Rice Rivers that will control the flows
allowed into the flood risk reduction area during flood events. The structures on the Red River and Wild
Rice River control the flow split between the diversion channel, the staging area, and the flow through
the cities of Fargo and Moorhead. The USGS gage on the Red River at Fargo recorded a peak stream flow
of 29,500 cfs during the 2009 flood, which is approximately a 2-percent annual chance event. For a
similar 2-percent annual chance event after the project is built, approximately 20,000 cfs from the Red
and Wild Rice Rivers would be rerouted into the diversion channel with the remaining flow staying in the
river channel and passing as much as 17,000 cfs through the flood risk reduction area. Approximately
20,000 cfs will be diverted into the diversion channel for larger events such as the 2, 1, and 0.2-percent
annual chance events.
The upstream staging and storage area of approximately 149,000 acre-feet will be required in order to
ensure there are no increased water surface elevations in the Red River downstream of the project for
the 1-percent annual chance event. The total volume in the staging area is 243,000 acre-feet, which
includes the existing condition volume of 94,000 acre-feet. The staging and storage areas can be seen in
Figure 3. A tieback embankment will extend east from the Red River control structure and daylight into
existing high ground located in Minnesota.

Fargo-Moorhead Area Diversion Project Page 4
Figure 3 - Fargo-Moorhead Metro Diversion Project

Fargo-Moorhead Area Diversion Project Page 5
The Sheyenne and Maple River crossings will consist of aqueduct structures at the diversion to allow
base flows to follow their natural river channels while diversion flows pass beneath the existing tributary
waters. Flows exceeding a 50-percent annual chance event on the Sheyenne and Maple Rivers will be
diverted into the diversion channel. Flows from the Rush River, Lower Rush River and County Drain 14
enter the diversion channel through drop structures. The outlet structure near Georgetown, MN will be
a rock spillway with a low flow channel for fish passage.
Stream restoration, riparian corridor restoration, a meandering low flow channel, and a fish passageway
are required for aquatic habitat and connectivity mitigation. Fish passage will be provided at the Maple
and Sheyenne River aqueducts, the Rush River drop structure, and the diversion outlet structure. Forest
will be reestablished on 239 acres of floodplain agricultural land or pasture land. Native wetland species
will be planted at the bottom and fringe of the side slopes of the diversion channel. The wetland habitat
in the diversion channel will develop within the meandering low flow channel and associated grade
control structures.
The result of the large cut sections required for the construction of the diversion channel is excess
material beyond what is required for the construction of the levees, roadway, and rail embankments. To
minimize the cost of construction due to transporting large amounts of excavated material, the soil will
be spoiled adjacent to the channel in excavated material berms (EMBs). A levee, protecting lands
eastward from the diversion flows, will be embedded within the right (looking downstream) bank EMB.
The left (west) bank does not require a levee and will only have an EMB.
The USACE is designing the majority of the first five reaches. The Houston-Moore Group (HMG) is
designing the reach, bridges, and roadways for Reach 6. HMG is a joint venture consisting of six
consulting engineering firms. These firms are Houston Engineering, Inc., Moore Engineering, Inc.,
Kadrmas, Lee & Jackson, SRF Consulting Group, Barr Engineering Company, and HDR, Inc. These plans
will tie directly into the USACE plans for the remainder of these reaches. The Reach 6 channel segment
and bridge design included in this document is identified in Figure 4.
1.3.1 Reach 6
Reach 6 is located between Stations 656+00 and 683+00. It includes the diversion channel, County Road
20, and the Prosper Subdivision (Subd.) of the Burlington Northern Santa Fe (BNSF) railroad. HMG is
designing the diversion channel between Stations 656+00 and 683+00; County Road 20; and the Prosper
Subd. BNSF Railroad Bridge. The Prosper Subd. BNSF rail bridge design is currently in progress and
details will be provided in a future submittal.

Fargo-Moorhead Area Diversion Project Page 6
Figure 4 - USACE Map of Reach Locations

Fargo-Moorhead Area Diversion Project Page 7
2 Design Data
2.1 Surfaces and Survey Data
Aerial Light Detection and Ranging (LiDAR) data and ground surveys performed by Merrick and Company
in May 2011 were provided to HMG by the USACE and used for the existing topographic data in the
design and drawings. The coordinate system and projection of the existing condition data is North
American Datum of 1983 (NAD83) (2007), North Dakota State Plane Coordinate System, South Zone
(U.S. Survey Feet). The elevation datum for the existing condition data is North American Vertical Datum
of 1988 (NAVD88) (U.S. Survey Feet). Additional topographic surveys were conducted in March 2013, by
HMG for use in conjunction with the LiDAR data.
HMG collected utility information including existing easement documents and field surveyed locations
between December 2011 and the summer of 2012. These are summarized in Appendix E.
2.2 Geotechnical Engineering and Geology
A series of soil borings were completed for use in the geotechnical design of the bridges, diversion
channel, and embankments. Table 1 includes a summary of required and calculated factors of safety for
the channel at the County Road 20 Bridge for two types of stability analyses: the Undrained Strength
Stability analysis (USSA) and the Effective Stress Stability Analysis (ESSA). Table 2 provides a summary of
the required and calculated factors of safety for a critical cross-section downstream of the BNSF Prosper
Subd Railroad Bridge for two type of stability: the Undrained Strength Stability analysis (USSA) and the
Effective Stress Stability Analysis (ESSA). This location is the critical section because the geometry at this
location has a high EMB elevation, a smaller recreational trail bench width, and slightly steeper side
slope below the recreational trail (6H:1V versus 7H:1V). The slope stability analyses are discussed in
further detail in Appendix D for Reach 6.
The EMB and levee construction is expected to experience some settling. The top of the levee elevation
will be overbuilt above the design elevation, depending on the total estimated settlement. Barr
Engineering Company has completed a detailed settlement analysis. For purposes of the design, it is
assumed the EMB heights will be 20 feet, because the plans allow an undulating surface in the right
bank EMB, which may include “knolls” or “hills” up to 20 feet above the existing ground surface. Table 3
includes a summary of the estimated settlement of the EMBs for the design height of 20 feet. The Reach
6 estimated settlement is 15.0 inches. However, the settlement used in the Reach 5 design, was 20
inches. In order to remain consistent and avoid having a step-down in the elevation of the top of the
levee, the However, for consistency, the settlement used in design for the Reach 5 levee will be used for
the Reach 6 design.
The embankments at each end of the County Road 20 and the BNSF Prosper Subd Railroad bridges are
expected to experience some settling. The designs of the roadway and bridge approaches are designed
to account for the settlement. Braun Intertec Corporation, a subcontractor for the project, has
completed an evaluation of the proposed County Road 20 Bridge. Braun Intertec Corporation will also
complete the evaluation for the BNSF Prosper Subd. Railroad Bridge in a future submittal.

Fargo-Moorhead Area Diversion Project Page 8
Table 4 includes a summary of the estimated settlement at the ends of the bridges as well as one
embankment width away from the end of the bridges.
Table 1 - Results of Stability Analysis at County Road 20 Bridge
Failure Surface Factor of Safety
Left Bank Right Bank Required
Reach 6 Channel
Global Long-Term (ESSA) 1.49 1.59 1.40
Lower Slope Long-Term (ESSA) 1.70 1.77 1.20
Localized Long-Term (ESSA) 1.62 1.63 1.20
End-of-Construction (USSA) 1.66 1.79 1.30
Table 2 - Results of Stability Analysis for Critical Section downstream of the BNSF Bridge
Failure Surface Factor of Safety
Left Bank Right Bank Required
Reach 6 Channel
Global Long-Term (ESSA) 2.01 1.60* 1.40
Global Long-Term – Check of
EMB (ESSA) 1.73* 1.60* 1.40
Lower Slope Long-Term (ESSA) 2.18 1.85* 1.20
Localized Long-Term (ESSA) 1.99 1.83* 1.20
End-of-Construction (USSA) 1.67* 1.66* 1.30
*Lowest factor of safety value for a block failure where the glacial till was assigned impenetrable strength causing
the slip surface to slide along the interface of the till and overlying Argusville.
Table 3 - Estimated Total Embankment Settlement at Bridge Reaches
Reach
Maximum
Right EMB
Height (ft.)
Estimated
Settlement
(inches)
Settlement used
for design
(inches)*
Reach 6 Channel 20 15.0 20 *20 inches used for design to be consistent with Reach 5, and maintain same level of flood protection.
Table 4 - Estimated Total Bridge Settlements
Reach
No. Bridge
West End of
the Bridge
One Embankment
Width from West
Bridge End
East End of
the Bridge
One Embankment
Width from East
Bridge End
(inches) (inches) (inches) (inches)
6 Co. Rd. 20 1.8 3.0 2.2 3.6
6 Prosper Subd.
BNSF RR TBD TBD TBD TBD

Fargo-Moorhead Area Diversion Project Page 9
2.3 Hydrology
As shown in the hydrographs in Figure 2, flooding in Fargo-Moorhead typically occurs in late March and
early April. The record flood at Fargo-Moorhead was the 2009 spring flood with a river stage of 40.8 feet
at the Fargo USGS gage. This equates to an elevation of 902.6 feet National Geodetic Vertical Datum of
1929 (NGVD29) or 903.54 feet NAVD88. The NAVD88 is the datum that has been used for project design
and modeling. The USGS plot in Figure 5 shows a peak flow of 29,500 cfs in 2009, which is approximately
a 2-percent annual chance event [1]. During the feasibility phase of the project, the USACE established
the flows at the Fargo USGS gage for each return period ranging from the 50-percent annual chance
event up to the 0.2-percent annual chance event using the wet period hydrology. Additional background
information on the project hydrology can be found in Appendix A of the Environmental Impact Study
(EIS) [4]. A larger flood event called the “Maximum Flood Fight Flow Conditions” further establishes
design criteria for the project. The Maximum Flood Fight Flow Condition is based on the maximum flow
in the diversion just before the control structures on the Red and Wild Rice Rivers would be opened to
prevent the loss of minimum freeboard on the tieback embankments. The without project hydrology
developed by the USACE at the Fargo USGS gage is shown in Table 5.
Figure 5 - USGS Peak Streamflow at Fargo Gage [1]
Table 5 – Existing Discharge-Frequency at Fargo
Existing Discharge-Frequency (cfs)
Exceedance Frequency (percent) Maximum
Flood Fight
Flow Condition 50 25 20 10 5 2 1 0.5 0.2
5,600 10,600 12,150 17,000 22,000 29,300 34,700 46,200 61,700 103,000

Fargo-Moorhead Area Diversion Project Page 10
2.4 Hydraulics
The design flows into the diversion channel have been determined using an unsteady HEC-RAS hydraulic
model for various synthetic flood events. This unsteady flow model of the Red River and its tributaries
begins at Abercrombie, ND and extends downstream beyond Grand Forks, ND. Project features such as
the diversion channel, aqueduct structures at the Sheyenne and Maple Rivers, hydraulic structures at
the Rush and Lower Rush Rivers, and gates on the Wild Rice and Red Rivers are also included in the
model. Storage areas are used in the model to represent the gridded network of land sections. The
project is operated with the goal of reducing the river stage at the Fargo USGS gage by operating the
Red and Wild Rice River gates for each flood event without adversely impacting communities
downstream. The reduction in the river stage varies based on each flood event. Additional background
information on the project hydraulics can be found in Appendix B of the EIS [6] and Appendix D of the
Supplemental Environmental Assessment [5].
The design flows from the unsteady flow model were then put into a steady flow model provided by the
USACE which established the design water surface profiles in the diversion channel for the 1-percent
annual chance, 0.2-percent annual chance, and Maximum Flood Fight Flow Condition events. The flow
entering and exiting the diversion channel for the 1-percent annual chance event from the unsteady
flow modeling is approximately 20,000 and 30,000 cfs, respectively. The increase in flow from the inlet
to the outlet of the diversion channel is due to additional inflows from the tributaries and the local
drainage area.
3 Channel Design
3.1 Diversion Channel
The diversion channel side slopes were set at 1V:7H throughout the design reaches based on
geotechnical analyses. During initial feasibility design, the diversion had a 250 foot wide bottom with a
0.8 feet/mile channel slope, a small low flow channel, and no bottom cross-slope. The current channel
design has a 300 foot wide bottom to provide an adequate meander belt for the low flow channel with a
cross-slope of 2 percent to the center and 0.9 feet/mile channel gradient. The low flow channel has a 0.8
feet/mile channel slope. A typical cross-section is shown in Figure 6. These three changes balance out to
have minimal difference in the calculated excavation material from the feasibility phase. The cross-
section analysis at the bridges is described in further detail in Appendix C Section C.2 Hydraulic Analysis
for Bridge Design Reaches. More information can also be found in Appendix M Section M.2 MFR-002
Diversion Channel and Low-Flow Design.
The main channel bottom width for the diversion is 300 feet. However, at the bridge sections in reach 6,
the main channel bottom for the diversion is 275 feet. Above the bottom of the 275 foot main channel
section, is a 24 foot wide recreational trail bench, below the existing ground. The addition of this bench
serves to maintain nearly the same hydraulic capacity as the 300 foot wide channel section. The
reduction in hydraulic capacity for the 275 foot wide channel section compared with the 300 foot wide
channel is approximately 6% for both the 1% and 0.2% annual chance event. Below the existing grade,

Fargo-Moorhead Area Diversion Project Page 11
the hydraulic capacity is approximately the same for both the 300 and 275 foot wide channel section.
This 24 foot bench is proposed to serve as a recreational trail and occurs only on the right bank at the
BNSF Prosper Subd. Railroad bridge and County Road 20 bridge sections. Since there is not much
distance between the BNSF Prosper bridge and the County Road 20 bridge, the recreational trail will stay
on the 50 foot bench between the top of the channel and the toe of the right bank EMB. This is to
provide the trail users with a better experience, with fewer maintenance road crossings and fewer
elevation increases to navigate. The left and right banks, defined when looking downstream, are west of
the channel and east of the channel, respectively. A typical cross-section with the 24 foot recreational
trail bench is shown in Figure 7.
Steady flow HEC-RAS results for the 1 and 0.2-percent annual chance events are shown in the diversion
profiles in Figure 8. The profiles are compared to the diversion channel toe, the invert of the
meandering low flow channel, the existing ground surface, the water table, and the Brenna soils.
Additional information on the soils is provided in Appendix D.
3.1.1 Meandering Low Flow Channel
Reach 6 has a low flow channel with a 6.0 foot centerline depth from the invert of the low flow channel
to the top of bank of the low flow channel. The low flow channel also has a 46 foot bottom width, 90
foot top width, 1V:4H side slopes and a 2 percent cross-slope from centerline depth to the toe of slope
across the channel bottom. The low flow channel is designed to be able to meander within the 200 foot
wide meander belt for an overall sinuosity of 1.1. The sinuosity gives the low flow channel a slope that is
similar to the average slope of the neighboring Maple River. This will allow the low flow channel to act
more like a natural river channel.
3.1.2 Scour Analysis at Bridges
The bridge scour analysis focuses on the highway bridge in Reach 6. In order to comply with the Federal
Highway Administration (FHWA), the potential scour around the bridge is evaluated for the 1-percent
annual chance event and the 0.2-percent annual chance event. The USACE’s report titled, “Sediment
Transport Analysis for Diversions in the Red River Basin near Fargo-Moorhead,” shows several feet of
erosion depth due to the deposition upstream of the bridge, which results in steepening of the slope
and high velocity at the bridge. Soil samples used for the current bridge scour analysis are the same as
the USACE sedimentation study. That study had a calibrated soil erosion curve that is the basis for the
current study. The FHWA recommends using the Scour Rate in Cohesive Soils-Erosion Function
Apparatus (SRICOS-EFA) method for bridge scour analysis for cohesive soil, which is the situation for this
study.

Fargo-Moorhead Area Diversion Project Page 12
The time-dependent scour analysis shows that after a period of 100 years of record, the maximum pier
scour and contraction scour for the 1-percent annual chance event at the County Road 20 Bridge are 7.8
and 4.1 feet, respectively. This results in a combined pier and contraction scour depth of 11.9 feet for
the 1-percent annual chance event. The time-dependent scour analysis also shows that after 100 years
of record, the maximum pier and contraction scour for the 0.2-percent annual chance event at the
County Road 20 Bridge are 8.1 and 4.2 feet, respectively. This results in a combined pier and contraction
scour depth of 12.3 feet. The erosion protection measures include protection of the low flow channel
with a 24-inch thick riprap layer of USACE R20 gradation riprap (Figure 9).

Pa
ge
13
F
arg
o-M
oo
rhe
ad
Are
a D
ive
rsion
Pro
ject
Figure 6 - Typical Cross-section
Figure 7 - Typical Cross-section at BNSF Rail and County Road 20 Bridges with 24 foot Bench

Page14 Fargo-Moorhead Area Diversion Project
F
igu
re 8
- N
D D
ive
rsio
n P
rofi
les

Pa
ge
15
F
arg
o-M
oo
rhe
ad
Are
a D
ive
rsion
Pro
ject
Figure 9 – Riprap Layout at County Road 20 Bridge

Fargo-Moorhead Area Diversion Project Page 16
3.2 Exterior Channels
Smaller channels on the exterior of the main diversion channel are designed to convey local drainage as
well as realign existing natural waterways and manmade channels that are intercepted by the diversion
channel. Some of these channels are intended to be permanent features while others are designed to
temporarily convey water during construction.
3.2.1 Local Drainage Ditches
The typical section in Figure 6 shows the drainage systems adjacent to the EMB. This local drainage
system will pick up any small localized areas that drain toward the project as well as intercept drainage
from the EMB. Where necessary, there will also be a local drainage channel EMB on the exterior side of
the drainage channel that is designed to contain the 10-percent annual chance local water runoff while
maintaining two feet of freeboard in the channel. This is consistent with the typical design of legal
drainage ditches by local water resource districts (Appendix C Section C.1).
3.2.2 Riprap Analysis at Culverts
The riprap at culverts within the diversion channel plans uses the USACE gradation. The riprap at
culverts within the roadside ditches that are within a 200 foot corridor of the roadway and bridge
centerline will use a standard ND/DOT gradation. The specific type of ND/DOT riprap used for this area is
provided in the roadway and bridge plans. For the areas where the USACE gradation is used, it is
recommended that the thickness of the riprap protection should be at least 2 times the maximum stone
size, D100, in the gradation. The USACE R20 gradation has D100 equal to 12 inches, so the thickness of 24
inches is suggested. The maximum allowable velocity for the R20 gradation is 6.93 ft./sec.
4 Levees and Excavated Material Berms The large diversion channel cross-section requires a large amount of excavation material. Most of the
material will be placed adjacent to the diversion channel. The excavated material will also be used for
the roadway and rail embankments necessary for the bridge crossings over the diversion channel and
also for roadway alignments.
The EMBs for Reach 6 are offset 50 feet from the top of the diversion channel and have a maximum
height of 20 feet, measured from the maximum height of the undulating surface on the right bank EMB
to the existing ground surface, as shown in Figure 6. The height of the EMBs, from the centerline of the
maintenance roads to the existing ground averages between 17 and 18 feet, depending on variations in
the existing ground surface. The EMB heights and widths will vary to balance out the excavation
quantities and limit hauling from one section of the project to another. EMBs will terminate prior to
intersecting with the County Road 20 and BNSF railroad embankments. At the BNSF railroad, the
maintenance roads will be provided with turn-arounds so that no maintenance vehicles can cross the
railroad tracks, while the maintenance roads crossing County Road 20 will tie in at the roadway profile
grade.

Fargo-Moorhead Area Diversion Project Page 17
Embedded or partially embedded levees with 1V:3H slopes and a 10 foot top width will be placed within
the EMB on the right bank of the diversion. An embedded levee is defined as a levee with a minimum of
six feet of cover above the design elevation. The levee will extend through the County Road 20 and the
BNSF Railroad embankments, to maintain a constant level of flood risk reduction. A partially embedded
levee occurs near and through County Road 20. A stand-alone levee with 1V:6H side slopes and a 10 foot
top width occurs between the BNSF railroad bridge and the right bank EMB. The top of levee elevation is
being set one foot above the expected water surface profile in the diversion just prior to the cessation of
flood fighting activities in the flood risk reduction area. This design event is known as the Maximum
Flood Fight Flow Condition Event and is discussed further in Appendix M Section M.1 MFR-001 Levees
and Excavated Material Berms. The levee is also overbuilt to accommodate the expected amount of
settlement, as shown in Table 3.
According to MFR-001, the fill material for the levees will be compacted to a minimum of 95 percent of
the Standard Proctor Density and will be subject to moisture control. The fill material for the embedded
levee will be compacted to a minimum of 90 percent of the Standard Proctor Density and will not be
subject to moisture control. Requirement of the elevation and location of the embedded levee within
the right bank EMB is described further in Appendix M Section M.1. Where there is an embedded or
partially embedded levee, a gravel maintenance road will be constructed on top of the EMB, above the
top of the levee prism. Where there are instances of stand-alone levees, near the intersection of the
levee and the BNSF railroad, there will be no maintenance road on top of the levee, because the
maintenance roads terminate prior to the railroad tracks.
Guidelines established during design defined shrink and swell factors used for cut and fill. The USACE
Guidance Memo in Appendix M Section M.5 was used for the EMB swell potential. The Red River
Floodway in Winnipeg experienced 10-15 percent swell for excavated material placement in weather
above freezing. It is recommended that the EMBs be designed to account for 15 percent swell of the
excavated material volume with approximately even distribution between the right and left EMBs. If less
than 15 percent swell occurs, the left bank EMB can be reduced down to a minimum height of 1 foot
above the design levee profile. The same general EMB configuration is required with a 2 percent slope
and a maintenance road at the crest. If greater than 15 percent swell occurs, spoil areas will be defined
outside of the EMB footprint. These spoil areas are defined as Excavated Material Piles (EMPs) and will
be located so as to minimize hauling distances and reduce costs. Material will mainly be placed in the
EMBs but if necessary can be placed in designated EMP areas shown on the plans. A 10.5 percent soil
shrinkage is expected to occur for the minimum 95 percent compaction requirement for levees and
roadways based on the geotechnical analysis, which is further discussed in Appendix D. No soil shrinkage
is expected to occur for the material that requires a 90 percent compaction requirement. The shrink and
swell factors are summarized in Table 6.
Fargo-Moorhead Area Diversion Project Page 18
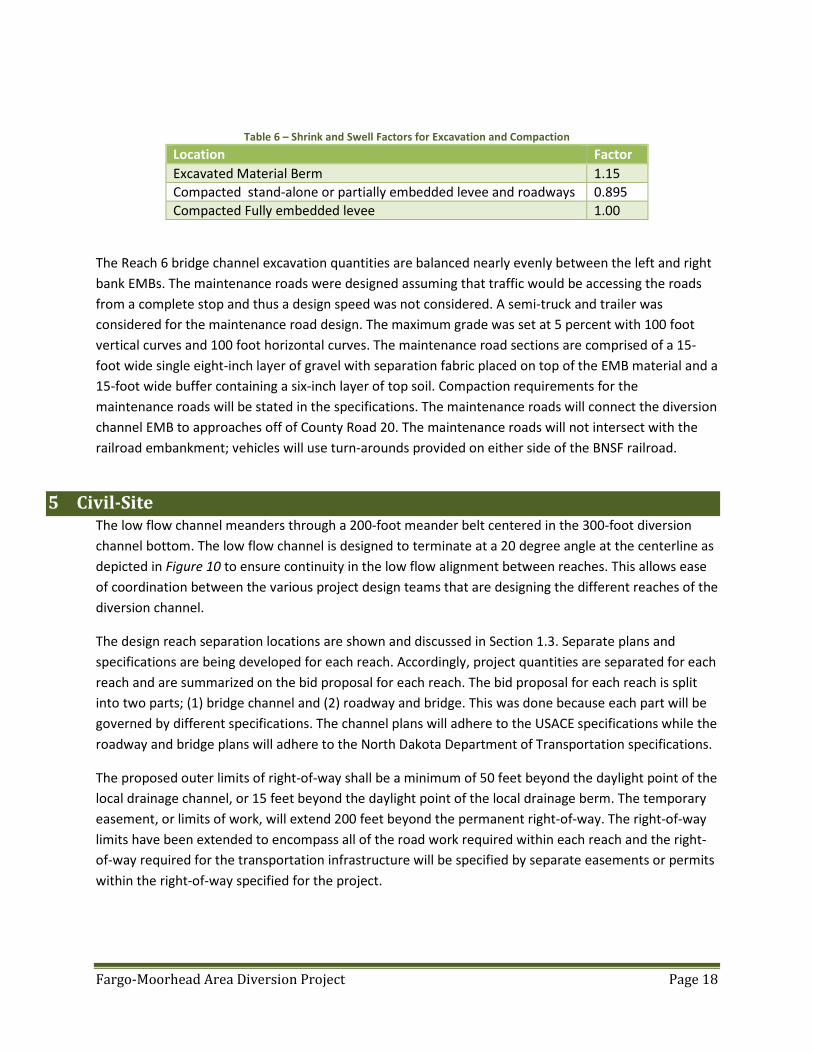
Table 6 – Shrink and Swell Factors for Excavation and Compaction
Location Factor
Excavated Material Berm 1.15
Compacted stand-alone or partially embedded levee and roadways 0.895
Compacted Fully embedded levee 1.00
The Reach 6 bridge channel excavation quantities are balanced nearly evenly between the left and right
bank EMBs. The maintenance roads were designed assuming that traffic would be accessing the roads
from a complete stop and thus a design speed was not considered. A semi-truck and trailer was
considered for the maintenance road design. The maximum grade was set at 5 percent with 100 foot
vertical curves and 100 foot horizontal curves. The maintenance road sections are comprised of a 15-
foot wide single eight-inch layer of gravel with separation fabric placed on top of the EMB material and a
15-foot wide buffer containing a six-inch layer of top soil. Compaction requirements for the
maintenance roads will be stated in the specifications. The maintenance roads will connect the diversion
channel EMB to approaches off of County Road 20. The maintenance roads will not intersect with the
railroad embankment; vehicles will use turn-arounds provided on either side of the BNSF railroad.
5 Civil-Site The low flow channel meanders through a 200-foot meander belt centered in the 300-foot diversion
channel bottom. The low flow channel is designed to terminate at a 20 degree angle at the centerline as
depicted in Figure 10 to ensure continuity in the low flow alignment between reaches. This allows ease
of coordination between the various project design teams that are designing the different reaches of the
diversion channel.
The design reach separation locations are shown and discussed in Section 1.3. Separate plans and
specifications are being developed for each reach. Accordingly, project quantities are separated for each
reach and are summarized on the bid proposal for each reach. The bid proposal for each reach is split
into two parts; (1) bridge channel and (2) roadway and bridge. This was done because each part will be
governed by different specifications. The channel plans will adhere to the USACE specifications while the
roadway and bridge plans will adhere to the North Dakota Department of Transportation specifications.
The proposed outer limits of right-of-way shall be a minimum of 50 feet beyond the daylight point of the
local drainage channel, or 15 feet beyond the daylight point of the local drainage berm. The temporary
easement, or limits of work, will extend 200 feet beyond the permanent right-of-way. The right-of-way
limits have been extended to encompass all of the road work required within each reach and the right-
of-way required for the transportation infrastructure will be specified by separate easements or permits
within the right-of-way specified for the project.

Fargo-Moorhead Area Diversion Project Page 19
The construction staging area will consist of 5 acres for Reach 6. This location is shown on the diversion
bridge channel plans. The staging area for the Reach 6 bridge channel is located east of the right bank
EMB, between County Road 20 and the Prosper Subd. BNSF Railroad.
Existing utility locations are shown in Figure 1 of Appendix E. All utility relocations are being done
separately from this design and will comply with local and state requirements. Overhead and buried
electrical lines will be relocated by the utility owner prior to construction of the project. The utility
relocation plans sent to the USACE in August 2012 for Reaches 1 through 7 are included in Appendix E.
The utility relocation requirements MFR-010 Utility Relocation Requirements was updated October 12,
2012 and can be found in Appendix M Section M.4.
Figure 10 - Reach Sinuosity Coordination Detail
6 Structural The design of all bridges conducted by HMG in Reach 6, are described in more detail in Appendix F. The
hydraulic information for the bridges can be found in Appendix M MFR-005 General Bridge Re-
Assessment for the Diversion from Inlet to Outlet.

Fargo-Moorhead Area Diversion Project Page 20
6.1 Bridges
County Road 20 and the Prosper Subd. BNSF Rail Bridge both run across the Reach 6 diversion
alignment, between stations 656+00 and 683+00. The County Road 20 Bridge has been designed by
HMG. The Prosper Subd. BNSF Railroad Bridge is currently being designed and details about the bridge
design will be included in a future submittal. It is assumed that the BNSF Bridge will follow the same
horizontal alignment as the existing rail, and will meet the same hydraulic requirements with regards to
vertical alignment, as other bridges in other reaches of this project. Pertinent bridge information for the
Reach 6 bridges is summarized in Table 7.
Table 7 - Bridge Geometry Summary
Reach Bridge Station Diversion
Invert
Minimum
Low
Chord
Length
of
Bridge
No. of
Spans Pier Spacing
(ft.) (ft.) (ft.) (ft.)
6 Co. Rd. 20 678+05 867.81 896.80 551.5 5 109.5
6 Prosper
BNSF RR 661+20 867.52 TBD TBD TBD TBD
Note: BNSF Prosper RR Bridge is yet to be designed
County Road 20 and the BNSF Prosper Subd. Rail Bridge will be temporarily detoured or re-routed during
construction to accommodate the construction of the permanent bridges over the diversion channel.
Additional information related to the construction timeline and temporary bypasses will be included in
90% submittals for the County Road 20 and BNSF Prosper Subd Bridge plan sets.
7 Landscape and Recreational A draft Recreation and Use Master Plan has been created for the project. The draft plan includes a series
of recreational trails and specific landscape features that must be accounted for during design. The
cross-section of the left EMB is designed based on minimizing the overall footprint while maintaining
positive drainage and a geotechnically stable cross-section. A maintenance road is included on the
crown of the left EMB.
The right bank of the diversion includes an embedded levee or partially embedded levee underneath the
right EMB, which will include a maintenance road and undulating landscape with topography intended
to create knolls and drainage swales. Near the intersection of the right bank alignment and the BNSF
railroad, there is a stand-alone levee with no EMB or maintenance road above it. Equestrian trails and a
multi-use trail have been designed for the top of the right EMB. Trail surfacing is part of a separate
contract. Where the recreational trails pass under a bridge, as shown in Figure 7, the height between
the trail and the low chord of the bridge will be a minimum of 12 feet, in accordance with the
recommendations for equestrian traffic provided in the Recreation and Use Master Plan. In Reach 6, the
trail will go underneath the Prosper Subd. BNSF Rail and the County Road 20 bridges. Since the distance
between the BNSF Prosper bridge and the County Road 20 bridge is rather small, the recreational trail
will stay on the 50 foot bench between the top of the channel and the toe of the right bank EMB. This

Fargo-Moorhead Area Diversion Project Page 21
condition is to provide the trail users with a better experience, with fewer maintenance road crossings
and fewer elevation increases to navigate. The trail will transition to the top of the right bank EMB
downstream of the BNSF Bridge and upstream of the County Road 20 Bridge. The 24 foot bench
underneath the BNSF railroad and County Road 20 bridges is necessitated by ADA requirements for trail
slopes and was not required for geotechnical requirements. Despite the ADA requirements being the
predominant standard for this cross-section, slope stability was still evaluated.
7.1 Vegetation
A planting plan will be coordinated with the environmental mitigation planned for the project. Planting
plans proposed in the FM-M Area Diversion Recreation and Use Master Plan will follow USACE design
guidance.
Seeding for the initial construction contract will consist of temporary seed mixes. There will be two basic
zones for the temporary seed mixes, one wet zone for riparian species and one dry zone or upland
grasses and forbs. These temporary mixes will include a few native species and a cover crop of oats for
seeding in the spring and early summer or winter wheat if seeding in the fall. The construction
contractor will be responsible for establishment and maintenance of the cover crop for a period of up to
one year. The construction contractor will also be responsible for erosion control and corrections during
the period of cover crop establishment and growth as well as the NPDES construction Stormwater
permit during that time. The permanent planting plan as well as the establishment and maintenance of
native plant species will be accomplished by a joint effort between the Local Sponsors and the COE,
utilizing either a Local Sponsors’ let contract(s) and/or the Local Sponsor’s own work force. After the
initial construction contract is complete, (potentially up to one year after the cover crop has been
planted) the site will be seeded with the permanent native plant species. Once planted, the native
grasses will take approximately three years to become established under good growing conditions.
Guidance for seed mixes and planting zones will be in accordance with MFR-003, Vegetation within the
Fargo-Moorhead Metro Diversion; MFR-003 attachment, Guidelines for Reach 6 Planting Plan of the
Fargo Moorhead Diversion Channel; and MFR-017, Turf Establishment with Native Species via
Construction Contract and the Sponsors Involvement within the Fargo-Moorhead Metro Diversion.
A minimum of six to twelve inches of topsoil will be placed on all EMB and exposed levee surfaces to
provide a suitable bed for suitable vegetative cover. Since the left bank EMB is not required to manage
flood risk and does not act as a levee, Federal Emergency Management Agency (FEMA) and USACE
vegetation requirements do not apply. However, woody vegetation on the channel-side of the left bank
maintenance road should be managed to avoid the risk that woody vegetation becomes a flow
impediment during large flow events.
A vegetation-free zone (VFZ) is not required on the portion of the levee that has greater than six feet of
embedment depth, since that portion of the levee will have no inspection requirements. A vegetation-
management zone (VMZ) will begin 15 feet from the outside edge of the right maintenance road and
extend across the levee section to the left bank EMB.

Fargo-Moorhead Area Diversion Project Page 22
A partially embedded levee with less than six feet embedment has the same vegetation restrictions as a
stand-alone levee. A VFZ is only required in locations where the levee is embedded less than six feet.
Where the VFZ is required, it is to extend 15 feet from each toe of the levee. The VMZ may begin 15 feet
from each toe of the levee. On the channel side, a VMZ would then cross the channel to the left bank
EMB. Where the embedded levee transitions, the VFZ is required to extend a minimum of 15 feet
longitudinally, along the alignment, into the fully embedded levee section, which begins once 6 feet of
embedment is established.
Vegetation-free zones need regular maintenance that may require mowing or burning (if permitted) at
least once per year for inspection. No woody vegetation or trees will be allowed in the VFZ. The
vegetation-management zones are not as strict, but also involve control of woody vegetation and trees.
Woody vegetation and trees will be controlled to prevent their root systems from encroaching into the
levee section. The control of the vegetation would require mowing or burning (if permitted) once every
two years and after every large flood event. This is important as the vegetation could threaten the
integrity of the levee or reduce the flow capacity of the diversion channel and also interfere with the
ability to operate and maintain the levee and EMBs. A rendering of the proposed channel, including
vegetation types, is shown in Figure 11. More detailed information regarding vegetation requirements
and restrictions within the channel and on the EMBs can be found in Appendix M Section M.1 MFR-001
Levees and Excavated Material Berms.

Fargo-Moorhead Area Diversion Project Page23
F
igu
re 1
1 -
Art
ist
Re
nd
eri
ng
of
Re
ach
6

Fargo-Moorhead Area Diversion Project Page 24
8 References
[1] "USGS Flood Tracking 05054000 RED RIVER OF THE NORTH AT FARGO, ND," 16 July 2012. [Online].
Available: http://nd.water.usgs.gov/floodtracking/charts/05054000.html.
[2] U.S. Army Corps of Engineers, "Appendix C: Economics," in Fargo-Moorhead Metropolitan Area Flood
Risk Management, Final Feasibility Report and Environmental Impact Statement, July 2011.
[3] "Population Estimates," U.S. Census Bureau, 25 May 2014. [Online]. Available:
http://www.census.gov/popest/data/cities/totals/2013/SUB-EST2013-3.html. [Accessed 19 February
2015].
[4] U.S. Army Corps of Engineers, "Appendix A: Hydrology," in Fargo-Moorhead Metropolitan Area Flood
Risk Management, Final Feasibility Report and Environmental Impact Statement, July 2011.
[5] U.S. Army Corps of Engineers, "Appendix D: Hydraulics and Hydrology," in Supplemental
Environmental Assessment, September 2013.
[6] U.S. Army Corps of Engineers, "Appendix B: Hydraulics," in Fargo-Moorhead Metropolitan Area Flood
Risk Management, Final Feasibility Report and Environmental Impact Statement, July 2011.
[7] U.S. Army Corps of Engineers, "Riprap Protection Trapezoidal Channel, 60 Deg-Bend, Boundary Shear
Distribution," Hydraulic Design Criteria Sheet, pp. 703-1, 1970.