halo final scientific report draft version - contract number 502869 harmonised coordination of the...
TRANSCRIPT

HALO - Contract number 502869 Harmonised Coordination of the Atmosphere Land and Ocean IPs in GMES
Final Scientific Report, draft version
1/41
EU FP6 Poject No: 502869
Project Title:
Harmonised coordination of Atmosphere, Land and Ocean integrated projects of the GMES backbone
Project Acronym:
HALO
Final Scientific Report
draft version
Authors: J.W. Kaiser, A. Hollingsworth, J.-C. Calvet, M. Leroy, M. Tinz, and Y. Desaubies
Date of Preparation: 23 November 2006 Revision [2] Deliverable No: D23001.1 Dissemination Level: PU, Public

HALO - Contract number 502869 Harmonised Coordination of the Atmosphere Land and Ocean IPs in GMES
Final Scientific Report, draft version
2/41
Table of Contents
1 Introduction..................................................................................................................................3 2 GEMS Greenhouse Gas Sub-Project Status.................................................................................4 3 Ocean-Land and Ocean-Atmosphere Interactions .......................................................................6
3.1 Introduction..........................................................................................................................6 3.2 Ocean-Land Interaction........................................................................................................6
3.2.1 River input....................................................................................................................6 3.2.2 Coastal erosion.............................................................................................................6
3.3 Ocean-Atmosphere Interaction ............................................................................................7 3.3.1 Introduction..................................................................................................................7 3.3.2 Sea surface temperature and heat content ....................................................................7 3.3.3 Forecast Forcing Fields................................................................................................8 3.3.4 Fluxes ...........................................................................................................................8 Near Real Time Blended Surface Wind.......................................................................................9 3.3.5 Carbon Cycle..............................................................................................................10 3.3.6 Seasonal Forecasting..................................................................................................11
4 Land-Atmosphere Interaction I: Monitoring the Carbon Cycle.................................................12 4.1 Introduction........................................................................................................................12 4.2 Relevance for GMES .........................................................................................................12 4.3 Modelling...........................................................................................................................14 4.4 GEOLAND-GEMS link.....................................................................................................17 4.5 Usefulness of EO data........................................................................................................19 4.6 Usefulness of in situ data ...................................................................................................19 4.7 Requirements of near real-time EO data............................................................................19 4.8 Requirements of near-real-time in situ data.......................................................................23 4.9 Summary: towards operations............................................................................................23
5 Land-Atmosphere Interaction II: Biomass Burning...................................................................25 5.1 Relevance for GMES .........................................................................................................25 5.2 Requirements .....................................................................................................................28 5.3 Observation System ...........................................................................................................29 5.4 Recommendations..............................................................................................................35 5.5 Summary ............................................................................................................................36
6 Summary of Land-Atmosphere Recommendations...................................................................38 7 Issues in implementing/developing MERSEA, GEOLAND, GEMS in the period 2008-2013 39 8 References..................................................................................................................................40

HALO - Contract number 502869 Harmonised Coordination of the Atmosphere Land and Ocean IPs in GMES
Final Scientific Report, draft version
3/41
1 Introduction (authors: Kaiser, Hollingsworth)
The Fast-Track Pilot Service “Marine Monitoring” will perform the global operational monitoring of the Ocean in GMES. The “Global Atmospheric Service” (GAS) and the “Global Land Monitoring Service” have been proposed for the operational monitoring of the atmosphere and land in GMES. These three services will build on the monitoring systems developed by the Integrated Projects (IPs) MERSEA, GEOLAND, and GEMS.
HALO is a collaboration of members of the three IPs and two industrial partners. It aims at formulating agreed recommendations for the transition to operational status of the three monitoring systems.
This report presents the review by the HALO partners from the three IPs of the overall scientific architecture of the three monitoring systems. It focuses on the interactions between the three systems, highlights the important exchanged products, and formulates agreed recommendations for future scientific developments that seem necessary for the successful operation of the global monitoring systems in GMES in the time period 2008-2013.
The “draft” version of this report forms the basis for the discussions at the 3rd HALO workshop. The final version will be delivered at the end of the project.

HALO - Contract number 502869 Harmonised Coordination of the Atmosphere Land and Ocean IPs in GMES
Final Scientific Report, draft version
4/41
2 GEMS Greenhouse Gas Sub-Project Status Beginning in the first half of 2005, and drawing on its extensive modelling and data assimilation capabilities, the GEMS project has developed three global models and three different global data-assimilation systems, for use on greenhouse gases, aerosols and reactive gases. The underlying model and assimilation software is shared between the three systems, so consolidation into a single system should present few problems. The October 2006 status for the Greenhouse Gas (GHG) sub-system may be summarised as follows: The core meteorological model has been extended to include CO2 as a model variable with climatological surface sources of CO2 over land and sea; - the model has been used to create a year-long dataset where CO2 is a freely evolving variable and the
meteorology is constrained to the correct meteorology; (Figure 1) - the meteorological four-dimensional variational data assimilation system (4D_Var) has been extended to
include CO2 as an assimilated variable, with the data input for CO2 being 63 selected channels of the AIRS instrument.
- after extensive experimentation a 3-month data-assimilation run, using AIRS information on CO2, has been made to study the soundness of the analysis system, the bias correction, the cloud detection, and various other parameters affecting the CO2 data assimilation. (Figure 2)
- a variational flux inversion scheme has been developed to blend the flask-data and the satellite information in the data assimilation;
- the output of the 3-month reanalysis run is being used to test the flux inversion system. - A 1-year data assimilation run will be delivered in the first half of 2007. It is too early to draw conclusions from the first assimilations, as many aspects of the results are still being explored. Work on assimilation of information on CO2 from IASI on METOP-A, and on Methane has begun.
Figure 1: Comparisons with surface CO2 measurements from NOAA/CMDL network of seasonal-cycle model run with meteorological fields corrected every 12 hours and specified climatological surface fluxes of CO2. [Hollingsworth et al. 2006]

HALO - Contract number 502869 Harmonised Coordination of the Atmosphere Land and Ocean IPs in GMES
Final Scientific Report, draft version
5/41
Figure 2: CO2 assimilation results. [Hollingsworth et al. 2006]
Concerning the determination of CO2 sources & sinks using inversion models, the inversion algorithm used for flux retrievals has been updated. The transport model in use in the inversion scheme has been tested against surface stations. Furthermore, consistency of the models used in the flux retrieval and the concentration assimilation has been tested using "free runs" of the assimilation system. Flux retrievals have been performed for the three month test of the analysis system and the flux increments look reasonable.

HALO - Contract number 502869 Harmonised Coordination of the Atmosphere Land and Ocean IPs in GMES
Final Scientific Report, draft version
6/41
3 Ocean-Land and Ocean-Atmosphere Interactions (author: Desaubies, with contributions by Bentamy) Preliminary notes prepared for the Third Halo Workshop, December 2006.
3.1 Introduction
HALO is concerned with the interacting parts of the Atmoshpere, Land and Ocean components of the future Gmes system, which is initially developed by the three Integrated Projects, e.g. Mersea for the ocean and marine services.
Mersea, qua project, will end in 2008; but it is building the foundation of the future Marine Core Services (MCS) of Gmes. It is thus important to distinguish the project from the system under development. The Mersea architecture is described in several project reports and documents. It is based on a network of Thematic Assembly Centers (TAC) and Monitoring and Forecasting Centres (MFC) linked by a common Information and Data Management Infrastructure.
In what follows, when reference is made to the Mersea system, one must understand the system that is presently being developed, and the future MCS architecture.
3.2 Ocean-Land Interaction
Although this topic has not been considered in the HALO project, it is of paramount importance in the near shore environment, and must be briefly mentioned at the very least. The Marine Core Services developed by the Mersea project are aimed primarily at intermediate users who will in turn use the products for the delivery of specific user applications, many of which are in the coastal environment. The MCS will provide proper boundary conditions and remotely sensed data to those local systems.
3.2.1 River input Regional seas and the near shore coastal environment are strongly affected by river run-off, both
in terms of volume input (which affects temperature and salinity), as well as the chemical (organic and inorganic), and suspended matter load. It suffices to consider the huge watershed of semi-enclosed seas such as the Baltic or Adriatic to be convinced of the major effect of continental waters. The fluxes of carbon components from land to the ocean are but one example of those processes that are of great importance and would require further consideration, but for which woefully little data are available.
Those quantities are presently very poorly known and whatever data exist are very difficult to access. This is a major hindrance to proper modelling, monitoring, forecasting and management of the ocean environment.
3.2.2 Coastal erosion The effects of the ocean on land range from the global to the very local. At the very local scale,
coastal erosion in the near shore environment is a process of major importance. However it is best considered at the local, national level, through coastal engineering. Marine Core Services bring the proper large scale context of those processes, in particular by providing long time series for proper statistical analysis of extreme conditions, which will enable better downstream applications at the very local level.
On the global scale, changes in sea level affect many low lying areas, whether islands or coastal flatlands. Global monitoring is essential to the detection of sea level changes and to the elaboration of realistic scenarios of evolution.

HALO - Contract number 502869 Harmonised Coordination of the Atmosphere Land and Ocean IPs in GMES
Final Scientific Report, draft version
7/41
3.3 Ocean-Atmosphere Interaction
3.3.1 Introduction The two fluid envelopes of our planet are intimately linked and exchange continuously such
basic quantities as heat, moisture, momentum, and diverse gases, including carbon dioxide. The two media interact also indirectly through the cryo-sphere (sea ice), which provides a complex, moving interface. Thus the GMES requirements for Global Monitoring of the Environment and the for the provision of services must consider the two realms and their interactions.
Those interactions are so numerous that all cannot be considered in this summary. For instance, the incoming radiation in the ocean (a key input for heat balance and biological photo-synthesis) is affected by cloud cover and aerosols. One assumes here that such factors are properly taken into account by National Weather Services, and are not a matter of interacting parts, where further synergies are warranted. Other topics, still a matter of research, are not yet mature enough to be considered in this report, e.g. aerosols. Aerosols modify the incoming radiation, provide chemical inputs to the ocean, or can be generated at the ocean surface in the form of spray. Those complex and poorly known processes cannot at the present time be included in the operational systems.
Therefore, we have selected a few topics of high relevance, which are presently being implemented in the course of the integrated projects: from the atmosphere to the ocean: forecast forcing fields and fluxes; from the ocean to the atmosphere: sea surface temperature; strongly interacting parts: carbon cycle and seasonal forecasting.
3.3.2 Sea surface temperature and heat content The Mersea system produces several sea surface temperature (SST) products of interest to
atmospheric systems: two streams for high resolution SST fields: from remotely sensed observations (satellite) and from ocean models with assimilation; and low-resolution products from in situ data.
SST observation products : the Mersea system is developing a Thematic Assembly Centre (TAC) for SST as a contribution to Gmes. It is derived from the Global Ocean Data Assimilation Experiment (GODAE) high-resolution sea surface temperature pilot project (GHRSST-PP), and its European Service for precise SST first developed as the ESA Medspiration project.
Medspiration is a real-time service for the production and delivery of high-resolution sea surface temperature from all available satellite sensors. GHRSST provides a new generation of global high-resolution (<10km) SST data products to the operational oceanographic, meteorological, climate and general scientific community, in real time and delayed mode.
Every day, GHRSST-PP processing systems produce SST products from several complementary satellite and in situ SST data streams to a common netCDF format. Both integrated observation (L2P) and analysis (L4) products are available
This service is aimed as an alternative to the widely used real-time global sea surface
temperature (SST) analysis developed by Richard Reynolds from the Environmental Modeling Center of the National Centers for Environmental Prediction (NCEP).
Mersea will distribute products at high resolution (5 – 10 km) for the Atlantic and Global Ocean, and very high resolution (2 km) for the Mediterranean, Baltic, Barents, Norwegian, and Arctic seas. All the products are based on common formats and quality standards, including common validation methods and tools and comparisons over various areas whenever possible.
Click image for Todays Global SST

HALO - Contract number 502869 Harmonised Coordination of the Atmosphere Land and Ocean IPs in GMES
Final Scientific Report, draft version
8/41
Model outputs: the assimilation systems (global and regional seas) combine SST products and data available from satellites and in situ observations to provide best estimates of ocean state variables, including SST. Such high resolution SST products, elaborated on gridded fields, are of potential interest to atmosphere modellers.
In situ synthesis: are obtained by optimal mapping of all available in situ data (from drifting or moored buoys, Voluntary Observing Ships (VOS), ships of opportunity (SOOP), etc… Although those synthesis are of very low resolution, due to the paucity of data and the necessary smoothing to obtain statistical stability, they are of value for validation of other products. Of course, the point measurements are also available from the Mersea servers.
Heat Content: Numerical weather prediction requires not just SST but also upper ocean heat content (e.g. for hurricane prediction). Here also the Mersea products from ocean models with assimilation, and from sub-surface in situ observations (such as Argo) are highly valuable.
3.3.3 Forecast Forcing Fields The systems developed by Mersea are based on Ocean Monitoring and Forecasting systems. It is
clear that forecasting requires forecasts of forcing fields which are only available from Numerical Weather Prediction (NWP) systems run by National Weather Services (NWS). The basic forcing fields needed are the air temperature (Ta ), humidity (Qa ), and the wind components. The fluxes (heat fluxes: latent and sensible) usually derived from the basic fields through bulk formulae, are delivered either directly by the NWS or they are re-calculated by the Ocean Monitoring and Forecasting Centers (see the discussion below on fluxes).
Presently, the Mersea system uses forcing fields from different NWS: ECMWF for the global, Arctic and the Mediterranean, Met Office for the North-west shelves and NE Atlantic, HIRLAM for the Baltic.
One of the extremely valuable products from ECMWF to be mentioned is the ERA-40 re-analysis
The main issue relative to the forcing fields is the availability of the ECMWF forecasts, which can be obtained only through national meteorological agencies. This restrictive data policy must be resolved for the future Gmes / MCS.
3.3.4 Fluxes Surface fluxes at the air-sea interface remain some of the poorly known essential climate
variables; improved accurate estimates must rely on better description of ocean and atmospheric processes.
Radiative fluxes (long and short wave) are delivered by specialized centres (from Earth Observation satellites) and by NWS. There is no added value from Mersea services on these parameters.
Heat fluxes, however are strongly dependent on surface wind (as well as other variables such as SST and Qa ). Therefore there is a need for better wind estimates. Typically fluxes are then derived through the use of bulk formulae that purport to subsume the complexity of small scale processes. Such fluxes are routinely delivered by NWS; however, in the ocean systems, they may be re-estimated as part of the assimilation process in order to obtain the most consistent estimate. At the basis of such methods is the requirement for high resolution wind estimate. Fields combining NWS winds with those derived from scaterometre observations are now part of the Mersea suite of routine production.

HALO - Contract number 502869 Harmonised Coordination of the Atmosphere Land and Ocean IPs in GMES
Final Scientific Report, draft version
9/41
Near Real Time Blended Surface Wind To enhance the spatial and temporal resolutions of surface wind, the remotely sensed retrievals
are blended to the operational ECMWF wind analyses over the global oceans. The blending method aims to provide 6-hourly gridded wind speed, zonal component, meridional component, wind stress and the corresponding components at global scale. The spatial resolution of the resulting wind fields is 0.25° in longitude and latitude. The remotely sensed wind observations are derived from near real time measurements performed by Seawinds scatterometer onboard QuikSCAT satellite and by the three Special Sensor Microwave Imager (SSM/I) onboard DMSP satellites F13, F14, and F15. ECMWF analyses are available at synoptic time (00h:00; 06h:00; 12h:00; 18h:00) on a regular latitude-longitude grid of size 0.5625°×0.5625°. ECMWF analyses are interpolated in space and time over each satellite swath occurring within 3 hours from the synoptic time. The differences are evaluated at each scatterometer and radiometer wind cell of about 0.25° resolution. The former are used through an objective method to estimate global wind fields retaining first ECMWF-QuikSCAT wind differences in swath regions, and in the temporal and/or spatial QuikSCAT unsampled areas, available and valid observed differences between ECMWF and SSM/I are used. SSM/I retrieved surface wind speed is considered as regionalized variable. It is related on average to QuikSCAT wind speed through a linear relationship determined on one hand from QuikSCAT and buoy and on other hand from SSM/I and buoy comparison results (Bentamy et al, 2002). More details about data, objective method, computation algorithm may be found in (Bentamy et al, 2006).
The blended wind fields are calculated during the period April 2004 until April 2006. They are considered as data test that will provide useful insight for near real time production of high space and time resolutions at global and regional scales. Data are available at IFREMER and freely distributed upon request (Contact : [email protected] ). The data files are in NetCDF format supported by several scientific softwares.
Example of Blended wind speed (in color) and direction field over the Mediterranean Sea for 12th March 2006 at 00h:00 (left). Figure in right shows the QuikSCAT observations used to estimate the blended wind vectors.

HALO - Contract number 502869 Harmonised Coordination of the Atmosphere Land and Ocean IPs in GMES
Final Scientific Report, draft version
10/41
3.3.5 Carbon Cycle The ocean plays a key role in the global carbon cycle, as a reservoir (it contains 15 to 20 times
as much carbon as the atmosphere, land vegetation and soils combined (Watson and Orr, 2003), and as an active interacting part: one-way fluxes between the atmosphere and the ocean are of the same order of magnitude as the exchange between the atmosphere and the terrestrial biota. Moreover, since river water contains dissolved carbon, they carry also a significant carbon flux from land to ocean. As explained above, this component of the ocean-land interaction is poorly known.
Carbon fluxes in the ocean are often described in terms of solubility (or physical) pump and biological pump (Oschlies, 2006). The abiotic solubility pump is caused by increasing solubility of CO2 with decreasing temperature.1 Therefore its effectiveness is related to the overall SST distribution and the thermohaline circulation on the global scale. However, only about one quarter of the observed distribution of dissolved inorganic carbon can be attributed to the solubility pump, the remaining three quarters being due to the biological pump.
Here is not the place to enter into the real complexities of observation and modelling of carbon uptake by the ocean. It is still a very active research topic with promising prospects for significant advances in the coming years, but not mature enough at this point to provide reliable quantitative estimates on an operational basis (admittedly, real time estimates are hardly required). The Carboocean Integrated Project is dealing specifically with these issues.
The Mersea project is addressing different aspects: the physical pump through the provision of gas exchange coefficients (and SST); research and development on ocean colour (or rather sea surface reflectance) and its relation to primary production estimates (Chlorophyl a); and bio-geochemical modelling. A few elements of the in situ observing system include eco-system variables, for validation purposes.
The research and development activities in the project are considering different types of bio-geochemical models. For the large scale, open and global ocean, simplified models of the NPZD types are considered. NPZD stands for Nutrient, Phytoplankton, Zooplankton and Detritus, which include also additional variables such as bacteria or dissolved organic matter. They may be run synchronously on line or off-line; with or without data assimilation. Typically, such ecosystem models include 10 to 30 parameters, few of which are actually observable; they are used mostly at the global scale.
One alternative being explored in the project is the so-called “class-size spectral” approach, appropriate to describe the cycling of nitrogen and carbon in the upper ocean with a minimum number of explicit variables and difficult-to-constrain parameters. Structural elements of this new model are the flows of energy and nutrients through phyto- and zoo plankton of different size, governed by an implicit representation of the size spectrum.
At another extreme in the level of complexity, ecosystems of the functional group type are experimented with in the North-West shelf environment and the Mediterranean sea. Those models attempt to resolve different species or groups of plankton, and may typically include several dozens of variables. One notable example is the European Regional Seas Ecosystem Model (ERSEM).
Another topic of research pursued in the Mersea project is the impact of assimilation on the ecosystem models. It is being shown the realistic modelling of ecosystem variables places stringent requirements on the physical models, leading to improvement of the latter. Key physical processes include mixing and vertical velocity, modelling of light penetration and self shading by particulate matter and organisms, suspended matter in shallow seas, or river input in coastal seas.
1 The term pump reflects the fact that the transport is against the mean gradient

HALO - Contract number 502869 Harmonised Coordination of the Atmosphere Land and Ocean IPs in GMES
Final Scientific Report, draft version
11/41
It is planned, as a demonstration, that the global and regional systems to be delivered at the end of the project will all include bio-geochemical variables. Although several of the systems are promising and begin to demonstrate real, but limited skill, much work remains to assess and improve them. Those points are pursued in the Carboocean project and will be addressed in Mersea follow on activities.
3.3.6 Seasonal Forecasting In some ways, the situation for seasonal forecasting is akin to that of carbon cycle modelling:
very high potential socio-economic impact, active research topic, and obvious need to take the ocean role into account. That is why seasonal forecasting is treated as a Special Focus Experiment in Mersea.
Seasonal forecasting (on time scales to a seasonal range, but extended forecasts to a few weeks are also of interest) is carried out at major NWS including the ECMWF. It requires running coupled ocean-atmosphere, for which proper initial conditions are necessary. The ocean and atmosphere initial state must be in proper balance to avoid spurious shocks at the beginning of the update runs. Evidence from previous research suggests that ocean initial conditions prepared through data assimilation increase the skill of the coupled model forecasts.
The Mersea Special Focus Experiments on seasonal forecasting aim to demonstrate that high resolution analyses should further improve the prediction skill of coupled ocean atmosphere models. Several experiments are underway, including different interpolation schemes from high resolution initial ocean models onto the coarser grids used in seasonal forecast systems, and different trial runs. Initial assessment have been made for the El Niño areas, with encouraging results.
Depending on results from this research and demonstrations, the high resolution ocean products from Mersea could potentially have a positive impact on the skill of seasonal forecasts, particularly in the tropics.
Related topics include the improved hurricane forecasts brought about by accurate availability of upper ocean heat content information, or the impact of anomalous large scale sub-surface temperature anomalies in the Atlantic on seasonal weather conditions in western Europe.
It is possibly on this topic of seasonal forecasting that systems such as Mersea may have the most significant socio-economic impact.

HALO - Contract number 502869 Harmonised Coordination of the Atmosphere Land and Ocean IPs in GMES
Final Scientific Report, draft version
12/41
4 Land-Atmosphere Interaction I: Monitoring the Carbon Cycle (authors: Calvet with contributions of Leroy, Beljaars, and Ciais)
4.1 Introduction
The Land Carbon component of GEOLAND (and successor) will provide a pre-operational global accounting system, dealing with the impact of weather and climate variability on soil and vegetation carbon fluxes and stocks. The FP6 GEOLAND activities have demonstrated the feasibility of monitoring vegetation-atmosphere CO2 exchange at the global scale, on daily to seasonal and inter-annual time scales: in situ meteorological measurements and different satellite remote sensing sources of information can be integrated by implementing and using assimilation techniques in global land surface models.
Figure 3: Available data sets for carbon accounting, across time and spatial scales.
4.2 Relevance for GMES
The current Kyoto accounting systems for land natural carbon fluxes rely on forest inventories performed with a low sampling time (typically 10 years).
The GEOLAND project showed that the land surface models used daily in meteorology can be upgraded in order to become CO2-responsive, simulate the vegetation biomass, and assimilate EO data sensitive to soil moisture and vegetation biomass. Implementing such models operationally would be a breakthrough in carbon accounting.

HALO - Contract number 502869 Harmonised Coordination of the Atmosphere Land and Ocean IPs in GMES
Final Scientific Report, draft version
13/41
Indeed, Figure 3 shows that a single data set is not able to quantify the carbon fluxes. Different kinds of in situ and EO data have to be integrated, and the most efficient way to integrate data of different nature is to use a modelling platform including a data assimilation system.The monitoring systems envisioned by the land carbon component of GEOLAND will be able to dramatically improve the performance of current carbon accounting systems by:
- Addressing all temporal scales (hourly to decadal). Indeed, extreme events may have a dramatic impact on the carbon budget of a region. For example, Figure 4 shows that the heat wave of 2003 over Europe has caused a very significant biosphere emission of carbon (Ciais et al. 2005). In their study, Ciais et al. estimate a 30 % reduction in gross primary productivity over Europe, which resulted in a strong anomalous net source of carbon dioxide (0.5 Pg Cyr-1) to the atmosphere and reversed the effect of 4 years of net ecosystem carbon sequestration.
- Accounting for all vegetation types (not only forests).
- Providing global (or continental) continuous maps on a regular grid.
- Using all the available data (either EO data sensitive to soil moisture and vegetation biomass, or in situ flux and soil moisture data, forest inventories, etc.).
- Assessing the uncertainties.

HALO - Contract number 502869 Harmonised Coordination of the Atmosphere Land and Ocean IPs in GMES
Final Scientific Report, draft version
14/41
Figure 4: European-wide anomalies of climate and net primary productivity (NPP) during 2003. All data
compare 2003 and the average of 1998–2002. a, b, Climate. a, Changes in July–September air temperature. b, Changes in annual precipitation. c, d, NPP. c, Simulated changes in July–September NPP. d, Simulated changes in annual mean NPP. e, f, Fraction of absorbed photosynthetic radiation. e, Observed changes in FAPAR from
the MODIS–Terra–EOS satellite. f, Simulated changes in FAPAR. The location of a number of eddy covariance sites is indicated by the black squares (Reproduced from Ciais et al. 2005, Nature). The simulations are made by
the ORCHIDEE model.
4.3 Modelling
In GEOLAND, an extensive modelling/benchmarking work was performed. Carbon flux models were implemented into the operational platforms of Météo-France and ECMWF. Demo offline EO data assimilation algorithms were implemented at Météo-France and ECMWF. Next step is to go towards operations, namely start in 2008 with a simple operational system able to produce carbon fluxes at the global scale (ECMWF, 25 km resolution) and, gradually, refine the system. A very strong R&D component is needed in that field. In particular for data assimilation. The R&D component should include a focus on medium resolution (1-10 km) in order to provide specific products over Europe and link to the forestry community.
As part of GEOLAND, a NRT processing chain has been set up with the ORCHIDEE surface model. The output of the global simulation at horizontal resolution 40 km can be viewed at http://www.lsceorchidee.cea.fr. A prototype data assimilation system has also been set up and will be further developed.
HALO - Contract number 502869 Harmonised Coordination of the Atmosphere Land and Ocean IPs in GMES
Final Scientific Report, draft version
15/41
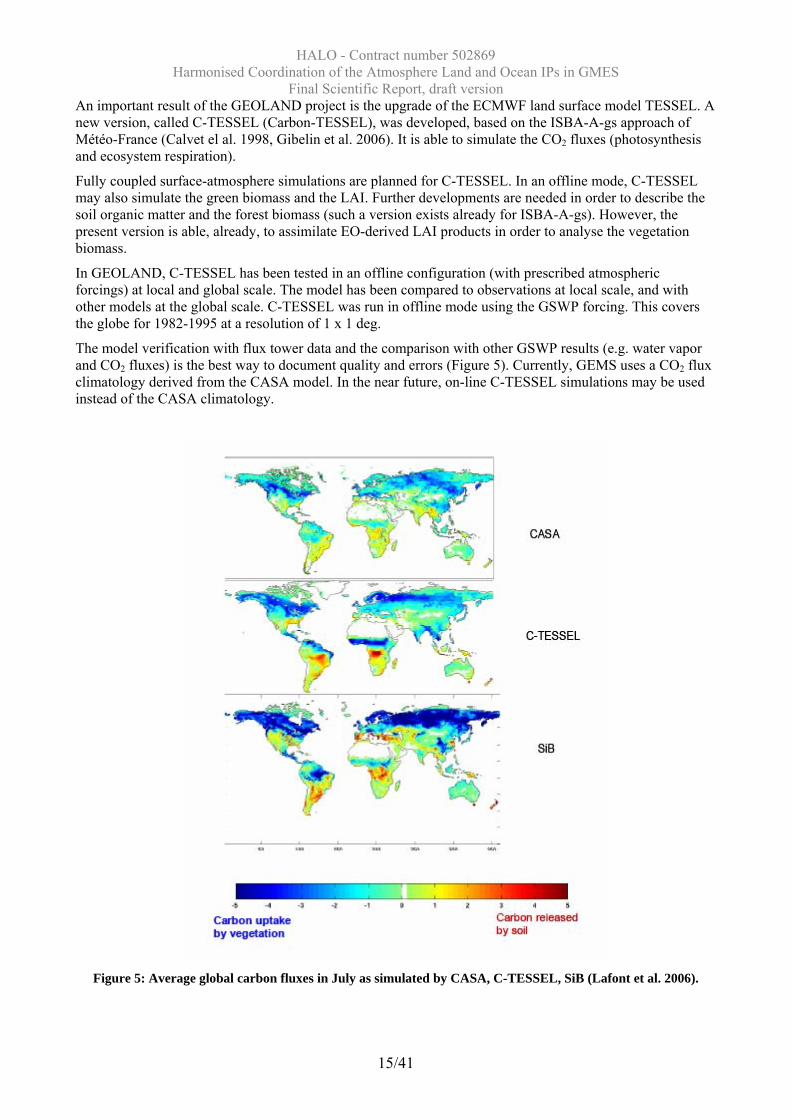
An important result of the GEOLAND project is the upgrade of the ECMWF land surface model TESSEL. A new version, called C-TESSEL (Carbon-TESSEL), was developed, based on the ISBA-A-gs approach of Météo-France (Calvet el al. 1998, Gibelin et al. 2006). It is able to simulate the CO2 fluxes (photosynthesis and ecosystem respiration).
Fully coupled surface-atmosphere simulations are planned for C-TESSEL. In an offline mode, C-TESSEL may also simulate the green biomass and the LAI. Further developments are needed in order to describe the soil organic matter and the forest biomass (such a version exists already for ISBA-A-gs). However, the present version is able, already, to assimilate EO-derived LAI products in order to analyse the vegetation biomass.
In GEOLAND, C-TESSEL has been tested in an offline configuration (with prescribed atmospheric forcings) at local and global scale. The model has been compared to observations at local scale, and with other models at the global scale. C-TESSEL was run in offline mode using the GSWP forcing. This covers the globe for 1982-1995 at a resolution of 1 x 1 deg.
The model verification with flux tower data and the comparison with other GSWP results (e.g. water vapor and CO2 fluxes) is the best way to document quality and errors (Figure 5). Currently, GEMS uses a CO2 flux climatology derived from the CASA model. In the near future, on-line C-TESSEL simulations may be used instead of the CASA climatology.
Figure 5: Average global carbon fluxes in July as simulated by CASA, C-TESSEL, SiB (Lafont et al. 2006).

HALO - Contract number 502869 Harmonised Coordination of the Atmosphere Land and Ocean IPs in GMES
Final Scientific Report, draft version
16/41
Based on flux tower data at various sites, it could be estimated that open-loop, unconstrained simulations of net ecosystem exchange (NEE) have an error standard deviation of 2 gC m-2 day-1 when considering all ecosystems together (Chevallier et al. 2006): this number corresponds to a monthly error budget (i.e., the square root of the sum of the covariances within a month) of about 60 gC.m-2 and a yearly one of about 200 gC.m-2 at one site (without any respect to the nature of its vegetation). Figure 6 illustrates how model simulations at the local scale compare with in situ data.
It is likely that the performance of the models can be improved significantly by assimilating EO data and by using the information provided by the forest inventories. Indeed the carbon models usually perform equilibrium simulations for the forest ecosystems, because the forest history is not accounted for. Using forest inventory data (in situ or EO based), would greatly improve the model accuracy over these ecosystems. The carbon inventory activities is complementary to modelling/continuous monitoring activities: the forest/soil carbon inventories may help constrain the models, and the models offer a temporal and spatial up-scaling (the modelling monitoring is continuous in time, on a hourly/daily base, permitting to address the impact of extreme events, the seasonal/inter-annual variability, and all the vegetation types are considered – not only forests - on a grid base).
Experience with meteorological variables has learned that products like surface fluxes benefit from ongoing monitoring, verification and model improvement activities. In future, the use of carbon fluxes in atmospheric budget studies (e.g. through GEMS) will also provide important feedback to the surface modelling.
The future development of a version of C-TESSEL able to simulate the soil organic matter and the forest biomass will help consolidate the model (these variables can be validated by using in situ observations).
Over Europe, specific needs may be covered by using regional models (ISBA-A-gs or ORCHIDEE) at a spatial resolution of 1 to 10 km using the expertise acquired by other groups/projects:
- European forests management history (from high resolution imagers)
- Biophysical carbon products with uncertainties
- Soil moisture & river runoff information
- Information on wetland and frozen soils extent
- Ground based validation in collaboration with other projects (e.g. CarboEurope, forest inventories work, phenology work)
Such a “regional” component could address the following issues:
- Regional carbon modelling with carbon, water, energy fluxes, ecosystem carbon (and nitrogen) dynamics
- Ecosystem growth and response to disturbances (harvest, fires)
- data assimilation modes.

HALO - Contract number 502869 Harmonised Coordination of the Atmosphere Land and Ocean IPs in GMES
Final Scientific Report, draft version
17/41
Figure 6: Comparison of the NEE simulated by different versions of the ISBA-A-gs model with the measured
NEE at 26 FLUXNET sites: model/observation correlation of (top) monthly means, (bottom) summertime (JJA) half-hourly means (source: Gibelin 2006, GEOLAND/ONC).
4.4 GEOLAND-GEMS link
The two Integrated Projects GEOLAND and GEMS have a global carbon component.
In GEOLAND, a bottom-up approach is used by integrating the available information about the land surface into land surface modelling platforms. The objective is to monitor the continental surfaces and to include “natural” CO2 fluxes (i.e. produced by soil and vegetation, as opposed to fossil fuel emissions) in the land surface scheme of the ECMWF forecast model. The upgraded scheme is C-TESSEL.
In GEMS, a top-down approach is used by integrating the available information about the atmosphere in atmospheric inverse models. Daily to seasonal variations of total column atmospheric CO2 (and other greenhouse gases) are analysed. Inversion systems permit to infer carbon sources and sinks. The objective is to include CO2 as a tracer in the ECMWF forecast model, enabling a full 4D-VAR analysis. Analysing CO2 requires a background representation of surface (land + ocean) source-sink terms in the assimilating model. Regarding fossil fuel emissions, quantitative gridded estimates are available.
The GEOLAND – GEMS link is illustrated in Figure 7:
• The two approaches aim at monitoring the carbon sinks and sources and can be implemented into the operational platform of ECMWF.
• The two approaches are complementary: top-down versus bottom-up ; different observations / constraints are used.
• Biomass burning can be classified as a “natural” source of CO2 because it affects vegetation, and this is a GEOLAND/GEMS cross-cutting issue.
• In GEMS, the land “natural” part of source-sink terms can be represented by C-TESSEL, developed by GEOLAND.

HALO - Contract number 502869 Harmonised Coordination of the Atmosphere Land and Ocean IPs in GMES
Final Scientific Report, draft version
18/41
Figure 7: GEOLAND – GEMS link.

HALO - Contract number 502869 Harmonised Coordination of the Atmosphere Land and Ocean IPs in GMES
Final Scientific Report, draft version
19/41
4.5 Usefulness of EO data
EO data sensitive to the vegetation biomass or to soil moisture may be assimilated in a land surface model.
Other EO derived products like FCOVER or high resolution maps may be used to characterize the spatial heterogeneity of the surface.
In the case of forests, high resolution forest area maps and change detection maps may be used as input to validate carbon flux models.
In the framework of GEOLAND it was shown that a joint assimilation of LAI and soil moisture data is possible in offline mode with a long assimilation window (e.g. 10 days). A demonstration 2DVAR system has been developed.
The rationale for developing such a system is that it offers the possibility to
(1) analyse the vegetation green biomass (along with soil moisture),
(2) perform low-cost land reanalyses using long EO time series,
(3) describe the medium/long-term change in carbon stocks (soil organic matter, forest biomass),
(4) better account for burned areas.
A low-resolution (25 km ?) global system could be developed at ECMWF. It is likely that regional/continental systems with a spatial resolution of 1-8 km will be developed by other players (e.g. national meteorological services).
4.6 Usefulness of in situ data
Most in situ data are not available real time and may be used for validation of the modelling system (e.g. the surface fluxes). Ground-based forest and soil carbon inventories, over tests sites or aggregated over Europe, are required.
Nevertheless, some data acquired real time by operational networks may be assimilated. For example, the SYNOP in situ data (ground observations of air temperature and air humidity) may be assimilated in a land surface model coupled with the atmospheric boundary layer. This kind of assimilation is already operational at ECMWF and Météo-France and permits to analyse soil moisture.
Coupling the assimilation of EO data and in situ data, using a long assimilation window, would require the implementation, in the offline model, of a simplified representation of the atmosphere close to the surface (e.g. from the surface to 50 m). However, whether a system decoupled from the atmosphere can also efficiently do soil moisture and temperature analysis using SYNOP data remains a R&D topic.
4.7 Requirements of near real-time EO data
Table 1, Table 2, and Table 3 present the requirements in EO derived products (vegetation, radiation, soil moisture, respectively) which could be used in a near real-time monitoring system.
Moreover, past EO data are needed too: the re-processing of long AVHRR time series could generate LAI and FCover products over more than 20 years. These products could be used to validate the model simulations.
In Table 1, an important point concerns the definition of the LAI variable required. A “true and photosynthetically active LAI” is needed, i.e. accounting for the vegetation clumping, and not considering the senescent foliage. The expected accuracy should be 0.3 m².m-2. In the same way, the expected accuracy on FCover should be 10-15%. For specific Land Carbon applications, LAI and FCover have to be aggregated for main vegetation classes based upon the ECOCLIMAP land cover map. The number of classes has to be

HALO - Contract number 502869 Harmonised Coordination of the Atmosphere Land and Ocean IPs in GMES
Final Scientific Report, draft version
20/41
defined. Furthermore, it is not a problem if data are missing in the files. But it is important to have synthesis of 10 days with no overlap.
Table 2: if a global DSR product is available in 2008, it will be used immediately. The LST products will be used for validation purposes. Efforts have to be done in order to improve the assessment of snow albedo in the albedo products.
Table 3: for Land Carbon application, the soil moisture products generated with algorithms developed by TU Wien are useful. However, some improvements are suggested to increase their quality:
the Soil Water Index product should account for freeze/thaw.
the Surface Wetness needs for a Quality Flag to inform about the situation of freeze or not.
Finally, the comparison of ASCAT and SMOS products is needed, at the global scale.

HALO - Contract number 502869 Harmonised Coordination of the Atmosphere Land and Ocean IPs in GMES
Final Scientific Report, draft version
21/41
Table 1: Land Carbon requirements of vegetation products
Vegetation Parameters
NRT / Off-line?
Time coverage
Spatial coverage
Time resolution
Spatial resolution
Availability Date
Priority order
LAI NRT and off-line
Time series as long as possible
Regional(1)
Global(2) 10-day
1km (1)
0.25° (2) 2008 1
FCover Off-line
Time series as long as possible
Regional(1)
Global(2) 10-day
1km (1)
0.25° (2) 2008 1
Burnt Areas Off-line Time series Global Daily 1km 2010 2
(1) : for R&D over Europe/France
(2) : for operational application. Today, the model resolution is 0.25°. For each 0.25° grid-cell, the products should be delivered for several land cover types (TbD).
Table 2: Land Carbon requirements of Radiation products
Radiation Parameters
NRT / Off-line?
Time coverage
Spatial coverage
Time resolution
Spatial resolution
Availability Date
Priority Order
Surface Albedo NRT and Off-line
Time series as long as possible
Regional(1)
Global(2)
Daily (1)
10 day (2)
~ km (1)
0.25° (2) 2010
2 (1)
1 (2)
Downwelling Shortwave Flux
NRT and off-line
Time series as long as possible
Regional(1)
Global(2) Hourly
~ km (1)
0.25° (2) 2010 1
Downwelling Longwave Flux
NRT and off-line
Time series as long as possible
Regional(1)
Global(2) Hourly
~ km (1)
0.25° (2) 2010 2
Land Surface Temperature Off-line
Time series as long as possible
Regional(1)
Global(2) Hourly
~ km (1)
0.25° (2) 2010 2
(1) : for R&D over Europe/France
(2) : for operational application. Today, the model resolution is 0.25°.

HALO - Contract number 502869 Harmonised Coordination of the Atmosphere Land and Ocean IPs in GMES
Final Scientific Report, draft version
22/41
Table 3: Land Carbon requirements of Water products
Water Parameters NRT / Off-line?
Time coverage
Spatial coverage
Time resolution
Spatial resolution
Availability Date
Priority Order
Soil Moisture NRT and off-line
Time series as long as possible
global 2-3 days (A) 0.5° (A) 2008 1
Fraction of Snow NRT and off-line
daily km 2010 1
Freeze / Thaw NRT and off-line
daily km 2010 1
Precipitation (*) NRT and off-line
Time series as long as possible
global daily 0.25° 2008 1
(A): ASCAT/MetOP product: ASCAT time and space resolution
(*): precipitation fields as accurate as possible are required

HALO - Contract number 502869 Harmonised Coordination of the Atmosphere Land and Ocean IPs in GMES
Final Scientific Report, draft version
23/41
4.8 Requirements of near-real-time in situ data
In Europe a very large community of partners maintain fluxtowers, over an increasing number of biomes (forests, grasslands, crops, wetlands). This network is organised by the CarboEurope project. This network, or a number of selected sites of this network, could contribute to GEOLAND activities by providing in situ data for validation of the operational or near-operational model production over Europe. However, data policy aspects need to be addressed. Indeed, the current IP ends in 2008 and the data flow is not secured for after 2008. Moreover, only flux data till end of 2003 are public.
Near real-time data acquisition is needed for the validation of the model simulations:
- Flux data:
A number (5-10 ?) of fluxtower teams operating key pilot sites (TbD) of CarboEurope, and able to provide flux data in less than 30 days could be selected and get involved in near-real-time GEOLAND activities;
- Soil moisture data:
A number of CarboEurope sites measure soil moisture but these data are not available real-time. Météo-France has implemented the SMOSMANIA network, which will permit to monitor soil moisture in southwestern France thanks to in situ automatic, real-time measurements of soil moisture profiles (-5, -10, -20, -30 cm). Twelve ground station were activated in 2006 forming a Mediterranean-Atlantic gradient. The soil moisture data acquisition will be fully operational in January 2007. In 2007, soil temperature probes will be installed and the calibration of the soil moisture probes will be finalised. This ground network will be associated with modelling activities and will permit to validate the products of the SMOS (Soil Moisture and Ocean Salinity) mission of ESA, from 2008 to 2012, as well as soil moisture products from other instruments (e.g. ASCAT on METOP).
4.9 Summary: towards operations
In 2008, ECMWF should be able to run a simple operational GEOLAND/ONC system able to produce carbon fluxes at the global scale (25 km resolution). Gradually, the system will have to be refined. A very strong R&D component is needed in that field. In particular for data assimilation. The R&D component should include a focus on medium resolution (1-10 km) in order to provide specific products over Europe and link to the forestry community.
A follow-on of GEOLAND (“GEOLAND-2”), including a land carbon component addressing the integration of models, EO data, in situ data, and the uncertainty assessment, would build a first version of an integrated accounting system. The following scenario can be envisaged:
In 2012, ECMWF will run operationally an updated version of C-TESSEL with assimilation of LAI, at the global scale (25 km resolution or better). A global offline (decoupled from the atmosphere) system will be run in parallel for backup and testing. A number of fluxtower and soil moisture stations in Europe will provide their data before 30 days after they have been acquired, and the flux data will be continuously processed by a CAL/VAL process, ensuring the quality control of the ECMWF products over Europe. The carbon flux simulations will be included in new reanalyses providing long time series (e.g. 40 years at a resolution of 80 km). The evolution of the land use during the reanalysis period will be accounted for as much as possible. Fruitful interactions with CARBOEUROPE-IP (and successor) are foreseen regarding 1) the use of remote sensing data –with uncertainties- in carbon cycle models, 2) the validation of operational models against flux tower measurements, 3) models benchmarking and comparisons. These interactions will be facilitated by a targeted participation of CARBOEUROPE relevant research teams to future GEOLAND activities. A pre-operational regional offline platform will be developed by GEOLAND-2 R&D partners. It will be able to assimilate LAI and soil moisture data over a number of European countries (spatial resolution of 1 to 10 km), to estimate the carbon storage in the soil and the forest carbon sequestration, and to validate the products by integrating in situ and EO based observations. Moreover, a prototype offline platform will combine the assimilation of EO data with the assimilation of SYNOP data.

HALO - Contract number 502869 Harmonised Coordination of the Atmosphere Land and Ocean IPs in GMES
Final Scientific Report, draft version
24/41
In 2016, along with an upgraded global system at ECMWF, a full carbon accounting offline platform will be run operationally over Europe at a resolution of 1 to 10 km and will combine the assimilation of EO data with the assimilation of SYNOP data.

HALO - Contract number 502869 Harmonised Coordination of the Atmosphere Land and Ocean IPs in GMES
Final Scientific Report, draft version
25/41
5 Land-Atmosphere Interaction II: Biomass Burning (author: Kaiser, with contributions by Schultz, Textor, Hollingsworth, Flemming, Granier, Gregoire,
Sofiev, Bartholome, Leroy, Engelen)
5.1 Relevance for GMES
Biomass Burning (BB) is a major interaction between Earth’s land and atmosphere; the land surface is changed and large quantities of trace species are emitted into the atmosphere. BB originates from both natural and anthropogenic causes and is influenced by the meteorological conditions. It is also known as “vegetation fires” and “wildfires”.
The smoke produced by BB can dominate regional air quality in “severe air pollution” events. While the toxic smoke is imminent in the vicinity of large fires, it has also been shown to elevate background of atmospheric pollutants after long range transport [e.g. Stohl et al. 2001, Forster et al. 2001, Andreae et al. 2001].
Emissions by BB are among the most important contributors to the global budget of various gases and aerosols. Figure 8 illustrates the magnitude of the CO emission by BB and it dominating the inter-annual variability. Therefore, accurate assessment of the emissions is needed over extended periods of time for negotiations of international emission control regulations, e.g. Kyoto and CLRTAP.
Figure 8: Source attribution of global annual CO emissions. [http://www.retro.enes.org]
The regional and day-to-day variability of air pollution by biomass burning is highlighted in
Figure 9 with a smoke plume, which originates from Russian biomass burning and is transported over Scandinavia in the course of a few days. It is obvious that fire observations need to be available in near-real time for any forecasting of air quality.

HALO - Contract number 502869 Harmonised Coordination of the Atmosphere Land and Ocean IPs in GMES
Final Scientific Report, draft version
26/41
Figure 9: Fire Observations by MODIS during 20 April and 15 May 2006 (left plot) and modelled air
pollution with PM2.5 on 1 May 2006 (right plot). Emission by the observed fires and atmospheric transport are modelled and forecast by the experimental fire plume forecast by the SILAM model. [http://silam.fmi.fi]
Weather is affected by BB in several ways. The radiative energy budget is perturbed by black
carbon aerosols, which absorb solar radiation, in the smoke. Thus elevated smoky air is heated and surface is cooled [e.g. Konzelmann et al. 1996]. The smoke aerosols also provide cloud condensation nuclei, which initially inhibit precipitation [e.g. Andreae et al. 2004]. The direct heat release by fires can be significant, too. The combination of these effects may accelerate deep convection to form so-called “pyro-convection” above intense fires. It may overshoot into the stratosphere, thus transporting highly polluted air across the tropopause. [Andreae et al. 2004, Damoah et al. 2006]
BB affects important a priori information for the retrieval of all tropospheric trace gases and aerosols from space-borne observations: The aerosols alter the radiative transfer in all observed spectral regions. Most observations cannot, or only very coarsely, discriminate between pollution at different altitude levels. Likewise, it is very difficult to differentiate between different types of aerosols. The monitoring of BB may improve the a priori information significantly by providing the expected altitude of pollution, the likely type of aerosols, and an aerosol optical depth (AOD) estimate.
BB represents a significant sink for the terrestrial carbon pools. In some ecosystems, it changes the land cover type irreversibly, e.g. in tropical deforestation. Other ecosystems include a natural fire season. In order to characterise the latter ecosystems, typical values for the fire repeat period, the fire intensity, and the seasonal fire behaviour need to be determined.

HALO - Contract number 502869 Harmonised Coordination of the Atmosphere Land and Ocean IPs in GMES
Final Scientific Report, draft version
27/41
-1000
-500
0
500
1000
1500
2000
2500
3000
Euro
pe
Nor
thA
mer
ica
Rus
sia
Bra
zil
Aus
tral
ia
Car
bon
Flux
(MtC
/yea
r)
Biospheric Carbon Sink 1980-1999
Biospheric Carbon Sink 2000-2003
Fossil Fuel Emissions
Landuse Change Emissions
Figure 10: Long-term annual mean terrestrial uptake by five regions; diagnostic over the assimilation period
from 1980-19992000 (dark green) and prognostic (in hind-cast mode) for 20001-20043 [Scholze et al., 20065]]. (stimmen die Jahreszahlen, MAS?)
On climate time-scales, accurate modelling of BB is essential to predict the future behaviour of
the terrestrial biosphere. Large variations among model predictions are attributed to differences in process parameterisations and parameter values [Friedlingstein et al., 2003]. The Carbon Cycle Data Assimilation System (CCDAS) [Kaminski et al., 2003, Rayner et al., 2005] demonstrates the use of remote sensing and in situ observations as constraints on process parameters, including a rigorous assessment of uncertainties in process parameters as well as diagnosed and prognosed surface fluxes (see Figure 10). Including a largely simplified fire model demonstrates the effect of BB on inferred surface fluxes listed by process in Table 4 shows the time series of inferred annual mean emission from BB.
Table 4: Surface fluxes derived by CCDAS optimised without (first column) and with (second column) fire
model, values are the averages over the years 1980-1999, units are GtC/yr [Scholze et al., 2005]. Without fire With fire GPP 145.0 144.0 Growth resp. 9.8 21.6 Maint. resp. 70.1 64.5 NPP 65.1 57.8 Fast soil resp. 25.8 13.3 Slow soil resp. 36.9 39.3 Fire 2.8

HALO - Contract number 502869 Harmonised Coordination of the Atmosphere Land and Ocean IPs in GMES
Final Scientific Report, draft version
28/41
0.00
0.50
1.00
1.50
2.00
2.50
3.00
3.50
4.00
4.50
1980 1982 1984 1986 1988 1990 1992 1994 1996 1998
Year
Figure 11: Modelled interannual variability of BB carbon emission from CCDAS (red bars) compared to
estimates from v.d. Werf et al. (yellow bars) [Scholze et al., 2005].
5.2 Requirements
The IP GEMS establishes a global operational system for the monitoring and forecasting of atmospheric composition. The so-called Global Atmospheric Service (GAS) is planned to update and operate this system for the atmosphere monitoring in GMES. It will produce global atmospheric composition analyses retrospectively and forecasts in real-time. Several regional air-quality forecasting systems in Europe will also be enhanced.
In order to achieve these objectives, fire emission products satisfying the requirements listed in the middle column of Table 5 need to be available. Obviously, the emitted amounts of all modelled species of gases and aerosols and the dates, times, and, locations of the fires need to be known. Since the initial plume rise cannot be resolved at the model grid resolution (> 25 km for the global model), the vertical distribution of the fire emissions needs to be known, too. The fire products are required globally, with a spatial resolution of about 25 km. In order to forecast the atmospheric composition, the fire products need to be available in near-real time (NRT), i.e. about 3 hours after the observation. The production of the reanalysis of the “Envisat era” 2000-2007 in GEMS results in the requirement of a long time series covering at least these eight years.
Accurate assessment of the emissions from fires is needed over extended time periods for extended re-analyses and negotiations of international emission control regulations (e.g. Kyoto, CLRTAP). Near-real-time information is required for the forecasting and warning of fire-related pollution episodes.
HALO - Contract number 502869 Harmonised Coordination of the Atmosphere Land and Ocean IPs in GMES
Final Scientific Report, draft version
29/41
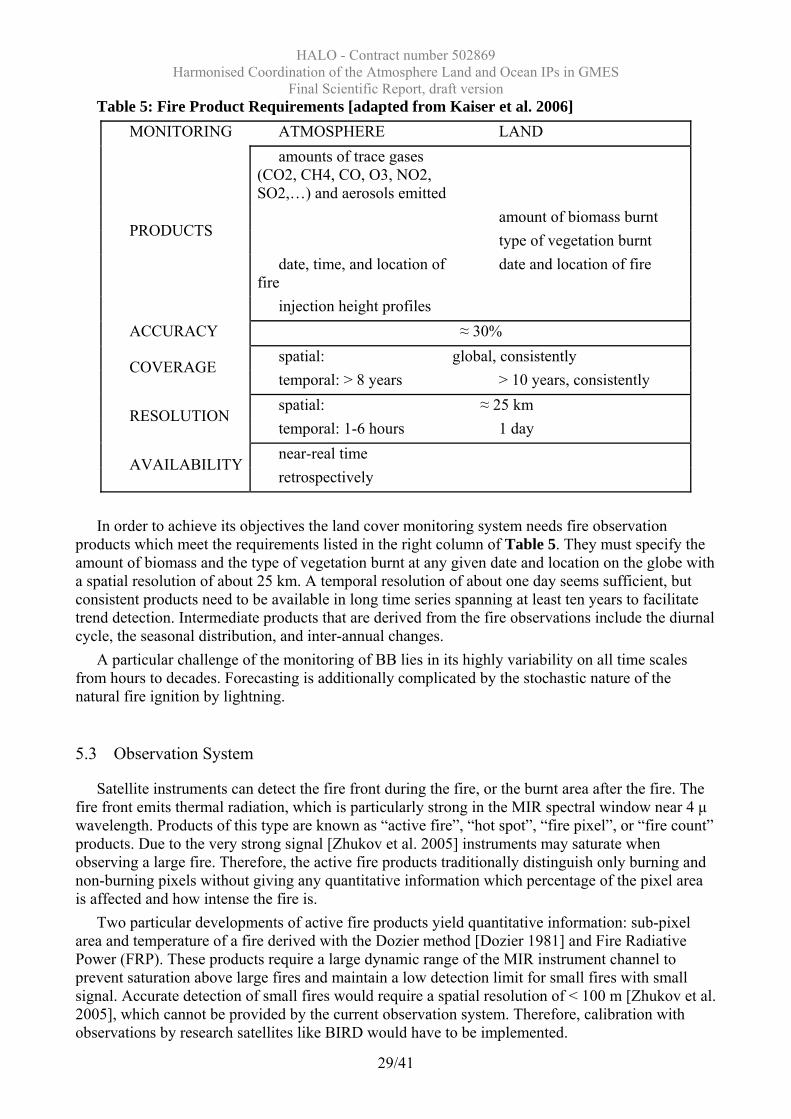
Table 5: Fire Product Requirements [adapted from Kaiser et al. 2006] MONITORING ATMOSPHERE LAND
amounts of trace gases (CO2, CH4, CO, O3, NO2, SO2,…) and aerosols emitted
amount of biomass burnt type of vegetation burnt date, time, and location of
fire date and location of fire
PRODUCTS
injection height profiles ACCURACY ≈ 30%
spatial: global, consistently COVERAGE
temporal: > 8 years > 10 years, consistently spatial: ≈ 25 km
RESOLUTION temporal: 1-6 hours 1 day near-real time
AVAILABILITYretrospectively
In order to achieve its objectives the land cover monitoring system needs fire observation
products which meet the requirements listed in the right column of Table 5. They must specify the amount of biomass and the type of vegetation burnt at any given date and location on the globe with a spatial resolution of about 25 km. A temporal resolution of about one day seems sufficient, but consistent products need to be available in long time series spanning at least ten years to facilitate trend detection. Intermediate products that are derived from the fire observations include the diurnal cycle, the seasonal distribution, and inter-annual changes.
A particular challenge of the monitoring of BB lies in its highly variability on all time scales from hours to decades. Forecasting is additionally complicated by the stochastic nature of the natural fire ignition by lightning.
5.3 Observation System
Satellite instruments can detect the fire front during the fire, or the burnt area after the fire. The fire front emits thermal radiation, which is particularly strong in the MIR spectral window near 4 μ wavelength. Products of this type are known as “active fire”, “hot spot”, “fire pixel”, or “fire count” products. Due to the very strong signal [Zhukov et al. 2005] instruments may saturate when observing a large fire. Therefore, the active fire products traditionally distinguish only burning and non-burning pixels without giving any quantitative information which percentage of the pixel area is affected and how intense the fire is.
Two particular developments of active fire products yield quantitative information: sub-pixel area and temperature of a fire derived with the Dozier method [Dozier 1981] and Fire Radiative Power (FRP). These products require a large dynamic range of the MIR instrument channel to prevent saturation above large fires and maintain a low detection limit for small fires with small signal. Accurate detection of small fires would require a spatial resolution of < 100 m [Zhukov et al. 2005], which cannot be provided by the current observation system. Therefore, calibration with observations by research satellites like BIRD would have to be implemented.

HALO - Contract number 502869 Harmonised Coordination of the Atmosphere Land and Ocean IPs in GMES
Final Scientific Report, draft version
30/41
Since the active fire observations have to be taken during the occurrence of any fire, all observations suffer from temporary cloud cover and, in particular, LEO-based observations cannot comprise all fires. ESA’s World Fire Atlas (WFA), for example, is completely insensitive to the daytime maximum of the fire diurnal cycle because it analyses only nighttime observations by AATSR aboard Envisat.
The burnt area can be detected because the burn scar’s reflectance is small, it is spectrally flat, and its bi-directional reflectance distribution function (BRDF) is flat, too. An important criterion is that the change of the observed parameter occurs suddenly in a time series. Products of this type are known as “burnt area”, “burnt pixel”, “burnt scar”, and “fire-affected area” (FAA). They can only be generated after the fire.
An advantage of the burnt area products is, that observation gaps due to cloud cover and satellite revisit time can be filled thanks to the persistence of the burn scar. However, burning of undergrowth below an intact tree cover is not detected; for example, small fires at the edge of the tropical forest are underestimated [Michel et al., 2005].
The HALO survey of current and future fire observation products for atmosphere and land monitoring are listed in Table 6. The following conclusions can be drawn:
(i) No current product satisfies all requirements of atmosphere and land monitoring in GMES.
(ii) Observations from LEO and GEO satellites complement each other with good spatial coverage and resolution provided by the LEOs and good temporal resolution by the GEOs.
(iii) Active fire and burnt area products complement each other in terms of accuracy for different fire types and, consequently, geographical regions.
(iv) Many existing products are inconsistent. [Boschetti et al. 2004] (v) Several new operational products are anticipated in the next few years. (vi) All information required by the atmosphere and land monitoring of GMES seems to
be distributed across the existing and anticipated products.

HALO - Contract number 502869 Harmonised Coordination of the Atmosphere Land and Ocean IPs in GMES
Final Scientific Report, draft version
31/41
Table 6: Overview of Satellite Fire Products [Kaiser et al. 2006] COVERAGE RESOLUTION NAME REFERENCE SENSOR(S) spatial temporal spatial temporal AVAILABILITY STATUS
Active Fire Products (no quantitative information) MODIS active fire http://modis-fire.umd.edu/products.asp
Justice et al. [2002] Aqua/Terra-MODIS global 2001 –
present 1 km 1 day NRT operational
World Fire Atlas (WFA-algo1)
http://dup.esrin.esa.int/ionia/wfa ERS2-ATSR2, Envisat-AATSR
global 1995 - present
1 km 1 day NRT operational
Active Fire Monitoring (FIR)
http://www.eumetsat.int/idcplg?IdcService =SS_GET_PAGE&nodeId=522
Meteosat-SEVIRI Africa & Europe
3 km 15 min NRT operational
IGBP-GFP http://www-tem.jrc.it/ Dwyer et al. [2000]
NOAA-AVHRR global 1992-1993 1 km 1 day retrospectively finished
TRMM http://earthobservatory.nasa.gov/ Observatory/Datasets/fires.trmm.html Giglio et al. [2000]
TRMM-VIRS 40˚N - 40˚S
1988-2002 2 km / 0.5˚ (sensor/ product)
1 month retrospectively finished
Active Fire Products with quantitative information WF_ABBA, Dozier method
http://cimss.ssec.wisc.edu/goes/burn/ detection.html Prins et al. [2001, 2004]
GOES-E/W N/S-America
1995-present 4 km 30 min NRT operational
WF_ABBA, Dozier method
Prins et al. [2001, 2004] several GEO satellites global 4 km 30 min NRT in planning
MODIS FRP http://modis-fire.umd.edu/products.asp Justice et al. [2002]
MODIS global 2001-present 1 km 1 day NRT operational
SEVIRI FRP http://www.eumetsat.int/idcplg?IdcService =SS_GET_PAGE&nodeId=522
Meteosat-SEVIRI Africa & Europe
3 km 15 min NRT under development
global FRP from GEOs M. Wooster, private comm.. several GEO satellites global 4 km 30 min NRT in planning Burnt Area Products GBA1982-1999 http://www-tem.jrc.it/
Carmona-Moreno et al.[2005] NOAA-AVHRR global 1982-1999 8 km 1 week retrospectively finished
GBA2000 http://www-tem.jrc.it/fire/gba2000 Tansey et al.[2004a, 2004b]
SPOT-VGT global Nov1999-Dec2000
1 km 1 month retrospectively finished
GLOBSCAR http://dup.esrin.esa.int/ionia/projects/ summaryp24.asp Simon et al. [2004]
ERS2-ATSR2 global 2000 1 km 1 month retrospectively existing
MODIS Fire Affected Area
http://modis-fire.umd.edu/products.asp#8
Aquaa/Terra-MODIS global 2001-present 500 m 1 day retrospectively under development
Global Daily Burnt Area (GDBAv1)
GDBA partnership: Leicester Univ.(UK), Louvain-La-Neuve Univ.(B), Tropical Res. Inst.(P), JRC (EC)
SPOT-VGT global 2000-2005 1 km 1 day retrospectively under development
Burnt Area for GEOLAND (BAG)
http://www-gvm.jrc.it/tem/ Restricted access (GEOLAND)
SPOT-VGT Africa & Eurasia
1998-2003 1 km 10 days retrospectively under development
VGT4Africa http://www-gvm.jrc.it/tem/
SPOT-VGT global 2005-present 1 km 1 day NRT under development
GLOBCARBON http://dup.esrin.esa.it/projects/ summaryp43.asp
ERS2-ATSR2, Envisat-AATSR, Envisat-MERIS, SPOT-VGT
global 1998-2007 8 km 1 month retrospectively under development

HALO - Contract number 502869 Harmonised Coordination of the Atmosphere Land and Ocean IPs in GMES
Final Scientific Report, draft version
32/41
The amount of burnt biomass is traditionally calculated from satellite fire observations as the
product of the burnt area BA, the available fuel load AFL [mass per unit area], and the burning efficiency f:
fAFLBAbiomassM ××=)(
The burnt area BA is either taken directly from a burnt area satellite product or inferred through
scaling of an active fire product with scaling factors of various degrees of sophistication; the simplest assuming that the entire pixel is burning, the more complex ones taking into account regional variability. Note that the available fuel load AFL has to be provided by a dynamical global vegetation model (DGVM), which can be considered to be part of a land monitoring system, or simply by a climatology. All three factors are associated with large uncertainties.
The recent development of the fire radiative power FRP satellite product promises to eliminate some of the uncertainties in the calculation of the amount of burnt biomass. It can be formulated with an integral with suitable boundaries over the time t:
∫×=t
FRPsbiomassM )(
s is a scaling factor, which is theoretically constant in time and for all locations. The integral yields the “fire radiative energy” (FRE) for a particular period, typically the lifetime of any particular fire. This approach requires observations of FRP with sufficient frequency to capture its temporal evolution. The FRP method has the potential to significantly reduce the uncertainty of fire emission estimates, because it does not depend on specific knowledge of the fuel load and burning efficiency. EUMETSAT will operationally generate FRP products from SEVIRI in the near future. And the UK Met Office is planning to produce FRP from the MTSAT and GOES satellites, too. However, this method requires further validation and testing.
In any case, the amount of the emissions of the different gaseous and aerosol species is subsequently derived with empirical empirical emission factors E(species):
)()()( speciesEbiomassMspeciesM ×=
The emission factors E(species) are associated with large uncertainties since they vary with
ecosystem, fire intensity, fuel humidity, and other influences. The emission factors for trace gas and aerosol components are hitherto based on measurements in the field and in the laboratory, complemented with model studies. More comprehensive and reliable field data characterizing types (e.g. peat fires) and quantities of fuel consumed are needed. Differences between flaming vs. smouldering combustion in typical and extreme fire situations should be investigated. Recent studies indicate that emission factors can significantly change during the burning season
Vertical profiles of fire emission are currently evaluated from a limited number of campaigns measuring the plumes from few record-breaking fires. The over-proportional sampling of large fires leads to a bias of the obtained elevation of the burning products to large values. The values may therefore not be applicable as default values for arbitrary fire episodes. Dynamic evaluation of the vertical profile of emission requires extensive knowledge on meteorological conditions, as well as size and intensity of each specific fire.

HALO - Contract number 502869 Harmonised Coordination of the Atmosphere Land and Ocean IPs in GMES
Final Scientific Report, draft version
33/41
At present, only two systems provide near-real-time analysis and forecast of air pollution due to fire emissions. The RAMS model at INPE/CPTEC assimilates the WF_ABBA product from the GOES satellites. It monitors CO and aerosol from severe fire events over the Americas. The NRL/NAAPS aerosol model within the FLAMBÉ programme additionally assimilates the MODIS active fire product to provide global forecasts of aerosol emissions from fires.
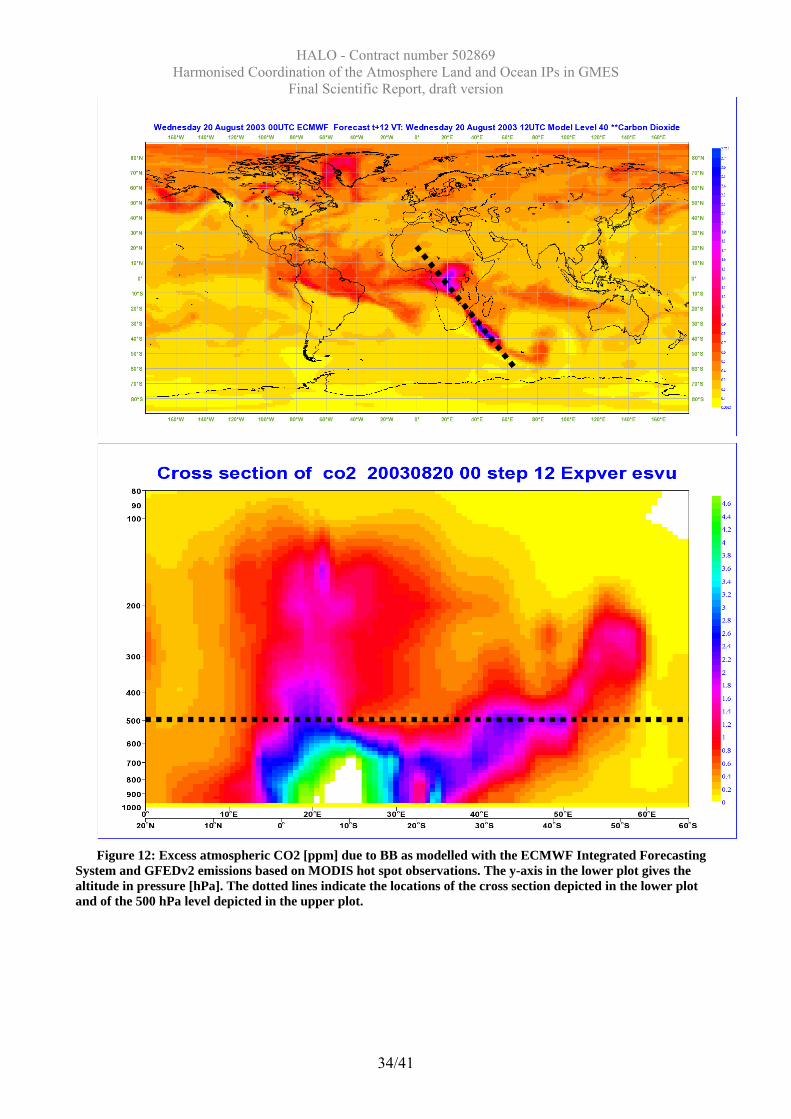
Within GEMS, efforts have started to incorporate fire emissions of aerosols and trace gases in the global and one regional system, see Figure 9 and Figure 12. These developments have not been validated yet; however a requirement for further development is expected.
HALO - Contract number 502869 Harmonised Coordination of the Atmosphere Land and Ocean IPs in GMES
Final Scientific Report, draft version
34/41
Figure 12: Excess atmospheric CO2 [ppm] due to BB as modelled with the ECMWF Integrated Forecasting
System and GFEDv2 emissions based on MODIS hot spot observations. The y-axis in the lower plot gives the altitude in pressure [hPa]. The dotted lines indicate the locations of the cross section depicted in the lower plot and of the 500 hPa level depicted in the upper plot.

HALO - Contract number 502869 Harmonised Coordination of the Atmosphere Land and Ocean IPs in GMES
Final Scientific Report, draft version
35/41
5.4 Recommendations
The previous section have shown that Biomass Burning (BB) emissions are needed globally in near-real time as well as in consistent multi-year time series for accurate monitoring of atmosphere and land in the GMES initiative. No single suitable BB emission product is currently available. Principal shortcomings are accuracy, delivery time, temporal resolution, and geographical coverage. The existing fire observations complement each other to a large extend.
We conclude that the consistent fire observation product required as input for accurate global atmosphere and land monitoring can only be generated by fusion of the various fire observations (or their individual products) in a “Global Fire Assimilation System” (GFAS) built around a numerical model of the global fire activity. Such a system does not exist yet. It would also require input of the meteorological conditions and of land monitoring products like the available fuel load. It could evolve with new scientific developments and provide the best available fire products to the global and regional monitoring systems in GMES in a consistent way, see Figure 13.
Figure 13: GFAS Components
An integrated European research effort is required to generate such an operational system for
accurate global fire emissions. It should involve space agencies, satellite retrieval experts, and biosphere and atmosphere modellers from different research institutes and operational centres. A large integrating project would ensure a successful construction of the GFAS through intensive collaboration of experts ensuring long-term continuity. The GFAS will build on strong heritage from ongoing or recent European Integrated Projects (IP). Initial efforts to build a non-operational version of the GFAS will already be started within the atmospheric IP GEMS. The ongoing land surface IP GEOLAND will provide access to high-quality information on the land surface (e.g., vegetation cover, soil moisture, temperature). Parallel targeted research and development activities by the European, US and Asian communities will be pursued, and close collaboration with existing international efforts will be established (e.g. GCOS, GEOSS, GOFC/GOLD-FIRE, TF-HTAP). A close link to potential users of the fire emissions assessment and the forecast system will be established, e.g., via the land and atmosphere monitoring in GMES.
fire products
landcover products
atmospheric conditions
assimilation into a
numerical model forecasting
system of fire plumes & chemical
weather
global fire assessment
global NRT fire emissions
GFAS - Global Fire Assimilation System
HALO - Contract number 502869 Harmonised Coordination of the Atmosphere Land and Ocean IPs in GMES
Final Scientific Report, draft version
36/41
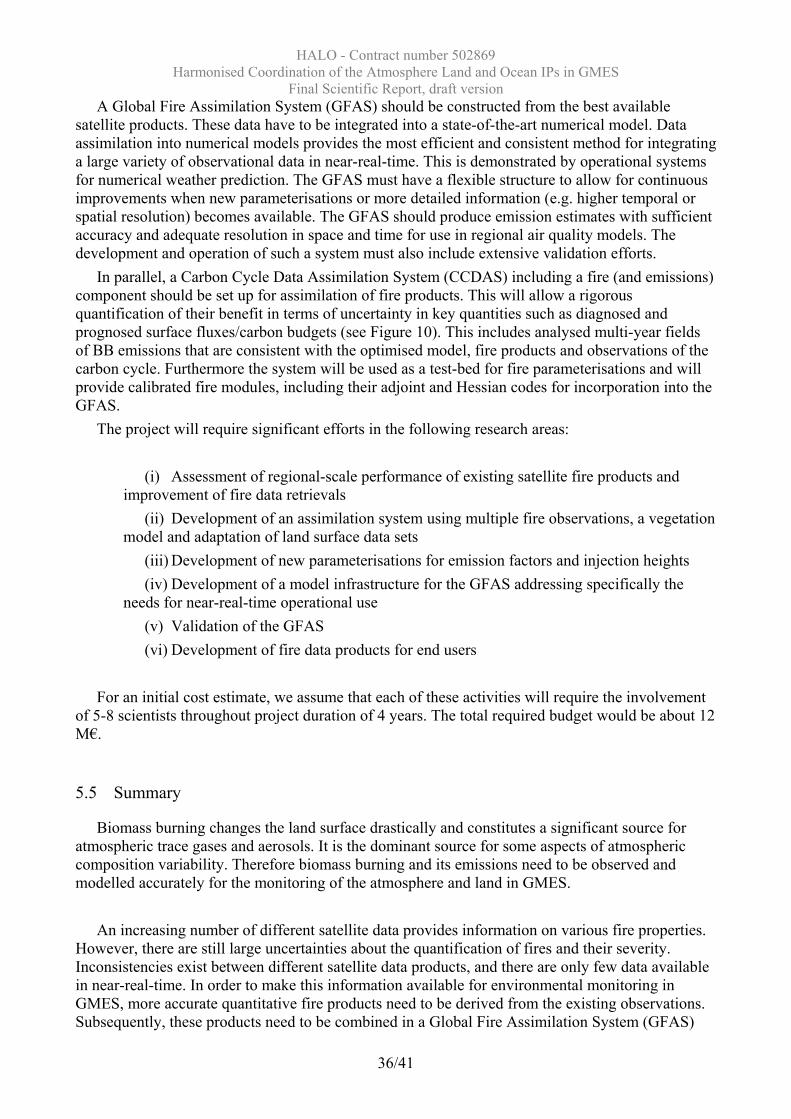
A Global Fire Assimilation System (GFAS) should be constructed from the best available satellite products. These data have to be integrated into a state-of-the-art numerical model. Data assimilation into numerical models provides the most efficient and consistent method for integrating a large variety of observational data in near-real-time. This is demonstrated by operational systems for numerical weather prediction. The GFAS must have a flexible structure to allow for continuous improvements when new parameterisations or more detailed information (e.g. higher temporal or spatial resolution) becomes available. The GFAS should produce emission estimates with sufficient accuracy and adequate resolution in space and time for use in regional air quality models. The development and operation of such a system must also include extensive validation efforts.
In parallel, a Carbon Cycle Data Assimilation System (CCDAS) including a fire (and emissions) component should be set up for assimilation of fire products. This will allow a rigorous quantification of their benefit in terms of uncertainty in key quantities such as diagnosed and prognosed surface fluxes/carbon budgets (see Figure 10). This includes analysed multi-year fields of BB emissions that are consistent with the optimised model, fire products and observations of the carbon cycle. Furthermore the system will be used as a test-bed for fire parameterisations and will provide calibrated fire modules, including their adjoint and Hessian codes for incorporation into the GFAS.
The project will require significant efforts in the following research areas:
(i) Assessment of regional-scale performance of existing satellite fire products and improvement of fire data retrievals
(ii) Development of an assimilation system using multiple fire observations, a vegetation model and adaptation of land surface data sets
(iii) Development of new parameterisations for emission factors and injection heights (iv) Development of a model infrastructure for the GFAS addressing specifically the
needs for near-real-time operational use (v) Validation of the GFAS (vi) Development of fire data products for end users
For an initial cost estimate, we assume that each of these activities will require the involvement
of 5-8 scientists throughout project duration of 4 years. The total required budget would be about 12 M€.
5.5 Summary
Biomass burning changes the land surface drastically and constitutes a significant source for atmospheric trace gases and aerosols. It is the dominant source for some aspects of atmospheric composition variability. Therefore biomass burning and its emissions need to be observed and modelled accurately for the monitoring of the atmosphere and land in GMES.
An increasing number of different satellite data provides information on various fire properties.
However, there are still large uncertainties about the quantification of fires and their severity. Inconsistencies exist between different satellite data products, and there are only few data available in near-real-time. In order to make this information available for environmental monitoring in GMES, more accurate quantitative fire products need to be derived from the existing observations. Subsequently, these products need to be combined in a Global Fire Assimilation System (GFAS)

HALO - Contract number 502869 Harmonised Coordination of the Atmosphere Land and Ocean IPs in GMES
Final Scientific Report, draft version
37/41
that also accounts for landcover and the meteorologic conditions. Such a GFAS would be a new development. However, it is thought to be necessary to meet the fire input requirements of environmental monitoring in GMES.

HALO - Contract number 502869 Harmonised Coordination of the Atmosphere Land and Ocean IPs in GMES
Final Scientific Report, draft version
38/41
6 Summary of Land-Atmosphere Recommendations
(authors: Kaiser, Hollingsworth)
Vegetation is a major source of atmospheric carbon dioxide and water vapour. Conversely, the vegetation is strongly influenced by the meteorological conditions. Because of this close interaction, the global vegetation model C-TESSEL at ECMWF has been developed as part of GEOLAND. It will provide the natural biosphere carbon dioxide flux to GEMS and water vapour flux to the Numerical Weather Prediction (NWP) system at ECMWF. C-TESSEL currently models the green biomass and can be constrained with satellite-based Earth observation (EO) products of the Leaf Area Index (LAI).
In order to be able to model the carbon stocks, and consequently the carbon fluxes, with sufficient accuracy for climate studies C-TESSEL must be developed further to include soil organic matter and forest biomass. Furthermore, soil water products, including freezing and thawing, must be taken into account and further EO products like the fraction of absorbed photosynthetically active radiation (FAPAR) and meteorological data should be ingested. Therefore, we recommend developing the existing low resolution (about 25km) global vegetation model further in a close collaboration between the land and atmosphere monitoring communities.
Biomass burning (BB) is a major source of various atmospheric pollutants. Its emissions of aerosols and carbon monoxide frequently dominate their respective atmospheric abundances. Also, its contribution to atmospheric carbon dioxide is significant for source inversions. The currently established methods for modelling of BB emission with the help of EO fire products require the biomass, including forest biomass and soil organic matter, as key input. The existing EO fire products yield complementary information, none of which is sufficient alone. Therefore, a Global Fire Assimilation System (GFAS) is needed to create a global fire product with sufficient accuracy. The GFAS needs to combine a quantitative model of the global fire activity with the available EO fire products. It will require as input the global distribution of biomass to be produced by the improved vegetation model mentioned above. Conversely, the GFAS will be able provide the change of biomass due to BB to the vegetation model. The global Fire Radiative Power (FRP) EO products, which are currently being developed, should be used in the GFAS to obtain an independent estimate of the burnt biomass.
The conversion of burnt biomass to emissions into the atmosphere is described with so-called emission factors. They are variable, depending on the type of the burning ecosystem, the meteorological conditions, and the type of fire in general. The emission coefficients and the vertical distribution of the emissions in the atmosphere are key parts of fire emission modelling that need further development for the GFAS. Using the atmospheric state monitored by the Global Atmospheric Service (GAS) as observation, a multi-parameter inversion of the GFAS will be able to optimise the model formulation as well as to provide additional information the various input parameters like biomass and emission coefficients. Such an improved model can subsequently also be used the prediction of fire plumes in the context of emergency response and for carbon cycle and climate studies.

HALO - Contract number 502869 Harmonised Coordination of the Atmosphere Land and Ocean IPs in GMES
Final Scientific Report, draft version
39/41
7 Issues in implementing/developing MERSEA, GEOLAND, GEMS in the period 2008-2013
(to be discussed at 3rd HALO workshop) OCEAN
• Current Ocean-Atmosphere set-up looks OK for 2008-2013 • Ocean-Land issues look difficult
o little can be done before 2013 LAND The main issue is how to quantify better the land-atmosphere interactions
• biomass exchange of H2O, CO2, CH4 (GEOLAND-2) • Burnt biomass & emissions (GFAS)
GEOLAND-2
• Will assimilate satellite data on LAI, fAPAR.., either online in the IFS, or offline from the IFS
• Will improve C- TESSEL through extensive validation • Will generate improved estimates of soil organic matter and forest biomass through
modelling • Could generate surface flux estimates offline from IFS, from several SVATS including
ORCHIDEE GFAS will use biomass estimates and satellite data to provide
• improved estimates of burnt biomass ATMOSPHERE Issues GEMS/GAS can use GEOLAND-2 products in several ways
• Use C-TESSEL inline in IFS, and assimilate LAI data • Use offline GEOLAND-2 fluxes as additional information sources in an ensemble of
synthesis inversions • The best utilisation can only be determined by experimentation
GFAS needs funding and a host

HALO - Contract number 502869 Harmonised Coordination of the Atmosphere Land and Ocean IPs in GMES
Final Scientific Report, draft version
40/41
8 References Andreae. M.O. et al., (2001) Transport of biomass burning smoke to the upper troposphere by deep
convection in the equatorial region, Geophys. Res. Lett., 28(6), pp. 951–954 Andreae, M.O. et al., (2004) Smoking Rain Clouds over the Amazon, Science, 303, pp. 1337-1342 Boschetti L. et al., (2004) Lessons to be learned from the comparison of three satellite-derived
biomass burning products, Geophys. Res. Lett., 31, L2150 Calvet, J.-C., J. Noilhan, J.-L. Roujean, P. Bessemoulin, M. Cabelguenne, A. Olioso and J.-P.
Wigneron, An interactive vegetation SVAT model tested against data from six contrasting sites, Agricultural and Forest Meteorology, 92, 73-95, 1998.
Carmona-Moreno, C. et al. (2005),Characterizing interannual variations in global fire calendar using data from Earth observing satellites, Global Change Biology, 11(9), 1537-1555
Chevallier, F., N. Viovy, M. Reichstein, and P. Ciais, On the assignment of prior errors in Bayesian inversions of CO2 surface fluxes, Geophys. Res. Lett., 33, L13802, doi:10.1029/2006GL026496, 2006.
Ciais, P., M. Reichstein, N. Viovy, A. Granier, J. Ogée, et al., Europe-wide reduction in primary productivity caused by the heat and drought in 2003, Nature, 437, 529-533, doi:10.1038/nature03972, 2005.
Damoah R. et al. (2006) A case study of pyro-convection using transport model and remote sensing data, Atmos. Chem. Phys., 6, pp. 173-185
Dozier, J., (1981) A method for satellite identification of surface temperature fields of subpixel resolution. Remote Sensing of Environment, 11, pp. 221–229
Dwyer, E. et al., (2000) Characterization of the spatio-temporal patterns of global fire activity using satellite imagery for the period April 1992 to March 1993, J. of Biogeography, 27(1), pp. 57–69
Engelen R.J. et al., (2006) Environmental monitoring of the atmosphere using a 4-dimensional variational (4d-var) data assimilation system at ECMWF, Proc. of 2006 EUMETSAT Meteorological Satellite Conferencev, this volume
Friedlingstein, P., J.-L. Dufresne, et al. (2003) How positive is the feedback between climate change and the carbon cycle? Tellus 55B, 692–700.
Forster C. et al., (2001) Transport of boreal forest fire emissions from Canada to Europe, J. Geophys. Res. A, 106(D19), pp. 22887–22906
Gibelin, A.-L., Calvet, J.-C., Roujean, J.-L., Jarlan, L., Los, S., "Ability of the land surface model ISBA-A-gs to simulate leaf area index at the global scale: comparison with satellites products", J. Geophys. Res., 111, D18102, doi:10.1029/2005JD006691, 2006.
Giglio, L. et al., (2000) Remote sensing of fires with the TRMM VIRS, International Journal of Remote Sensing, 21(1), pp. 203-207
Hollingsworth, A., et al. (2006) GEMS Periodic Activity Report for 1 March 2006 – 31 August 2006.
Justice, C.O., (2002) The MODIS fire products. Remote Sensing of Environment, 83, pp. 244–262 Kaiser J.W., M.G. Schultz, J.-M. Gregoire, C. Textor, M. Sofiev, E. Bartholome, M. Leroy, R.J.
Engelen, and A. Hollingsworth, (2006) Observation Requirements for Global Biomass Burning Emission Monitoring, Proceedings of the 2006 EUMETSAT Meteorological Satellite Conference.
Kaminski, T., R. Giering, M. Scholze, P. Rayner, and W. Knorr (2003) An example of an automatic differentiation-based modelling system. In: V. Kumar, L. Gavrilova, C. J. K. Tan, and P. L'Ecuyer (eds.) Computational Science - ICCSA 2003, International Conference Montreal,

HALO - Contract number 502869 Harmonised Coordination of the Atmosphere Land and Ocean IPs in GMES
Final Scientific Report, draft version
41/41
Canada, May 2003, Proceedings, Part II, volume 2668 of Lecture Notes in Computer Science, pages 95-104, Berlin, Springer.
Konzelmann, T. et al., (1996) Impact of biomass burning in equatorial Africa on the downward surface shortwave irradiance: Observations versus calculations, J. Geophys. Res., 101(D17), pp. 22833-22844
Michel, C. et al., (2005) Biomass burning emission inventory from burnt area data given by the SPOT-VEGETATION system in the frame of TRACE-P and ACE-Asia campaigns, J. Geophys. Res., 110(D9), D09304
Oschlies A. (2006): On the use of data assimilation in biogeochemical modelling. In Ocean Weather Forecasting. E.C. Chassignet and J. Verron, Eds. Springer.
Prins et al. (2001), Overview of current and future diurnal active fire monitoring using a suite of international geostationary satellites. In: F.J. Ahern, J.G. Goldammer, and C.O. Justice, editors, Global and Regional Wildfire Monitoring: Current Status and Future Plans, pp. 145–170.
Prins et al. (2004), Report on the joint GOFC/GOLD fire and CEOS LPV working group workshop on global geostationary fire monitoring applications. GTOS GOFC-GOLD Report No. 19.
Rayner, P., M. Scholze, W. Knorr, T. Kaminski, R. Giering, and H. Widmann (2005) Two decades of terrestrial Carbon fluxes from a Carbon Cycle Data Assimilation System (CCDAS). Global Biogeochemical Cycles 19:doi:10.1029/2004GB002254.
Scholze, M. et al. (2005), Inferring fluxes of biomass buring from a Global Carbon Cycle Data Assimilation System (CCDAS). Poster Presentation at 7th Carbon dioxide conference at Broomfield, Colorado. [Available from http://www.fastopt.com/papers/scholzeal05-broomfield.pdf]
Scholze, M. et al. (2006), Propagating uncertainty trough prognostic CCDAS simulations. Poster Presentation at CarboEurope Open Sciene Conference, Heraklion, Greece.
Simon, M. et al. (2004) Burnt area detection at global scale using ATSR-2: The GLOBSCAR products and their qualification, J. Geophys. Res., 109, D14S02
Stohl, A et al., (2001) An extension of measurement of ozone and water vapour by airbus in-service aircraft (MOZAIC) ozone climatologies using trajectory statistics, J. Geophys. Res. A, 106(D21), pp. 27757–27768
Tansey, K. et al., (2004a) Vegetation burning in the year 2000: Global burned area estimates from SPOT VEGETATION data, J. Geophys. Res., 109, D14S03
Tansey, K. et al., (2004b) A Global Inventory of Burned Areas at 1 Km Resolution for the Year 2000 Derived from Spot Vegetation Data, Climatic Change, 67(2), pp. 345-377
Watson A.J. and J.C. Orr (2003): Carbon Dioxide Fluxes in the Global Ocean. In Ocean Biogeochemistry. M.J. Fasham, Ed. Springer
Zhukov, B. et al., (2005) Experience of detection and quantitative characterization of fires during the experimental small satellite mission BIRD. DLR Forschungsbericht 2005–04, DLR Optical Informations Systems, Rutherfordstr. 2, 12489 Berlin, Germany