half year report 1 january–30 june 2021
TRANSCRIPT

Half Year Report1 January–30 June 2021
Half Year Report 1 January–30 June 2021 is a translation of the original Finnish version of “Puolivuosikatsaus 1.1.–30.6.2021”. In case of discrepancies, the Finnish version shall prevail.

In Brief
• The Group’s net operating profit excluding unrealised fair value changes amounted to EUR 108 million (EUR 93 million) and it increased by 15.6% (3.6%) in January–June. The net interest income totalled EUR 138 million (EUR 123 million). The growth was 12.0% (5.3%). Costs in the reporting period amounted to EUR 34 million (EUR 32 million), making the figure 6.7% (3.2%) greater than in the first half of 2020.
• The net operating profit amounted to EUR 127 million (EUR 62 million). In this reporting period, the unrealised fair value changes amounted to EUR 20 million (EUR -31 million).
• Changes to the regulation of banks’ capital adequacy (CRR II and CRD V) were applied at the end of June. The Group’s leverage ratio was 12.6% (3.9%) at the end of June, with the updated EU Capital Requirements Regulation, CRR II, increasing the leverage ratio by 8.8 percentage points. MuniFin fulfils the CRR II definition of a public development credit institution and may therefore deduct all credit receivables from the central government and municipalities in the calculation of its leverage ratio.
• At the end of June, the Group’s CET1 capital ratio remained very strong, 91.1% (104.3%). Tier 1 and total capital ratio were 114.7% (132.7%). The new CRR II regulation lowered the capital ratio mainly due to the changes in calculation of counterparty credit risk and CVA VaR. CET1 capital ratio nevertheless exceeded the total requirement of 13.4% by almost seven times with capital buffers accounted for.
In brief: MuniFin Group in the first half of 2021
• In early 2021, the Finnish economy began to recover from the COVID-19 pandemic. The demand for financing in the municipal sector remained lower than expected due to surprisingly good economic development and the Government’s temporary COVID-19 recovery measures in 2020. Nevertheless, the pandemic had only a minor effect on the Group’s net operating profit and capital adequacy.
• Long-term customer financing, including both long-term loans and leased assets was EUR 28,582 million (EUR 28,022 million) at the end of the reporting period and it grew by 2.0% (7.8%). New lending in January–June amounted to EUR 1,601 million (EUR 2,543 million). The loan portfolio’s growth trend returned to normal levels from the previous year, which saw particularly strong growth due to the COVID-19 pandemic. Short-term customer financing reached EUR 1,482 million (EUR 1,310 million) and grew by 13.1% (139.0%) from the comparison period.
• At the end of June, of all long-term customer financing, the amount of green finance aimed at environmentally sustainable investments totalled EUR 2,120 million (EUR 1,786 million) and the amount of social finance aimed at investments promoting equality and communality totalled EUR 833 million (EUR 589 million). Green and social finance have been well received by customers and the amount of finance increased by 24.3% from year-end.
• In January–June, new long-term funding reached EUR 6,025 million (EUR 5,504 million). At the end of June, total funding was EUR 40,281 million (EUR 38,139 million), of which long-term funding made up for EUR 36,436 million (EUR 34,243 million).
• The Group’s liquidity has remained at a very good level. At the end of June, total liquidity amounted to EUR 11,736 million (EUR 10,089 million). The Liquidity Coverage Ratio (LCR) stood at 300.2% (264.4%) and the Net Stable Funding Ratio (NSFR) at 122.7% (116.4%).
• In March 2021, the Annual General Meeting authorised the Board of Directors to decide on the dividend payment of a maximum of EUR 0.52 per share, totalling EUR 20,313,174.96. This authorisation is valid until the next Annual General Meeting. The Group follows the ECB’s recommendation on dividend distribution, which allows for dividend distribution after 30 September 2021. MuniFin’s Board of Directors refrains from deciding on the distribution of dividends before the recommendation is lifted.
• Changes to the outlook for the second half of 2021: The Group expects its net operating profit excluding unrealised fair value changes to remain at the same level as or higher than in 2020 (Financial Statements Bulletin 2020: at the same level). A more detailed outlook is presented in the section Outlook for the second half of 2021.
Comparison figures deriving from the income statement and figures describing the change during the reporting period are based on figures reported for the corresponding period in 2020. Comparison figures deriving from the balance sheet and other cross-sectional items are based on the figures of 31 December 2020 unless otherwise stated.
In brief Operating environment Primary statements Notes 2/111M
unic
ipal
ity F
inan
ce P
lc •
Hal
f Yea
r Rep
ort
1 J
anua
ry–3
0 J
une
20
21

Key figures (Group)
108 28.6
1.6Net operating profit excluding unrealised fair value changes (EUR million)
Long-term customer finance (EUR billion)
New lending (EUR billion) Key figures (Group)
91.1CET1 capital ratio, %
In brief Operating environment Primary statements Notes 3/111M
unic
ipal
ity F
inan
ce P
lc •
Hal
f Yea
r Rep
ort
1 J
anua
ry–3
0 J
une
20
21

Key figures (group)
GROUP’S KEY FIGURES 30 JUN 21 30 JUN 2020 31 DEC 2020
Net operating profit excluding unrealised fair value changes (EUR million)* 108 93 197
Net operating profit (EUR million)* 127 62 194
Net interest income (EUR million)* 138 123 254
New lending (EUR million)* 1,601 2,543 4,764
Long-term customer finance (EUR million)* 28,582 26,743 28,022
New long-term funding (EUR million)* 6,025 5,504 10,966
Balance sheet total (EUR million) 45,658 41,288 44,042
CET1 capital (EUR million) 1,346 1,172 1,277
Tier 1 capital (EUR million) 1,694 1,519 1,624
Total own funds (EUR million) 1,694 1,519 1,624
CET1 capital ratio, %** 91.1 87.8 104.3
Tier 1 capital ratio, %** 114.7 113.8 132.7
Total capital ratio, %** 114.7 113.8 132.7
Leverage ratio, %** 12.6 3.8 3.9
Return on equity (ROE), %* 11.7 6.2 9.4
Cost-to-income ratio* 0.2 0.3 0.2
Personnel 163 167 165
* Alternative performance measure. For more information on alternative performance measures, see pages 37–42.** Figures for the reporting period calculated in accordance with CRR II. Comparison periods have not been adjusted to reflect the updated capital requirements regulation.
The calculation formulas for all key figures can be found on pages 37–43. All figures presented here in this Half Year Report are those of MuniFin Group, unless otherwise stated.
In brief Operating environment Primary statements Notes 4/111M
unic
ipal
ity F
inan
ce P
lc •
Hal
f Yea
r Rep
ort
1 J
anua
ry–3
0 J
une
20
21

0
20
40
60
80
100
120
6/20216/20206/20196/20186/2017
89 93 90 93
108
0
5
10
15
20
25
30
6/202120206/20202019201820172016
21 22 2325
27 2829
0
20
40
60
80
100
120
6/202120206/20202019201820172016
46.253.0
66.3
83.1 87.8
104.3
91.1
Net operating profit excluding unrealised fair value changes (EUR million) *
CET1 capital ratio, % **
Long-term customer finance (EUR billion) * New lending (EUR billion) *
Key figures (group)
0
1
2
3
4
6/20216/20206/20196/20186/2017
1.0 1.21.4
2.5
1.6
* Alternative performance measure. For more information on alternative performance measures, see pages 37–42.
** Figures for the reporting period calculated in accordance with CRR II. Comparison periods have not been adjusted to reflect the updated capital requirements regulation.
In brief Operating environment Primary statements Notes 5/111M
unic
ipal
ity F
inan
ce P
lc •
Hal
f Yea
r Rep
ort
1 J
anua
ry–3
0 J
une
20
21

The COVID-19 pandemic continued to cast a shadow on the first half of 2021. In early spring, Finland’s COVID-19 situation aggravated rapidly, but the spike in infection rates was soon contained. In the summer, infection rates returned to clear growth, but the number of people in need of hospital care seems to have remained relatively stable as vaccinations progressed. The general economic situation began to improve markedly in the second quarter, and economic growth is expected to only increase. The labour market has also recovered from the pandemic better than expected.
MuniFin is by far the largest single provider of financing for its customer segment and retained its strong position also in the first half of 2021. MuniFin’s new lending in January–June was clearly at a lower level than in comparison period. The municipal sector’s demand for financing was lower in the first half of 2021 than it was in the comparison period, but the demand for financing for state-subsidised housing production remained stable.
In 2020, municipalities reached a better financial performance than expected thanks to the Government’s COVID-19 support package and increased tax revenues. As a result, the financing needs of municipalities were lower in the reporting period than they were last year.
CEO’s review
CEO’s review
In brief Operating environment Primary statements Notes 6/111M
unic
ipal
ity F
inan
ce P
lc •
Hal
f Yea
r Rep
ort
1 J
anua
ry–3
0 J
une
20
21
CEO’s review
However, the investment needs of municipalities remain high, and Finland’s upcoming health and social services reform is unlikely to make the situation much easier. In addition, structural problems that were temporarily pushed aside because of the pandemic will still need to be addressed. Ageing population and migration to growth centres are causing financial difficulties for many municipalities. As new municipal councils begin their term in August, council members are faced with the responsible task of i.e. finding new forms of intermunicipal collaboration to tackle challenges caused by these structural problems, while also working to build a more ecologically and socially sustainable municipality.
After a lengthy process, the Finnish Parliament passed the health and social services reform bill in June. The reform will transfer the responsibility for organising healthcare and social welfare from municipalities to larger autonomous regions known as the wellbeing services counties. This will affect different-sized municipalities in different ways, especially in the long-term.
Changes to the regulation of banks’ capital adequacy applied in June 2021 increase the leverage ratio of public development credit institutions, also for MuniFin, and effect the capital requirement, thus lowering the profit requirement required to maintain a strong capital level.
Our customers have continued to show increased interest in our sustainable finance products. The social finance that we launched last year has proved highly welcome. Municipalities play a vital role in the achievement of climate goals, and they have indeed done innovative work in limiting carbon dioxide emissions. MuniFin’s other sustainable finance product, green finance, offers a concrete tool for this work, and it was also actively sought by municipalities in the first half of 2021.
Our funding activities in January–June were highly successful. Thanks to the stimulus policies of central banks, liquidity was easily available and we managed to acquire affordable funding for our customers from the international capital markets.
MuniFin’s restructuring process was launched last year and has progressed according to plan. When we began work this year, we did so in a restructured organisation. We are continuously developing new working methods and digital tools to offer our customers even better service. The process of change is long and challenging in many ways, but we believe that it is vital to renew and continue to develop our operations to ensure that we can stay on our chosen path also in the future.
I wish to thank our customers for successful collaboration and our staff for excellent work amidst remote working conditions and changes.
Esa KallioPresident and CEOMuniFin
In brief Operating environment Primary statements Notes 7/111M
unic
ipal
ity F
inan
ce P
lc •
Hal
f Yea
r Rep
ort
1 J
anua
ry–3
0 J
une
20
21

MuniFin Groupperformance for the reporting period 1 January–30 June 2021
MuniFin Group performance for the reporting period 1 January–30 June 2021
In brief Operating environment Primary statements Notes 8/111M
unic
ipal
ity F
inan
ce P
lc •
Hal
f Yea
r Rep
ort
1 J
anua
ry–3
0 J
une
20
21

Contents
8 MuniFin Group performance for the reporting period 1 January–30 June 2021
10 Operating environment in the first half of 2021
11 Effects of the COVID-19 pandemic on the MuniFin Group
12 Effects of the health and social services reform on MuniFin Group
13 Information on the Group results
16 Information on the consolidated statement of financial position
17 Financing and other services for customers
19 Funding and liquidity management
20 MuniFin’s credit ratings
21 Capital adequacy
29 Risk management
32 Governance
33 Events after the reporting period
34 Outlook for the second half of 2021
35 The Group’s development
37 Key figures
44 MuniFin Group’s Half Year Report 1 January–30 June 2021
45 Consolidated income statement
46 Statement of comprehensive income
47 Consolidated statement of financial position
49 Consolidated statement of changes in equity
51 Consolidated statement of cash flows
52 Notes to the Half Year Report
In brief Operating environment Primary statements Notes 9/111M
unic
ipal
ity F
inan
ce P
lc •
Hal
f Yea
r Rep
ort
1 J
anua
ry–3
0 J
une
20
21

The improved outlook in real economy and the increased inflation expectations raised long-term interest rates in the interest rate market.
Operating environment in the first half of 2021
Operating environment in the first half of 2021
In the US, President Joe Biden heavily increased public stimulus measures immediately after his inauguration. With the US and China leading the way, world trade began to pick up, boosting economic recovery also in Europe and developing markets. The global outlook for the industrial sector has in fact been improving ever since last autumn.
The Finnish economy dwindled somewhat in the first quarter of the year, but Finland continued to suffer less than the euro area on average. This is explained by lower infection rates than in the rest of Europe and by the resulting lighter government restrictions. After the lockdown period in March, Finland’s economic activity began to pick up significantly. The best news in early 2021 was that investments took an upward turn on a broad front, signalling that Finnish companies are now more confident about the future.
The asynchronous revival of supply and demand caused consumer prices to rise in the first half of the year. The price of energy and raw materials recovered from last year’s collapse, also increasing inflation rates. The extremely heavy financial policy recovery measures enforced in the US further contributed to the growing inflationary pressures.
The improved outlook in real economy and the increased inflation expectations raised long-term interest rates in the interest rate market. In the US, interest rate levels took an upward turn last autumn, but in Europe, sovereign debt interest rate levels only started rising in early 2021. Despite rising inflation, the increase in long-term interest rates subsided temporarily towards the end of the second quarter.
Operating environment in the first half of 2021
Waves of the COVID-19 pandemic continued to have a strong global influence on the economic environment, although this year has avoided the sudden halt experienced in the spring of 2020. Pandemic restrictions hampered business especially in the service sector and suppressed household consumption. But as vaccination programmes proceeded and infection rates declined, restrictions were gradually eased in the spring, which resulted in recovering economic activity in almost every Western country.
In brief Operating environment Primary statements Notes 10/111M
unic
ipal
ity F
inan
ce P
lc •
Hal
f Yea
r Rep
ort
1 J
anua
ry–3
0 J
une
20
21

Effects of the COVID-19 pandemic on MuniFin Group
The outbreak of the COVID-19 pandemic and the resulting economic uncertainty increased MuniFin Group’s business volumes significantly last year. In the first half of 2021, business growth returned to normal levels and the pandemic had only a limited effect on the Group’s financial position. The Group’s staff followed the national recommendation and mostly worked remotely in the first half of the year.
At the early stages of the COVID-19 crisis in the first half of 2020, the pandemic significantly accelerated the growth of MuniFin’s customer financing. In the first half of 2021, however, the municipal sector’s demand for financing was moderate in comparison, falling back from the spike in demand seen a year ago caused by the COVID-19 pandemic. The Government’s COVID-19 support package in 2020 temporarily improved the financial position of municipalities, and because the economic situation of municipalities has been better than expected, the demand for financing has been lower. The pandemic’s effects on the demand for state-subsidised housing finance have remained minor throughout the crisis. As a whole, the demand for financing has returned to its normal level.
The Group’s funding has been highly successful even in the exceptional circumstances caused by the pandemic. The
situation in the funding market has now stabilised from that experienced in the beginning of the pandemic.
The Group has protected the health and safety of its staff and the continuity of its operations by adhering to the national recommendation to work remotely. This has in part ensured the continuity of MuniFin’s socially essential services and business processes also during the crisis. The Group has begun to prepare for the partial return to the office when the national remote work recommendation is lifted.
To facilitate customers’ access to services while the restriction measures are in force, the Group has further developed its digital services and their user support. MuniFin has also held several online events for customers and other stakeholder groups on themes related to the economic outlook and its effects on municipal finances.
Individual MuniFin Group customers have run into financial difficulties due to the COVID-19 pandemic. If the pandemic has temporarily impacted customers’ repayment ability, MuniFin Group has offered them repayment holidays and made concessions to the payment terms of their loans. However, the demand for such arrangements has been modest
and in January–June 2021 the Group granted only a few concessions. MuniFin Group’s total credit risk has remained low, and the amount of expected credit losses calculated according to IFRS 9 standard also remains low. The Group’s customer exposures have zero risk weight in MuniFin Group’s capital adequacy calculation because they are from Finnish municipalities or involve a municipal guarantee or a state deficiency guarantee supplementing the real estate collateral. Based on the management’s assessment, all receivables from customers will be fully recovered and no final credit losses are therefore expected. More information on forbearance measures and expected credit losses is available in Note 9 of this report.
In order to secure the banking sector’s ability to continue financing its customers in exceptional circumstances, the banking authorities have eased some requirements for supervised banks. Most of these concessions were no longer applicable in this reporting period. Regardless of the underlying conditions, MuniFin Group’s capital adequacy ratios remain strong. More information on the applied concessions and their effects are provided in the Capital adequacy section of this report.
Effects of the COVID-19 pandemic on MuniFin Group
Effects of the COVID-19 pandemic on the MuniFin Group
In brief Operating environment Primary statements Notes 11/111M
unic
ipal
ity F
inan
ce P
lc •
Hal
f Yea
r Rep
ort
1 J
anua
ry–3
0 J
une
20
21

Effects of the health and social services reform on MuniFin Group
After a lengthy preparation process, the Finnish Parliament passed the legislative package concerning the reform of health and social services. The reform will not have a significant effect on MuniFin Group operations in 2021. In 2022, the reform will be reflected in the Group’s operations more as practical preparation rather than financial effects.
In terms of financing, the new legislation is meant to allow MuniFin to continue to act as a lender/counterparty to the loans and other liabilities that will be transferred to the soon-to-be-established wellbeing services counties. It is in the interest of the reform of health and social services and its various counterparties, that the existing health and social services lending portfolio will not be substantially altered. At this stage, the wellbeing services counties will be largely funded by the central government, but the counties will have government authorisation and guarantees for borrowing. The recently passed bill does not yet allow MuniFin to finance new investments (made after 1 January 2023) in the wellbeing services counties. However, according to the government’s proposal for the health and social services reform package, this is the intention, but the matter is still being prepared and the related draft legislative proposal is currently under discussion.
The practical implementation of the reform still includes some details that make it impossible to estimate the reform’s effects in more detail. In MuniFin’s financing operations, health and social services lending plays such a role that changes in it will not have a material impact on MuniFin’s financial development in the near future.
Effects of the health and social services reform on MuniFin Group
Effects of the health and social services reform on MuniFin Group
In brief Operating environment Primary statements Notes 12/111M
unic
ipal
ity F
inan
ce P
lc •
Hal
f Yea
r Rep
ort
1 J
anua
ry–3
0 J
une
20
21

Information on the Group results
The sum of individual results may differ from the displayed total due to rounding. Changes of more than 100% are shown as >100% or <-100%.
Information on the Group results
CONSOLIDATED INCOME STATEMENT
(EUR million) 01–06/2021 01–06/2020 Change, % 01–12/2020
Net interest income 138 123 12.0 254
Other income 3 1 >100 2
Income excluding unrealised fair value changes 142 125 13.5 257
Commission expenses -2 -2 0.1 -5
Personnel expenses -9 -9 4.3 -18
Other items in administrative expenses -9 -7 26.1 -15
Depreciation and impairment on tangible and intangible assets -3 -3 2.0 -6
Other operating expenses -11 -11 -1.1 -15
Costs -34 -32 6.7 -58
Credit loss and impairments on financial assets 0 0 <-100 -1
Net operating profit excluding unrealised fair value changes 108 93 15.6 197
Unrealised fair value changes 20 -31 >100 -3
Net operating profit 127 62 >100 194
Profit for the period 102 50 >100 155
Group’s net operating profit excluding unrealised fair value changes
The Group’s business operations remained strong in the first half of 2021. The Group’s net operating profit excluding unrealised fair value changes was EUR 108 million (EUR 93 million). The growth was 15.6% (3.6%). Income excluding unrealised fair value changes was EUR 142 million (EUR 125 million) and grew by 13.5% (3.6%). The COVID-19 pandemic accelerated business growth, especially in the first half of 2020, and has contributed to low interest rates, thereby increasing net interest income. Costs grew as expected up to EUR 34 million (EUR 32 million) and increased by 6.7% (3.2%). During the comparison period, the pandemic slowed down the growth of costs, resulting in unusually low costs for 2020. In early 2021, costs started to increase again, but considerably more slowly than before the pandemic. Overall, the pandemic did not have a significant negative effect on MuniFin Group’s core business and profitability during the reporting period.
Information on the Group results
In brief Operating environment Primary statements Notes 13/111M
unic
ipal
ity F
inan
ce P
lc •
Hal
f Yea
r Rep
ort
1 J
anua
ry–3
0 J
une
20
21

Net interest income totalled EUR 138 million (EUR 123 million) and it grew by 12.0% (5.3%) This growth resulted from increased customer financing, successful funding operations and a favourable interest rate environment. The Group’s net interest income does not recognise the interest expenses of EUR 8 million of the AT1 capital instrument through profit or loss, as the capital loan is treated as an equity instrument in the consolidated accounts. The interest expenses of the capital loan are treated similarly to dividend distribution; that is, as a decrease in retained earnings under equity upon realisation of interest payment on an annual basis.
Other income in the first half of 2021 amounted to EUR 3.4 million (EUR 1.4 million). This includes fee and commission income, realised net income from securities and foreign exchange transactions, net income from financial assets measured at fair value through other comprehensive income, and other operating income. Also included in other profit is the turnover of MuniFin’s subsidiary company Financial Advisory Services Inspira.
Commission expenses totalled EUR 2.4 million (EUR 2.4 million) and consisted primarily of paid guarantee fees, custody fees and fees of the funding programmes.
Administrative expenses reached EUR 18 million (EUR 16 million) and increased by 13.9% (-0.1%). Of this, personnel expenses comprised EUR 9.1 million (EUR 8.8 million) and other administrative expenses EUR 8.7 million (EUR 6.9
million). Personnel expenses increased by 4.3%. During the reporting period, there were no significant changes in employee numbers and the average number of employees in the Group was 161 (167). Salary and pension costs have grown moderately during the reporting period.
Other items in administrative expenses grew by 26.1% during the reporting period. The COVID-19 pandemic has reduced certain types of expenditure, such as travelling expenses, but on the other hand, the Group has invested heavily in the development of information systems, such as the loan lifecycle management system. In 2019, the MuniFin Group signed outsourcing agreements for IT end-user and infrastructure services as well as the operation of the business IT systems to improve operational reliability and the availability of services. The practical implementation of the outsourcing agreements has taken several steps forward during the reporting period and all significant tasks are now complete. Remaining tasks are expected to be finalised in the second half of 2021.
During the reporting period, depreciation and impairment of tangible and intangible assets reached EUR 2.9 million (EUR 2.8 million). The Group invests significantly in IT systems and business operations, which increases the amount of depreciation.
Other operating expenses remained at the same level, at EUR 10.6 million (EUR 10.7 million). Fees collected by authorities were EUR 7.8 million (EUR 6.3 million) and increased by 23.6%
(16.1), mainly due to an increase in the contribution to the Single Resolution Fund, which grew by 30.5% to EUR 6.7 million (EUR 5.2 million). These fees excluded, other expenses were EUR 2.7 million (EUR 4.3 million) and decreased by 37.3% (-19,5%), mostly due to smaller purchases of external services compared to the corresponding period in 2020.
The amount of expected credit losses (ECL), calculated according to IFRS 9, increased slightly to EUR -0.1 million (EUR 0.0 million) during the reporting period. MuniFin Group has updated the scenarios and weights used to calculate ECL. These are reported in more detail in Note 9.
MuniFin Group has recorded in financial year 2020 an additional discretionary provision (management overlay) of EUR 0.3 million to take into account the financial effects of the COVID-19 pandemic. The year 2020 and early 2021 were financially exceptionally weak for certain customer segments, such as the cultural sector and the sports activities. However, the deteriorating financial situation is not yet reflected in MuniFin Group’s internal risk ratings, which have been mainly updated based on the 2019 financial statements. As the creditworthiness of certain customer segments is estimated to have decreased since then, MuniFin Group’s management decided to record an additional discretionary provision based on a group-specific assessment. Even though the financial situation of MuniFin Group’s customers has improved during the reporting period, some uncertainty still remains. The Group’s
Information on the Group results
In brief Operating environment Primary statements Notes 14/111M
unic
ipal
ity F
inan
ce P
lc •
Hal
f Yea
r Rep
ort
1 J
anua
ry–3
0 J
une
20
21

management therefore decided to keep the additional discretionary provision in place for this period as well.
The Group’s overall credit risk position has remained low. According to the management’s assessment, all receivables will be recovered in full and no final credit loss will therefore arise, because the receivables are from Finnish municipalities, or they are accompanied by a securing municipal guarantee or a state deficiency guarantee. During the Group’s history of more than 30 years, it has never recognised any final credit losses in its customer financing.
At the end of June 2021, the Group had a total of EUR 23 million (EUR 24 million) of guarantee receivables from public sector entities due to customer insolvency. The credit risk of the liquidity portfolio has remained at a good level, its average credit rating being AA+. More information on the credit risks of financial assets and other commitments are available in Note 9.
Group’s profit and unrealised fair value changes
The Group’s net operating profit was EUR 127 million for the first half of 2021 (EUR 62 million). During the reporting period, unrealised fair value changes improved the Group’s result by EUR 20 million, while a year earlier they weakened the result by EUR 31 million. Net income from hedge accounting amounted to EUR 4.9 million (EUR -1.6 million) and unrealised net income
from securities transactions to EUR 15 million (EUR -29 million).
The Group’s effective tax rate was 20.0% (20.0%) in the reporting period. Taxes in the consolidated income statement amounted to EUR 26 million (EUR 12 million). After taxes, the Group’s profit for January–June was EUR 102 million (EUR 50 million). The Group’s return on equity (ROE) was 11.7% (9.4%). Excluding unrealised fair value changes, the ROE was 9.9% (9.6%).
The Group’s other comprehensive income includes unrealised fair value changes of EUR -2.4 million (EUR -19 million). During the reporting period, the most significant item affecting the other comprehensive income was the fair value change due to changes in own credit risk of financial liabilities designated at fair value through profit or loss, EUR -4.2 million (EUR 22 million). The cost-of-hedging totalled EUR 2.1 million (EUR -40 million).
On the whole, unrealised fair value changes net of deferred tax affected the Group’s equity by EUR 14 million (30 Jun 2020: EUR -40 million) and CET1 capital net of deferred tax in capital adequacy by EUR 17 million (30 Jun 2020: EUR -57 million). The cumulative effect of unrealised fair value changes on the MuniFin Group’s own funds in capital adequacy calculations was EUR 29 million (30 Jun 2020: EUR -30 million).Unrealised fair value changes reflect the temporary impact
of market conditions on the valuation levels of financial instruments at the reporting time. The value changes may vary significantly from one reporting period to another, causing volatility in profit, equity and own funds in capital adequacy calculations. The effect on individual contracts will be removed by the end of the contract period.
In accordance with its risk management principles, MuniFin Group uses derivatives to financially hedge against interest rate, exchange rate and other market and price risks. Cash flows under agreements are hedged, but due to the generally used valuation methods, changes in fair value differ between the financial instrument and the respective hedging derivative. Changes in the shape of the interest rate curve and credit risk spreads in different currencies affect the valuations, which cause the fair values of hedged assets and liabilities and hedging instruments to behave in different ways. In practice, the changes in valuations are not realised on a cash basis because the Group almost always holds financial instruments and their hedging derivatives until the maturity date. Changes in credit risk spreads are not expected to materialise as credit losses for the Group, because the Group’s liquidity reserve has been invested in instruments with low credit risk. In the reporting period, unrealised fair value changes were influenced in particular by changes in interest rate expectations and credit risk spreads in the Group’s main funding markets.
Information on the Group results
In brief Operating environment Primary statements Notes 15/111M
unic
ipal
ity F
inan
ce P
lc •
Hal
f Yea
r Rep
ort
1 J
anua
ry–3
0 J
une
20
21

CONSOLIDATED STATEMENT OF FINANCIAL POSITION 30 Jun 2021 31 Dec 2020 Change, %
(EUR million)
Cash and balances with central banks 7,683 5,566 38.0
Loans and advances to credit institutions 1,513 1,842 -17.9
Loans and advances to the public and public sector entities 28,582 28,022 2.0
Debt securities 5,464 5,763 -5.2
Derivative contracts 1,916 2,358 -18.8
Other items included in the assets 501 491 1.9
Total assets 45,658 44,042 3.7
Liabilities to credit institutions 2,592 2,001 29.5
Liabilities to the public and public sector entities 3,614 3,884 -6.9
Debt securities issued 34,607 32,912 5.2
Derivative contracts 2,274 2,861 -20.5
Other items included in the liabilities 778 679 14.5
Total equity 1,793 1,705 5.1
Total liabilities and equity 45,658 44,042 3.7
Information on the consolidated statement of financial position
Information on the consolidated statement of financial position
The Group’s consolidated statement of financial position totalled EUR 45,658 million (EUR 44.042 million) and saw 3.7% of growth in the first half of 2021. The increase in assets is mainly due to growth in deposits to the central bank and in long-term loan portfolio and leased assets as well in the growth of short-term lending. The increase in liabilities is due to liabilities to the credit institutions and in the amount of issued bonds.
At the end of June, MuniFin Group’s equity stood at EUR 1,793 million (EUR 1,705 million), including the AT1 capital loan of EUR 347 million (EUR 347 million). The reporting period’s profit increased the equity. In addition, in the consolidated accounts, interest expenses amounting to EUR 12.6 million (EUR 12.6 million) net of deferred tax on the AT1 capital instrument were deducted from the equity upon the realisation of the interest payment in April.
Information on the consolidated statement of financial position
In brief Operating environment Primary statements Notes 16/111M
unic
ipal
ity F
inan
ce P
lc •
Hal
f Yea
r Rep
ort
1 J
anua
ry–3
0 J
une
20
21

MuniFin Group’s customers include municipalities, joint municipal authorities and municipality-controlled entities, as well as non-profit housing organisations and non-profit housing projects nominated by the Housing Finance and Development Centre of Finland (ARA).
In the first half of 2021, the demand for financing in municipal sector was moderate, returning to normal levels from the spike created by the COVID-19 pandemic a year earlier. The Government’s COVID-19 support package in 2020 temporarily improved the financial position of municipalities, and because the economic situation of municipalities has been better than expected, the demand for financing has been lower.
MuniFin is by far the largest single provider of financing for its customer segment and retained its strong position also in the first half of 2021. Demand for MuniFin’s financing clearly decreased during the first half of the year and new lending was EUR 1,601 million (EUR 2,543 million), marking a return to a normal level after the unusually high demand of 2020 due to the COVID-19 pandemic.
Financing and other services for customers
Financing and other services for customers
New lending (EUR million)
Long-term customer finance (EUR million)
1,601
28,582
Financing and other services for customers
In brief Operating environment Primary statements Notes 17/111M
unic
ipal
ity F
inan
ce P
lc •
Hal
f Yea
r Rep
ort
1 J
anua
ry–3
0 J
une
20
21

The housing sector was highly active in the reporting period. In particular, green and social finance attracted interest among MuniFin’s customers.
The Group’s long-term customer financing was EUR 28,582 million (28,022 million) at the end of June and it grew by 2.0% (7.8%). Long-term customer financing includes both long-term loans and leased assets. Long-term customer financing excluding unrealised fair value changes was EUR 28,279 million (27,511 million) and increased by 2.8% (7,3%). Short-term financing in municipal commercial papers grew, totalling EUR 1,482 million at the end of June (EUR 1,310 million).
Customer interest in sustainable finance products continued to increase. MuniFin grants green finance to investments that produce clear and measurable environmental benefits. Of long-term customer financing, green finance accounted for EUR 2,120 million (EUR 1,786 million) at the end of the reporting period. Projects funded with the Group’s social finance produce widespread social benefits and promote equality, communality, welfare or regional vitality. Social finance accounted for EUR 833 million (EUR 589 million) of long-term customer financing. MuniFin puts forward suitable projects to evaluation teams comprised of independent experts outside the Group, which then decide which projects are granted green and social finance.
Subsidiary company Inspira specialises in financial advisory services. In the reporting period, turnover decreased, and Inspira focused on improving its service offering and introduced development projects for more comprehensive financial design.
MuniFin Group offers its customers a wide range of tools for financial management, forecasting, modelling and reporting, and their user base has been growing steadily. The COVID-19 pandemic has increased the need to use the Group’s digital services in remote working contexts. The Group has continued to develop its digital services and the digitalisation of its financing process in order to make the customer experience even more user-friendly and efficient. MuniFin Group’s online events, digital training sessions and economic reports have gained a firm foothold and attract large audiences from one month to another.
The Group has decided to change also the conditions of its long-term customer loans with variable interest rates so that its customers will benefit from negative reference rates more than before. The change will take effect during the fall and it will not significantly affect MuniFin Group’s results for 2021. Whether it will affect the Group’s results in the near future, will depend on the development of market interest rates. This change became possible thanks to the CRR II regulation that entered into force
at the end of June and recognised MuniFin’s role as a public development credit institution, substantially decreasing the total exposure of leverage ratio.
Financing and other services for customers
Long-term loan portfolio by customer type 30 Jun 2021, %
47
34
13
6
Housing corporationsMunicipalitiesMunicipalities-controlled entitiesJoint municipal authorities
In brief Operating environment Primary statements Notes 18/111M
unic
ipal
ity F
inan
ce P
lc •
Hal
f Yea
r Rep
ort
1 J
anua
ry–3
0 J
une
20
21

Capital markets remained stable in the reporting period despite the prolonged COVID-19 pandemic. Substantial stimulus measures by banks and governments continued to support strong economic growth and improve market sentiment.Despite the exceptional circumstances, MuniFin Group has been able to fulfil its core mandate, which is to offer funding for its customers under all market conditions.
The Group’s funding strategy relies on wide diversification. In addition to operating at the benchmark bond market, MuniFin Group diversifies into multiple currencies, maturities and markets, ensuring access to funding in all situations.
MuniFin’s benchmark bonds were highly successful in the reporting period. MuniFin issued one five year bond of USD 1.5 billion, and euro-denominated bonds of 0.5 and 1 billion maturing in seven and ten years. All of the benchmark bonds were in high demand, their order books were oversubscribed and their pricing was very competitive.
In June, MuniFin also participated in the ECB’s third series of targeted longer-term refinancing operations (TLTRO III) with EUR 750 million, which partly enabled to ensure customer financing on competitive terms. At the end of June, MuniFin’s targeted long-term refinancing totalled EUR 2.0 billion.
Varainhankinta ja likviditeetin hallinta
Funding and liquidity management
Funding and liquidity management
Total liquidity(EUR million)
ESG score
11,736
58.5(0–100)
In brief Operating environment Primary statements Notes 19/111M
unic
ipal
ity F
inan
ce P
lc •
Hal
f Yea
r Rep
ort
1 J
anua
ry–3
0 J
une
20
21

MuniFin Group acquires its funding from the international capital market. In the reporting period, the Group’s new long-term funding totalled EUR 6,025 million (EUR 5,504 million). A total of 113 (110) long-term funding arrangements were made in 8 different currencies (10). The Group uses derivatives to hedge against market risks.
At the end of June, MuniFin Group’s total funding amounted to EUR 40,281 million (EUR 38,139 million), of which Euro Commercial Papers (ECPs) totalled EUR 3,845 million (EUR 3,896 million).
The Group’s liquidity has remained excellent. At the end of June 2021, the Group’s total liquidity amounted to EUR 11,736 million (EUR 10,089 million). Of this, central bank deposits totalled EUR 7,722 million (EUR 5,601 million) and
investments in liquid, low-risk securities totalled EUR 3,982 million (EUR 4,453 million) with the average credit rating of AA+ (AA+) and average maturity of 2.9 years (2.8). In addition to this, money market deposits in credit institutions totalled EUR 32 million (EUR 35 million).
The Group actively monitors and improves the sustainability of its funding and investments. In addition to low credit risk and high liquidity, MuniFin Group monitors the sustainability of its liquidity investments through ESG (Environmental, Social and Governance) scores. At the end of June 2021, liquidity investments had an average ESG score of 58.5 (55.7) on a scale of 1–100, well above the benchmark index of 55.4 (53.3). MuniFin Group also holds socially responsible investments (SRIs), totalling EUR 405 million (EUR 355 million) at the end of June.
Varainhankinta ja likviditeetin hallinta
MuniFin’s credit ratings
MuniFin’s credit ratings correspond to those of the Government of Finland. The credit ratings did not change in the reporting period. MuniFin’s funding is guaranteed by the Municipal Guarantee Board, which has credit ratings corresponding to MuniFin’s credit ratings.
MuniFin’s credit ratings
Moody’s Investors Service
Long-term
funding
Short-term
funding
Short-termfunding
Outlook
Stable
Outlook
Stable
P-1
Long-term
funding
Standard & Poor’s
A-1+
In brief Operating environment Primary statements Notes 20/111M
unic
ipal
ity F
inan
ce P
lc •
Hal
f Yea
r Rep
ort
1 J
anua
ry–3
0 J
une
20
21

Capital adequacy
Capital adequacy
MuniFin Group’s capital adequacy
At the end of the reporting period, the Group’s total capital ratio was 114.7% (132.7%) and its CET1 capital ratio was 91.1% (104.3%). The CRR II regulation applied at the end of June 2021 had a depressing effect on capital adequacy, especially due to the changes in the standardised method for measuring counterparty credit risk (SA-CCR) and the credit valuation adjustment risk (CVA VaR). This impact was much bigger than previously estimated. The comparison period has not been adjusted to reflect the updated capital requirements regulation. The Group’s CET1 capital ratio, 91.1%, was almost seven times the required minimum capital requirement that takes capital buffers into account.
Own funds (EUR million)CET1 capital ratio, %Total capital ratio, %
Group’s own funds and capital adequacy
* Figures for the reporting period calculated in accordance
with CRR II. Comparison periods have not been adjusted to
reflect the updated capital requirements regulation.
Capital adequacy
0
200
400
600
800
1,000
1,200
1,400
1,600
1,800
30
50
70
90
110
130
150
12/2016 12/2017 12/2018 12/2019 12/2020 06/2021 *
66.972.5
88.0
107.9
132.7
114.7
46.253.0
66.3
83.1
104.3
91.1
1,1241,124
1,2931,293
1,4131,4131,5101,510
1,6241,6241,6941,694
EUR million %
In brief Operating environment Primary statements Notes 21/111M
unic
ipal
ity F
inan
ce P
lc •
Hal
f Yea
r Rep
ort
1 J
anua
ry–3
0 J
une
20
21

Capital adequacy
At the end of the reporting period, the Group’s CET1 capital totalled EUR 1,346 million (EUR 1,277 million) and Tier 1 capital EUR 1,694 million (EUR 1,624 million). The Group had no Tier 2 capital. The Group’s own funds totalled EUR 1,694 million (EUR 1,624 million).
CET1 capital includes profit for the period of 1 January–30 June 2020. The profit has been subject to a review by auditors and can therefore be included in CET1 capital based on the permission granted by the ECB in accordance with the Capital Requirements Regulation.
MuniFin Group applies the core approach for additional valuation adjustment (AVA) in prudent valuation. At the end of 2020, the Group applied the Commission’s Delegated Regulation that relaxed the aggregation factor that is applied in certain valuations in the AVA calculation. The aggregation factor was returned to its previous level at the start of 2021, and at the end of the reporting period, the Group deducted the prudent valuation adjustment from its CET1 capital in full. At the end of December 2020, this temporary relief had a EUR 8 million effect on the Group’s own funds.
CONSOLIDATED OWN FUNDS 30 Jun 2021 31 Dec 2020
(EUR 1,000)
Common Equity Tier 1 capital before adjustments 1,401,521 1,328,150
Adjustments to Common Equity Tier 1 capital -55,267 -51,338
Common Equity Tier 1 capital (CET1) 1,346,255 1,276,812
Additional Tier 1 capital before adjustments 347,454 347,454
Adjustments to Additional Tier 1 capital - -
Additional Tier 1 capital (AT1) 347,454 347,454
Tier 1 capital (T1) 1,693,708 1,624,265
Tier 2 capital before adjustments - -
Adjustments to Tier 2 capital - -
Tier 2 capital (T2) - -
Total own funds 1,693,708 1,624,265
In brief Operating environment Primary statements Notes 22/111M
unic
ipal
ity F
inan
ce P
lc •
Hal
f Yea
r Rep
ort
1 J
anua
ry–3
0 J
une
20
21

Capital adequacy
The Group’s total risk exposure amount increased by 20.7% from the end of 2020, totalling EUR 1,447 million (EUR 1,224 million) at the end of the reporting period. In total, the risk exposure amount for credit and counterparty credit risk decreased by EUR 6 million. However, for derivative counterparty credit risk, the risk exposure amount under CRR II, calculated using the standardised method, increased to EUR 85 million from EUR 41 million at the end of 2020. In addition, a reclassification was made in the credit risk calculation in category “Exposures to corporates”, which includes receivables from credit institutions and clearing houses located in the United Kingdom. Following Brexit, these counterparties will no longer be reported as receivables from institutions under Article 107 (3) of CRR.
CONSOLIDATED MINIMUM REQUIREMENT FOR OWN FUNDS 30 Jun 2021 31 Dec 2020
(EUR 1,000)Capital
requirementRisk exposure
amountCapital
requirementRisk exposure
amount
Credit and counterparty credit risk, standardised approach 45,964 574,553 46,448 580,596
Exposures to central governments or central banks - 0 - 0
Exposures to regional governments or local authorities 455 5,693 458 5,721
Exposures to public sector entities 710 8,880 718 8,975
Exposures to multilateral development banks - 0 - 0
Exposures to institutions 25,820 322,754 30,970 387,121
Exposures to corporates 6,288 78,595 - -
Exposures in the form of covered bonds 10,461 130,765 12,243 153,037
Other items 2,229 27,866 2,059 25,742
Market risk - - - -Credit valuation adjustment risk (CVA VaR), standard method 39,229 490,362 18,470 230,876
Operational risk, basic indicator approach 32,976 412,196 32,976 412,196
Total 118,169 1,477,110 97,893 1,223,668
Risk exposure amount for counterparty credit risk is EUR 84,799 thousand (EUR 40,938 thousand).
In brief Operating environment Primary statements Notes 23/111M
unic
ipal
ity F
inan
ce P
lc •
Hal
f Yea
r Rep
ort
1 J
anua
ry–3
0 J
une
20
21

Capital adequacy
0
20
40
60
80
100
120
104.3%104.3% 0.5%0.5% 0.0%0.0%
-18.4%-18.4%
0.0%0.0%4.7%4.7%
91.1%91.1%
Group’s CET1 capital ratio changes
CET1- capital ratio 12/2020
Credit risk Market risk CVA VaR Operational risk
CET1 capital
CET1- capital ratio 6/2021
There was no capital requirement for market risk at the end of June or in the comparison year, because the currency position was less than 2% of own funds, and, based on Article 351 of the Capital Requirements Regulation (CRR), the own funds requirement for market risk has therefore not been calculated. The credit valuation adjustment risk increased to EUR 490 million (EUR 230 million). The increase was especially related to the exposure-at-default (EAD) value of derivatives used in the calculation. The risk exposure amount of operational risk was EUR 412 million (EUR 412 million). As of the end of 2020, the Group has applied the European Banking Authority EBA’s recommendation regarding the calculation of the profit indicator for operational risk. According to this recommendation, the profit indicator is to be calculated using the last three year-end observations, including the current reporting period’s year-end observation. The indicator is then applied for the next twelve months from the time of calculation.
In brief Operating environment Primary statements Notes 24/111M
unic
ipal
ity F
inan
ce P
lc •
Hal
f Yea
r Rep
ort
1 J
anua
ry–3
0 J
une
20
21

Capital adequacy
Parent Company’s capital adequacy
The Parent Company’s total capital ratio was 117.4% at the end of June 2021 (136.5%), and its CET1 capital ratio was 93.1% (107.1%).
At the end of the reporting period, CET1 capital totalled EUR 1,344 million (EUR 1,275 million) and Tier 1 capital EUR 1,694 million (EUR 1,624 million). The Parent Company had no Tier 2 capital. Own funds totalled EUR 1,694 million (EUR 1,624 million).
OWN FUNDS, PARENT COMPANY 30 Jun 2021 31 Dec 2020
(EUR 1,000 )
Common Equity Tier 1 capital before adjustments 1,399,412 1,326,084
Adjustments to Common Equity Tier 1 capital -55,277 -51,350
Common Equity Tier 1 capital (CET1) 1,344,135 1,274,733
Additional Tier 1 capital before adjustments 349,631 349,388
Adjustments to Additional Tier 1 capital - -
Additional Tier 1 capital (AT1) 349,631 349,388
Tier 1 capital (T1) 1,693,766 1,624,121
Tier 2 capital before adjustments - -
Adjustments to Tier 2 capital - -
Tier 2 capital (T2) - -
Total own funds 1,693,766 1,624,121
In brief Operating environment Primary statements Notes 25/111M
unic
ipal
ity F
inan
ce P
lc •
Hal
f Yea
r Rep
ort
1 J
anua
ry–3
0 J
une
20
21

Capital adequacy
MINIMUM REQUIREMENT FOR OWN FUNDS, PARENT COMPANY 30 Jun 2021 31 Dec 2020
(EUR 1,000) Capital requirement Risk exposure amount Capital requirement Risk exposure amount
Credit and counterparty credit risk, standardised approach 46,047 575,592 46,522 581,522
Exposures to central governments or central banks - 0 - 0
Exposures to regional governments or local authorities 455 5,693 458 5,721
Exposures to public sector entities 710 8,880 718 8,975
Exposures to multilateral development banks - 0 - 0
Exposures to institutions 25,811 322,631 30,956 386,946
Exposures to corporates 6,288 78,595 - -
Exposures in the form of covered bonds 10,461 130,765 12,243 153,037
Equity exposure 131 1,639 131 1,639
Other items 2,191 27,388 2,016 25,203
Market risk - - - -
Credit valuation adjustment risk (CVA VaR), standard method 39,229 490,362 18,470 230,876
Operational risk, basic indicator approach 30,190 377,380 30,190 377,380
Total 115,467 1,443,333 95,182 1,189,778
In brief Operating environment Primary statements Notes 26/111M
unic
ipal
ity F
inan
ce P
lc •
Hal
f Yea
r Rep
ort
1 J
anua
ry–3
0 J
une
20
21

Capital adequacy
Minimum capital requirements and capital buffers
The minimum capital requirement is 8% for capital adequacy and 4.5% for CET1 capital adequacy. Under the Act on Credit Institutions, the capital conservation buffer is 2.5%. An additional capital requirement for other systemically important credit institutions (O-SII buffer) is annually determined by the Finnish Financial Supervisory Authority (FIN-FSA). At the end of June 2021, MuniFin Group’s O-SII buffer was kept unchanged at 0.5%. The FIN-FSA also decides on an additional capital requirement for the MuniFin Group based on the systemic risk buffer and adjusts it annually. This requirement has been 1.5% since July 2019. The systemic risk buffer and the O-SII buffer are parallel buffers, of which only the greater is applied.0
2
4
6
8
10
12
14
16
4.50%4.50%
2.50%2.50% 0.16%0.16%0.50%0.50% 7.66%7.66%
2.25%2.25%
3.50%3.50% 13.41%13.41%
Group’s minimum capital requirements and capital buffers
CET1- capital requirement
Capital conservation buffer
Counter- cyclical buffer
O-SII and systemic risk buffer (max)
CET1- minimum
P2R Tier 1 and Tier 2 capital requirement
Minimum capital requirement with buffers
In brief Operating environment Primary statements Notes 27/111M
unic
ipal
ity F
inan
ce P
lc •
Hal
f Yea
r Rep
ort
1 J
anua
ry–3
0 J
une
20
21

Capital adequacy
In April 2020, the FIN-FSA adjusted the capital requirements for the largest credit institutions in Finland, aiming to mitigate the negative effect the COVID-19 pandemic could have on the stability of financial markets and on the capacity of credit institutions to finance the economy. The FIN-FSA removed MuniFin Group’s abovementioned systemic risk buffer of 1.5%, effective immediately, which reduced the Group’s overall capital requirements by 1.0 percentage points. By the end of the reporting period, the FIN-FSA had not imposed a new systemic risk buffer for the MuniFin Group. The FIN-FSA also decides on a countercyclical capital buffer requirement on a quarterly basis, and it decided not to impose such a buffer in June 2021.
For MuniFin Group, the credit institution-specific counter-cyclical capital buffer requirement that is imposed based on the geographical distribution of exposures is 0.16% (0.21%). The Group therefore has a minimum requirement of 7.66% (7.71%) for CET1 capital ratio and 11.16% (11.21%) for total capital ratio.
In addition to the above-mentioned requirements, the European Central Bank ECB has imposed a bank-specific Pillar 2 Requirement (P2R) of 2.25% on MuniFin Group as part of the annual Supervisory Review and Evaluation Process (SREP). In 2020, the ECB did not perform the annual SREP due to the COVID-19 pandemic, but instead gave MuniFin Group an operational letter confirming the continuation of the previous P2R requirement of 2.25%. Including this P2R requirement,
the total SREP capital requirement ratio (TSCR) was 10.25% (10.25%) at the end of June 2021. The minimum level of total capital ratio was 13.41% (13.46%) including P2R and other additional capital requirements.
MuniFin Group fulfils these minimum capital adequacy requirements many times over. The Group’s CET1 capital ratio was 91.1% (104.3%) and total capital ratio was 114.7% (132.7%) at the end of June.
Leverage ratio, Liquidity Coverage Ratio and Net Stable Funding Ratio
At the end of the reporting period, MuniFin Group’s leverage ratio was 12.6% (3.9%). The CRR II regulation applied at the end of June increased the Group’s leverage ratio by 8.8 percentage points. MuniFin fulfils the CRR II definition of a public development credit institution and may therefore deduct all credit receivables from municipalities and the central government in the calculation of its leverage ratio. The amount of credit receivables from municipalities and the central government was EUR 31,319 million at the end of June. The comparison period has not been adjusted to reflect the updated capital requirements regulation. The minimum requirement for leverage ratio has been 3% since June 2021.
At the end of June, MuniFin Group’s Liquidity Coverage Ratio (LCR) was 300.2% (264.4%). The minimum requirement is 100%.
As part of the changes to the regulation of banks’ capital adequacy, a new Net Stable Funding Ratio (NSFR) requirement took effect in June 2021. At the end of June, the Group’s NSFR was 122.7% (116.4%). The minimum requirement is 100%.
Liabilities under the Act on the Resolution of Credit Institutions and Investment Firms
MuniFin’s crisis resolution authority is the EU’s Single Resolution Board (SRB). The SRB has imposed a binding minimum requirement for own funds and eligible liabilities (MREL) on MuniFin. The size of the MREL requirement is 10.25% of the total risk exposure amount and 3.00% of the leverage ratio exposure. The MREL requirement is based on the simplified resolution strategy applied to MuniFin in accordance with SRB’s decision.
The MREL requirement will take effect on 1 January 2024, but MuniFin must fully comply with the final MREL target levels from 1 January 2022 onwards. MuniFin’s own funds and eligible liabilities are expected to exceed the minimum requirements by a wide margin. There is no present need for MuniFin to issue Tier 3 instruments, because the Group’s own funds and eligible liabilities currently fulfil the MREL requirements.
In brief Operating environment Primary statements Notes 28/111M
unic
ipal
ity F
inan
ce P
lc •
Hal
f Yea
r Rep
ort
1 J
anua
ry–3
0 J
une
20
21

Risk management
MuniFin Group’s operations require adequate risk management mechanisms to ensure that its risk position remains within the limits set by the Parent Company’s Board of Directors. To preserve its strong credit rating, the Group applies conservative risk management principles and aims to keep the overall risk status low.
The relevant risk types associated with the MuniFin Group’s operations include credit and counterparty risk, market risk and liquidity risk. All business operations also involve strategic risks, ESG risks and operational risks, including compliance risk.
The Group’s risk position
The COVID-19 pandemic may affect MuniFin Group’s counterparty risk, liquidity portfolio credit risk and risks related to liquidity, lending and business processes. So far, however, the pandemic has not had any significant negative effects on these risks.
Risk management
Risk management
In brief Operating environment Primary statements Notes 29/111M
unic
ipal
ity F
inan
ce P
lc •
Hal
f Yea
r Rep
ort
1 J
anua
ry–3
0 J
une
20
21

There were no material changes in MuniFin Group’s risk appetite in the first half of 2021. Despite the COVID-19 pandemic, the Group’s risk position has remained stable and at a moderate level, well within the risk appetite set by the Board of Directors. Unrealised fair value changes of financial instruments increased the volatility of profits. The Group continuously monitors and analyses the volatility arising from valuations and prepares for its potential profitability and solvency impacts.
The Group is exposed to credit risks as part of its business. Due to the nature of its customer base, credit risks are low. The credit risks emerge almost exclusively from customer financing, the liquidity portfolio investments and the derivatives portfolio. MuniFin also offers derivative products for its customers for hedging their interest rate positions. These products are covered with offsetting contracts from the market. The Group only uses derivatives for hedging against market risks.
In view of its credit risk mitigation techniques (mortgage collateral and guarantees received) and exemptions set out in CRR II Article 400 related to the calculation of large exposures, MuniFin Group is not exposed to customer risk
in its customer financing, and thus the customer risk of any individual customer does not exceed 10% of own funds. The amount of expected credit losses slightly increased in the first half of the year and was EUR -0.1 million (EUR 0.0 million) recognised in the income statement. The amount of forborne receivables at the end of June was EUR 92 million, which is EUR 4 million more than at the end of 2020. Non-performing exposures amounted to EUR 127 million at the end of June (EUR 136 million). For these non-performing exposures, MuniFin has absolute guarantees by municipalities or real estate collateral and state deficiency guarantee, and these exposures are therefore not expected to carry the risk of a final credit loss. Non-performing exposures represented 0.4% of total customer exposures (0.5%).
MuniFin’s credit risk position remained stable and at a low level during the reporting period. The COVID-19 pandemic has not weakened the Group’s credit risk position, and it is expected to remain stable and in line with the Group’s credit risk strategy also in the future.
Market risks include interest rate risk, exchange rate risk and other market and price risks. MuniFin Group actively monitors and hedges its interest rate risk and manages it by using
derivatives. Interest rate risk mainly arises from the differences in Euribor rates applicable to the assets and liabilities in the balance sheet. MuniFin Group actively monitors and hedges its interest rate risk. Eight scenarios are used in the calculation of the earnings risk, of which the least favourable outcome is considered. The least favourable scenario was based on an assumption of a rise of one percentage point in the whole interest rate curve. One-year earnings risk at the end of June was EUR -8 million (EUR -32 million). Several scenarios are also used in the calculation of the Economic Value of Equity, of which the least favourable outcome is considered. The least favourable scenario was based on an assumption of a rise of two percentage points in the whole interest rate curve. The Economic Value of Equity at the end of June was EUR -129 million (EUR -345 million).
MuniFin Group’s exchange rate risk is hedged by using derivative contracts to swap all funding and investments denominated in foreign currency into euros. In practice, the Group’s operations are not exposed to exchange rate risks, but a small temporary exchange rate risk may arise due to collateral management in the clearing of derivatives by central counterparties. This exchange rate risk is actively monitored and hedged. Derivatives are also used to hedge against
Risk management
In brief Operating environment Primary statements Notes 30/111M
unic
ipal
ity F
inan
ce P
lc •
Hal
f Yea
r Rep
ort
1 J
anua
ry–3
0 J
une
20
21

other market and price risks. Derivatives can only be used for hedging purposes as the Group does not engage in trading activities. The Group has also determined valuation risk as a significant risk for its business. Unrealised fair value changes of financial instruments increase the Group’s earnings volatility. The Group continuously monitors and analyses the volatility arising from valuations and prepares for any impacts this may have on its profit and capital adequacy.
The Group’s market risk has remained stable. The market was relatively stable during the reporting period, which has manifested in less valuation volatility in the Group’s profits than in the comparison period.
MuniFin Group manages its refinancing risk by limiting the average maturity between financial assets and liabilities. In addition, the Group manages its liquidity risk by setting a limit
for the minimum adequacy of the available short-term and long-term liquidity. At the end of June, the Group’s survival horizon was 16.2 months (12.3 months). The Group’s liquidity remained good, with the LCR being 300.2% (264.4%) at the end of June. The availability of long-term funding is monitored via the Net Stable Funding Ratio (NSFR). The NSFR requirement entered into force in June 2021 and the ratio was 122.7% (116.4%) at the end of the reporting period. The availability of funding remained good throughout the first half of the year. In January–June 2021, MuniFin Group issued EUR 6,025 million (EUR 5,504 million) in long-term funding.
MuniFin Group’s operational risks are estimated to be at a moderate level, and there were no material losses from operational risks in the first half of 2021. According to MuniFin’s estimate, the COVID-19 pandemic has not significantly increased the Group’s operational risks. The remote work
arrangements and changed operating practices have become routine, and business operations have continued normally. Control points related to processes and information security, for example, have remained in place and continued to function in the usual way.
ESG risks include environmental, social and governance risks. There have been no material changes in ESG risks during the reporting period. According to the Group’s current estimate, it is currently not exposed to any substantial social or governance risks. Also, the Group’s current estimate is that environmental and climate risks are unlikely to manifest substantially in the short term. In the medium and long term, climate risks may nevertheless have an adverse economic effect on the Group’s customers and therefore their loan repayment ability.
Risk management
In brief Operating environment Primary statements Notes 31/111M
unic
ipal
ity F
inan
ce P
lc •
Hal
f Yea
r Rep
ort
1 J
anua
ry–3
0 J
une
20
21

Governance
In addition to corporate legislation, MuniFin complies with the governance requirements of the Finnish Act on Credit Institutions. The governance policy is described in more detail on MuniFin’s website.
Upon the publication of the Annual Report, MuniFin Group also publishes a Corporate Governance Statement on its website, pursuant to chapter 7, section 7 of the Finnish Securities Market Act. The statement is separate from the Annual Report and includes a description of the main features of the internal audit and risk management systems pertaining to the financial reporting process. The statement also includes the governance descriptions required by the Act on Credit Institutions as well as information on how MuniFin complies with the Finnish Corporate Governance Code for listed companies published by the Finnish Securities Market Association. This code applies to Finnish listed companies, i.e. companies whose shares are listed on Nasdaq Helsinki Ltd (Helsinki Stock Exchange). Since MuniFin is exclusively an issuer of listed bonds and its shares are not subject to public trading, this code does not apply directly to MuniFin.
Group structure
Municipality Finance Group (MuniFin Group or the Group) consists of Municipality Finance Plc (MuniFin or the Parent
Company) and Financial Advisory Services Inspira Ltd (Inspira). Inspira is fully owned by MuniFin. No changes to the group structure took place in the reporting period.
General meeting
The Annual General Meeting (AGM) of MuniFin was held on 25 March 2021. The AGM confirmed the Financial Statements for 2020 and discharged the members of the Board of Directors, the CEO and the Deputy CEO from liability for the financial year 2020. In addition, in accordance with the proposal of the Board of Directors, the AGM authorised MuniFin’s Board of Directors to decide on the dividend and its payment at a time it deems best, taking into account the current supervisory recommendations. The authorisation is valid until the next AGM. The AGM authorised the Board of Directors to decide on a dividend payment of a maximum of EUR 0.52 per share, totalling EUR 20,313,174.96. The Board of Directors follows the current recommendation adopted by the ECB and refrains from deciding on the dividend payment based on the authorisation until 30 September 2021. The amount of distributable funds on the Group’s balance sheet on 31 December 2020 was EUR 151,454,113.07.
Based on the proposal of the Shareholders’ Nomination Committee, the AGM decided to appoint nine Board members for the 2021–2022 term, lasting from the 2021 AGM to the
end of the subsequent AGM. The AGM also confirmed the Shareholders’ Nomination Committee’s proposal on the remuneration of Board members.
In addition, the meeting re-elected KPMG Oy Ab as MuniFin’s auditor, with APA Tiia Kataja as the principal auditor. This decision was based on the Board’s proposal and made at the consent of KPMG Oy Ab. Kataja acted as the principal auditor during the previous term as well.
The AGM also decided on amendments to the Articles of Association. The Line of Business in the Articles of Association was complemented by adding MuniFin’s status a public development credit institution as per the prudential regulation of credit institutions and with other more technical amendments. All amendments are listed in the AGM’s resolutions, available on MuniFin’s website.
Board of Directors
The Shareholder’s Nomination Committee made a proposal to the AGM held on 25 March 2021 regarding the members to be elected for the term that began at the end of the 2021 AGM and will conclude at the end of the subsequent AGM.
The AGM elected the following members to the Board of Directors: Maaria Eriksson, Markku Koponen, Kari Laukkanen,
Governance
Governance
In brief Operating environment Primary statements Notes 32/111M
unic
ipal
ity F
inan
ce P
lc •
Hal
f Yea
r Rep
ort
1 J
anua
ry–3
0 J
une
20
21
Vivi Marttila, Tuomo Mäkinen, Minna Smedsten, Denis Strandell, Leena Vainiomäki and Kimmo Viertola. The MuniFin Board nominated Kari Laukkanen as the Chair of the Board and Maaria Eriksson as the Vice Chair.
MuniFin has statutory audit, risk and remuneration committees established by the Board of Directors. Committees act as assisting and prepatory bodies to the Board of Directors. The MuniFin Board selected Markku Koponen (Chair), Vivi Marttila, Minna Smedsten and Denis Strandell as the members of the Audit Committee. In the Risk Committee, the Board selected Leena Vainiomäki (Chair), Maaria Eriksson, Kari Laukkanen and Tuomo Mäkinen. In the Remuneration Committee, the Board selected Kari Laukkanen (Chair), Leena Vainiomäki and Kimmo Viertola.
From the 2020 AGM to the 2021 AGM, the members of the Board of Directors were Helena Walldén (Chair), Tuula Saxholm (Vice Chair), Maaria Eriksson, Markku Koponen, Kari Laukkanen, Vivi Marttila, Denis Strandell and Kimmo Viertola. Helena Walldén and Tuula Saxholm were not available for the Board’s 2021–2022 term.
The operations of the MuniFin’s Board of Directors and its committees are described in more detail on MuniFin’s website.
Personnel
At the end of June 2021, MuniFin Group had 163 (165) employees, of which 152 (154) worked for the Parent Company.
The President and CEO of MuniFin is Esa Kallio, with Mari Tyster, Executive Vice President, acting as deputy to the President and CEO. In addition, the MuniFin Executive Management Team includes Executive Vice Presidents Aku Dunderfelt, Toni Heikkilä, Joakim Holmström, Harri Luhtala, Minna Piitulainen and Juha Volotinen.
MuniFin Group has restructured its organisation and operating practices to streamline its operations and to further improve its products, services and customer experience. The renewed organisation is more strongly based on MuniFin’s core operations, i.e. customer financing solutions and capital markets processes. The changes took effect on 1 January 2021. MuniFin established a new Development and HR Services division to manage the development portfolio and support change management. The new function is headed by Minna Piitulainen, who is also a member of the MuniFin’s Executive Management Team as from 1 January 2021.
During the reporting period, Rainer Holm, MuniFin’s Executive Vice President of Technology Services, left the service of MuniFin. Holm was succeeded by Juha Volotinen as from 1 April 2021. Volotinen also acts as a member of MuniFin’s Executive Management Team.
Internal audit
The purpose of MuniFin Group’s internal audit is to monitor the reliability and accuracy of the Group’s information on finances and other management. It also ensures that MuniFin
Group has sufficient and appropriately organised manual and IT systems for its operations and that the risks associated with the operations are adequately managed.
Events after the reporting periodECB announced on 23 July 2021, that its recommendation limiting dividend distribution will expire on 30 September 2021. MuniFin’s Board of Directors may thus decide on the distribution of dividends for 2020 after the expiry of the recommendation on the basis of the authorisation given by the AGM in spring 2021.
The results of the EU-wide stress test were published on Friday, July 30, 2021. The Group participated in the SSM Stress Test led by ECB. The stress test covered years 2021–2023. MuniFin Group’s capital adequacy and leverage ratio remained extremely strong under even adverse scenario. According to this adverse scenario, the Group’s CET1 capital ratio would be 67% at the end of 2023 and the leverage ratio at 3.6% (CRR). Both figures exceed clearly regulatory requirements.
Governance
Events after the reporting period
In brief Operating environment Primary statements Notes 33/111M
unic
ipal
ity F
inan
ce P
lc •
Hal
f Yea
r Rep
ort
1 J
anua
ry–3
0 J
une
20
21

Outlook for the second half of 2021
The general economic outlook has improved markedly in the first half of 2021, but operating environment risks remain elevated. With the coronavirus evolving into new variants and vaccinations proceeding slowly in the developing countries, the risk of local outbreaks is real, and such outbreaks may cause considerable harm to global delivery chains. At their worst, bottlenecks in production may increase the fear of inflation.
It currently seems likely that the rapid increase in consumer prices will be a short-lived trend. But because predicting inflation is difficult, the unpredictability of future inflation is the second major uncertainty factor in the world economy in addition to the COVID-19 pandemic. In the US, the risk of the economy overheating and the monetary policy being tightened faster than expected is much higher than in Europe.
In the first half of the year, growth forecasts have been raised regularly. The world economy is expected to grow by approximately 6% this year. In the US, GDP growth may be even higher than this. According to the ECB’s latest forecasts, the euro area GDP will grow by 4.6% in 2021 and by 4.7% in 2022.
In Finland, GDP growth is expected to reach 2.7% in 2021 and 3.0% in 2022. The unemployment rate is expected to come down from 7.8% last year to 7.6% this year and finally to 7.1%
next year. Finland’s deficit-to-GDP ratio is estimated to remain at about 5% in 2021, with the debt-to-GDP ratio rising close to 72%.
The Government’s COVID-19 support package in 2020 brought temporary relief to municipal economy. In the long term, however, municipal finances will return to a similar track they were in before the pandemic. Municipalities continue to have high investment needs, which is expected to increase the demand for financing in the future.
After a lengthy preparation process, the Finnish Parliament passed in June the legislative package concerning the health and social services reform. The reform will not have a significant effect on the Group’s operations in 2021.
Thanks to business growth, steady funding activities and a favourable interest rate environment, the Group’s net interest income is expected to increase from 2020. The Group’s decision to change the conditions of long-term customer loans with variable interest rates in a way that will allow customers to benefit from negative reference rates more than before will only have a slight effect on the 2021 result. Costs are expected to grow from the exceptionally low level of 2020, as investments in IT systems and operational reliability as well as the marked rise in the Single Resolution Fund contributions all increase expenses.
Considering the above-mentioned circumstances and assuming that there will be no major changes in the development of market interest rates and credit risk premiums when compared to market expectations, the Group expects its net operating profit excluding unrealised fair value changes to remain at the same level as or higher than in 2020 (Financial Statements Bulletin 2020: at the same level). The valuation principles set in IFRS regulatory framework may cause significant but temporary unrealised fair value changes, some of which increase the volatility of net operating profit and make it more difficult to estimate in the short term. The Group expects its capital adequacy ratio and leverage ratio to remain very strong.
The estimates presented herein are based on current views of the development of the operating environment and MuniFin Group’s operations.
Helsinki, 5 August 2021Municipality Finance PlcBoard of Directors
Further information:Esa Kallio, President and CEO, tel. +358 50 337 7953Harri Luhtala, CFO, tel. +358 50 592 9454
Outlook for the second half of 2021
Outlook for the second half of 2021
In brief Operating environment Primary statements Notes 34/111M
unic
ipal
ity F
inan
ce P
lc •
Hal
f Yea
r Rep
ort
1 J
anua
ry–3
0 J
une
20
21
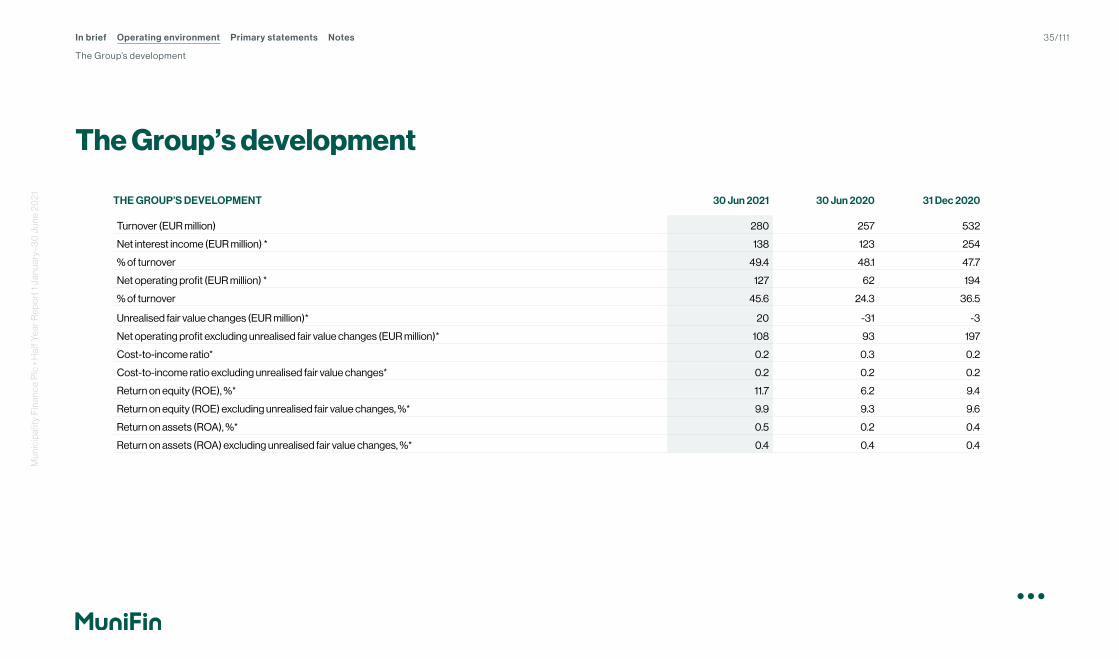
THE GROUP’S DEVELOPMENT 30 Jun 2021 30 Jun 2020 31 Dec 2020
Turnover (EUR million) 280 257 532
Net interest income (EUR million) * 138 123 254
% of turnover 49.4 48.1 47.7
Net operating profit (EUR million) * 127 62 194
% of turnover 45.6 24.3 36.5
Unrealised fair value changes (EUR million)* 20 -31 -3
Net operating profit excluding unrealised fair value changes (EUR million)* 108 93 197
Cost-to-income ratio* 0.2 0.3 0.2
Cost-to-income ratio excluding unrealised fair value changes* 0.2 0.2 0.2
Return on equity (ROE), %* 11.7 6.2 9.4
Return on equity (ROE) excluding unrealised fair value changes, %* 9.9 9.3 9.6
Return on assets (ROA), %* 0.5 0.2 0.4
Return on assets (ROA) excluding unrealised fair value changes, %* 0.4 0.4 0.4
The Group’s development
The Group’s development
The Group’s development
In brief Operating environment Primary statements Notes 35/111M
unic
ipal
ity F
inan
ce P
lc •
Hal
f Yea
r Rep
ort
1 J
anua
ry–3
0 J
une
20
21

The Group’s development
THE GROUP’S DEVELOPMENT 30 Jun 2021 30 Jun 2020 31 Dec 2020
Long-term customer financing (EUR million)* 28,582 26,743 28,022
New lending (EUR million)* 1,601 2,543 4,764
Total funding (EUR million)* 40,281 35,805 38,139
New long-term funding (EUR million)* 6,025 5,504 10,966
Equity (EUR million) 1,793 1,610 1,705
Total balance sheet (EUR million) 45,658 41,288 44,042
Total liquidity (EUR million)* 11,736 8,311 10,089
Liquidity Coverage Ratio (LCR), % 300.2 353.9 264.4
Net Stable Funding Ratio (NSFR), % ** 122.7 117.5 116.4
Equity ratio, %* 3.9 3.9 3.9
CET1 capital (EUR million) 1,346 1,172 1,277
Tier 1 capital (EUR million) 1,694 1,519 1,624
Total own funds (EUR million) 1,694 1,519 1,624
CET1 capital ratio, %** 91.1 87.8 104.3
Tier 1 capital ratio, %** 114.7 113.8 132.7
Total capital ratio, %** 114.7 113.8 132.7
Leverage ratio, %** 12.6 3.8 3.9
Personnel 163 167 165
* Alternative performance measure. For more information on alternative performance measures, see pages 37–42.** Figures for the reporting period calculated in accordance with CRR II. Comparison periods have not been adjusted to reflect the updated capital requirements regulation.
In brief Operating environment Primary statements Notes 36/111M
unic
ipal
ity F
inan
ce P
lc •
Hal
f Yea
r Rep
ort
1 J
anua
ry–3
0 J
une
20
21

MuniFin Group defines the Alternative Performance Measures (APMs) to be financial measures that have not been defined in the IFRS standards or the capital requirements regulation (CRD/CRR). The APMs improve comparability between companies in the same sector and between reporting periods and provide valuable information to the readers of the financial reports. The APMs provide a more consistent basis for comparing the results of financial periods and for assessing MuniFin Group’s performance. They are also an important aspect of the way in which Group’s management defines operating targets and monitors performance.
The Alternative Performance Measures are presented in MuniFin Group’s financial reports in accordance with the guidelines for Alternative Performance Measures issued by the European Securities and Markets Authority (ESMA).
MuniFin Group has not made any adjustments to APMs nor included any new APMs due to the impacts of COVID-19 pandemic.
Key figures
Key figures
Key figures
In brief Operating environment Primary statements Notes 37/111M
unic
ipal
ity F
inan
ce P
lc •
Hal
f Yea
r Rep
ort
1 J
anua
ry–3
0 J
une
20
21

Key figures
Figures are in million EUR.
ALTERNATIVE PERFORMANCE MEASURE DEFINITION / EXPLANATION RECONCILIATION 1 Jan–30 Jun 2021 1 Jan–30 Jun 2020
Net interest income Interest income and expense from financial assets and liabilities are recognised in net interest income. A significant part of Group’s revenues consists of net interest income.
Interest and similar income (incl. Leasing) 257 286interest and similar expense -118 -163
Net interest income 138 123
Unrealised fair value changes
Due to IFRS 9 implementation more financial instruments are measured at fair value through profit and loss which increases PnL volatility. To enhance comparability of business performance between periods and companies, it is often necessary to exclude the PnL effect of the unrealised fair value changes.
Net income from securities and foreign exchange transactions, unrealised fair value changes
15 -29
Net income from hedge accounting 5 -2
Unrealised fair value changes 20 -31
Net operating profit Net operating profit describes Group’s operating profit before taxes. Net operating profit 127 62
Net operating profit excluding unrealised fair value changes
Net operating profit excluding unrealised fair value changes as an APM is of interest of showing MuniFin Group’s underlying earnings capacity.
Net operating profit 127 62-Unrealised fair value changes 20 -31
Net operating profit excluding unrealised fair value changes 108 93
Income Income, which describes the Group’s total income including net interest income, is used e.g. as a denominator (minus commission expenses) in Cost-to-income ratio.
Net interest income 138 123Commission income 1 2Net income from securities and foreign exchange transactions 17 -30Net income on financial assets at fair value through other comprehensive income 0 0Net income from hedge accounting 5 -2Other operating income 0 0
Income 161 94
In brief Operating environment Primary statements Notes 38/111M
unic
ipal
ity F
inan
ce P
lc •
Hal
f Yea
r Rep
ort
1 J
anua
ry–3
0 J
une
20
21

ALTERNATIVE PERFORMANCE MEASURE DEFINITION / EXPLANATION RECONCILIATION 1 Jan–30 Jun 2021 1 Jan–30 Jun 2020
Income excluding unrealised fair value changes
Income excluding unrealised fair value changes reflects the Group’s operating income, of which the most significant is net interest income.
Income 161 94-Unrealised fair value changes 20 -31
Income excluding unrealised fair value changes 142 125
Other income Other income includes all other income of the Group than net interest income and unrealised fair value changes.
Commission income 1 2Net income from securities and foreign exchange transactions, realised 2 -1Net income on financial assets at fair value through other comprehensive income 0 0Other operating income 0 0
Other income 3 1
Costs Costs, which describe the Group’s total costs, is used e.g. as a numerator (excl. commission expenses) in Cost-to-income ratio.
Commission expenses 2 2Administrative expenses 18 16Depreciation and impairment on tangible and intangible assets 3 3Other operating expenses 11 11
Costs 34 32
Cost-to-income ratio Cost-to-income ratio is an established key ratio in the banking sector for assessing the relationship between expenses and income. The ratio gives investors a comparative view of MuniFin Group’s cost-effectiveness.
Costs (excl. Commission expenses) 31 29÷ Income (incl. Net commission income) 159 91
Cost-to-income ratio 0.2 0.3
Key figures
In brief Operating environment Primary statements Notes 39/111M
unic
ipal
ity F
inan
ce P
lc •
Hal
f Yea
r Rep
ort
1 J
anua
ry–3
0 J
une
20
21

ALTERNATIVE PERFORMANCE MEASURE DEFINITION / EXPLANATION RECONCILIATION 1 Jan–30 Jun 2021 1 Jan–30 Jun 2020
Cost-to-income ratio excluding unrealised fair value changes
Cost-to income ratio excluding unrealised fair value changes gives a more precise picture of MuniFin Group’s operative effectiveness as it excludes the income volatility of unrealised fair value changes. Cost-to income ratio excluding unrealised fair value changes as an performance measure is more widely used after the implementation of IFRS 9 as PnL volatility of income has grown due to unrealised fair value changes of financial instruments. It improves comparability of operative effectiveness between companies and reporting periods.
Costs (excl. Commission expenses) 31 29÷ (Income (incl. Net commission income) 159 91- Unrealised fair value changes) 20 -31
Cost-to-income ratio excluding unrealised fair value changes 0.2 0.2
The effect of unrealised fair value changes on other comprehensive income and equity net of tax
The key figure describes the effect of unrealised fair value changes during the reporting period on the Group’s comprehensive income and equity net of tax.
Unrealised fair value changes (through PnL) 20 -31Taxes related to the unrealised fair value changes (through PnL) -4 6Net change in fair value due to changes in own credit risk on financial liabilities designated at fair value through profit or loss, net of tax
-3 18
Net change in Cost-of-Hedging, net of tax 2 -32Net change in fair value of financial assets at fair value through other comprehensive income, net of tax
0 0
The effect of unrealised fair value changes on other comprehensive income and equity net of tax
14 -40
New lending Key indicator used in management reporting to describe MuniFin Group’s business volume during the reporting period. The indicator includes the amount of new loans excluding unrealised fair value changes.
New lending 1,601 2,543
New long-term funding
Key indicator used in management reporting to describe MuniFin Group’s funding activity during the reporting period. The indicator includes the amount of new funding (over 1 year) issued excluding unrealised fair values changes.
New long-term funding 6,025 5,504
Key figures
In brief Operating environment Primary statements Notes 40/111M
unic
ipal
ity F
inan
ce P
lc •
Hal
f Yea
r Rep
ort
1 J
anua
ry–3
0 J
une
20
21
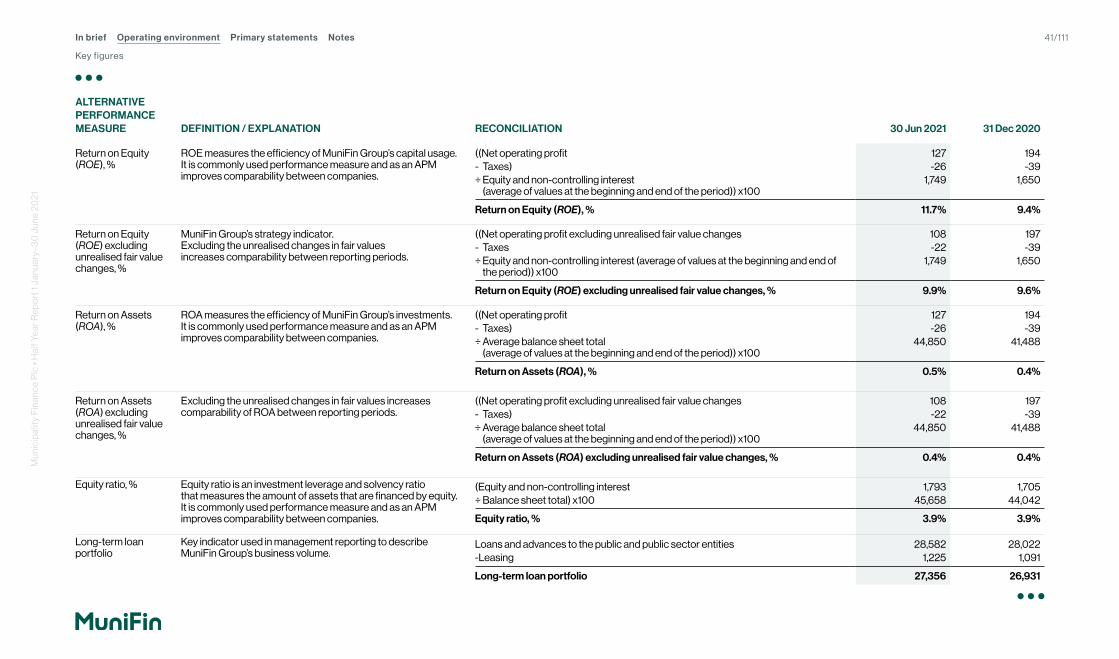
ALTERNATIVE PERFORMANCE MEASURE DEFINITION / EXPLANATION RECONCILIATION 30 Jun 2021 31 Dec 2020
Return on Equity (ROE), %
ROE measures the efficiency of MuniFin Group’s capital usage. It is commonly used performance measure and as an APM improves comparability between companies.
((Net operating profit 127 194- Taxes) -26 -39÷ Equity and non-controlling interest
(average of values at the beginning and end of the period)) x1001,749 1,650
Return on Equity (ROE), % 11.7% 9.4%
Return on Equity (ROE) excluding unrealised fair value changes, %
MuniFin Group’s strategy indicator. Excluding the unrealised changes in fair values increases comparability between reporting periods.
((Net operating profit excluding unrealised fair value changes 108 197- Taxes -22 -39÷ Equity and non-controlling interest (average of values at the beginning and end of
the period)) x1001,749 1,650
Return on Equity (ROE) excluding unrealised fair value changes, % 9.9% 9.6%
Return on Assets (ROA), %
ROA measures the efficiency of MuniFin Group’s investments. It is commonly used performance measure and as an APM improves comparability between companies.
((Net operating profit 127 194- Taxes) -26 -39÷ Average balance sheet total
(average of values at the beginning and end of the period)) x10044,850 41,488
Return on Assets (ROA), % 0.5% 0.4%
Return on Assets (ROA) excluding unrealised fair value changes, %
Excluding the unrealised changes in fair values increases comparability of ROA between reporting periods.
((Net operating profit excluding unrealised fair value changes 108 197- Taxes) -22 -39÷ Average balance sheet total
(average of values at the beginning and end of the period)) x10044,850 41,488
Return on Assets (ROA) excluding unrealised fair value changes, % 0.4% 0.4%
Equity ratio, % Equity ratio is an investment leverage and solvency ratio that measures the amount of assets that are financed by equity. It is commonly used performance measure and as an APM improves comparability between companies.
(Equity and non-controlling interest 1,793 1,705÷ Balance sheet total) x100 45,658 44,042
Equity ratio, % 3.9% 3.9%
Long-term loan portfolio
Key indicator used in management reporting to describe MuniFin Group’s business volume.
Loans and advances to the public and public sector entities 28,582 28,022-Leasing 1,225 1,091
Long-term loan portfolio 27,356 26,931
Key figures
In brief Operating environment Primary statements Notes 41/111M
unic
ipal
ity F
inan
ce P
lc •
Hal
f Yea
r Rep
ort
1 J
anua
ry–3
0 J
une
20
21
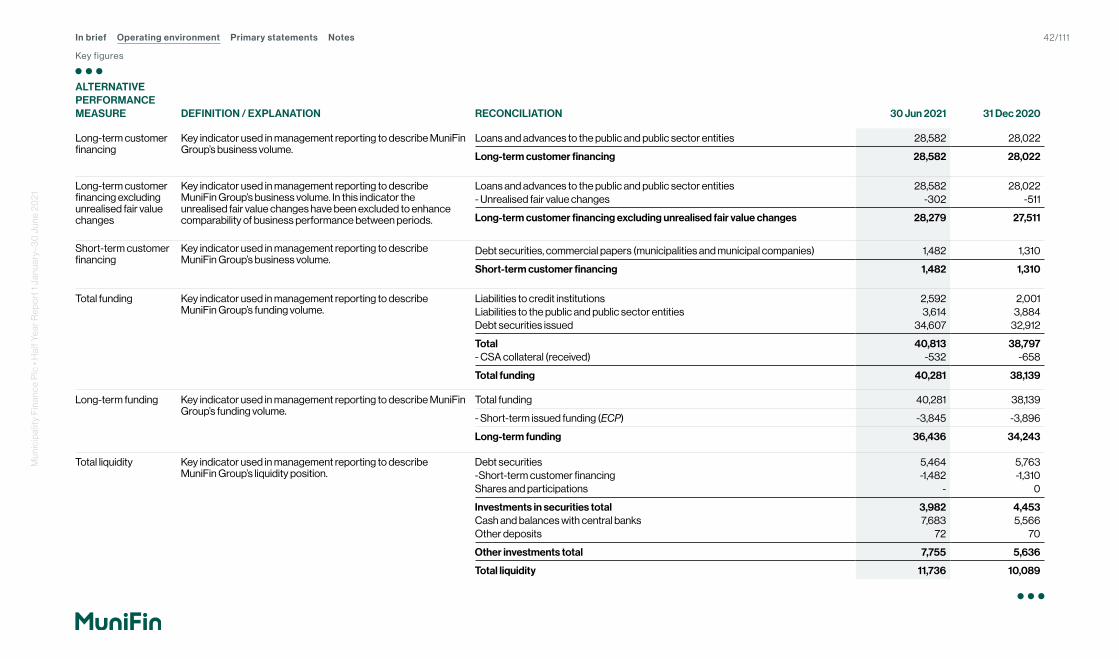
ALTERNATIVE PERFORMANCE MEASURE DEFINITION / EXPLANATION RECONCILIATION 30 Jun 2021 31 Dec 2020
Long-term customer financing
Key indicator used in management reporting to describe MuniFin Group’s business volume.
Loans and advances to the public and public sector entities 28,582 28,022
Long-term customer financing 28,582 28,022
Long-term customer financing excluding unrealised fair value changes
Key indicator used in management reporting to describe MuniFin Group’s business volume. In this indicator the unrealised fair value changes have been excluded to enhance comparability of business performance between periods.
Loans and advances to the public and public sector entities 28,582 28,022- Unrealised fair value changes -302 -511
Long-term customer financing excluding unrealised fair value changes 28,279 27,511
Short-term customer financing
Key indicator used in management reporting to describe MuniFin Group’s business volume.
Debt securities, commercial papers (municipalities and municipal companies) 1,482 1,310
Short-term customer financing 1,482 1,310
Total funding Key indicator used in management reporting to describe MuniFin Group’s funding volume.
Liabilities to credit institutions 2,592 2,001Liabilities to the public and public sector entities 3,614 3,884Debt securities issued 34,607 32,912
Total 40,813 38,797- CSA collateral (received) -532 -658
Total funding 40,281 38,139
Long-term funding Key indicator used in management reporting to describe MuniFin Group’s funding volume.
Total funding 40,281 38,139
- Short-term issued funding (ECP) -3,845 -3,896
Long-term funding 36,436 34,243
Total liquidity Key indicator used in management reporting to describe MuniFin Group’s liquidity position.
Debt securities 5,464 5,763-Short-term customer financing -1,482 -1,310Shares and participations - 0
Investments in securities total 3,982 4,453Cash and balances with central banks 7,683 5,566Other deposits 72 70
Other investments total 7,755 5,636
Total liquidity 11,736 10,089
Key figures
In brief Operating environment Primary statements Notes 42/111M
unic
ipal
ity F
inan
ce P
lc •
Hal
f Yea
r Rep
ort
1 J
anua
ry–3
0 J
une
20
21

OTHER MEASURES DEFINITION RECONCILIATION 1 Jan–30 Jun 2021 1 Jan–30 Jun 2020
Turnover Defined in IFRS (IAS 1). Turnover is not disclosed in MuniFin Group’s income statement so the formula for turnover should be given even though it is not considered to be an APM.
Interest and similar income (incl. Leasing) 257 286Commission income 1 2Net income from securities and foreign exchange transactions 17 -30Net income on financial assets at fair value through other comprehensive income 0 0Net income from hedge accounting 5 -2Other operating income 0 0
Turnover 280 257
30 Jun 2021 31 Dec 2020
Liquidity Coverage Ratio (LCR), %
Defined in CRR. (Liquid assets 10,960 9,229÷ (Liquidity outflows - liquidity inflows in a stress situation)) x100 3,651 3,490
Liquidity Coverage Ratio (LCR), % 300.2% 264.4%
Net Stable Funding Ratio (NSFR), %
Defined in CRR. The 30 Jun 2021 ratio has been calculated in accordance with CRR II. The comparative ratio has not been restated. The comparative ratio has been calculted based on Basel III NSFR guidelines.
(Available Stable Funding (ASF) 33,449 30,883÷ Required Stable Funding (RSF)) x100 27,258 26,539
Net Stable Funding Ratio (NSFR), % 122.7% 116.4%
CET1 capital ratio, % Defined in CRR. The 30 Jun 2021 ratio has been calculated in accordance with CRR II. The comparative ratio has not been restated.
(Common Equity Tier 1 (CET1) capital 1,346 1,277÷ Risk exposure amount) x100 1,477 1,224
CET1 capital ratio, % 91.1% 104.3%
Tier 1 capital ratio, % Defined in CRR. The 30 Jun 2021 ratio has been calculated in accordance with CRR II. The comparative ratio has not been restated.
(Tier 1 capital 1,694 1,624÷ Risk exposure amount) x100 1,477 1,224
Tier 1 capital ratio, % 114.7% 132.7%
Total capital ratio, % Defined in CRR. The 30 Jun 2021 ratio has been calculated in accordance with CRR II. The comparative ratio has not been restated.
(Total own funds 1,694 1,624÷ Risk exposure amount) x100 1,477 1,224
Total capital ratio, % 114.7% 132.7%
Leverage ratio, % Defined in CRR. The 30 Jun 2021 ratio has been calculated in accordance with CRR II. The comparative ratio has not been restated.
(Tier 1 capital 1,694 1,624÷ Total exposure) x100 13,401 42,103
Leverage ratio, % 12.6% 3.9%
Key figures
In brief Operating environment Primary statements Notes 43/111M
unic
ipal
ity F
inan
ce P
lc •
Hal
f Yea
r Rep
ort
1 J
anua
ry–3
0 J
une
20
21

MuniFin Group'sHalf Year Report1 January–30 June 2021
MuniFin Group’s Half Year Report 1 Janua-ry–30 June 2021
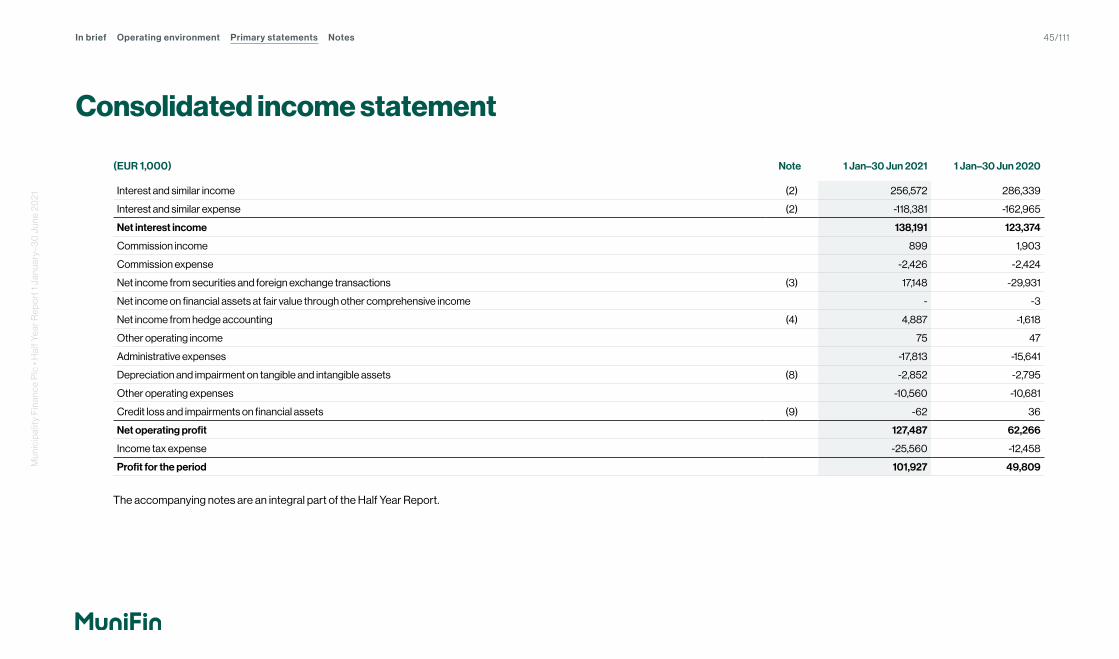
(EUR 1,000) Note 1 Jan–30 Jun 2021 1 Jan–30 Jun 2020
Interest and similar income (2) 256,572 286,339
Interest and similar expense (2) -118,381 -162,965
Net interest income 138,191 123,374
Commission income 899 1,903
Commission expense -2,426 -2,424
Net income from securities and foreign exchange transactions (3) 17,148 -29,931
Net income on financial assets at fair value through other comprehensive income - -3
Net income from hedge accounting (4) 4,887 -1,618
Other operating income 75 47
Administrative expenses -17,813 -15,641
Depreciation and impairment on tangible and intangible assets (8) -2,852 -2,795
Other operating expenses -10,560 -10,681
Credit loss and impairments on financial assets (9) -62 36
Net operating profit 127,487 62,266
Income tax expense -25,560 -12,458
Profit for the period 101,927 49,809
The accompanying notes are an integral part of the Half Year Report.
Consolidated income statement
Consolidated income statement
In brief Operating environment Primary statements Notes 45/111M
unic
ipal
ity F
inan
ce P
lc •
Hal
f Yea
r Rep
ort
1 J
anua
ry–3
0 J
une
20
21

(EUR 1,000) Note 1 Jan–30 Jun 2021 1 Jan–30 Jun 2020
Profit for the period 101,927 49,809
Components of other comprehensive income
Items not to be reclassified to income statement in subsequent periods
Net change in fair value due to changes in own credit risk on financial liabilities designated at fair value through profit or loss (3) -4,201 22,150
Net change in Cost-of-Hedging (4) 2,075 -40,374
Items to be reclassified to income statement in subsequent periods
Net change in fair value of financial assets at fair value through other comprehensive income -295 -540
Net change in expected credit loss of financial assets at fair value through other comprehensive income 3 -25
Taxes related to components of other comprehensive income 484 3,758
Total components of other comprehensive income -1,934 -15,031
Total comprehensive income for the period 99,993 34,777
The accompanying notes are an integral part of the Half Year Report.
Statement of comprehensive income
Statement of comprehensive income
In brief Operating environment Primary statements Notes 46/111M
unic
ipal
ity F
inan
ce P
lc •
Hal
f Yea
r Rep
ort
1 J
anua
ry–3
0 J
une
20
21
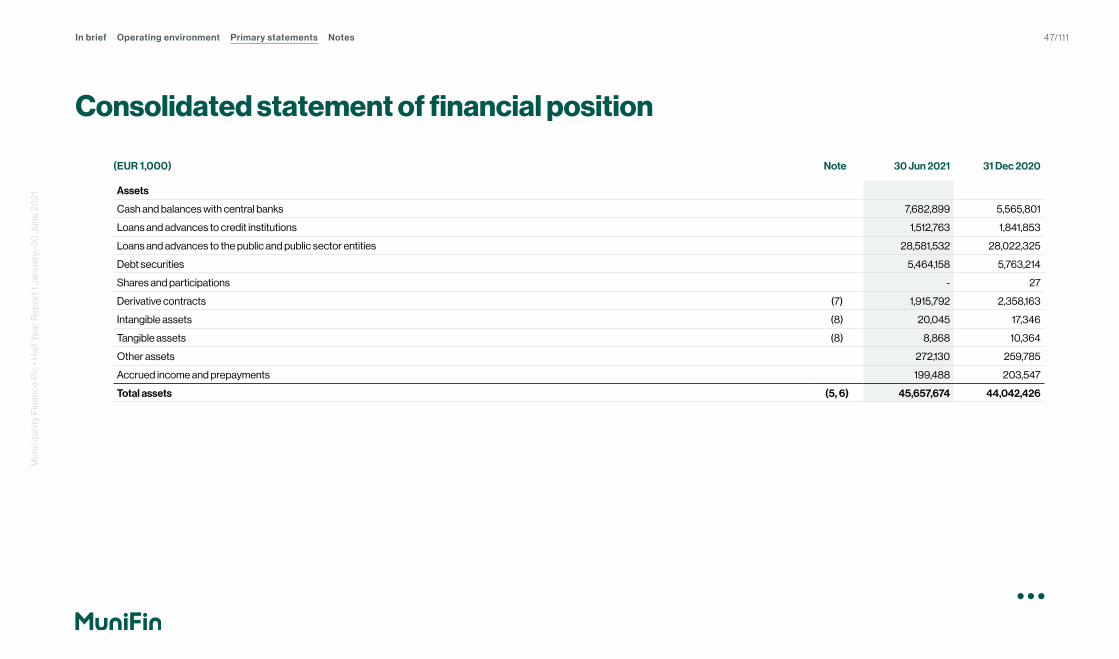
(EUR 1,000) Note 30 Jun 2021 31 Dec 2020
Assets
Cash and balances with central banks 7,682,899 5,565,801
Loans and advances to credit institutions 1,512,763 1,841,853
Loans and advances to the public and public sector entities 28,581,532 28,022,325
Debt securities 5,464,158 5,763,214
Shares and participations - 27
Derivative contracts (7) 1,915,792 2,358,163
Intangible assets (8) 20,045 17,346
Tangible assets (8) 8,868 10,364
Other assets 272,130 259,785
Accrued income and prepayments 199,488 203,547
Total assets (5, 6) 45,657,674 44,042,426
Consolidated statement of financial position
Consolidated statement of financial position
In brief Operating environment Primary statements Notes 47/111M
unic
ipal
ity F
inan
ce P
lc •
Hal
f Yea
r Rep
ort
1 J
anua
ry–3
0 J
une
20
21
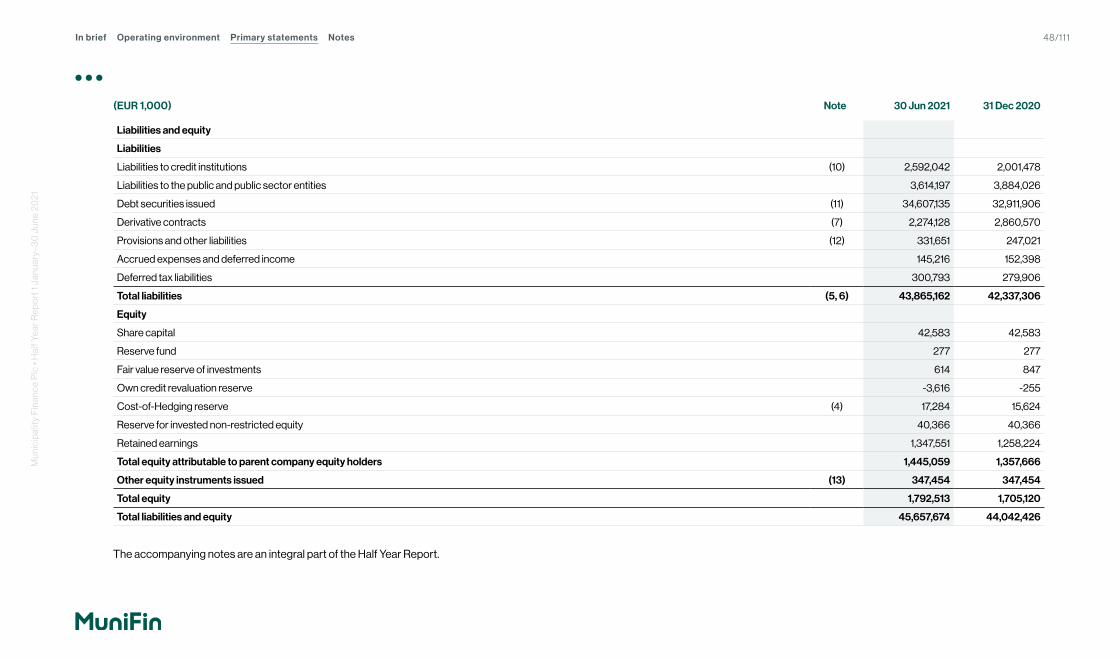
(EUR 1,000) Note 30 Jun 2021 31 Dec 2020
Liabilities and equity
Liabilities
Liabilities to credit institutions (10) 2,592,042 2,001,478
Liabilities to the public and public sector entities 3,614,197 3,884,026
Debt securities issued (11) 34,607,135 32,911,906
Derivative contracts (7) 2,274,128 2,860,570
Provisions and other liabilities (12) 331,651 247,021
Accrued expenses and deferred income 145,216 152,398
Deferred tax liabilities 300,793 279,906
Total liabilities (5, 6) 43,865,162 42,337,306
Equity
Share capital 42,583 42,583
Reserve fund 277 277
Fair value reserve of investments 614 847
Own credit revaluation reserve -3,616 -255
Cost-of-Hedging reserve (4) 17,284 15,624
Reserve for invested non-restricted equity 40,366 40,366
Retained earnings 1,347,551 1,258,224
Total equity attributable to parent company equity holders 1,445,059 1,357,666
Other equity instruments issued (13) 347,454 347,454
Total equity 1,792,513 1,705,120
Total liabilities and equity 45,657,674 44,042,426
The accompanying notes are an integral part of the Half Year Report.
In brief Operating environment Primary statements Notes 48/111M
unic
ipal
ity F
inan
ce P
lc •
Hal
f Yea
r Rep
ort
1 J
anua
ry–3
0 J
une
20
21
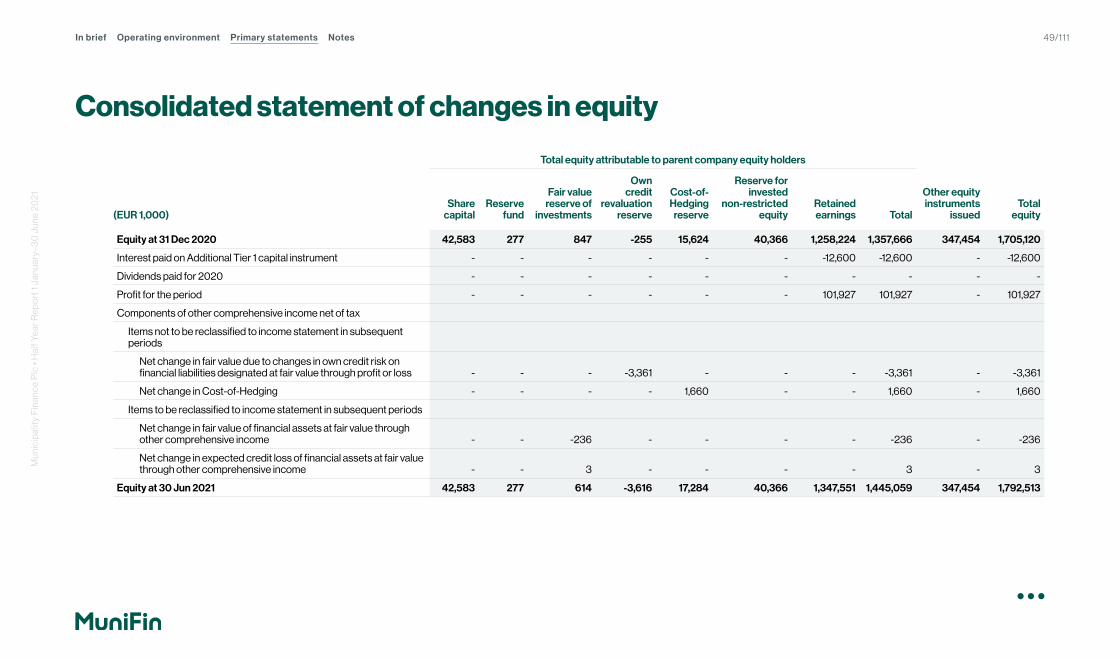
Consolidated statement of changes in equity
(EUR 1,000)
Total equity attributable to parent company equity holders
Other equity instruments
issuedTotal
equityShare
capitalReserve
fund
Fair valuereserve of
investments
Own credit
revaluationreserve
Cost-of-Hedging
reserve
Reserve forinvested
non-restrictedequity
Retained earnings Total
Equity at 31 Dec 2020 42,583 277 847 -255 15,624 40,366 1,258,224 1,357,666 347,454 1,705,120
Interest paid on Additional Tier 1 capital instrument - - - - - - -12,600 -12,600 - -12,600
Dividends paid for 2020 - - - - - - - - - -
Profit for the period - - - - - - 101,927 101,927 - 101,927
Components of other comprehensive income net of tax
Items not to be reclassified to income statement in subsequent periods
Net change in fair value due to changes in own credit risk on financial liabilities designated at fair value through profit or loss - - - -3,361 - - - -3,361 - -3,361
Net change in Cost-of-Hedging - - - - 1,660 - - 1,660 - 1,660
Items to be reclassified to income statement in subsequent periods
Net change in fair value of financial assets at fair value through other comprehensive income - - -236 - - - - -236 - -236
Net change in expected credit loss of financial assets at fair value through other comprehensive income - - 3 - - - - 3 - 3
Equity at 30 Jun 2021 42,583 277 614 -3,616 17,284 40,366 1,347,551 1,445,059 347,454 1,792,513
Consolidated statement of changes in equity
In brief Operating environment Primary statements Notes 49/111M
unic
ipal
ity F
inan
ce P
lc •
Hal
f Yea
r Rep
ort
1 J
anua
ry–3
0 J
une
20
21
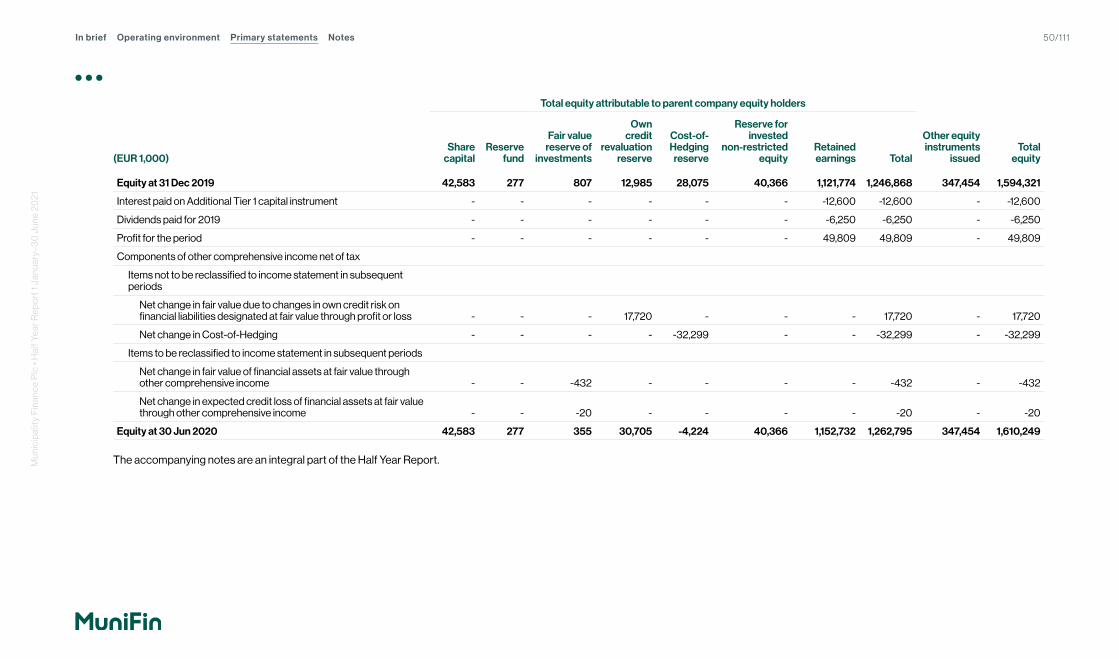
(EUR 1,000)
Total equity attributable to parent company equity holders
Other equity instruments
issuedTotal
equityShare
capitalReserve
fund
Fair valuereserve of
investments
Own credit
revaluationreserve
Cost-of-Hedging
reserve
Reserve forinvested
non-restrictedequity
Retained earnings Total
Equity at 31 Dec 2019 42,583 277 807 12,985 28,075 40,366 1,121,774 1,246,868 347,454 1,594,321
Interest paid on Additional Tier 1 capital instrument - - - - - - -12,600 -12,600 - -12,600
Dividends paid for 2019 - - - - - - -6,250 -6,250 - -6,250
Profit for the period - - - - - - 49,809 49,809 - 49,809
Components of other comprehensive income net of tax
Items not to be reclassified to income statement in subsequent periods
Net change in fair value due to changes in own credit risk on financial liabilities designated at fair value through profit or loss - - - 17,720 - - - 17,720 - 17,720
Net change in Cost-of-Hedging - - - - -32,299 - - -32,299 - -32,299
Items to be reclassified to income statement in subsequent periods
Net change in fair value of financial assets at fair value through other comprehensive income - - -432 - - - - -432 - -432
Net change in expected credit loss of financial assets at fair value through other comprehensive income - - -20 - - - - -20 - -20
Equity at 30 Jun 2020 42,583 277 355 30,705 -4,224 40,366 1,152,732 1,262,795 347,454 1,610,249
The accompanying notes are an integral part of the Half Year Report.
In brief Operating environment Primary statements Notes 50/111M
unic
ipal
ity F
inan
ce P
lc •
Hal
f Yea
r Rep
ort
1 J
anua
ry–3
0 J
une
20
21

Consolidated statement of cash flows(EUR 1,000) 1 Jan–30 Jun 2021 1 Jan–30 Jun 2020
Cash flow from operating activities 2,071,302 -1,249,874
Net change in long-term funding 2,469,670 1,511,097
Net change in short-term funding -211,341 378,609
Net change in long-term loans -785,686 -1,788,614
Net change in short-term loans -171,123 -1,119,934
Net change in investments 453,410 140,050
Net change in collaterals 201,603 -492,543
Interest on assets 4,098 41,573
Interest on liabilities 109,644 87,889
Other income 37,763 35,271
Payments of operating expenses -41,362 -46,859
Taxes paid 4,625 3,588
Cash flow from investing activities -3,958 -3,459
Acquisition of tangible assets -1 -947
Proceeds from sale of tangible assets 204 32
Acquisition of intangible assets -4,161 -2,544
Cash flow from financing activities -16,648 -22,864
Paid interest on AT1 capital instrument -15,750 -15,750
Dividend paid - -6,250
Total cash flow from leases -898 -864
Change in cash and cash equivalents 2,050,696 -1,276,198
Cash and cash equivalents at 1 Jan 5,730,680 4,990,649
Cash and cash equivalents at 30 Jun 7,781,376 3,714,451
Cash and cash equivalents include the following statement of financial position items:Cash and balances with central banks and Loans and advances to credit institutions payable on demand.
(EUR 1,000) 30 Jun 2021 30 Jun 2020
Cash and balances with central banks 7,682,899 3,473,933
Loans and advances to credit institutions 98,477 240,518
Total cash and cash equivalents 7,781,376 3,714,451
The accompanying notes are an integral part of the Half Year Report.
Consolidated statement of cash flows
In brief Operating environment Primary statements Notes 51/111M
unic
ipal
ity F
inan
ce P
lc •
Hal
f Yea
r Rep
ort
1 J
anua
ry–3
0 J
une
20
21

Note 1. Basis of preparation of the Half Year Report
Note 2. Interest income and expense
Note 3. Net income from securities and foreign exchange transactions
Note 4. Hedge accounting
Note 5. Financial assets and liabilities
Note 6. Fair values of financial assets and liabilities
Note 7. Derivative contracts
Note 8. Changes in intangible and tangible assets
Note 9. Credit risks of financial assets and other commitments
Note 10. Liabilities to credit institutions
Note 11. Debt securities issued
Note 12. Provisions and other liabilities
Note 13. Capital instruments
Note 14. Collateral given
Note 15. Contingent assets and liabilities
Note 16. Off-balance sheet commitments
Note 17. Related-party transactions
Note 18. Events after the reporting period
Notes to the Half Year Report
Notes to the Half Year Report
In brief Operating environment Primary statements NotesM
unic
ipal
ity F
inan
ce P
lc •
Hal
f Yea
r Rep
ort
1 J
anua
ry–3
0 J
une
20
21
52/111

Note 1. Basis of preparation of the Half Year Report
The Half Year Report has been prepared in accordance with International Financial Reporting Standards (IFRS). The Half Year Report complies with IAS 34 Interim Financial Reporting and the accounting policies presented in the Consolidated Financial Statements 2020 (Note 1). This Half Year Report should be read in conjunction with the audited Consolidated Financial Statements for the year ended 31 December 2020. Accounting policies, which have been amended during the reporting period due to the application of new and amended standards, are explained below.
The figures in the Notes to the Half Year Report are presented in thousand euro. All figures in the Half Year Report have been rounded, so the total of individual figures may differ from the total figure presented. The Half Year Report has been subject to a review by the auditors.
The Half Year Report is available in Finnish and English. The Finnish version is official and will be used if there is any discrepancy between the language versions.
New definition of defaultAs of 1 January 2021, MuniFin Group adopted the European Banking Authority’s (EBA) guidelines on the application of the definition of default (Guidelines on the application of the definition of default under Article 178 of Regulation (EU) No 575/2013: EBA/GL/2016/07 and EBA/RTS/2016/06). The guidelines harmonise the definition of default applied by European banks on
their customers. The process in accordance with the Guidelines recognises defaults earlier, based on the unlikeliness to pay criteria that include, for example, payment defaults registered in external credit registers or granted forbearance where the present value of the loan decreases by more than 1 per cent. The implementation of the new definition of default did not have a significant impact on MuniFin Group’s expected credit losses.
IBOR reformIBOR reform is a global change aimed at replacing Interbank Offered Rates (IBORs) with alternative nearly risk-free rates (RFR). The impact of the IBOR reform on MuniFin Group and the transition project are discussed in detail in the Consolidated Financial Statements 2020 (Note 1) in Section IBOR reform. MuniFin Group has applied the IBOR reform related phase 2 amendments to IFRS 9, IAS 39, IFRS 7, IFRS 4 and IFRS 16 standards as of 31 December 2020.
Management’s judgement and estimatesPreparation of the Half Year Report in accordance with IFRS requires management judgement and estimates. The significant assumptions made by the Group concern key uncertainty factors pertaining to the future and the estimates at the reporting date.
Due to the uncertainties in relation to the potential short and long-term impact of the COVID-19 pandemic, MuniFin Group has applied management judgement in the preparation of the Half
Year Report. Areas particularly important in the first half of 2021 are expected credit losses of loans, in particular in relation to the assessments of significant increase in credit risk and credit impaired (staging) due to increase in forbearance measures and the application of macroeconomic scenarios related to COVID-19 pandemic. In addition to the model-based expected credit losses, the Group recorded in the financial year 2020 an additional discretionary provision (management overlay) amounting to EUR 340 thousand to cover the deterioration of its customers’ credit risk due to the COVID-19 pandemic, which is not yet reflected in the Group’s internal risk ratings which are based on the clients’ 2019 financial statement data. The internal risk ratings will be updated during Q3. Although the financial situation at the reporting date looks better than at the financial statement date, there is still uncertainty about the customers’ financial situation. For this reason, the Group’s management decided not to change the additional provision during the reporting period. More information on the Group’s expected credit losses and the ECL calculations can be found in Note 9 Credit risks of financial assets and other commitments.
More information on where management judgement is generally applied and where estimation uncertainty exists can be found in the accounting policies of the Consolidated Financial Statements 2020 (Note 1) in Section Accounting policies requiring management judgement and key uncertainty factors related to estimates.
In brief Operating environment Primary statements NotesM
unic
ipal
ity F
inan
ce P
lc •
Hal
f Yea
r Rep
ort
1 J
anua
ry–3
0 J
une
20
21
53/111

Note 2. Interest income and expense
1 JAN–30 JUN 2021 (EUR 1,000)Interest and
similar incomeInterest and
similar expense Net
Assets
Amortised cost
Cash and balances with central banks - -18,313 -18,313
Loans and advances to credit institutions 27 -4,059 -4,032
Loans and advances to the public and public sector entities 95,392 - 95,392
Debt securities 8 -2,568 -2,559
Other assets 310 - 310
Fair value through other comprehensive income
Debt securities - -330 -330
Designated at fair value through profit or loss
Loans and advances to the public and public sector entities 609 - 609
Debt securities 4,580 - 4,580
Mandatorily at fair value through profit or loss
Loans and advances to the public and public sector entities 421 - 421
Debt securities - - -
Fair value through profit or loss
Derivative contracts at fair value through profit or loss 37,819 -50,897 -13,079
Derivative contracts in hedge accounting -45,475 - -45,475
Leased assets 2,980 - 2,980
Interest on non-financial other assets 3 - 3
Interest on assets 96,676 -76,167 20,509
, of which interest income/expense according to the effective interest method 95,738 -25,270
In brief Operating environment Primary statements NotesM
unic
ipal
ity F
inan
ce P
lc •
Hal
f Yea
r Rep
ort
1 J
anua
ry–3
0 J
une
20
21
54/111
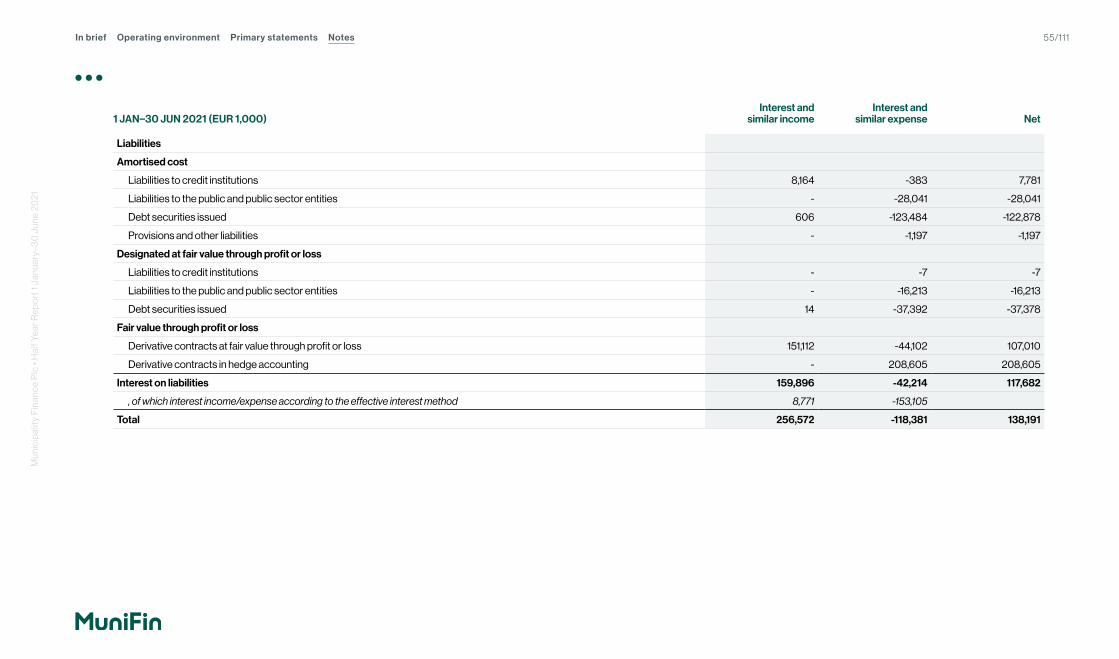
1 JAN–30 JUN 2021 (EUR 1,000)Interest and
similar incomeInterest and
similar expense Net
Liabilities
Amortised cost
Liabilities to credit institutions 8,164 -383 7,781
Liabilities to the public and public sector entities - -28,041 -28,041
Debt securities issued 606 -123,484 -122,878
Provisions and other liabilities - -1,197 -1,197
Designated at fair value through profit or loss
Liabilities to credit institutions - -7 -7
Liabilities to the public and public sector entities - -16,213 -16,213
Debt securities issued 14 -37,392 -37,378
Fair value through profit or loss
Derivative contracts at fair value through profit or loss 151,112 -44,102 107,010
Derivative contracts in hedge accounting - 208,605 208,605
Interest on liabilities 159,896 -42,214 117,682
, of which interest income/expense according to the effective interest method 8,771 -153,105
Total 256,572 -118,381 138,191
In brief Operating environment Primary statements NotesM
unic
ipal
ity F
inan
ce P
lc •
Hal
f Yea
r Rep
ort
1 J
anua
ry–3
0 J
une
20
21
55/111
Interest income on stage 3 financial assets in the expected credit loss (ECL) calculations totalled EUR 487 thousand (EUR 273 thousand) during the reporting period. These are included in the line items Loans and advances to the public and public sector entities and Leased assets.
Interest expense on provisions and other liabilities includes EUR 38 thousand (EUR 48 thousand) of interest on lease liabilities recognised in accordance with IFRS 16 Leases standard.
Interest expenses on financial assets at amortised cost on cash and balances with central banks consists of interest paid on central bank deposits and interest on loans and advances to credit institutions of interest on cash collateral receivables. Interest expenses on debt securities consists of interest paid on short-term lending. Negative interest arises on debt securities at fair value through other comprehensive income due to the premium / discount amortisation of debt securities and commercial papers. Interest expenses on derivative contracts at fair value through profit or loss consist of negative interest income on derivative contracts that are not included in hedge accounting. The derivative contracts
contained in this line item hedge financial assets which are designated at fair value through profit or loss, derivative contracts with municipalities and derivative contracts hedging derivatives with municipalities, in addition to derivative contracts used for hedging interest rate risk of the balance sheet, for which no hedged item has been specified. Derivative contracts in hedge accounting hedge loans and advances to the public and public sector entities.
Interest income on financial liabilities at amortised cost to credit institutions consists of interest received on cash collateral liabilities as well as on TLTRO III debt and interest income on debt securities issued consists of interest received on ECPs. Interest income on derivative contracts at fair value through profit or loss consists of positive interest expense on derivatives that are not included in hedge accounting. Derivative contracts contained in this line item hedge financial liabilities which are designated at fair value through profit or loss. Derivative contracts in hedge accounting are used as hedges for liabilities to credit institutions, liabilities to the public and public sector entities and debt securities issued.
In brief Operating environment Primary statements NotesM
unic
ipal
ity F
inan
ce P
lc •
Hal
f Yea
r Rep
ort
1 J
anua
ry–3
0 J
une
20
21
56/111

1 JAN–30 JUN 2020 (EUR 1,000)Interest and similar
incomeInterest and similar
expense Net
Assets
Amortised cost
Cash and balances with central banks - -11,883 -11,883
Loans and advances to credit institutions 36 -2,229 -2,193
Loans and advances to the public and public sector entities 96,207 - 96,207
Debt securities 276 -1,076 -800
Other assets 96 - 96
Fair value through other comprehensive income
Debt securities - -637 -637
Designated at fair value through profit or loss
Debt securities 7,335 - 7,335
Mandatorily at fair value through profit or loss
Loans and advances to the public and public sector entities 492 - 492
Debt securities - - -
Fair value through profit or loss
Derivative contracts at fair value through profit or loss 35,819 -47,153 -11,334
Derivative contracts in hedge accounting -38,811 - -38,811
Leased assets 2,840 - 2,840
Interest on non-financial other assets 3 - 3
Interest on assets 104,292 -62,978 41,314
, of which interest income/expense according to the effective interest method 96,615 -15,825
In brief Operating environment Primary statements NotesM
unic
ipal
ity F
inan
ce P
lc •
Hal
f Yea
r Rep
ort
1 J
anua
ry–3
0 J
une
20
21
57/111

1 JAN–30 JUN 2020 (EUR 1,000)Interest and similar
incomeInterest and similar
expense Net
Liabilities
Amortised cost
Liabilities to credit institutions 2,748 - 2,748
Liabilities to the public and public sector entities - -30,654 -30,654
Debt securities issued 1,560 -131,101 -129,540
Provisions and other liabilities - -1,100 -1,100
Designated at fair value through profit or loss
Liabilities to credit institutions - -31 -31
Liabilities to the public and public sector entities - -17,488 -17,488
Debt securities issued - -85,915 -85,915
Fair value through profit or loss
Derivative contracts at fair value through profit or loss 177,738 -37,203 140,535
Derivative contracts in hedge accounting - 203,505 203,505
Interest on liabilities 182,047 -99,987 82,060
, of which interest income/expense according to the effective interest method 4,308 -162,807
Total 286,339 -162,965 123,374
In brief Operating environment Primary statements NotesM
unic
ipal
ity F
inan
ce P
lc •
Hal
f Yea
r Rep
ort
1 J
anua
ry–3
0 J
une
20
21
58/111

Note 3. Net income from securities and foreign exchange transactions
NET INCOME FROM SECURITIES AND FOREIGN EXCHANGE TRANSACTIONS 1 JAN–30 JUN 2021 (EUR 1,000)
Capital gains and losses (net) Change in fair value Total
Financial assets
Designated at fair value through profit or loss - -15,785 -15,785
Mandatorily at fair value through profit or loss -23 -1,430 -1,453
Financial liabilities
Designated at fair value through profit or loss - 57,206 57,206
Derivative contracts at fair value through profit or loss 1,246 -25,297 -24,052
Day 1 gain or loss - 43 43
Total net income from securities transactions 1,223 14,736 15,959
Net income from foreign exchange transactions 14 1,175 1,190
Total 1,237 15,911 17,148
Net income from securities transactions includes fair value changes of financial assets and liabilities measured at fair value through profit or loss, fair value changes of derivative contracts not included in hedge accounting (derivative contracts at fair value through profit or loss) as well as capital gains and losses related to these items. Net income from foreign exchange transactions includes unrealised and realised translation differences for all items denominated in foreign currencies. The reconciliation for Day 1 gain or loss is presented in Note 6 Fair values of financial assets and liabilities.
In brief Operating environment Primary statements NotesM
unic
ipal
ity F
inan
ce P
lc •
Hal
f Yea
r Rep
ort
1 J
anua
ry–3
0 J
une
20
21
59/111
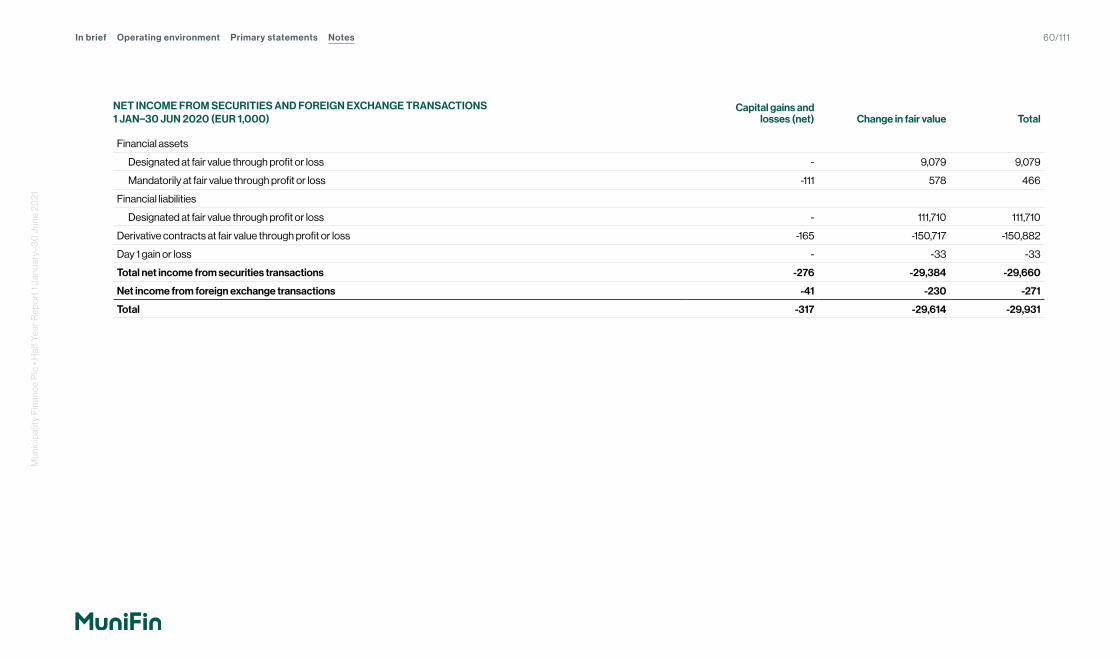
NET INCOME FROM SECURITIES AND FOREIGN EXCHANGE TRANSACTIONS 1 JAN–30 JUN 2020 (EUR 1,000)
Capital gains and losses (net) Change in fair value Total
Financial assets
Designated at fair value through profit or loss - 9,079 9,079
Mandatorily at fair value through profit or loss -111 578 466
Financial liabilities
Designated at fair value through profit or loss - 111,710 111,710
Derivative contracts at fair value through profit or loss -165 -150,717 -150,882
Day 1 gain or loss - -33 -33
Total net income from securities transactions -276 -29,384 -29,660
Net income from foreign exchange transactions -41 -230 -271
Total -317 -29,614 -29,931
In brief Operating environment Primary statements NotesM
unic
ipal
ity F
inan
ce P
lc •
Hal
f Yea
r Rep
ort
1 J
anua
ry–3
0 J
une
20
21
60/111

Tables below present carrying amounts of financial assets and liabilities designated at fair value through profit or loss and their fair value changes recognised during the reporting period in the income statement under Net income from securities transactions and in the other comprehensive income under Net change in fair value due to changes in own credit risk on financial liabilities designated at fair value through profit or loss.
FINANCIAL ASSETS AND LIABILITIES DESIGNATED AT FAIR VALUE THROUGH PROFIT OR LOSS (EUR 1,000)
Nominal value 30 Jun 2021
Carrying amount 30 Jun 2021
Nominal value 31 Dec 2020
Carrying amount 31 Dec 2020
Financial assets
Loans and advances to the public and public sector entities 30,000 39,882 - -
Debt securities 3,619,476 3,699,822 3,912,451 4,029,859
Total financial assets * 3,649,476 3,739,704 3,912,451 4,029,859
Financial liabilities
Liabilities to credit institutions 11,000 10,801 25,000 24,558
Liabilities to the public sector entities 1,597,037 1,537,416 1,908,373 1,637,674
Debt securities issued 10,657,541 9,995,676 10,927,113 10,454,282
Total financial liabilities 12,265,578 11,543,892 12,860,486 12,116,514
* Financial assets designated at fair value through profit or loss are exposed to credit risk up to the carrying amounts of those securities at 30 Jun 2021 and 31 Dec 2020.
In brief Operating environment Primary statements NotesM
unic
ipal
ity F
inan
ce P
lc •
Hal
f Yea
r Rep
ort
1 J
anua
ry–3
0 J
une
20
21
61/111

CHANGE IN FAIR VALUE OF FINANCIAL ASSETS DESIGNATED AT FAIR VALUE THROUGH PROFIT OR LOSS (EUR 1,000) 30 Jun 2021 1 Jan 2021
Fair value change recognised in the
income statement 1 Jan–30 Jun 2021
, of which due to credit risk
, of which due to market risk
Financial assets
Loans and advances to the public and public sector entities 9,882 - 9,882 -56 9,939
Debt securities 44,192 69,859 -25,667 1,159 -26,826
Total financial assets 54,074 69,859 -15,785 1,102 -16,887
Financial assets that MuniFin Group has designated at fair value through profit or loss include debt securities in the liquidity portfolio and some lending agreements of which the interest rate risk is hedged with interest rate and cross currency interest rate swaps. The designation is made as it significantly reduces accounting mismatch which would otherwise arise from measuring the deriv-ative contract at fair value through profit or loss and the debt security at fair value through other comprehensive income and lending agreements at amortised cost based on the IFRS 9 business model. MuniFin Group does not have credit derivatives hedging these financial assets.
CHANGE IN FAIR VALUE OF FINANCIAL LIABILITIES DESIGNATED AT FAIR VALUE THROUGH PROFIT OR LOSS (EUR 1,000) 30 Jun 2021 1 Jan 2021
Fair value change recognised in the
income statement 1 Jan–30 Jun 2021
Change in own credit risk recognised in the other
comprehensive income 1 Jan–30 Jun 2021
Total fair value change in
1 Jan–30 Jun 2021
Financial liabilities
Liabilities to credit institutions 199 418 -219 - -219
Liabilities to the public and public sector entitities -190,593 -244,146 53,553 -65 53,488
Debt securities issued 389,295 385,424 3,872 -4,136 -265
Total financial liabilities 198,902 141,696 57,206 -4,201 53,004
In brief Operating environment Primary statements NotesM
unic
ipal
ity F
inan
ce P
lc •
Hal
f Yea
r Rep
ort
1 J
anua
ry–3
0 J
une
20
21
62/111
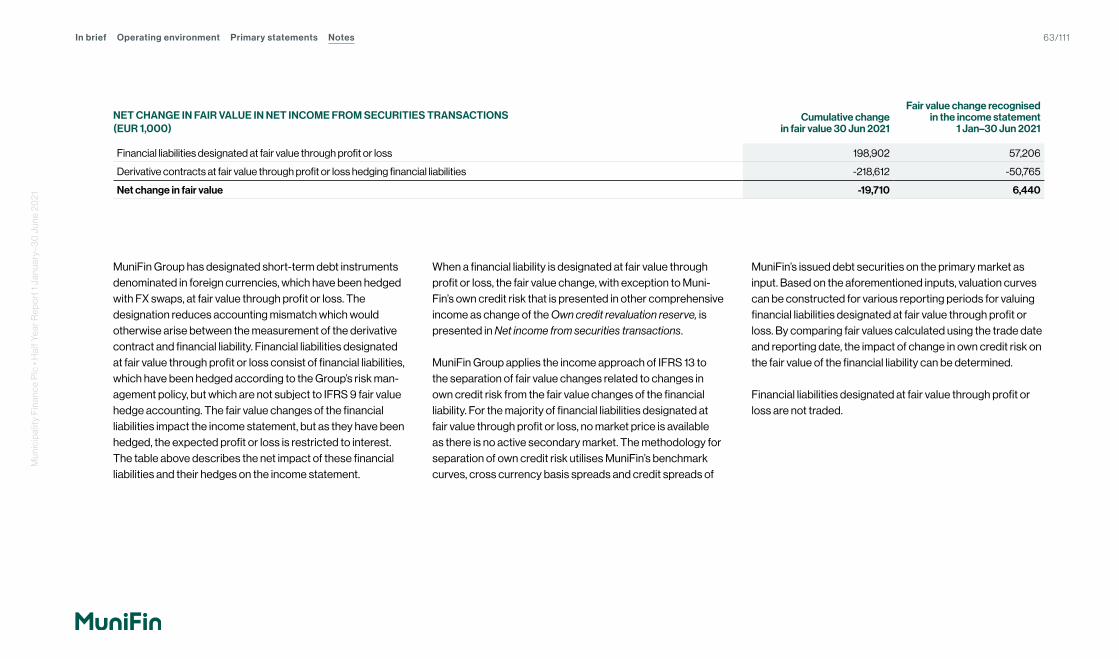
NET CHANGE IN FAIR VALUE IN NET INCOME FROM SECURITIES TRANSACTIONS (EUR 1,000)
Cumulative change in fair value 30 Jun 2021
Fair value change recognised in the income statement
1 Jan–30 Jun 2021
Financial liabilities designated at fair value through profit or loss 198,902 57,206
Derivative contracts at fair value through profit or loss hedging financial liabilities -218,612 -50,765
Net change in fair value -19,710 6,440
MuniFin Group has designated short-term debt instruments denominated in foreign currencies, which have been hedged with FX swaps, at fair value through profit or loss. The designation reduces accounting mismatch which would otherwise arise between the measurement of the derivative contract and financial liability. Financial liabilities designated at fair value through profit or loss consist of financial liabilities, which have been hedged according to the Group’s risk man-agement policy, but which are not subject to IFRS 9 fair value hedge accounting. The fair value changes of the financial liabilities impact the income statement, but as they have been hedged, the expected profit or loss is restricted to interest. The table above describes the net impact of these financial liabilities and their hedges on the income statement.
When a financial liability is designated at fair value through profit or loss, the fair value change, with exception to Muni-Fin’s own credit risk that is presented in other comprehensive income as change of the Own credit revaluation reserve, is presented in Net income from securities transactions. MuniFin Group applies the income approach of IFRS 13 to the separation of fair value changes related to changes in own credit risk from the fair value changes of the financial liability. For the majority of financial liabilities designated at fair value through profit or loss, no market price is available as there is no active secondary market. The methodology for separation of own credit risk utilises MuniFin’s benchmark curves, cross currency basis spreads and credit spreads of
MuniFin’s issued debt securities on the primary market as input. Based on the aforementioned inputs, valuation curves can be constructed for various reporting periods for valuing financial liabilities designated at fair value through profit or loss. By comparing fair values calculated using the trade date and reporting date, the impact of change in own credit risk on the fair value of the financial liability can be determined. Financial liabilities designated at fair value through profit or loss are not traded.
In brief Operating environment Primary statements NotesM
unic
ipal
ity F
inan
ce P
lc •
Hal
f Yea
r Rep
ort
1 J
anua
ry–3
0 J
une
20
21
63/111

CHANGE IN FAIR VALUE OF FINANCIAL ASSETS DESIGNATED AT FAIR VALUE THROUGH PROFIT OR LOSS ( EUR 1,000) 30 Jun 2020 1 Jan 2020
Fair value change recognised in the
income statement 1 Jan–30 Jun 2020
, of which due to credit risk
, of which due to market risk
Financial assets
Debt securities 62,188 53,109 9,079 -6,399 15,478
Total financial assets 62,188 53,109 9,079 -6,399 15,478
CHANGE IN FAIR VALUE OF FINANCIAL LIABILITIES DESIGNATED AT FAIR VALUE THROUGH PROFIT OR LOSS (EUR 1,000) 30 Jun 2020 1 Jan 2020
Fair value change recognised in the
income statement 1 Jan–30 Jun 2020
Change in own credit risk recognised in the other
comprehensive income 1 Jan–30 Jun 2020
Total fair value change in
1 Jan–30 Jun 2020
Financial liabilities
Liabilities to credit institutions 915 - 915 - 915
Liabilities to the public and public sector entities -253,279 -218,911 -34,368 13,427 -20,941
Debt securities issued 473,966 328,802 145,164 8,723 153,887
Total financial liabilities 221,601 109,891 111,710 22,150 133,860
NET CHANGE IN FAIR VALUE IN NET INCOME FROM SECURITIES TRANSACTIONS (EUR 1,000)
Cumulative change in fair value
30 Jun 2020
Fair value change recognised in the
income statement 1 Jan–30 Jun 2020
Financial liabilities designated at fair value through profit or loss 221,601 111,710
Derivative contracts at fair value through profit or loss hedging financial liabilities -253,195 -121,740
Net change in fair value -31,594 -10,029
In brief Operating environment Primary statements NotesM
unic
ipal
ity F
inan
ce P
lc •
Hal
f Yea
r Rep
ort
1 J
anua
ry–3
0 J
une
20
21
64/111

Note 4. Hedge accounting
The interest rate and foreign exchange rate risk of the Group are managed by entering into derivative transactions. According to the Market Risk Policy, the Group’s hedging strategy is mainly to hedge all material foreign exchange and interest rate risks of financial assets and liabilities with maturities exceeding one year. As a result, foreign currency denominated items are translated into euros, fixed rate and long-term reference rates are swapped to floating interest rates with shorter terms. The risk management principles related to the Group’ s hedging of market risk are described in more detail in the Consolidated Financial Statements 2020
in Note 2 Risk Management principles and the Group’s risk position. The Group applies both fair value hedge accounting according to IFRS 9 and fair value portfolio hedge accounting according to IAS 39. The Group does not apply cash flow hedge accounting. Accounting policies related to hedge accounting are described in the accounting polices of the Consolidated Financial Statements 2020 (Note 1) in Section Hedge Accounting.
In the table below the hedged assets and liabilities are presented according to statement of financial position line items divided into IAS 39 portfolio hedge accounting and IFRS 9 fair value hedge accounting, which is further subdivided into whether hedging is subject to the separation of the Cost-of-Hedging.
HEDGE ACCOUNTING 30 JUN 2021 (EUR 1,000) Nominal value
Fair value hedge accounting total
IAS 39 portfolio hedge accounting
IFRS 9 fair value hedge accounting
IFRS 9 fair value hedge accounting
incl. Cost-of-Hedging
Assets
Loans and advances to the public and public sector entities - Loans 12,143,432 12,380,462 12,248,956 131,505 -
Loans and advances to the public and public sector entities - Leased assets 241,280 243,038 - 243,038 -
Total assets 12,384,712 12,623,500 12,248,956 374,544 -
Liabilities
Liabilities to credit institutions 45,000 49,041 - 49,041 -
Liabilities to the public and public sector entities 1,758,753 2,076,781 - 2,038,122 38,659
Debt securities issued 23,857,918 24,261,154 - 13,276,901 10,984,254
Total liabilities 25,661,671 26,386,977 - 15,364,064 11,022,913
In brief Operating environment Primary statements NotesM
unic
ipal
ity F
inan
ce P
lc •
Hal
f Yea
r Rep
ort
1 J
anua
ry–3
0 J
une
20
21
65/111

HEDGE ACCOUNTING 31 DEC 2020 (EUR 1,000) Nominal value
Fair value hedge accounting total
IAS 39 portfolio hedge accounting
IFRS 9 fair value hedge accounting
IFRS 9 fair value hedge accounting
incl. Cost-of-Hedging
Assets
Loans and advances to the public and public sector entities - Loans 11,183,657 11,614,114 11,483,819 130,295 -
Loans and advances to the public and public sector entities - Leased assets 211,223 215,444 - 215,444 -
Total assets 11,394,880 11,829,557 11,483,819 345,739 -
Liabilities
Liabilities to credit institutions 55,000 68,800 - 68,800 -
Liabilities to the public and public sector entities 1,853,956 2,246,352 - 2,181,931 64,421
Debt securities issued 21,260,721 22,077,489 - 11,898,132 10,179,357
Total liabilities 23,169,677 24,392,642 - 14,148,863 10,243,779
In brief Operating environment Primary statements NotesM
unic
ipal
ity F
inan
ce P
lc •
Hal
f Yea
r Rep
ort
1 J
anua
ry–3
0 J
une
20
21
66/111

The figures presented in the following table contain the cumulative fair value change at the beginning and end of the reporting period, in addition to the fair value change of the hedged risk and the hedging instrument during the reporting period. The figures presented in the table do not include the change in fair value due to foreign exchange differences of hedging instruments and the hedged items, which are recognised in the income statement under Net income from securities and foreign exchange transactions. Due to the above mentioned reason, the total amount of the hedging instruments does not correspond to the fair value presented in Note 7 Derivatives on line Total derivative contracts in hedge accounting. The fair value changes of the hedged risk of the hedged items and all other fair value changes of the hedging instruments are recognised in the income statement under Net income from hedge accounting. The ineffective portion of the hedging relationship is thus shown on this line in the income statement. Net income from securities and foreign exchange transactions is specified in Note 3. In accordance with the market practice and IFRS 13 Fair value measurement standard, the Group discounts hedged items with the swap curve and the hedging derivatives with the OIS curve, which causes a significant part of the Group’s hedge ineffectiveness. In addition, ineffectiveness may also arise to some extent from differences in notional, day count methods or timing of the cash flows.
VALUE OF HEDGED RISK (EUR 1,000) 30 Jun 2021 1 Jan 2021
Recognised in the income statement 1 Jan–30 Jun 2021
Assets
IAS 39 portfolio hedge accounting
Loans and advances to the public and public sector entities 258,661 464,688 -206,027
Derivative contracts in hedge accounting -221,058 -428,083 207,024
Accumulated fair value accrual from the termination of hedge accounting 30 47 -17
IAS 39 portfolio hedge accounting, net 37,633 36,653 981
IFRS 9 fair value hedge accounting
Loans and advances to the public and public sector entities 30,328 41,424 -11,095
Derivative contracts in hedge accounting -30,757 -42,044 11,287
IFRS 9 fair value hedge accounting, net -429 -620 191
Liabilities
IFRS 9 fair value hedge accounting
Liabilities to credit institutions -4,041 -13,800 9,759
Liabilities to the public and public sector entities -386,712 -481,546 94,833
Debt securities issued -479,411 -859,986 380,575
Derivative contracts in hedge accounting 860,024 1,340,456 -480,432
IFRS 9 fair value hedge accounting, net -10,140 -14,876 4,735
IBOR reform related compensations * -3,061 -2,041 -1,020
Total hedge accounting 24,002 19,116 4,887
* Compensations relate to the ongoing IBOR reform of which more information is presented in the accounting policies of the Consolidated Financial Statements 2020 (Note 1) in Section IBOR reform.
In brief Operating environment Primary statements NotesM
unic
ipal
ity F
inan
ce P
lc •
Hal
f Yea
r Rep
ort
1 J
anua
ry–3
0 J
une
20
21
67/111

The following table presents the impact of Cost-of-Hedging of cross currency derivatives on equity in the Cost-of-Hedging reserve. The figures are presented net of deferred taxes. For all foreign currency hedge relationships the Group has elected to utilise Cost-of-Hedging. For each hedge relationship, when the cross currency swap is designated as a hedging instrument, the cross currency basis spread is separated and excluded from the designation and accounted for as Cost-of-Hedging. The difference between the changes in fair value of the actual derivative and the designated portion of the derivative are recorded in other comprehensive income as Cost-of-Hedging to the Cost-of-Hedging reserve. Thus, changes in cross currency basis spreads will impact other comprehensive income and do not create ineffectiveness in the hedge relationship.
HEDGING IMPACT ON EQUITY (EUR 1,000) 30 Jun 2021 1 Jan 2021
Impact on Cost-of-Hedging
reserve
Cost-of-Hedging
Derivative contracts in hedge accounting 17,284 15,624 1,660
Total 17,284 15,624 1,660
In brief Operating environment Primary statements NotesM
unic
ipal
ity F
inan
ce P
lc •
Hal
f Yea
r Rep
ort
1 J
anua
ry–3
0 J
une
20
21
68/111

The table below presents the cumulative effectiveness of hedge accounting by hedged items. In addition, the table shows the hedging instruments used.
EFFECTIVENESS OF HEDGE ACCOUNTING 30 JUN 2021 (EUR 1,000) Gains/losses attributable to the hedged risk
Hedge ineffectivenessHEDGED ITEM Hedging instruments Hedged items Hedging instruments
Assets
IAS 39 portfolio hedge accounting
Fixed rate and revisable rate loans Interest rate derivatives 258,661 -221,058 37,603
IFRS 9 fair value hedge accounting
Structured lending Interest rate derivatives 28,569 -28,767 -198
Fixed rate and revisable rate leased assets Interest rate derivatives 1,759 -1,990 -231
Assets total 288,989 -251,816 37,174
Liabilities
IFRS 9 fair value hedge accounting
Financial liabilities denominated in EUR Interest rate derivatives -623,068 618,217 -4,851
Financial liabilities denominated in foreign currencies
Currency derivatives (Cross currency interest rate swaps)
Interest rate derivatives -247,097 241,808 -5,289
Liabilities total -870,165 860,024 -10,140
In brief Operating environment Primary statements NotesM
unic
ipal
ity F
inan
ce P
lc •
Hal
f Yea
r Rep
ort
1 J
anua
ry–3
0 J
une
20
21
69/111

VALUE OF HEDGED RISK (EUR 1,000) 30 Jun 2020 1 Jan 2020
Recognised in the income statement
1 Jan–30 Jun 2020
Assets
IAS 39 portfolio hedge accounting
Loans and advances to the public and public sector entities 458,260 303,139 155,120
Derivative contracts in hedge accounting -426,697 -276,831 -149,866
Accumulated fair value accrual from the termination of hedge accounting 68 - 68
IAS 39 portfolio hedge accounting, net 31,630 26,308 5,322
IFRS 9 fair value hedge accounting
Loans and advances to the public and public sector entities 40,883 30,934 9,949
Derivative contracts in hedge accounting -43,279 -33,193 -10,086
IFRS 9 Fair value hedge accounting, net -2,396 -2,258 -138
Liabilities
IFRS 9 fair value hedge accounting
Liabilities to credit institutions -14,072 -12,916 -1,156
Liabilities to the public and public sector entities -510,164 -434,953 -75,211
Debt securities issued -944,170 -524,923 -419,247
Derivative contracts in hedge accounting 1,452,486 963,674 488,812
IFRS 9 fair value hedge accounting, net -15,920 -9,118 -6,802
Total hedge accounting 13,314 14,932 -1,618
In brief Operating environment Primary statements NotesM
unic
ipal
ity F
inan
ce P
lc •
Hal
f Yea
r Rep
ort
1 J
anua
ry–3
0 J
une
20
21
70/111

HEDGING IMPACT ON EQUITY (EUR 1,000) 30 Jun 2020 1 Jan 2020
Impact on Cost-of-Hedging
reserve
Cost-of-Hedging
Derivative contracts in hedge accounting -4,224 28,075 -32,299
Total -4,224 28,075 -32,299
EFFECTIVENESS OF HEDGE ACCOUNTING 30 JUN 2020 (EUR 1,000) Gains/losses attributable to the hedged risk
Hedge ineffectivenessHEDGED ITEM Hedging instruments Hedged items Hedging instruments
Assets
IAS 39 portfolio hedge accounting
Fixed rate and revisable rate loans Interest rate derivatives 458,260 -426,697 31,562
IFRS 9 fair value hedge accounting
Structured lending Interest rate derivatives 36,913 -39,008 -2,095
Fixed rate and revisable rate leased assets Interest rate derivatives 3,970 -4,271 -301
Assets total 499,143 -469,976 29,166
Liabilities
IFRS 9 fair value hedge accounting
Financial liabilities denominated in EUR Interest rate derivatives -951,520 948,220 -3,300
Financial liabilities denominated in foreign currencies
Currency derivatives (Cross currency interest rate swaps)
Interest rate derivatives -516,886 504,266 -12,621
Liabilities total -1,468,406 1,452,486 -15,920
In brief Operating environment Primary statements NotesM
unic
ipal
ity F
inan
ce P
lc •
Hal
f Yea
r Rep
ort
1 J
anua
ry–3
0 J
une
20
21
71/111
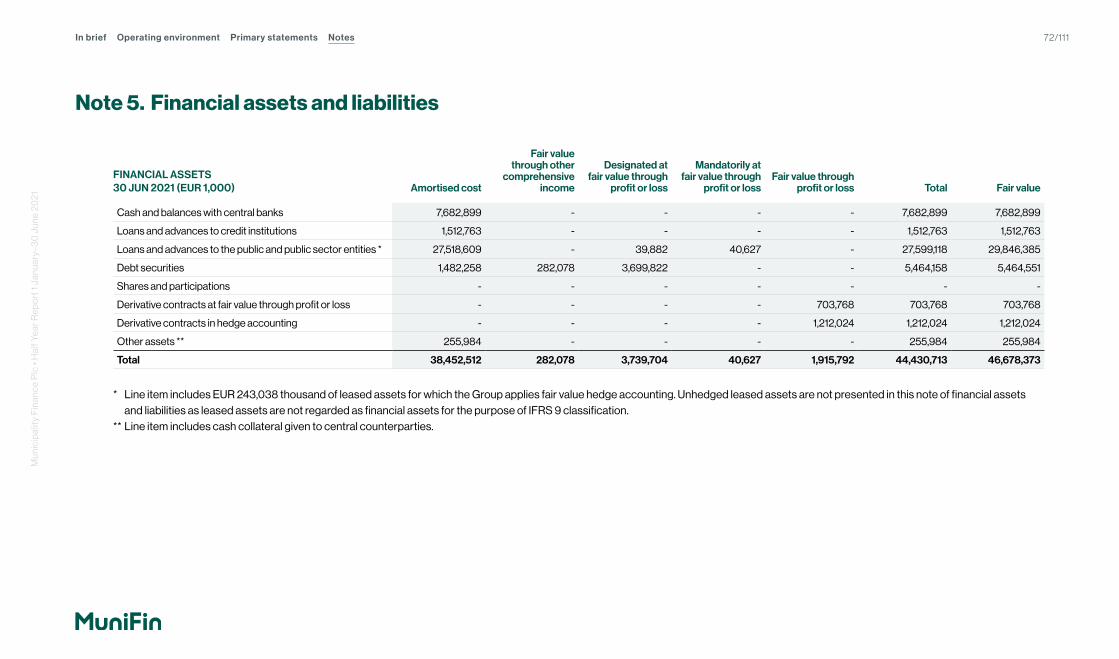
Note 5. Financial assets and liabilities
FINANCIAL ASSETS 30 JUN 2021 (EUR 1,000) Amortised cost
Fair value through other
comprehensive income
Designated at fair value through
profit or loss
Mandatorily at fair value through
profit or lossFair value through
profit or loss Total Fair value
Cash and balances with central banks 7,682,899 - - - - 7,682,899 7,682,899
Loans and advances to credit institutions 1,512,763 - - - - 1,512,763 1,512,763
Loans and advances to the public and public sector entities * 27,518,609 - 39,882 40,627 - 27,599,118 29,846,385
Debt securities 1,482,258 282,078 3,699,822 - - 5,464,158 5,464,551
Shares and participations - - - - - - -
Derivative contracts at fair value through profit or loss - - - - 703,768 703,768 703,768
Derivative contracts in hedge accounting - - - - 1,212,024 1,212,024 1,212,024
Other assets ** 255,984 - - - - 255,984 255,984
Total 38,452,512 282,078 3,739,704 40,627 1,915,792 44,430,713 46,678,373
* Line item includes EUR 243,038 thousand of leased assets for which the Group applies fair value hedge accounting. Unhedged leased assets are not presented in this note of financial assets and liabilities as leased assets are not regarded as financial assets for the purpose of IFRS 9 classification.
** Line item includes cash collateral given to central counterparties.
In brief Operating environment Primary statements NotesM
unic
ipal
ity F
inan
ce P
lc •
Hal
f Yea
r Rep
ort
1 J
anua
ry–3
0 J
une
20
21
72/111

FINANCIAL LIABILITIES 30 JUN 2021 (EUR 1,000) Amortised cost
Designated at fair value through
profit or lossFair value through
profit or loss Total Fair value
Liabilities to credit institutions 2,581,241 10,801 - 2,592,042 2,591,903
Liabilities to the public and public sector entities 2,076,781 1,537,416 - 3,614,197 3,635,253
Debt securities issued 24,611,459 9,995,676 - 34,607,135 34,688,402
Derivative contracts at fair value through profit or loss - - 1,073,707 1,073,707 1,073,707
Derivative contracts in hedge accounting - - 1,200,421 1,200,421 1,200,421
Provisions and other liabilities * 315,228 - - 315,228 315,228
Total 29,584,710 11,543,892 2,274,128 43,402,730 43,504,913
* Line item includes EUR 309,945 thousand of cash collateral received from central counterparties and EUR 5,284 thousand of lease liabilities in accordance with IFRS 16 standard.
In brief Operating environment Primary statements NotesM
unic
ipal
ity F
inan
ce P
lc •
Hal
f Yea
r Rep
ort
1 J
anua
ry–3
0 J
une
20
21
73/111

FINANCIAL ASSETS 31 DEC 2020 (EUR 1,000) Amortised cost
Fair value through other
comprehensive income
Designated at fair value through
profit or loss
Mandatorily at fair value through
profit or lossFair value through
profit or loss Total Fair value
Cash and balances with central banks 5,565,801 - - - - 5,565,801 5,565,801
Loans and advances to credit institutions 1,841,853 - - - - 1,841,853 1,841,853
Loans and advances to the public and public sector entities * 27,102,391 - - 44,438 - 27,146,828 29,643,718
Debt securities 1,310,305 423,050 4,029,859 - - 5,763,214 5,763,793
Shares and participations - - - 27 - 27 27
Derivative contracts at fair value through profit or loss - - - - 833,293 833,293 833,293
Derivative contracts in hedge accounting - - - - 1,524,870 1,524,870 1,524,870
Other assets ** 243,269 - - - - 243,269 243,269
Total 36,063,619 423,050 4,029,859 44,465 2,358,163 42,919,155 45,416,624
* Line item includes EUR 215,444 thousand of leased assets for which the Group applies fair value hedge accounting. ** Line item includes cash collateral given to central counterparties.
In brief Operating environment Primary statements NotesM
unic
ipal
ity F
inan
ce P
lc •
Hal
f Yea
r Rep
ort
1 J
anua
ry–3
0 J
une
20
21
74/111

FINANCIAL LIABILITIES 31 DEC 2020 (EUR 1,000) Amortised cost
Designated at fair value through
profit or lossFair value through
profit or loss Total Fair value
Liabilities to credit institutions 1,976,920 24,558 - 2,001,478 2,001,414
Liabilities to the public and public sector entities 2,246,352 1,637,674 - 3,884,026 3,906,619
Debt securities issued 22,457,624 10,454,282 - 32,911,906 32,968,471
Derivative contracts at fair value through profit or loss - - 1,403,900 1,403,900 1,403,900
Derivative contracts in hedge accounting - - 1,456,670 1,456,670 1,456,670
Provisions and other liabilities * 237,212 - - 237,212 237,212
Total 26,918,108 12,116,514 2,860,570 41,895,193 41,974,287
* Line item includes EUR 231,180 thousand of cash collateral received from central counterparties and EUR 6,032 thousand of lease liabilities in accordance with IFRS 16 standard.
RECLASSIFIED FINANCIAL ASSETS (EUR 1,000)
Original measurement category
under IAS 39
New measurement category
under IFRS 9Fair value
30 Jun 2021
Fair value gain or loss for the
reporting period *EIR determined
as at 1 Jan 2018 **
Interest revenue recognised during 1 Jan–30 Jun 2021
Loans and advances to the public and public sector entities Fair value option Amortised cost 103,531 -1,041 0.14% 352
* The fair value gain or loss that would have been recognised in the income statement during the reporting period if the financial assets had not been reclassified.** Effective interest rate determined on the date of initial application.
RECLASSIFIED FINANCIAL ASSETS (EUR 1,000)
Original measurement category
under IAS 39
New measurement category
under IFRS 9Fair value
31 Dec 2020
Fair value gain or loss for the financial year
EIR determined as at 1 Jan 2018
Interest revenue recognised during 1 Jan–31 Dec 2020
Loans and advances to the public and public sector entities Fair value option Amortised cost 113,143 1,119 0.14% 187
In brief Operating environment Primary statements NotesM
unic
ipal
ity F
inan
ce P
lc •
Hal
f Yea
r Rep
ort
1 J
anua
ry–3
0 J
une
20
21
75/111

Note 6. Fair values of financial assets and liabilities
Fair value is the price that would be received to sell the asset or paid to transfer the liability in an orderly transaction between market participants at the measurement date. The Group measures fair values using the following fair value hierarchy, which reflects the significance of the inputs used in making the fair value measurements:
Level 1Inputs that are quoted market prices (unadjusted) for identical instruments in active markets that the Group can access at the measurement date. The market is considered to be active if trading is frequent and price data is regularly available. These quotes (mid) represent the price for an orderly transaction between parties in the market on the valuation date. Level 1 instruments comprise mainly investments in debt securities.
Level 2Inputs other than quoted prices included within level 1 that are observable either directly (i.e. as prices) or indirectly (i.e. derived from prices). This level includes instruments valued using quoted prices for identical instruments in markets that are considered less than active or other valuation techniques in which all significant inputs are directly or indirectly observable from market data. Level 2 instruments comprise mainly OTC derivatives, Group’s issued plain-vanilla financial liabilities and Group’s lending agreements.
Level 3This level includes all instruments for which the valuation technique includes inputs that are not observable and the unobservable inputs have a significant effect on the instrument’s valuation. Unobservable inputs are used only to the extent that no relevant observable inputs are available. If the valuation input is illiquid, extrapolated or based on historical prices, the valuation input will be defined as a level 3 valuation input as these types of inputs are per definition unobservable. This level includes financial instruments with equity and FX structures due to impact of the utilisation of inputs such as dividend yield on the fair value measurement. In addition, level 3 contains some interest rate structures with long maturities (exceeding e.g. 35 years) or in currencies where the interest rate curve is not considered liquid for all maturities.
Due to the nature of MuniFin Group’s funding portfolio (i.e. issued bond is hedged back-to-back), if a swap that is hedging an issued bond is designated as a level 3 instrument, then the issued bond will also be designated as a level 3 instrument. Same principle applies to other portfolios and levels of the hierarchy as well. In addition to financial assets and liabilities, the Group does not hold other assets or liabilities which are measured at fair value or assets or liabilities which are non-recurringly measured at fair value.
In brief Operating environment Primary statements NotesM
unic
ipal
ity F
inan
ce P
lc •
Hal
f Yea
r Rep
ort
1 J
anua
ry–3
0 J
une
20
21
76/111

The following table presents financial instruments by the level of the fair value hierarchy into which the fair value measurement is categorised.
FINANCIAL ASSETS30 JUN 2021 (EUR 1,000) Carrying amount
Fair value
Level 1 Level 2 Level 3 Total
At fair value
Fair value through other comprehensive income
Debt securities 282,078 211,215 70,863 - 282,078
Designated at fair value through profit or loss
Loans and advances to the public and public sector entities 39,882 - 39,882 - 39,882
Debt securities 3,699,822 3,664,123 35,699 - 3,699,822
Mandatorily at fair value through profit or loss
Loans and advances to the public and public sector entities 40,627 - 521 40,106 40,627
Shares and participations - - - - -
Fair value through profit or loss
Derivative contracts at fair value through profit or loss 703,768 - 640,206 63,561 703,768
Derivative contracts in hedge accounting 1,212,024 - 1,211,708 317 1,212,024
Total at fair value 5,978,200 3,875,338 1,998,878 103,984 5,978,200
In fair value hedge accounting
Amortised cost
Loans and advances to the public and public sector entities 12,623,500 - 13,413,722 - 13,413,722
Total in fair value hedge accounting 12,623,500 - 13,413,722 - 13,413,722
At amortised cost
Cash and balances with central banks 7,682,899 7,682,899 - - 7,682,899
Loans and advances to credit institutions 1,512,763 170,130 1,342,633 - 1,512,763
Loans and advances to the public and public sector entities 14,895,109 - 16,352,153 - 16,352,153
Debt securities 1,482,258 - 1,482,652 - 1,482,652
Other assets 255,984 - 255,984 - 255,984
Total at amortised cost 25,829,012 7,853,029 19,433,422 - 27,286,450
Total financial assets 44,430,713 11,728,367 34,846,022 103,984 46,678,373
In brief Operating environment Primary statements NotesM
unic
ipal
ity F
inan
ce P
lc •
Hal
f Yea
r Rep
ort
1 J
anua
ry–3
0 J
une
20
21
7 7/111

FINANCIAL LIABILITIES30 JUN 2021 (EUR 1,000) Carrying amount
Fair value
Level 1 Level 2 Level 3 Total
At fair value
Designated at fair value through profit or loss
Liabilities to credit institutions 10,801 - 10,801 - 10,801
Liabilities to the public and public sector entities 1,537,416 - 1,308,330 229,085 1,537,416
Debt securities issued 9,995,676 - 7,982,906 2,012,769 9,995,676
Fair value through profit or loss
Derivative contracts at fair value through profit or loss 1,073,707 - 443,563 630,144 1,073,707
Derivative contracts in hedge accounting 1,200,421 - 1,180,352 20,069 1,200,421
Total at fair value 13,818,020 - 10,925,952 2,892,067 13,818,020
In fair value hedge accounting
Amortised cost
Liabilities to credit institutions 49,041 - 48,902 - 48,902
Liabilities to the public and public sector entities 2,076,781 - 2,097,837 - 2,097,837
Debt securities issued * 24,261,154 - 24,246,676 95,746 24,342,421
Total in fair value hedge accounting 26,386,977 - 26,393,415 95,746 26,489,160
At amortised cost
Liabilities to credit institutions 2,532,200 - 2,532,200 - 2,532,200
Debt securities issued 350,305 - 350,305 - 350,305
Provisions and other liabilities 315,228 - 315,228 - 315,228
Total at amortised cost 3,197,733 - 3,197,733 - 3,197,733
Total financial liabilities 43,402,730 - 40,517,100 2,987,813 43,504,913
* MuniFin Group’s fixed-rate benchmark bond issuances are presented on level 2 due the fact that these bonds are in fair value hedge accounting with respect to the hedged risk. Valuation of the hedged risk is based on the level 2 inputs. In the Notes of the Half Year Report, the Group’s fixed-rate benchmark bonds’ fair values are adjusted to reflect fair value based on the quoted prices from Bloomberg. The market price is a level 1 input.
In brief Operating environment Primary statements NotesM
unic
ipal
ity F
inan
ce P
lc •
Hal
f Yea
r Rep
ort
1 J
anua
ry–3
0 J
une
20
21
78/111
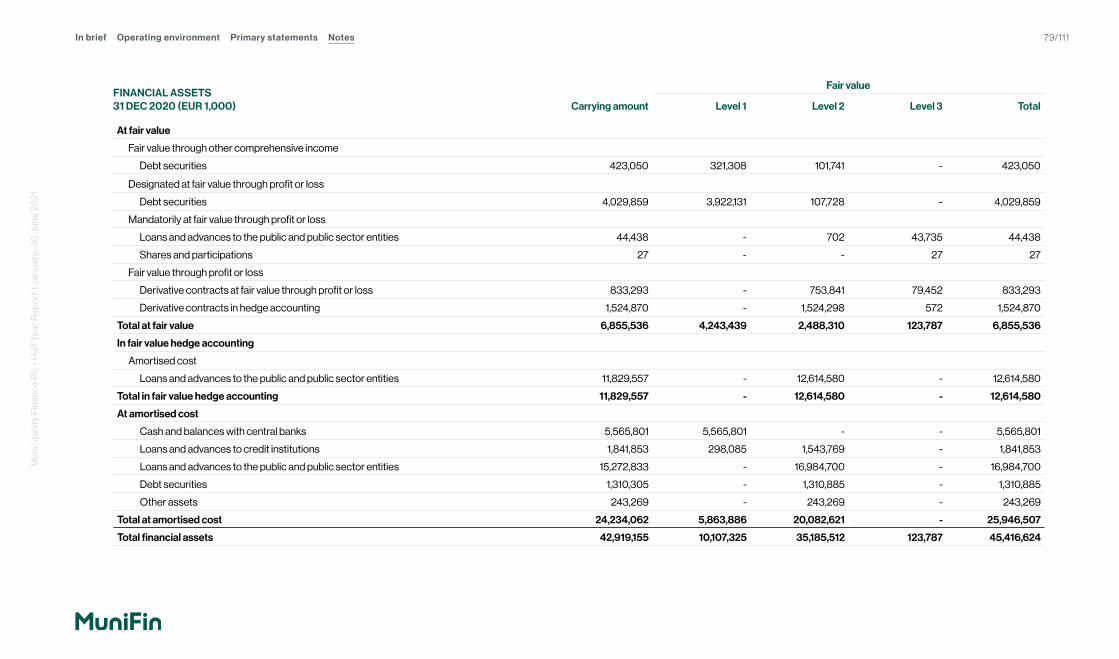
FINANCIAL ASSETS31 DEC 2020 (EUR 1,000) Carrying amount
Fair value
Level 1 Level 2 Level 3 Total
At fair value
Fair value through other comprehensive income
Debt securities 423,050 321,308 101,741 - 423,050
Designated at fair value through profit or loss
Debt securities 4,029,859 3,922,131 107,728 - 4,029,859
Mandatorily at fair value through profit or loss
Loans and advances to the public and public sector entities 44,438 - 702 43,735 44,438
Shares and participations 27 - - 27 27
Fair value through profit or loss
Derivative contracts at fair value through profit or loss 833,293 - 753,841 79,452 833,293
Derivative contracts in hedge accounting 1,524,870 - 1,524,298 572 1,524,870
Total at fair value 6,855,536 4,243,439 2,488,310 123,787 6,855,536
In fair value hedge accounting
Amortised cost
Loans and advances to the public and public sector entities 11,829,557 - 12,614,580 - 12,614,580
Total in fair value hedge accounting 11,829,557 - 12,614,580 - 12,614,580
At amortised cost
Cash and balances with central banks 5,565,801 5,565,801 - - 5,565,801
Loans and advances to credit institutions 1,841,853 298,085 1,543,769 - 1,841,853
Loans and advances to the public and public sector entities 15,272,833 - 16,984,700 - 16,984,700
Debt securities 1,310,305 - 1,310,885 - 1,310,885
Other assets 243,269 - 243,269 - 243,269
Total at amortised cost 24,234,062 5,863,886 20,082,621 - 25,946,507
Total financial assets 42,919,155 10,107,325 35,185,512 123,787 45,416,624
In brief Operating environment Primary statements NotesM
unic
ipal
ity F
inan
ce P
lc •
Hal
f Yea
r Rep
ort
1 J
anua
ry–3
0 J
une
20
21
79/111

FINANCIAL LIABILITIES31 DEC 2020 (EUR 1,000) Carrying amount
Fair value
Level 1 Level 2 Level 3 Total
At fair value
Designated at fair value through profit or loss
Liabilities to credit institutions 24,558 - 24,558 - 24,558
Liabilities to the public and public sector entities 1,637,674 - 1,413,261 224,413 1,637,674
Debt securities issued 10,454,282 - 8,328,568 2,125,714 10,454,282
Fair value through profit or loss
Derivative contracts at fair value through profit or loss 1,403,900 - 757,607 646,293 1,403,900
Derivative contracts in hedge accounting 1,456,670 - 1,432,280 24,391 1,456,670
Total at fair value 14,977,085 - 11,956,273 3,020,811 14,977,085
In fair value hedge accounting
Amortised cost
Liabilities to credit institutions 68,800 - 68,736 - 68,736
Liabilities to the public and public sector entities 2,246,352 - 2,268,946 - 2,268,946
Debt securities issued 22,077,489 - 22,040,007 94,048 22,134,054
Total in fair value hedge accounting 24,392,642 - 24,377,688 94,048 24,471,736
At amortised cost
Liabilities to credit institutions 1,908,120 - 1,908,120 - 1,908,120
Debt securities issued 380,134 - 380,134 - 380,134
Provisions and other liabilities 237,212 - 237,212 - 237,212
Total at amortised cost 2,525,467 - 2,525,467 - 2,525,467
Total financial liabilities 41,895,193 - 38,859,428 3,114,859 41,974,287
In brief Operating environment Primary statements NotesM
unic
ipal
ity F
inan
ce P
lc •
Hal
f Yea
r Rep
ort
1 J
anua
ry–3
0 J
une
20
21
80/111
IFRS 13 classifies valuation models and techniques into three different categories: Market approach, Income approach and Cost approach. MuniFin Group applies the market-based approach when the instrument has a functioning market and public price quotations are available. The Group uses the market approach for the valuation of investment bonds of the liquidity portfolio. For all level 1 assets, the Group uses market prices available for identical assets (same ISIN). The Group does not make use of prices for comparable assets. Income approach is applied when valuation is based, for example, on determining the present value of future cash flows (discounting). Valuation methods take into account an assessment of the credit risk, discount rates used, the possibility of early repayment and other factors that influence the fair value of a financial instrument reliably. The Group uses the income approach for many of its financial instruments, for example derivatives, lending and funding. The Group does not use the cost approach for the valuation of any of its financial instruments.
The Group uses widely recognised valuation models to determine the fair value of common and simple financial instruments, such as interest rate and currency swaps, that use only observable market data and require little management judgement and estimation. Observable prices or model inputs are usually available in the market for listed debt and equity securities and simple OTC derivatives such as interest rate swaps. The availability of observable market prices and model inputs reduces the need for management
judgement and estimation and reduces the uncertainty associated with determining fair values. The availability of observable market prices and inputs varies depending on the products and markets and is prone to changes based on specific events and general conditions in the financial markets.
MuniFin Group applies different models in order to derive the fair value of a certain type of instruments. The choice of base models and its calibration depends on the complexity of the financial instrument and the observability of the relevant inputs. In line with market practice, the primary choice of base model is contingent on the underlying instrument classes. Additionally, instruments are broken down into different categories granular enough to capture the most important risk drivers and different kind of calibration techniques. The specific combination of base models and the different assumptions and calibrations techniques are documented. The Group’s fair value instruments that are subject to mark-to-model valuation techniques consist of four asset classes: - Interest rate instruments, - Foreign exchange instruments, - Equity-linked instruments and- Hybrid instruments.
Financial instruments under FX, equity and hybrid classes are mainly classified as level 3 instruments.
Fair value of financial instruments is generally calculated as the net present value of the individual instruments. This calculation is supplemented by counterparty level adjustments. The Group incorporates credit valuation adjustments (CVA) and debit valuation adjustments (DVA) into derivative valuations. CVA reflects the impact of the counterparty’s credit risk on fair value and DVA MuniFin Group’s own credit quality. The Group uses the same methodology to compute CVA and DVA. They are both assessed as the result of three inputs: Loss Given Default (LGD), Probability of Default (PD, own for DVA and of the counterparty for CVA), Expected Exposure (EE).
Valuation frameworkMuniFin Group has implemented a framework for the arrangements, activities and procedures with regards to the Group’s model risk management. The purpose of the model risk management framework is to ensure the effective management of model risk and mitigation of fair value uncertainty, as well as to ensure compliance with external and internal requirements. The Group ensures that all aspects of the lifecycle of valuation models (i.e. approval, design and development, testing and maintenance, monitoring and execution) are subject to effective governance, clear roles and responsibilities and effective internal control.
In brief Operating environment Primary statements NotesM
unic
ipal
ity F
inan
ce P
lc •
Hal
f Yea
r Rep
ort
1 J
anua
ry–3
0 J
une
20
21
81/111

The Group manages and maintains a model inventory which provides a holistic view of all valuation models, their business purpose and characteristics as well as their applications and conditions for use. The Executive Management Team (EMT) is responsible for the approval of new valuation models (including limitations and conditions of use) and material changes to existing models. All approved valuation models within the model inventory are subject to annual review and re-approval by the EMT.
The Finance Management Team acts as a valuation control group for MuniFin Group’s fair values and is responsible for the final approval of the Group’s fair values for financial reporting. The Finance Management Team monitors and controls MuniFin Group’s valuation process and the performance of valuation models, decides on the necessary measures and reports to the EMT. The Finance Management Team assesses whether the valuation models and valuation process provide sufficiently accurate information to be used in financial reporting and, based on the information received, decides on possible adjustments to the values generated by the valuation process.
The Group has implemented an efficient control and performance monitoring framework with regards to its valuation models, which aims to ensure the accuracy and appropriateness of model output. The model performance monitoring consists of four main controls: - Counterparty valuation control (CVC),- Fair value explanation, - Independent price verification (IPV) and - Independent model validation.
Counterparty valuation control (CVC) is performed daily by Risk Management, who assesses any deviations in valuation model output compared to MuniFin Group’s own earlier valuations and to counterparty valuations. The results of the assessment are reported monthly to the Finance Management Team. Fair value explanation process consists of a daily analysis and explain of the changes in fair values by Risk Management and a monthly fair value explain report to the Finance Management Team. The independent price verification is performed monthly as part of MuniFin Group’s IPV process by a third party service provider. The results of the control activities are reported monthly to the Finance Management Team. The independent model validation is performed annually for a subset of MuniFin Group’s valuation models by a third-party service provider. The results of the model validation are reported to the Finance Management Team.
Transfers in the fair value hierarchyMuniFin Group assesses the appropriateness and correctness of the categorisation with regards to the fair value hierarchy classification at initial recognition and at the end of each reporting period. This is to determine the initial classification of a level 1, 2 and 3 instrument and the subsequent potential transfers between levels within the fair value hierarchy. A transfer between the fair value hierarchies can occur for example when a previously assumed observed input requires an adjustment using an unobservable input. The procedure is the same for transfers into and out of the fair value levels. Transfers between the levels are considered to take place at the end of the quarter during which an event causes such transfer or when circumstances change.
In brief Operating environment Primary statements NotesM
unic
ipal
ity F
inan
ce P
lc •
Hal
f Yea
r Rep
ort
1 J
anua
ry–3
0 J
une
20
21
82/111
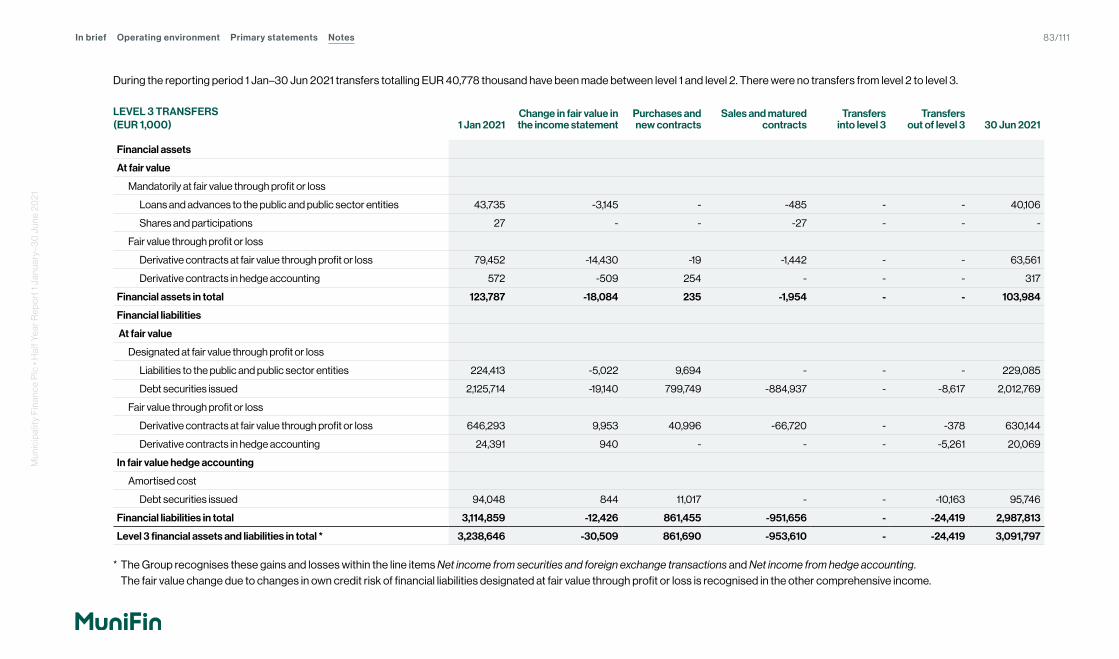
During the reporting period 1 Jan–30 Jun 2021 transfers totalling EUR 40,778 thousand have been made between level 1 and level 2. There were no transfers from level 2 to level 3.
LEVEL 3 TRANSFERS (EUR 1,000) 1 Jan 2021
Change in fair value in the income statement
Purchases and new contracts
Sales and matured contracts
Transfers into level 3
Transfers out of level 3 30 Jun 2021
Financial assets
At fair value
Mandatorily at fair value through profit or loss
Loans and advances to the public and public sector entities 43,735 -3,145 - -485 - - 40,106
Shares and participations 27 - - -27 - - -
Fair value through profit or loss
Derivative contracts at fair value through profit or loss 79,452 -14,430 -19 -1,442 - - 63,561
Derivative contracts in hedge accounting 572 -509 254 - - - 317
Financial assets in total 123,787 -18,084 235 -1,954 - - 103,984
Financial liabilities
At fair value
Designated at fair value through profit or loss
Liabilities to the public and public sector entities 224,413 -5,022 9,694 - - - 229,085
Debt securities issued 2,125,714 -19,140 799,749 -884,937 - -8,617 2,012,769
Fair value through profit or loss
Derivative contracts at fair value through profit or loss 646,293 9,953 40,996 -66,720 - -378 630,144
Derivative contracts in hedge accounting 24,391 940 - - - -5,261 20,069
In fair value hedge accounting
Amortised cost
Debt securities issued 94,048 844 11,017 - - -10,163 95,746
Financial liabilities in total 3,114,859 -12,426 861,455 -951,656 - -24,419 2,987,813
Level 3 financial assets and liabilities in total * 3,238,646 -30,509 861,690 -953,610 - -24,419 3,091,797
* The Group recognises these gains and losses within the line items Net income from securities and foreign exchange transactions and Net income from hedge accounting. The fair value change due to changes in own credit risk of financial liabilities designated at fair value through profit or loss is recognised in the other comprehensive income.
In brief Operating environment Primary statements NotesM
unic
ipal
ity F
inan
ce P
lc •
Hal
f Yea
r Rep
ort
1 J
anua
ry–3
0 J
une
20
21
83/111

During 2020 transfers totalling EUR 205,516 thousand were made between level 1 and level 2 and EUR 35,796 thousand between level 2 and level 3.
LEVEL 3 TRANSFERS (EUR 1,000) 1 Jan 2020
Change in fair value in the income statement
Purchases and new contracts
Sales and matured contracts
Transfers into level 3
Transfers out of level 3 31 Dec 2020
Financial assets
At fair value
Mandatorily at fair value through profit or loss
Loans and advances to the public and public sector entities 50,028 -4,714 - -1,578 - - 43,735
Shares and participations - - - - 27 - 27
Fair value through profit or loss
Derivative contracts at fair value through profit or loss 133,007 -12,405 -32 -41,804 686 - 79,452
Derivative contracts in hedge accounting 3,728 -2,118 117 - - -1,154 572
Financial assets in total 186,764 -19,238 84 -43,382 713 -1,154 123,787
Financial liabilities
At fair value
Designated at fair value through profit or loss
Liabilities to the public and public sector entities 138,684 9,860 49,782 - 26,088 - 224,413
Debt securities issued 3,077,729 -259,858 868,572 -1,566,659 8,617 -2,686 2,125,714
Fair value through profit or loss
Derivative contracts at fair value through profit or loss 458,243 289,125 37,906 -139,179 378 -181 646,293
Derivative contracts in hedge accounting 12,646 18,479 1,432 - - -8,167 24,391
In fair value hedge accounting
Amortised cost
Debt securities issued 151,671 -13,650 21,314 - - -65,286 94,048
Financial liabilities in total 3,838,973 43,955 979,006 -1,705,838 35,083 -76,320 3,114,859
Level 3 financial assets and liabilities in total 4,025,736 24,717 979,090 -1,749,220 35,796 -77,474 3,238,646
In brief Operating environment Primary statements NotesM
unic
ipal
ity F
inan
ce P
lc •
Hal
f Yea
r Rep
ort
1 J
anua
ry–3
0 J
une
20
21
84/111

Sensitivity analysis of unobservable inputsSensitivity analysis illustrates the impact of the reasonably possible assumptions on the fair value of financial instruments for which valuation is dependent on unobservable inputs. However, it is unlikely in practice that all unobservable inputs would simultaneously move to extremes of reasonably possible alternatives used in the sensitivity analysis. Hence, the impact of the sensitivity analysis disclosed in this Note is likely to be greater than
the true uncertainty in the fair values at the reporting date. Furthermore, the disclosure is neither predictive nor indicative of future movements in the fair value of financial instruments.
Although the Group believes that its estimates of fair value are appropriate, the use of different methodologies or assumptions could lead to different measurements of fair value. For fair value measurements on level 3, changing
one or more of the assumptions to the reasonably possible alternative assumptions would have the following effects: as of 30 June 2021, these assumptions could have increased fair values by EUR 55.4 million or decreased fair values by EUR 52.9 million and as of 31 December 2020, these assumptions could have increased fair values by EUR 44.6 million or decreased fair values by EUR 33.7 million.
SENSITIVITY ANALYSIS OF SIGNIFICANT UNOBSERVABLE INPUTS BY INSTRUMENT TYPE (EUR 1,000)
30 Jun 2021 31 Dec 2020
Positive range of fair value
Negative range of fair value
Positive range of fair value
Negative range of fair value
Loans and advances to the public and public sector entities
Loans 545 199 542 327
Derivative contracts
Equity linked derivatives 17,932 -13,244 12,416 -7,240
FX linked cross currency and interest rate derivatives -170 -2,218 1,786 -365
Other interest rate derivatives 10,266 -11,007 8,686 -10,165
Debt securities issued and Liabilities to the public and public sector entities
Equity linked liabilities 13,709 -15,425 11,690 -5,248
FX linked liabilities 1,882 598 -941 -1,681
Other liabilities 11,190 -11,819 10,430 -9,276
Total 55,354 -52,915 44,609 -33,648
In brief Operating environment Primary statements NotesM
unic
ipal
ity F
inan
ce P
lc •
Hal
f Yea
r Rep
ort
1 J
anua
ry–3
0 J
une
20
21
85/111

The behaviour of the fair value of the unobservable inputs on level 3 is not necessarily independent, and dynamic rela-tionships often exist between the unobservable inputs and the observable inputs. Such relationships, where material to the fair value of a given instrument, are controlled via pricing models or valuation techniques. MuniFin Group uses stochastic models to generate a distribution of future cash flows of each financial instrument. The future cash flows are then discounted back to present to get the fair value of each financial instrument. The stochastic models used by the Group are Hull-White model and Dupire volatility model. The unobservable inputs used by the Group are described below. The unobservable inputs are used only to the extent that no relevant observable inputs are available.
Correlation parametersIf the fair value of a financial instrument is impacted by more than one unobservable input, correlations describe the rela-tionship between these different underlyings. For example for equity linked instruments, correlation has a significant impact on fair value, if the underlying is dependant on more than one equity. For FX linked cross currency and interest rate deriv-atives, correlations exist between FX rates of currencies, which impact the fair value of the financial instrument. If a high correlation exists between the unobservable inputs, it will lead to an increase in fair value. A low correlation between the unobservable inputs will lead to a decrease in fair value.
The majority of the financial instruments with correlation as significant unobservable input are the Group’s funding products and their hedging instruments.
Volatility (extrapolated or illiquid) A financial instrument whose value is based on a stochastic model will typically require the volatility of the underlying instrument as an input. The Group uses Dupire local volatility model as its stochastic valuation model. For interest rate volatilities at-the-money implied volatility is used. For FX and equity components (both equity indices and single stock prices), a full volatility surface is used that includes quotes for different strikes and maturities. The Group uses implied volatility for the majority of the equity linked structures. In some cases no liquid volatility surface exists. In these cases, a proxy volatility is typically used instead. The majority of the financial instruments, which use volatility as significant unobservable input, are the Group’s funding products and their hedging instruments.
Dividend yieldThe main drivers influencing the fair value of equity-linked instruments are the dividend yield and volatility of the under-lying equities. Equity-linked instruments require a dividend parameter as an input to the fair value. The equity component is modelled using the Dupire local volatility model where the underlying equity prices are assumed to follow a random walk. Instruments that have dividend yield as a significant unobservable input are the Group’s funding products and their hedging instruments.
Interest rates (extrapolated or illiquid) The Group uses unobservable inputs in defining fair value of complex interest rate structures. The future cash flows and their fair value is determined by using forward rates and volatilities of the underlying interest rates using Hull-White stochastic model. Financial instruments whose payoffs are dependent on the value of complex interest rate structures are categorised on level 3. The majority of these instruments requiring extrapolated or illiquid interest rates as input are the Group’s funding products and their hedging instruments.
In brief Operating environment Primary statements NotesM
unic
ipal
ity F
inan
ce P
lc •
Hal
f Yea
r Rep
ort
1 J
anua
ry–3
0 J
une
20
21
86/111

The table below illustrates the effect that changing one or more of the assumptions in the unobservable input (reasonably possible alternative assumptions) could have on the valuations at the reporting date.
SENSITIVITY ANALYSIS OF UNOBSERVABLE INPUTS 30 JUN 2021 (EUR 1,000) Fair value Valuation technique Unobservable input
Positive range of fair value
Negative range of fair value
Loans and advances to the public and public sector entities
Loans 40,106 Stochastic model Volatility – Extrapolated or Illiquid 545 199
Derivative contracts
Equity linked derivatives -45,083 Stochastic model
Correlation parameters -769 -1,044
Volatility – Extrapolated or Illiquid 16,943 -11,037
Dividend yield 1,758 -1,164
FX linked cross currency and interest rate derivatives -530,533 Stochastic model
Correlation parameters 140 -170
Volatility – Extrapolated or Illiquid -318 -2,040
Interest rates – Extrapolated or Illiquid 8 -8
Other interest rate derivatives -10,719 Stochastic model
Correlation parameters 7 -10
Volatility – Extrapolated or Illiquid 9,882 -10,620
Interest rates – Extrapolated or Illiquid 377 -377
Debt securities issued and Liabilities to the public and public sector entities
Equity linked liabilities 812,963 Stochastic model
Correlation parameters 14 -3
Volatility – Extrapolated or Illiquid 12,271 -16,551
Dividend yield 1,424 1,128
FX linked liabilities 960,294 Stochastic model
Correlation parameters -10 -93
Volatility – Extrapolated or Illiquid 1,888 694
Interest rates – Extrapolated or Illiquid 4 -4
Other liabilities 566,826 Stochastic model
Correlation parameters 0 -1
Volatility – Extrapolated or Illiquid 11,025 -11,652
Interest rates – Extrapolated or Illiquid 165 -166
Total 55,354 -52,915
In brief Operating environment Primary statements NotesM
unic
ipal
ity F
inan
ce P
lc •
Hal
f Yea
r Rep
ort
1 J
anua
ry–3
0 J
une
20
21
87/111

SENSITIVITY ANALYSIS OF UNOBSERVABLE INPUTS 31 DEC 2020 (EUR 1,000) Fair value Valuation technique Unobservable input
Positive range of fair value
Negative range of fair value
Loans and advances to the public and public sector entities
Loans 43,735 Stochastic model Volatility – Extrapolated or Illiquid 542 327
Derivative contracts
Equity linked derivatives -75,037 Stochastic model
Correlation parameters 1,324 -932
Volatility – Extrapolated or Illiquid 9,142 -7,641
Dividend yield 1,951 1,333
FX linked cross currency and interest rate derivatives -517,779 Stochastic model
Correlation parameters 51 -368
Volatility – Extrapolated or Illiquid 1,642 96
Interest rates – Extrapolated or Illiquid 93 -93
Other interest rate derivatives 2,156 Stochastic model
Correlation parameters 8 -6
Volatility – Extrapolated or Illiquid 8,230 -9,711
Interest rates – Extrapolated or Illiquid 447 -448
Debt securities issued and Liabilities to the public and public sector entities
Equity linked liabilities 885,327 Stochastic model
Correlation parameters 2,810 2,088
Volatility – Extrapolated or Illiquid 7,733 -7,746
Dividend yield 1,148 410
FX linked liabilities 1,027,104 Stochastic model
Correlation parameters 213 54
Volatility – Extrapolated or Illiquid -1,161 -1,729
Interest rates – Extrapolated or Illiquid 6 -6
Other liabilities 531,744 Stochastic model
Correlation parameters 1 -1
Volatility – Extrapolated or Illiquid 10,220 -9,066
Interest rates – Extrapolated or Illiquid 209 -209
Total 44,609 -33,648
In brief Operating environment Primary statements NotesM
unic
ipal
ity F
inan
ce P
lc •
Hal
f Yea
r Rep
ort
1 J
anua
ry–3
0 J
une
20
21
88/111

DAY 1 GAIN OR LOSS (EUR 1,000) 1 Jan–30 Jun 2021 1 Jan–31 Dec 2020
Opening balance in the beginnig of the reporting period -29 -
Recognised gain in the income statement 205 242
Recognised loss in the income statement -354 -67
Deferred gain or loss on new transactions 192 -204
Total at the end of the reporting period 14 -29
The definition and amortisation method for the Day 1 gain or loss is presented in the accounting policies of the Consolidated Financial Statements 2020 (Note 1) in Section Determination of fair value.
In brief Operating environment Primary statements NotesM
unic
ipal
ity F
inan
ce P
lc •
Hal
f Yea
r Rep
ort
1 J
anua
ry–3
0 J
une
20
21
89/111

Note 7. Derivative contracts
DERIVATIVE CONTRACTS30 JUN 2021 (EUR 1,000)
Nominal value of underlying instrument Fair value
Positive Negative
Derivative contracts in hedge accounting
Interest rate derivatives
Interest rate swaps 33,110,511 879,596 -369,597
, of which cleared by the central counterparty 29,853,138 731,220 -275,478
Currency derivatives
Cross currency interest rate swaps 10,778,797 332,429 -830,824
Total derivative contracts in hedge accounting 43,889,308 1,212,024 -1,200,421
Derivative contracts at fair value through profit or loss
Interest rate derivatives
Interest rate swaps 17,264,071 553,398 -397,796
, of which cleared by the central counterparty 10,483,775 10,521 -204,287
Interest rate options 40,000 92 -92
Currency derivatives
Cross currency interest rate swaps 4,272,415 111,841 -627,349
Forward exchange contracts 3,664,802 38,456 -3,407
Equity derivatives 879,136 -19 -45,064
Total derivative contracts at fair value through profit or loss 26,120,424 703,768 -1,073,707
Total derivative contracts 70,009,732 1,915,792 -2,274,128
Derivative contracts at fair value through profit or loss contain all derivatives of the Group which are not included in hedge accounting, even if they are entered into for risk management purposes. The category contains derivative contracts used for hedging financial assets and liabilities designated at fair value through profit or loss, all derivative contracts with municipali-ties and all derivative contracts hedging derivatives with municipalities. In addition to these, the
category contains derivative contracts used for hedging interest rate risk of the balance sheet, for which no hedged item has been specified. Interest received or paid from derivative contracts is included in the statement of financial posi-tion line items Accrued income and prepayments and Accrued expenses and deferred income.
In brief Operating environment Primary statements NotesM
unic
ipal
ity F
inan
ce P
lc •
Hal
f Yea
r Rep
ort
1 J
anua
ry–3
0 J
une
20
21
90/111
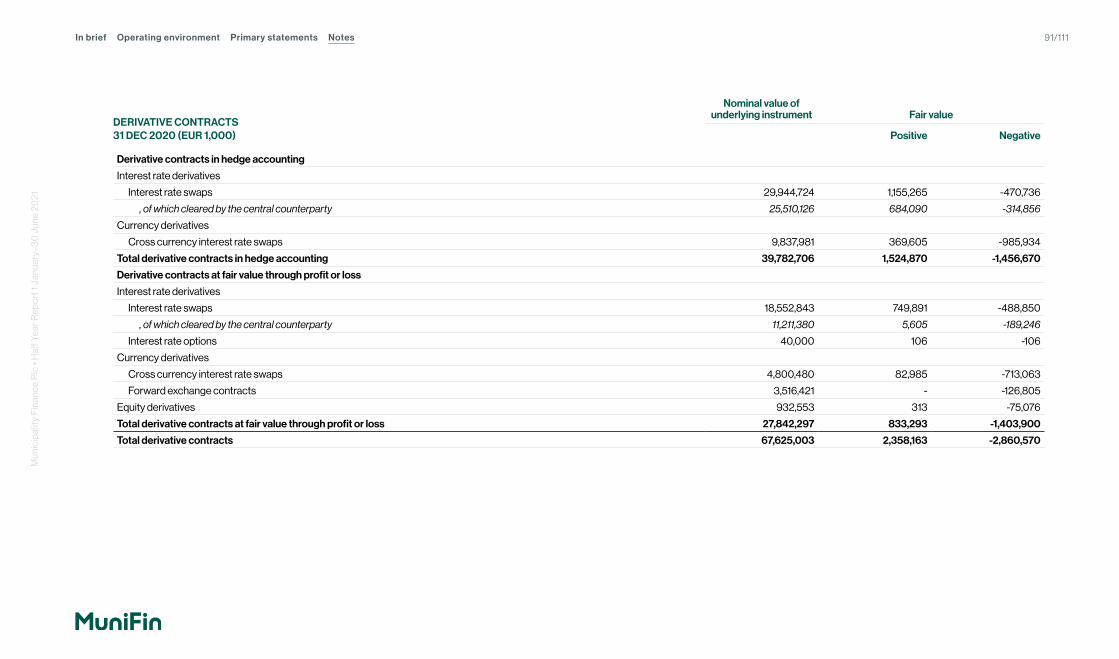
DERIVATIVE CONTRACTS31 DEC 2020 (EUR 1,000)
Nominal value of underlying instrument Fair value
Positive Negative
Derivative contracts in hedge accounting
Interest rate derivatives
Interest rate swaps 29,944,724 1,155,265 -470,736
, of which cleared by the central counterparty 25,510,126 684,090 -314,856
Currency derivatives
Cross currency interest rate swaps 9,837,981 369,605 -985,934
Total derivative contracts in hedge accounting 39,782,706 1,524,870 -1,456,670
Derivative contracts at fair value through profit or loss
Interest rate derivatives
Interest rate swaps 18,552,843 749,891 -488,850
, of which cleared by the central counterparty 11,211,380 5,605 -189,246
Interest rate options 40,000 106 -106
Currency derivatives
Cross currency interest rate swaps 4,800,480 82,985 -713,063
Forward exchange contracts 3,516,421 - -126,805
Equity derivatives 932,553 313 -75,076
Total derivative contracts at fair value through profit or loss 27,842,297 833,293 -1,403,900
Total derivative contracts 67,625,003 2,358,163 -2,860,570
In brief Operating environment Primary statements NotesM
unic
ipal
ity F
inan
ce P
lc •
Hal
f Yea
r Rep
ort
1 J
anua
ry–3
0 J
une
20
21
91/111

Note 8. Changes in intangible and tangible assets
(EUR 1,000)
Intangible assets Tangible assets
Total Other real estate Other tangible assets Right-of-use assets Total
Acquisition cost 1 Jan 2021 31,630 299 8,950 9,152 18,401
+ Additions 4,524 - 1 102 103
– Disposals -449 - -323 - -323
Acquisition cost 30 Jun 2021 35,705 299 8,628 9,254 18,182
Accumulated depreciation 1 Jan 2021 14,283 - 4,840 3,197 8,037
– Accumulated depreciation on disposals - - -198 - -198
+ Depreciation for the reporting period 1,377 - 619 857 1,475
Accumulated depreciation 30 Jun 2021 15,660 - 5,260 4,054 9,314
Carrying amount 30 Jun 2021 20,045 299 3,368 5,201 8,868
(EUR 1,000)
Intangible assets Tangible assets
Total Other real estate Other tangible assets Right-of-use assets Total
Acquisition cost 1 Jan 2020 25,706 299 5,649 8,942 14,890
+ Additions 5,924 - 3,644 296 3,939
– Disposals - - -343 -85 -428
Acquisition cost 31 Dec 2020 31,630 299 8,950 9,152 18,401
Accumulated depreciation 1 Jan 2020 11,002 - 4,247 1,602 5,849
– Accumulated depreciation on disposals - - -252 -72 -324
+ Depreciation for the financial year 3,281 - 845 1,667 2,513
Accumulated depreciation 31 Dec 2020 14,283 - 4,840 3,197 8,037
Carrying amount 31 Dec 2020 17,346 299 4,110 5,955 10,364
In brief Operating environment Primary statements NotesM
unic
ipal
ity F
inan
ce P
lc •
Hal
f Yea
r Rep
ort
1 J
anua
ry–3
0 J
une
20
21
92/111

Note 9. Credit risks of financial assets and other commitments
EXPOSURES BY ASSET GROUPS AND IMPAIRMENT STAGES
30 JUN 2021 (EUR 1,000)
Not credit-impaired Credit-impairedTotal
Stage 1 Stage 2 Stage 3 *
Gross carrying amount
12-month ECL
Gross carrying amount
Lifetime ECL
Gross carrying amount
Lifetime ECL
Gross carrying amount
Expected credit losses
Cash and balances with central banks at amortised cost 7,682,899 0 - - - - 7,682,899 0
Loans and advances to credit institutions at amortised cost 1,512,763 -95 - - - - 1,512,763 -95
Loans and advances to the public and public sector entities at amortised cost 26,964,538 -24 174,310 -891 136,723 -170 27,275,570 -1,084
Leased assets in Loans and advances to the public and public sector entities at amortised cost 1,225,287 -2 - - 166 0 1,225,452 -2
Debt securities at amortised cost 1,467,836 0 14,423 0 - - 1,482,258 0
Debt securities at fair value through other comprehensive income 282,078 -45 - - - - 282,078 -45
Cash collateral to CCPs in Other assets at amortised cost 255,984 -16 - - - - 255,984 -16
Guarantee receivables from the public and public sector entities in Other assets 1,667 - - - - - 1,667 -
Credit commitments (off-balance sheet) 2,537,022 -4 37 0 4,506 0 2,541,565 -4
Total 41,930,072 -186 188,770 -891 141,394 -170 42,260,236 -1,246
* The Group has collateral and guarantee arrangements that fully cover the stage 3 receivables as described in the Consolidated Financial Statements 2020 in Note 2 Risk management principles and the Group’s risk position in Section Credit risk. The Group’s management expects that all the stage 3 reveivables will be recovered and no final credit loss will emerge. Stage 3 receivables include EUR 2,440 thousand (EUR 2,404 thousand) of originated credit impaired receivables (purchased or originated credit impaired, POCI). Expected credit losses for the POCI receivables amount to EUR 8 thousand (EUR 4 thousand).
MuniFin Group’s credit risks are described in the Consolidated Financial Statements 2020 in Note 2 Risk management principles and the Group’s risk position in Section Credit Risk. The accounting policies of the expected credit loss calculations and impairment stages are described in the accounting policies of the Consolidated Financial Statements 2020 (Note 1) in Section Impairment of financial assets.
The table below presents exposures under expected credit loss calculations by asset groups and impairment stages.
In brief Operating environment Primary statements NotesM
unic
ipal
ity F
inan
ce P
lc •
Hal
f Yea
r Rep
ort
1 J
anua
ry–3
0 J
une
20
21
93/111

EXPOSURES BY ASSET GROUPS AND IMPAIRMENT STAGES
31 DEC 2020 (EUR 1,000)
Not credit-impaired Credit-impairedTotal
Stage 1 Stage 2 Stage 3 *
Gross carrying amount
12-month ECL
Gross carrying amount
Lifetime ECL
Gross carrying amount
Lifetime ECL
Gross carrying amount
Expected credit losses
Cash and balances with central banks at amortised cost 5,565,801 0 - - - - 5,565,801 0
Loans and advances to credit institutions at amortised cost 1,841,853 -43 - - - - 1,841,853 -43
Loans and advances to the public and public sector entities at amortised cost 26,606,595 -30 145,061 -835 135,291 -224 26,886,947 -1,089
Leased assets in Loans and advances to the public and public sector entities at amortised cost 1,090,768 -2 - - 173 - 1,090,940 -2
Debt securities at amortised cost 1,303,105 0 7,200 - - - 1,310,305 0
Debt securities at fair value through other comprehensive income 423,050 -42 - - - - 423,050 -42
Cash collateral to CCPs in Other assets at amortised cost 243,269 -4 - - - - 243,269 -4
Guarantee receivables from the public and public sector entities in Other assets 1,606 - - - - - 1,606 -
Credit commitments (off-balance sheet) 2,348,271 -4 4,506 0 1,201 0 2,353,978 -4
Total 39,424,318 -126 156,767 -835 136,665 -224 39,717,750 -1,184
In brief Operating environment Primary statements NotesM
unic
ipal
ity F
inan
ce P
lc •
Hal
f Yea
r Rep
ort
1 J
anua
ry–3
0 J
une
20
21
94/111

The table below presents summary of total changes and reconciliation of expected credit losses by impairment stages during the reporting period.
TOTAL EXPECTED CREDIT LOSSES BY IMPAIRMENT STAGES
(EUR 1,000)
Not credit-impaired Credit-impairedTotal
Stage 1 Stage 2 Stage 3
12-month ECL
Lifetime ECL
Lifetime ECL ECL
Gross carrying amount
Opening balance 1 Jan 2021 -126 -835 -224 -1,184 39,717,750
New assets originated or purchased -28 0 -9 -38 6,673,157
Assets derecognised or repaid (excluding write-offs) 34 44 20 98 -4,130,558
Transfers to Stage 1 0 14 - 14 14
Transfers to Stage 2 0 -115 44 -71 -71
Transfers to Stage 3 - 1 -2 0 0
Additional provision (Management overlay) - - - - -
Changes to contractual cash flows due to modifications not resulting in derecognition - - - - -
Changes to models * and inputs ** used for ECL calculations -66 0 0 -66 -56
Write-offs - - - - -
Recoveries - - - - -
Total 30 Jun 2021 -186 -891 -170 -1,246 42,260,236
* Represents changes in the model.** Represents changes to model parameters (e.g. GDP rates, unemployment rates)
In brief Operating environment Primary statements NotesM
unic
ipal
ity F
inan
ce P
lc •
Hal
f Yea
r Rep
ort
1 J
anua
ry–3
0 J
une
20
21
95/111

During the financial year 2020 MuniFin Group recorded an additional discretionary provision (management overlay) of EUR 340 thousand to take into account the financial effects of the COVID-19 pandemic. Year 2020 and first half of 2021 were financially exceptionally weak for certain customer segments such as the cultural sector and the sports activities. However, the deteriorating financial situation is not yet reflected in the Group’s internal risk ratings, which have been mainly updated based on the 2019 financial statements. As the creditworthiness of certain customer segments is estimated to have decreased since then, MuniFin Group’s management decided to record an additional discretionary provision based on a group-specific assessment. The additional provision relates to the statement of financial position line item Loans and advances to the public and public sector entities. The additional provision has not been allocated to contract level.
The assessment of the need for additional provisions is based on the fact that MuniFin Group’s management estimates that due to the increase in credit risk (not yet
reflected in the internal risk ratings), part of the exposures would transfer to stage 2 in the expected credit loss calculations. More detailed information on the financial situation of the companies subject to the additional provision will be available after the completion of their 2020 financial statements, so that any change in expected credit losses can be allocated to individual contracts through risk ratings and determined according to the normal ECL calculation process. At the reporting date 30 June 2021, the internal risk ratings have not yet been updated based on the 2020 financial statements. The updates will be conducted during Q3. Although the financial situation at the reporting date looks better than at the financial statement date, which is also reflected in the scenarios updated by the Group at the reporting date, there is still uncertainty about the customers’ financial situation. For this reason, the Group’s management decided not to change the additional provision during the reporting period.
MuniFin Group’s total credit risk has remained low and the amount of expected credit losses (ECL) remains low. The
Group’s customer exposures have zero risk weight in MuniFin Group’s capital adequacy calculation because they are from Finnish municipalities or involve a municipal guarantee or a state deficiency guarantee supplementing the real estate collateral, as described in the Consolidated Financial Statements 2020 in Note 2 Risk management principles and the Group’s risk position under Section Credit risk. The Group’s management estimates that all receivables will be recovered in full and therefore no final credit loss will arise. On 30 June 2021, the Group has a total of EUR 23 million (EUR 24 million) in guarantee receivables from the public sector due to the insolvency of customers. Credit risk of the liquidity portfolio has remained of good quality with the average rating of AA+.
In brief Operating environment Primary statements NotesM
unic
ipal
ity F
inan
ce P
lc •
Hal
f Yea
r Rep
ort
1 J
anua
ry–3
0 J
une
20
21
96/111
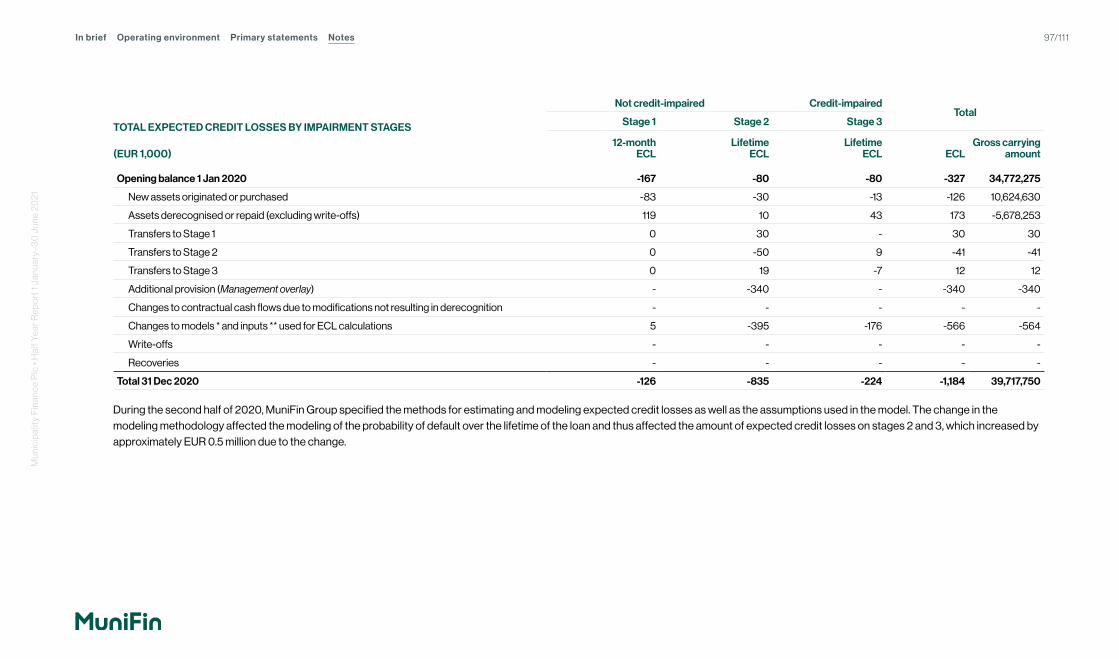
TOTAL EXPECTED CREDIT LOSSES BY IMPAIRMENT STAGES (EUR 1,000)
Not credit-impaired Credit-impairedTotal
Stage 1 Stage 2 Stage 3
12-month ECL
Lifetime ECL
Lifetime ECL ECL
Gross carrying amount
Opening balance 1 Jan 2020 -167 -80 -80 -327 34,772,275
New assets originated or purchased -83 -30 -13 -126 10,624,630
Assets derecognised or repaid (excluding write-offs) 119 10 43 173 -5,678,253
Transfers to Stage 1 0 30 - 30 30
Transfers to Stage 2 0 -50 9 -41 -41
Transfers to Stage 3 0 19 -7 12 12
Additional provision (Management overlay) - -340 - -340 -340
Changes to contractual cash flows due to modifications not resulting in derecognition - - - - -
Changes to models * and inputs ** used for ECL calculations 5 -395 -176 -566 -564
Write-offs - - - - -
Recoveries - - - - -
Total 31 Dec 2020 -126 -835 -224 -1,184 39,717,750
During the second half of 2020, MuniFin Group specified the methods for estimating and modeling expected credit losses as well as the assumptions used in the model. The change in the modeling methodology affected the modeling of the probability of default over the lifetime of the loan and thus affected the amount of expected credit losses on stages 2 and 3, which increased by approximately EUR 0.5 million due to the change.
In brief Operating environment Primary statements NotesM
unic
ipal
ity F
inan
ce P
lc •
Hal
f Yea
r Rep
ort
1 J
anua
ry–3
0 J
une
20
21
97/111

Forward-looking information In the assessment of whether the credit risk of an instrument has significantly increased (SICR) and in the measurement of expected credit losses, forward-looking information and macroeconomic scenarios are included in the model. The scenarios for Finland have been updated by the Chief Economist and Scenario Design Team of MuniFin Group to take into account the effect of COVID-19 pandemic. The macroeconomic projections cover a three-year period and as no reliable macroeconomic projections exceeding a three-year time horizon are available, forward-looking adjustment will be limited to a three-year period. Mainly three scenarios are used; base, optimistic and adverse. Scenarios include probability weights. Due to uncertainty caused by the COVID-19 pandemic, MuniFin Group has given a larger weight to the adverse scenario.
The scenario probability weightings are as following:
SCENARIO
30 Jun 2021 31 Dec 2020
2021 2022 2023 2020 2021 2022
Adverse 40% 40% 40% 50% 40% 40%
Base 50% 50% 40% 40% 40% 40%
Optimistic 10% 10% 20% 10% 20% 20%
In brief Operating environment Primary statements NotesM
unic
ipal
ity F
inan
ce P
lc •
Hal
f Yea
r Rep
ort
1 J
anua
ry–3
0 J
une
20
21
98/111

The Group has identified key drivers of credit losses for each portfolio that share similar kind of credit risk characteristics and estimated the relationship between macroeconomic variables and credit losses. ECL model consists of the following macroeconomic variables for Finnish counterparties of financial assets; Finnish government long-term rate, the development of residential housing prices and unemployment rate. For non-Finnish financial assets, stress test scenarios published by the European Central Bank are employed in the model and scenario parameters. Each variable covers an estimate over a period of three years.
The table below presents the macroeconomic variables and their forecasts over the three-year forecast period.
MACROECONOMIC VARIABLES Scenario
30 Jun 2021 31 Dec 2020
2021 2022 2023 2021 2022 2023
10Y Fin Government rate, %
Adverse 0.1 -0.4 0.0 0.10 -0.25 0.0
Base 0.18 0.42 0.78 -0.37 -0.25 0.1
Optimistic 0.45 0.85 1.15 0.00 0.3 0.60
Residential Real Estate (selling price, YoY change), %
Adverse -8.0 -7.0 2.0 -12.5 -2.5 2.0
Base 2.5 1.5 2.0 0.5 1.0 2.0
Optimistic 3.5 3.0 2.5 2.0 2.5 2.0
Unemployment rate, %
Adverse 9.0 9.4 8.7 9.5 9.2 8.7
Base 7.6 7.1 6.9 8.2 7.8 7.6
Optimistic 7.1 6.6 6.2 7.7 7.2 6.9
In brief Operating environment Primary statements NotesM
unic
ipal
ity F
inan
ce P
lc •
Hal
f Yea
r Rep
ort
1 J
anua
ry–3
0 J
une
20
21
99/111

The Finnish economy unexpectedly contracted in the first quarter of 2021 as the measures required to slow down the spread of the COVID-19 virus temporarily halted economic revival. However, recovery in activity re-gained momentum already in the second quarter as vaccina-tions proceeded at a relatively fast pace and consumer confidence started to pick up. Private investments also took an upward turn in the first half of 2021. MuniFin Group expects output to grow by 2.7% in 2021 and 3.0% in 2022. From 2023 onwards, the economy will gradually con-verge back to its long-term growth path and the annual pace of expansion is around 1.4–1.5%. Unemployment rate peaked at 7.8% in 2020. For the next couple of years, unemployment will remain above its structural level, which is estimated to be around 6.5–7.0%. Temporary factors, such as asynchronous revival of supply and demand and the recovery of energy prices, have contributed to higher inflation in the first half of 2021. In MuniFin Group’s base scenario, infla-tionary pressures are transitory and future inflation expectations remain anchored. MuniFin Group assumes Finnish consumer prices to rise 1.9% in 2021. Annual CPI inflation is expected to stabilise to 1.7% percent from 2022 onwards. The European Central Bank is committed to a very accommodative monetary policy stance and interest rate expectations will rise only gradually in line with economic recovery. On the national level, housing prices are expected to rise 2.5% in 2021 as rising personal income supports home buying intentions. Recovering residential building activity will increase supply in the housing market and home price inflation moderates to its long-term trend of 1.5–2.0% in 2022–2024.
Compared to the base scenario, the optimistic scenario factors in less severe economic scars from the COVID-19 pandemic and assumes somewhat speedier recovery in global trade and investment spending. As a result, the Finnish GDP would grow faster in the subsequent two years (3.5% and 4.0% in 2021 and 2022, respectively). In the optimistic scenario, unemploy-ment rate declines below the pre-pandemic level of 6.7% already in 2022. In 2021, consumer price inflation rises to 2.6%. Inflationary pressures are mostly transitory, but as the output gap gradually turns positive, CPI inflation remains at 2.3% in 2022. Strong housing demand accelerates housing price inflation to 3.0–3.5% range in 2021–2022. Thereafter, consumer and housing prices rise at about 2.0–2.5% pace in 2023–2024. Reviving inflation expectations lead to somewhat higher interest rates than in the base scenario.
The adverse scenario represents an outcome where the COVID-19 pandemic causes signif-icant and persistent damage to the productive capacity. Economic recession continues well into 2021. Unemployment rises more and remains high much longer than in the base scenario. Despite a temporary rise in consumer prices in the first half of 2021, underlying deflationary pressures keep CPI inflation low in the whole forecasting period. Lack of demand in the housing market leads to sharp declines in housing price indices. Prolonged global recession creates tensions in financial markets, giving rise to wider risk premia in asset pricing.
The table below presents the sensitivity of the expected credit losses assuming 100% weight for adverse scenario until the end of 2023.
SENSITIVITY ANALYSIS30 JUN 2021 (EUR 1,000) Weighted scenario
Adverse scenario (100%)
ECL 906 1,038
Proportion of the exposure in Stage 2 and 3 0.79% 0.81%
The sensitivity analysis does not include the additional discretionary provision (management overlay) amounting to EUR 340 thousand.
In brief Operating environment Primary statements NotesM
unic
ipal
ity F
inan
ce P
lc •
Hal
f Yea
r Rep
ort
1 J
anua
ry–3
0 J
une
20
21
100/111
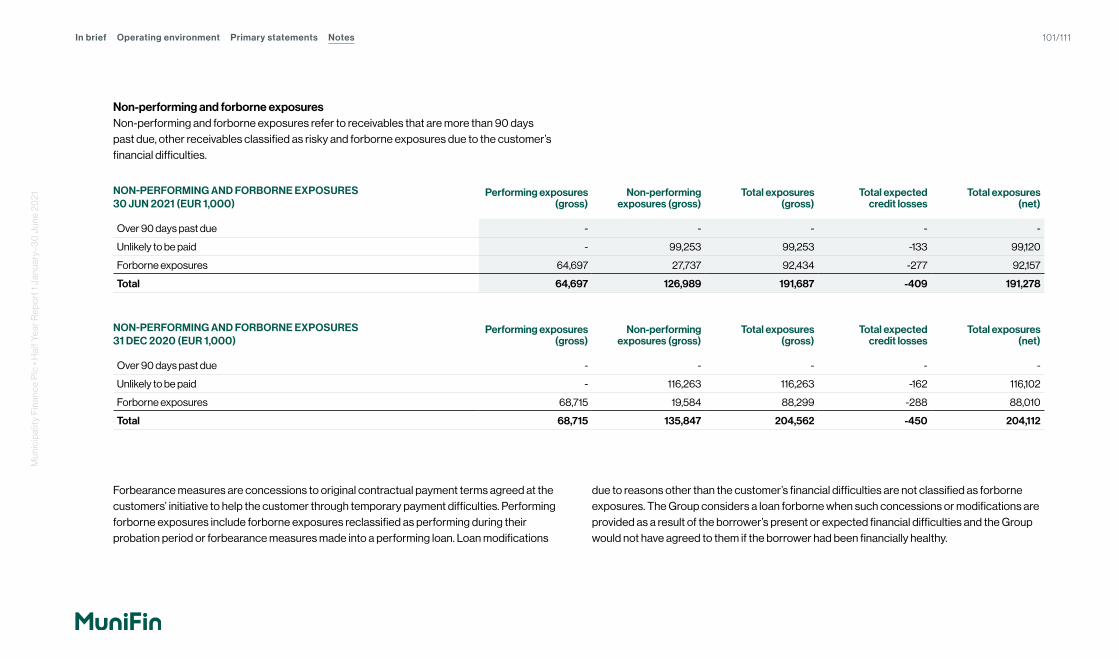
Non-performing and forborne exposuresNon-performing and forborne exposures refer to receivables that are more than 90 days past due, other receivables classified as risky and forborne exposures due to the customer’s financial difficulties.
Forbearance measures are concessions to original contractual payment terms agreed at the customers’ initiative to help the customer through temporary payment difficulties. Performing forborne exposures include forborne exposures reclassified as performing during their probation period or forbearance measures made into a performing loan. Loan modifications
due to reasons other than the customer’s financial difficulties are not classified as forborne exposures. The Group considers a loan forborne when such concessions or modifications are provided as a result of the borrower’s present or expected financial difficulties and the Group would not have agreed to them if the borrower had been financially healthy.
NON-PERFORMING AND FORBORNE EXPOSURES 30 JUN 2021 (EUR 1,000)
Performing exposures (gross)
Non-performing exposures (gross)
Total exposures (gross)
Total expected credit losses
Total exposures (net)
Over 90 days past due - - - - -
Unlikely to be paid - 99,253 99,253 -133 99,120
Forborne exposures 64,697 27,737 92,434 -277 92,157
Total 64,697 126,989 191,687 -409 191,278
NON-PERFORMING AND FORBORNE EXPOSURES 31 DEC 2020 (EUR 1,000)
Performing exposures (gross)
Non-performing exposures (gross)
Total exposures (gross)
Total expected credit losses
Total exposures (net)
Over 90 days past due - - - - -
Unlikely to be paid - 116,263 116,263 -162 116,102
Forborne exposures 68,715 19,584 88,299 -288 88,010
Total 68,715 135,847 204,562 -450 204,112
In brief Operating environment Primary statements NotesM
unic
ipal
ity F
inan
ce P
lc •
Hal
f Yea
r Rep
ort
1 J
anua
ry–3
0 J
une
20
21
101/111

The COVID-19 pandemic affected the financial situation and liquidity of MuniFin Group’s customers. The Group therefore offered concessions to the payment terms of the loans to customers whose finances had been temporarily affected by the pandemic. The granted repayment holidays concerned mainly the year 2020 and were mainly between 6–9 months in length. Only a few individual repayment holidays have been extended in the first half of 2021. The uncollected installments were mainly transferred to the end of the loan term to be paid in connection with the last installment. Most of the repayment holidays were granted during April and May in 2020. No lease concessions were granted to the Group’s leasing customers.
Realised credit lossesThe Group has not had any final realised credit losses during the reporting period or the comparison period.
In brief Operating environment Primary statements NotesM
unic
ipal
ity F
inan
ce P
lc •
Hal
f Yea
r Rep
ort
1 J
anua
ry–3
0 J
une
20
21
102/111

Note 10. Liabilities to credit institutions
(EUR 1,000) 30 Jun 2021 31 Dec 2020
Bilateral loans to credit institutions 59,842 93,358
TLTRO * 2,000,000 1,250,000
Received collateral on derivatives 532,200 658,120
Total 2,592,042 2,001,478
* In September 2020 MuniFin Group participated in the third series of targeted longer-term refinancing operation that is, the so-called TLTRO III operation (No. 5) with EUR 1.25 billion. In June 2021, MuniFin participated in TLTRO III operation (No. 8) with EUR 750 million. According to the terms of the TLTRO III operation, if eligible net lending is positive during the reference period (1 March 2020–31 March 2021) the interest rate for TLTRO III debt is 0.5% lower than the average deposit facility rate for borrowings between 24 June 2020 and 23 June 2021. This would currently equate to an all-in rate of -1%. On 10 December 2020, the ECB issued an update to the terms and conditions so that the low-interest period was extended from 24 June 2021 to 23 June 2022, if the conditions for net lending were met in the reference period from 1 October 2020 to 31 December 2021.
The interest rate until 23 June 2021 was determined based on the net lending review period expired on 31 March 2021. MuniFin Group met the net lending criteria for this period to the lower interest rate. The final interest rate will be determined when the TLTRO III debt matures. Based on the historical development of MuniFin Group’s lending portfolio as well as business forecast for future years, the Group expects to meet the conditions of positive net lending in the reference period and recognises the interests with the -1% rate. Although the interest rate for the TLTRO III debt described above is favorable for MuniFin Group, it is assessed not to differ from the Group’s other funding price to the extent that the Group would have received a government grant in accordance with IAS 20. Therefore, the Group treats TLTRO III debt in its entirety as an IFRS 9 financial liability.
In brief Operating environment Primary statements NotesM
unic
ipal
ity F
inan
ce P
lc •
Hal
f Yea
r Rep
ort
1 J
anua
ry–3
0 J
une
20
21
103/111

Note 11. Debt securities issued
30 Jun 2021 31 Dec 2020
(EUR 1,000) Carrying amount Nominal value Carrying amount Nominal value
Bonds 30,761,887 30,850,657 29,016,086 28,671,412
Other * 3,845,248 4,144,802 3,895,820 3,896,421
Total 34,607,135 34,995,459 32,911,906 32,567,833
* Line item contains short-term funding issued by MuniFin.
All funding issued by the Parent Company Municipality Finance Plc is guaranteed by the Municipal Guarantee Board.
BENCHMARK ISSUANCES DURING THE REPORTING PERIOD Value date Maturity date Interest-% Nominal value (1,000) Currency
Fixed rate benchmark bond,issued under the MTN programme 20 Jan 2021 20 Mar 2026 0.63% 1,500,000 USD
Fixed rate benchmark bond,issued under the MTN programme 2 Mar 2021 2 Mar 2031 0.00% 1,000,000 EUR
Fixed rate benchmark bond,issued under the MTN programme 21 Apr 2021 21 Apr 2028 0.00% 500,000 EUR
In the above table, the benchmark issuances are included by the settlement date. The offering circular is available in English on the website at www.munifin.fi/investor-relations.
In brief Operating environment Primary statements NotesM
unic
ipal
ity F
inan
ce P
lc •
Hal
f Yea
r Rep
ort
1 J
anua
ry–3
0 J
une
20
21
104/111

Note 12. Provisions and other liabilities
(EUR 1,000) 30 Jun 2021 31 Dec 2020
Provisions
Restructuring provision - 562
Other provisions 160 -
Other liabilities
Lease liabilities 5,284 6,032
Cash collateral taken from CCPs 309,945 231,180
Other 16,263 9,247
Total 331,651 247,021
The restructuring provision is related to the reorganisation of the Group’s operations and the co-operation negotiations conducted during the financial year 2020 due to the reorganisation. Other provisions relate to a tax interpretation issue that is open at the reporting date and for which MuniFin has requested a preliminary ruling.
Restructuring provision Other provisions
(EUR 1,000) 1 Jan–30 Jun 2021 1 Jan–31 Dec 2020 1 Jan–30 Jun 2021
Carrying amount in the beginning of the reporting period 562 - -
Increase in provisions - 641 160
Provisions used -562 -79 -
Carrying amount at the end of the reporting period - 562 160
In brief Operating environment Primary statements NotesM
unic
ipal
ity F
inan
ce P
lc •
Hal
f Yea
r Rep
ort
1 J
anua
ry–3
0 J
une
20
21
105/111

Note 13. Capital instruments
30 JUN 2021 (EUR 1,000) Currency Nominal value Carrying amount Interest rate Earliest repayment
AT1 capital instrument EUR 350,000 347,454 Fixed 1 Apr 2022
Total 350,000 347,454
31 DEC 2020 (EUR 1,000) Currency Nominal value Carrying amount Interest rate Earliest repayment
AT1 capital instrument EUR 350,000 347,454 Fixed 1 Apr 2022
Total 350,000 347,454
The capital instrument issued by the Parent Company is an unsecured debenture loan included under Additional Tier 1 capital, with special terms designed to fulfil the requirements set for so-called AT1 capital loans in the Capital Requirements Regulation (EU 575/2013). The loan does not have a maturity date. Interest on the loan may only be paid out of distributable funds in accordance with the terms set in the Capital Requirements Regulation, and MuniFin will decide whether interest will be paid on the interest payment date. The cancellation of interest payments is final, and unpaid interest will not be added to the loan capital. The loan capital will be written off if the proportion of MuniFin’s Common Equity Tier 1 (CET1) capital to risk-weighted assets falls below 5.125%. MuniFin may decide to reinstate the written off loan capital partially or entirely if the Capital Requirements Regulation permits this based on an improvement in MuniFin’s finances. MuniFin has the right but not the obligation to repay the loan on 1 April 2022 or, after that, annually on the interest payment date, as long as
the buy-back is approved in advance by the regulatory authority. The regulatory authority may authorise the repayment of the loan also for particular reasons, for example if legislation or regulatory practice should change in such a way that MuniFin loses the right to deduct the interest in full, or if MuniFin should be forced to make the additional payments mentioned in the loan terms. The authorities may also permit repayment of the loan if the loan’s official classification changes in such a way that the loan would be likely to be excluded from MuniFin’s own funds, or if it is reclassified as lower-value funds. The loan capital, interest payments and other repayments shall take lower priority than all other higher-level debts in case of MuniFin’s dissolution or bankruptcy. AT1 capital loan is recognised in equity in the Consolidated Financial Statements. In Parent Company’s Financial Statements AT1 capital loan is recognised under balance sheet item Subordinated liabilities.
In brief Operating environment Primary statements NotesM
unic
ipal
ity F
inan
ce P
lc •
Hal
f Yea
r Rep
ort
1 J
anua
ry–3
0 J
une
20
21
106/111
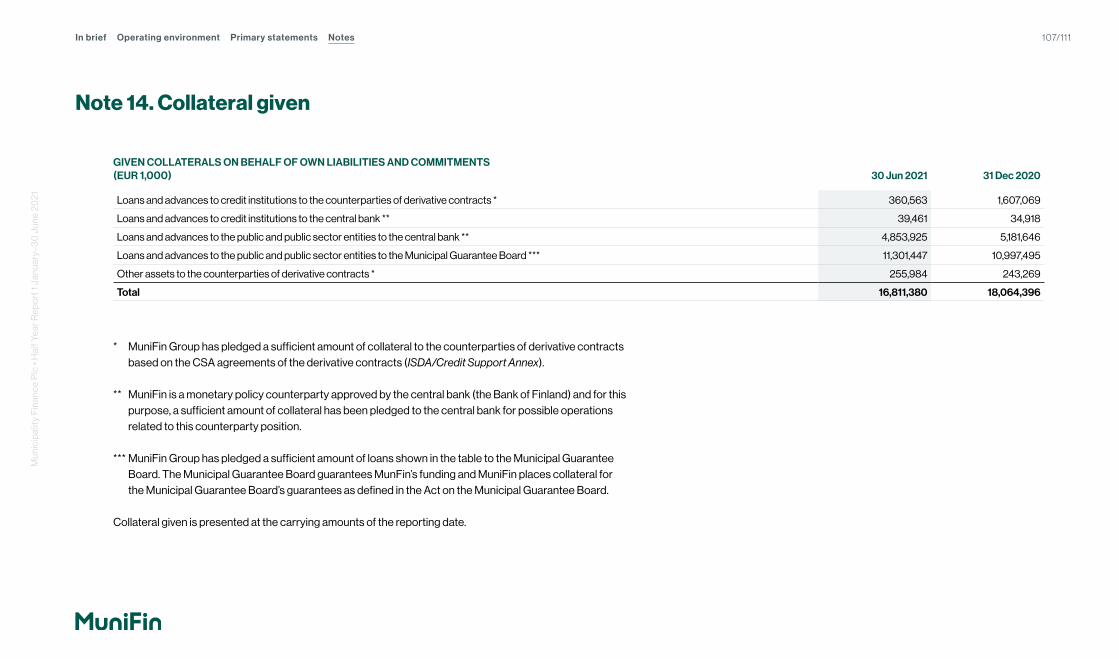
Note 14. Collateral given
GIVEN COLLATERALS ON BEHALF OF OWN LIABILITIES AND COMMITMENTS (EUR 1,000) 30 Jun 2021 31 Dec 2020
Loans and advances to credit institutions to the counterparties of derivative contracts * 360,563 1,607,069
Loans and advances to credit institutions to the central bank ** 39,461 34,918
Loans and advances to the public and public sector entities to the central bank ** 4,853,925 5,181,646
Loans and advances to the public and public sector entities to the Municipal Guarantee Board *** 11,301,447 10,997,495
Other assets to the counterparties of derivative contracts * 255,984 243,269
Total 16,811,380 18,064,396
* MuniFin Group has pledged a sufficient amount of collateral to the counterparties of derivative contracts based on the CSA agreements of the derivative contracts (ISDA/Credit Support Annex).
** MuniFin is a monetary policy counterparty approved by the central bank (the Bank of Finland) and for this purpose, a sufficient amount of collateral has been pledged to the central bank for possible operations related to this counterparty position.
*** MuniFin Group has pledged a sufficient amount of loans shown in the table to the Municipal Guarantee Board. The Municipal Guarantee Board guarantees MunFin’s funding and MuniFin places collateral for the Municipal Guarantee Board’s guarantees as defined in the Act on the Municipal Guarantee Board.
Collateral given is presented at the carrying amounts of the reporting date.
In brief Operating environment Primary statements NotesM
unic
ipal
ity F
inan
ce P
lc •
Hal
f Yea
r Rep
ort
1 J
anua
ry–3
0 J
une
20
21
107/111
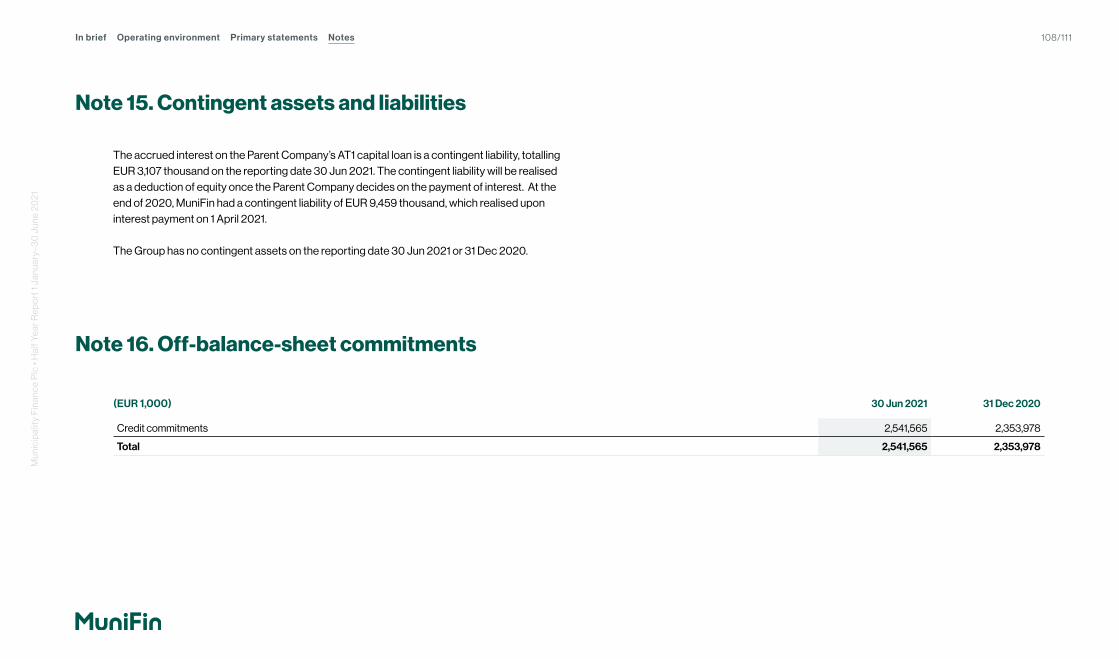
Note 15. Contingent assets and liabilities
The accrued interest on the Parent Company’s AT1 capital loan is a contingent liability, totalling EUR 3,107 thousand on the reporting date 30 Jun 2021. The contingent liability will be realised as a deduction of equity once the Parent Company decides on the payment of interest. At the end of 2020, MuniFin had a contingent liability of EUR 9,459 thousand, which realised upon interest payment on 1 April 2021.
The Group has no contingent assets on the reporting date 30 Jun 2021 or 31 Dec 2020.
Note 16. Off-balance-sheet commitments
(EUR 1,000) 30 Jun 2021 31 Dec 2020
Credit commitments 2,541,565 2,353,978
Total 2,541,565 2,353,978
In brief Operating environment Primary statements NotesM
unic
ipal
ity F
inan
ce P
lc •
Hal
f Yea
r Rep
ort
1 J
anua
ry–3
0 J
une
20
21
108/111
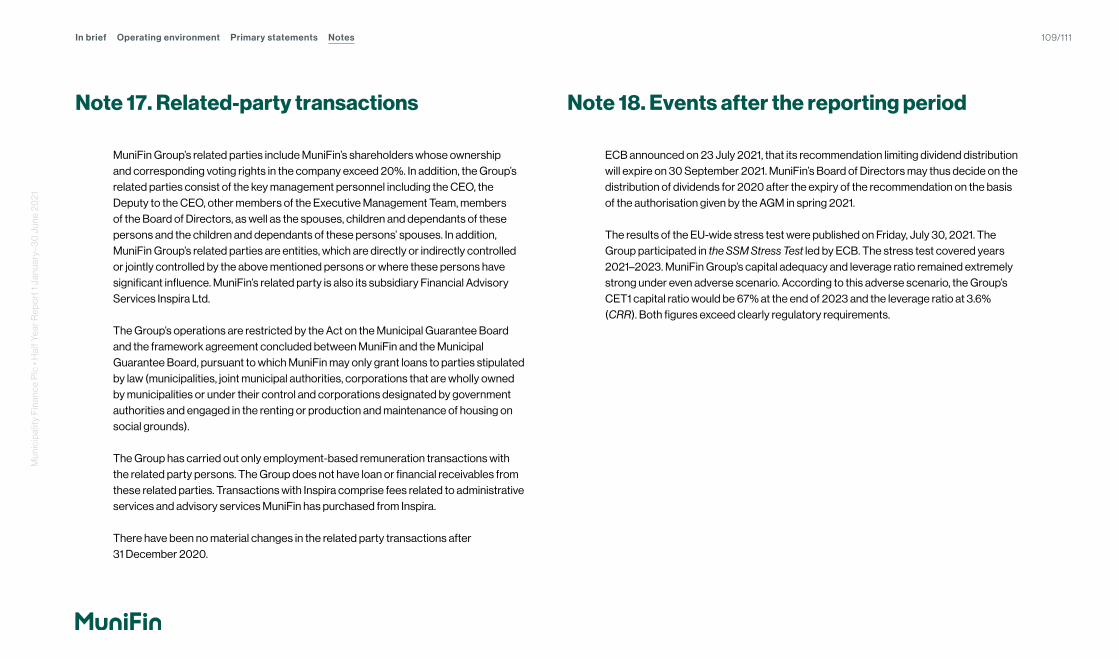
Note 17. Related-party transactions
MuniFin Group’s related parties include MuniFin’s shareholders whose ownership and corresponding voting rights in the company exceed 20%. In addition, the Group’s related parties consist of the key management personnel including the CEO, the Deputy to the CEO, other members of the Executive Management Team, members of the Board of Directors, as well as the spouses, children and dependants of these persons and the children and dependants of these persons’ spouses. In addition, MuniFin Group’s related parties are entities, which are directly or indirectly controlled or jointly controlled by the above mentioned persons or where these persons have significant influence. MuniFin’s related party is also its subsidiary Financial Advisory Services Inspira Ltd.
The Group’s operations are restricted by the Act on the Municipal Guarantee Board and the framework agreement concluded between MuniFin and the Municipal Guarantee Board, pursuant to which MuniFin may only grant loans to parties stipulated by law (municipalities, joint municipal authorities, corporations that are wholly owned by municipalities or under their control and corporations designated by government authorities and engaged in the renting or production and maintenance of housing on social grounds).
The Group has carried out only employment-based remuneration transactions with the related party persons. The Group does not have loan or financial receivables from these related parties. Transactions with Inspira comprise fees related to administrative services and advisory services MuniFin has purchased from Inspira.
There have been no material changes in the related party transactions after 31 December 2020.
Note 18. Events after the reporting period
ECB announced on 23 July 2021, that its recommendation limiting dividend distribution will expire on 30 September 2021. MuniFin’s Board of Directors may thus decide on the distribution of dividends for 2020 after the expiry of the recommendation on the basis of the authorisation given by the AGM in spring 2021.
The results of the EU-wide stress test were published on Friday, July 30, 2021. The Group participated in the SSM Stress Test led by ECB. The stress test covered years 2021–2023. MuniFin Group’s capital adequacy and leverage ratio remained extremely strong under even adverse scenario. According to this adverse scenario, the Group’s CET1 capital ratio would be 67% at the end of 2023 and the leverage ratio at 3.6% (CRR). Both figures exceed clearly regulatory requirements.
In brief Operating environment Primary statements NotesM
unic
ipal
ity F
inan
ce P
lc •
Hal
f Yea
r Rep
ort
1 J
anua
ry–3
0 J
une
20
21
109/111

Report on review of the interim report of Municipality Finance Plc as of and for the six-month period ending 30 June 2021
IntroductionWe have reviewed the consolidated balance sheet as of 30 June 2021 and the consolidated income statement, the statement of comprehensive income, the statement of changes in equity and the cash flow statement of Municipality Finance Plc for the six-month period then ended, as well as a summary of significant accounting policies and other explanatory notes to the financial statements. The Board of Directors and the Managing Director are responsible for the preparation and fair presentation of this interim financial information in accordance with the International Financial Reporting Standards (IFRS), as adopted by the EU, and other Finnish rules and regulations governing the preparation of interim reports. We will express our conclusion on the interim report based on our review.
Scope of reviewWe conducted our review in accordance with the Standard on Review Engagements ISRE 2410, “Review of Interim Financial Information Performed by the Independent Auditor of the Entity”. A review of interim financial information consists of making inquiries, primarily of persons responsible for financial and accounting matters, and applying analytical and other review procedures. A review is substantially less in scope than an audit conducted in accordance with the standards on auditing and other generally accepted auditing practices and consequently does not enable us to obtain a level of assurance that would make us aware of all significant matters that might be identified in an audit. Accordingly, we do not express an audit opinion.
Conclusion Based on our review, nothing has come to our attention that causes us to believe that the interim report does not give a true and fair view of the consolidated financial position as at 30 June 2021 and the consolidated result of its operations and cash flows for the six-month period then ended, in accordance with the International Financial Reporting Standards (IFRS), as adopted by the EU and other applicable rules and regulations governing interim financial reporting preparation in Finland.
Helsinki 5 August 2021
KPMG OY AB
TIIA KATAJA Authorised Public Accountant, KHT
To the Board of Directors of Municipality Finance Plc
This document is an English translation of the Finnish auditor’s report on review. Only the Finnish version of the report is legally binding.
In brief Operating environment Primary statements NotesM
unic
ipal
ity F
inan
ce P
lc •
Hal
f Yea
r Rep
ort
1 J
anua
ry–3
0 J
une
20
21
110/111

Municipality Finance PlcJaakonkatu 3 A, P.O. Box 744
00101 HelsinkiTel. +358 9 6803 5666