half-year financial report for january-june 2021
TRANSCRIPT

Rovio Entertainment Corporation
Half-Year Financial Report
August 12, 2021
HALF-YEAR FINANCIAL REPORT FOR JANUARY-JUNE 2021

2
Games revenue grew 6% in comparable currencies
in the second quarter
April–June 2021 highlights
• Rovio group revenue was EUR 68.8 million (69.2) and decreased by 0.6% year-on-year.
• Group adjusted operating profit was EUR 6.2 million (13.8) and adjusted operating profit margin 8.9% (20.0)
• Group adjusted EBITDA was EUR 8.7 million (15.9) and adjusted EBITDA margin 12.7% (22.9)
• Games revenue decreased 0.7% year-on-year to EUR 66.4 million (66.9). In comparable currencies, Games
revenue grew by 6%. The Games gross bookings were EUR 66.6 million (67.7) and decreased by 1.7% year-
on-year. In comparable currencies, the gross bookings grew by 5%.
• Rovio entered into a long-term partnership with Moomin Characters and Gutsy Animation with the rights to
develop and publish Moomin IP based games for any platform, with exclusive rights for all mobile
platforms. Rovio became a minority shareholder in Gutsy Animations, the creator of the Moominvalley 3D
animation series through an equity investment of 2.5 million euros and a convertible loan of 2.5 million
euros.
• Small Town Murders continued to grow and reached a gross booking of EUR 4.7 million
• Angry Birds Friends continued its strong performance and grew its gross bookings to EUR 8.3 million
• In April, Rovio’s released Darkfire Heroes game which reached gross bookings of EUR 1.1 million during the
quarter.
• User acquisition investments were EUR 21.3 million (14.0) and 32.0% of the Games segment’s revenue
(20.9%)
• Operating cash flow was EUR 7.6 million (18.7)
• Earnings per share were EUR 0.07 (0.15)
January–June 2021 highlights
• Rovio group revenue was EUR 135.9 million (135.8) and increased by 0.1% year-on-year
• Group adjusted operating profit was EUR 16.2 million (26.9) and adjusted operating profit margin 12.0%
(19.8)
• Group adjusted EBITDA was EUR 21.0 million (32.0) and adjusted EBITDA margin 15.5% (23.6)
• Games revenue increased 1.3% year-on-year to EUR 131.3 million (129.6). In comparable currencies, Games
revenue grew by 8%. The Games gross bookings were EUR 130.7 million (129.8) and increased by 0.7%
year-on-year. In comparable currencies, the gross bookings grew by 7%.
• User acquisition investments were EUR 38.5 million (27.5) and 29.4% of the Games segment’s revenue
(21.2%)
• Brand Licensing revenue was EUR 4.6 million (6.2) and declined 24.9% year-on-year.
• Operating cash flow was EUR 10.1 million (30.2)
• Earnings per share were EUR 0.17 (0.26)

3
Key figures 4-6/ 4-6/ Change, 1-6/ 1-6/ Change, 1-12/
EUR million 2021 2020 % 2021 2020 % 2020
Revenue 68.8 69.2 -0.6% 135.9 135.8 0.1% 272.3
EBITDA 8.7 16.1 -45.7% 20.5 31.9 -35.9% 60.0
EBITDA margin 12.7% 23.2% 15.1% 23.5% 22.0%
Adjusted EBITDA 8.7 15.9 -45.0% 21.0 32.0 -34.4% 60.1
Adjusted EBITDA margin, % 12.7% 22.9% 15.5% 23.6% 22.1%
Operating profit 6.2 14.1 -56.2% 15.7 26.8 -41.4% 42.5
Operating profit margin, % 8.9% 20.3% 11.5% 19.7% 15.6%
Adjusted operating profit 6.2 13.8 -55.5% 16.2 26.9 -39.6% 47.2
Adjusted operating profit margin, % 8.9% 20.0% 12.0% 19.8% 17.3%
Profit before tax 6.1 14.8 -59.0% 16.5 26.3 -37.4% 40.7
Capital expenditure 0.8 1.1 -21.3% 1.8 1.8 -4.0% 3.9
User acquisition 21.3 14.0 51.8% 38.5 27.5 40.4% 58.7
Return on equity (ROE), % 18.5% 19.7% 18.5% 19.7% 24.4%
Net gearing ratio, % -72.5% -68.1% -72.5% -68.1% -77.6%
Equity ratio, % 84.9% 83.1% 84.9% 83.1% 82.3%
Earnings per share, EUR 0.07 0.15 -54.4% 0.17 0.26 -35.4% 0.43
Earnings per share, diluted EUR 0.07 0.15 -54.5% 0.17 0.26 -35.7% 0.43
Net cash flows from operating activities 7.6 18.7 -59.4% 10.1 30.2 -66.7% 63.6
Employees (average for the period) 481 460 4.4% 484 463 4.4% 470
Unless otherwise stated, the comparison figures in brackets refer to the corresponding period in the
previous year. Calculations and definitions are presented in the Performance Measures section.
The changes in comparable currencies have been calculated by translating the reporting period figures
with the average USD/EUR exchange rates of the comparison period for the US dollar dominated in-app-
purchases in United States and global ad network sales.
Alex Pelletier-Normand, CEO:
The first six months as Rovio’s CEO have been rewarding. Not only have we been growing y-o-y in
comparable currencies, against Q2-2020, a quarter that largely benefited from the beginning of the
shelter-at-home situation, but we also made strides in the execution of our Angry Birds brand and our
M&A strategy. The organization stays active and motivated; we are eager to continue executing at a fast
pace and believe that our market positioning improves with each step we take.
Looking at our live games, the good momentum we saw in the first quarter continued in Q2. Games
revenue grew 6% in comparable currencies. The main revenue drivers were Small Town Murders
(globally launched in June 2020) and Angry Birds Friends. We are proud of our Angry Birds Friends team
for this continuous performance of the oldest game in our live portfolio. Also positive was the scaling of
Small Town Murders during the quarter, which was the third consecutive quarter of growth for the game.
Regarding our new games, we launched Darkfire Heroes in April, from our Copenhagen studio
acquired in 2020. As of today, we have not yet been able to reach a scale fitting our ambition level. The
team is expanding the game with additional events and content, and we search ways to improve our
marketing efficiency within this mid-core category, which is new to us. We also made the decision to
cancel our 4x strategy game Hardhead Squad which was in soft launch. We did not see enough potential
for a global release, and we believe it is important to focus our resources where they can make the
biggest impact. I want to thank our team for their hard work throughout the development of the project.

4
We have two other games, Supernatural City and Angry Birds Journey, in soft launch, and their
development is progressing as expected. Finally, during the quarter we released the Apple Arcade title
Angry Birds Reloaded, which quickly reached the #1 position of the chart. The Angry Birds fans were
delighted, to the extent that we saw a positive impact also on Angry Birds 2, which reached a 12-months
download peak soon after the release of Angry Birds Reloaded.
In June, we were thrilled to announce a long-term partnership with Moomin Characters and Gutsy
Animations, granting us the exclusive rights to develop Moomin based mobile games; the first one being
scheduled to reach soft launch this year. This is in line with our brand strategy: in an industry increasingly
dominated by paid advertising, leveraging strong brands through high-quality game experiences is an
efficient way to drive organic downloads and decrease acquisition costs. Having now two established and
beloved brands as platforms to develop games in the years to come is placing us in a good position. With
that in mind, we continued to develop our Angry Birds strategy: we worked on an ambitious product
roadmap, and we engaged in a closer and more genuine relationship with our fans. I am happy to see
that this strategy bears fruit already. The community is excited and eager to engage with our games in
development.
Today, we announced the acquisition of Ruby Games, a hyper-casual studio with an impressive track
record, located in Izmir, Turkey. Our investment in this market segment is beneficial for both companies
as we create a larger network of users that can navigate a more diverse portfolio of titles. The
modifications concerning user privacy policies operated by distribution platforms and policy makers
make precise user targeting harder, thus building a wide and efficient ecosystem that keeps players
engaged longer is a true strategic advantage. In addition, hyper-casual remains a growing segment, and
the acquisition will help us better balance our revenues, increasing the share of our advertising business.
We are very excited to have Ruby Games joining the flock.
During the last 17 months of remote work, we witnessed how Rovians are resilient, agile, and driven.
They find innovative solutions to get the job done in difficult circumstances, while remaining supportive
of each other. We are also mindful that in order to excel at creative and collaborative work, being able to
brainstorm face to face with colleagues is valuable. With this in mind, we are moving as soon as possible
to a flexible hybrid model, respectful of the individual situations of rovians, and adapted to each project’s
needs. We believe that the best people to make decisions on their project policy are the teams
themselves; and we will empower them to do so.
2021 outlook (unchanged) The mobile gaming market continues to grow with casual gaming being a major growth driver. The
ongoing changes in consumer behavior and underlying market trends are accelerated by the COVID
pandemic and plays an important role in both current games’ operation and new game development.
This combined with industry changes like Apple’s privacy policy fuels the near-term uncertainty in the
market environment.
We will focus on improving the performance of our key live games and on launching new innovative
products. We continue to show diligence in our UA spend. Depending on market conditions, the
performance of our investments, and the launch of new games, we aim to increase our UA investments
to build growth for the coming years. This may have implications on short-term profitability.
We will continue investing in our Future of Gaming initiatives, taking advantage of the trends we see in
consumer behavior and building our positioning in the rapidly evolving market.
In addition, we seek growth through synergistic acquisitions that can deliver long-term value growth.

5
Audiocast and conference call: Rovio will host an English language audiocast and conference call on the first half year 2021 financial
results, including a Q&A session for analysts, media and institutional investors at
14:00-15:00 EEST on August 12, 2021. The audiocast can be viewed live at: https://investors.rovio.com/en,
and later on the same day as a recording.
Conference call details:
PIN: 26539023#
Finland: +358 981710310
Sweden: +46 856642651
United Kingdom: +44 3333000804
United States: +1 6319131422
More information:
Alex Pelletier-Normand, CEO, tel. +358 40 485 8985 (media phone)
René Lindell, CFO, tel. +358 40 485 8985 (media phone)
Distribution: Nasdaq Helsinki, key media, https://investors.rovio.com/en
Rovio in brief Rovio Entertainment Corporation is a global, mobile-first games company that creates, develops and
publishes mobile games, which have been downloaded over 4.5 billion times so far. Rovio is best known
for the global Angry Birds brand, which started as a popular mobile game in 2009, and has since evolved
from games to various entertainment and consumer products in brand licensing. Today, Rovio offers
multiple mobile games, animations and produced The Angry Birds Movie in 2016. Its sequel, The Angry
Birds Movie 2, was released in 2019. Rovio is headquartered in Finland and the company's shares are
listed on the main list of NASDAQ Helsinki stock exchange with the trading code ROVIO. (www.rovio.com)

6
Rovio Entertainment Corporation
Half Year Financial Report 1–6/2021 A description of the accounting standards applied in the preparation of this Interim Report is provided
in the notes to this Interim Report, in Note 1 Accounting principles.
Market review According to market intelligence provider Newzoo’s latest global mobile market report published in
May 2021, the global mobile gaming market size in end-user generated revenue was estimated to be USD
86.9 billion in 2020 which represented 27.1% year-on-year growth driven by a heightened global gaming
activity as a result of Covid-19 physical limitations. Newzoo estimates the global mobile gaming market to
grow 4.4% in 2021 due to extraordinary high growth in the previous year. In 2020-2023, the global mobile
gaming market is expected to grow at 7.4% CAGR and the Western market at 5.5% CAGR.
Revenue and result
April-June 2021 In the second quarter 2021, Rovio group revenue was EUR 68.8 million (69.2) and decreased by 0.6%
year-on-year. The Games segment revenue decreased by 0.7% year-on-year and amounted to EUR 66.4
million (66.9). In comparable currencies, games revenue grew by 6%. The Games segment gross bookings
were EUR 66.6 million (67.7) and decreased 1.7% year-on-year. In comparable currencies, the games
gross bookings grew by 5% year-on-year.
In the reporting period, the gross bookings of Rovio’s largest game Angry Birds 2 were EUR 26.6 million
and was 8% lower year-on-year due to the impact of global shelter-at-home situation in daily active users
in the comparable period of Q2-20. Rovio’s second largest game Angry Birds Dream Blast gross bookings
were EUR 15.0 million, which was 8% lower year-on-year. Angry Birds Friends continued its strong
performance and grew gross bookings by 14% year-on-year to EUR 8.3 million. Small Town Murders, a
new IP game that was released globally in June 2020, continued to scale up and reached EUR 4.7 million
gross bookings. Rovio’s newest game Darkfire Heroes was released in April and reached gross bookings
of EUR 1.1 million during the quarter with slower growth than expected.
The revenue of the Brand Licensing segment was EUR 2.4 million (2.3) and grew 3.3% year-on-year. The
revenue consisted of EUR 1.4 million (0.7) from Content Licensing and EUR 1.0 million (1.6) from
Consumer Products.
The Group’s adjusted EBITDA decreased to EUR 8.7 million (15.9), and adjusted EBITDA margin
decreased to 12.7% (22.9).
The Group’s adjusted operating profit decreased to EUR 6.2 million (13.8) and adjusted operating profit
margin decreased to 8.9% (20.0). There were no adjustments in the reporting period. The adjustments in
April-June 2020 amounted to EUR -0.2 million and were related to the acquisition of Darkfire Games –
studio.
The Games segment’s adjusted EBITDA decreased to EUR 9.6 million (18.1) and the adjusted EBITDA
margin decreased to 14.5% (27.1). Games EBITDA margin was lower compared to last year mainly due to
higher user acquisition investments in the reporting period: EUR 21.3 million (14.0) or 32.0% of revenues
(20.9%). The higher user acquisition investments compared to last year were related to scaling up of
Small Town Murders and the launch of Darkfire Heroes.

7
The Brand Licensing segment’s adjusted EBITDA increased to EUR 1.4 million (1.0) and adjusted EBITDA
margin increased to 60.4% (41.3). The higher EBITDA of Brand Licensing in the reporting period was due
to higher share of movie revenues.
The Group’s profit before taxes was EUR 6.1 million (14.8) and earnings per share EUR 0.07 (0.15).
January-June 2021 In the first half of 2021, Rovio group revenue was EUR 135.9 million (135.8) and increased 0.1% year-
on-year.
The Games segment revenue was EUR 131.3 million (129.6) and increased by 1.3% year-on-year. In
comparable currencies, the revenue increased by 8%.
The revenue of the Brand Licensing -segment was EUR 4.6 million (6.2) and declined 24.9% year-on-
year. The revenue consisted of EUR 3.0 million (3.2) from Content Licensing, the majority of which was
income from the first Angry Birds Movie, and EUR 1.6 million (3.0) from Consumer Products.
The Group’s adjusted EBITDA was EUR 21.0 million (32.0), and 15.5% (23.6) of revenues.
The Group’s adjusted operating profit decreased to EUR 16.2 million (26.9) and adjusted operating
profit margin decreased to 12.0% (19.8). The adjustments in the reporting period amounted to EUR 0.6
million and were related to ramp-down of Hatch Kids service. The adjustments in the comparable period
January-June 2020 amounted to EUR 0.1 million and were related to the restructuring of Brand Licensing
and Hatch Entertainment and the acquisition of Darkfire Games studio.
The Games segment’s adjusted EBITDA decreased to EUR 23.5 million (35.9) and adjusted EBITDA
margin to 17.9% (27.7%) of revenues and decreased year-on-year mainly due to higher user acquisition
investments of EUR 38.5 million (27.5) and 29.4% of games revenues (21.2%).
The Brand Licensing segment’s adjusted EBITDA was EUR 2.7 million (3.5) and adjusted EBITDA margin
was 57.3% (57.0). The decline in EBITDA from last year was due to lower revenues.
The Group’s profit before taxes was EUR 16.5 million (26.3) and earnings per share EUR 0.17 (0.26).
Financing and investments Rovio’s capital expenditure was EUR 0.8 million (1.1) in the second quarter of 2021.
Rovio refers to the user acquisition costs of the Games segment as investments, but pursuant to
accounting regulations, they are recognized as expenses rather than investments due to their average
payback period being about a year.
The Games segment’s capital expenditure was EUR 0.6 million (0.6) in the second quarter and related
to external game development. Brand Licensing segment’s capital expenditure was EUR 0.1 million (0.1)
and related to external development of animated series. The Other-segment’s investments were EUR 0.2
million (0.3) for the quarter and consisted mainly of machinery and equipment and registration fees of
trademarks.
Cash flow from financing amounted to EUR -7.5 million (-21.6) in the second quarter and consisted
mainly of dividend payments of EUR 8.8 million, repayment of Business Finland (the Finnish Funding
Agency for Innovation) repayment of EUR 1.0 million loan offset by share subscriptions proceeds of EUR
3.2 million.
At the end of the second quarter, Rovio’s total interest-bearing loans and financial liabilities amounted
to EUR 8.3 million (9.1) consisting of EUR 0.9 million product development loans from Business Finland
(the Finnish Funding Agency for Innovation) and EUR 7.4 million leasing liabilities mainly related to office
lease.
Rovio’s cash and cash equivalents at the end of the review period amounted to EUR 135.5 million
(116.7).

8
Development per business segment
Games
April-June 2021 The Games segment’s revenue in the reporting period amounted to EUR 66.4 million (66.9) and a
decrease of 0.7% y-o-y. In comparable currencies, revenue increased by 6%. Gross bookings decreased
1.7% to EUR 66.6 million (67.7). In comparable currencies, games gross bookings increased by 5%.
Rovio’s largest game Angry Birds 2 recorded gross bookings of EUR 26.6 million and grew 5.3% from Q1
2021. Rovio’s top five games remained unchanged since Q1 and were Angry Birds 2, Angry Birds Dream
Blast, Angry Birds Friends, Small Town Murders and Sugar Blast.
The Games segment’s adjusted EBITDA decreased to EUR 9.6 million (18.1) and the adjusted EBITDA
margin decreased to 14.5% (27.1). The adjusted EBITDA decrease was mainly a result of higher user
acquisition investments, but also operating expenses increased year on year.
The Games segment’s user acquisition investments increased to EUR 21.3 million (14.0), and to 32.0%
(20.9%) of the Games segment’s revenue in the reporting period. Compared to 2021 Q1, the Angry Birds
2 user acquisition investments were slightly increased, while the investments for Angry Birds Dream Blast
were stable. Small Town Murders user acquisition investments increased from the previous quarter.
Darkfire Heroes was launched in April and the user acquisition was scaled up in April-May but scaled
down again towards the end of the quarter, to adhere to the 12-month payback requirement.
The user acquisition investments in the first quarter were divided between the different categories of
games as follows: 71.6% into the “Grow” -category (Angry Birds Dream Blast, Sugar Blast, Small Town
Murders and Darkfire Heroes) and 28.4% into the “Earn” -category (Angry Birds 2, Angry Birds Match,
Angry Birds Friends), of which practically all was invested into Angry Birds 2.
The Games segment’s capital expenditure in the first quarter amounted to EUR 0.6 million (0.6)
January-June 2021 The Games segment’s revenue in the first half of 2021 amounted to EUR 131.3 million (129.6) and
increased by 1.3% y-o-y. In comparable currencies, revenue increased by 8%. Gross bookings increased
0.7% to EUR 130.7 million (129.8). In comparable currencies, games gross bookings increased by 7%.
The Games segment’s adjusted EBITDA decreased to EUR 23.5 million (35.9) and the adjusted EBITDA
margin decreased to 17.9% (27.7) during the reporting period. The adjusted EBITDA decrease was mainly
a result of higher user acquisition investments, but also operating expenses increased year-on-year,
driven mostly by increased headcount.
The Games segment’s user acquisition investments increased to EUR 38.5 million (27.5) and to 29.4%
(21.2%) of the Games segment’s revenue in the reporting period.
The Games segment’s capital expenditure in the first quarter amounted to EUR 1.2 million (1.2)
9
EUR million
4–6/
2021
4–6/
2020
Change,
%
1–6/
2021
1–6/
2020
Change,
%
1-12/
2012
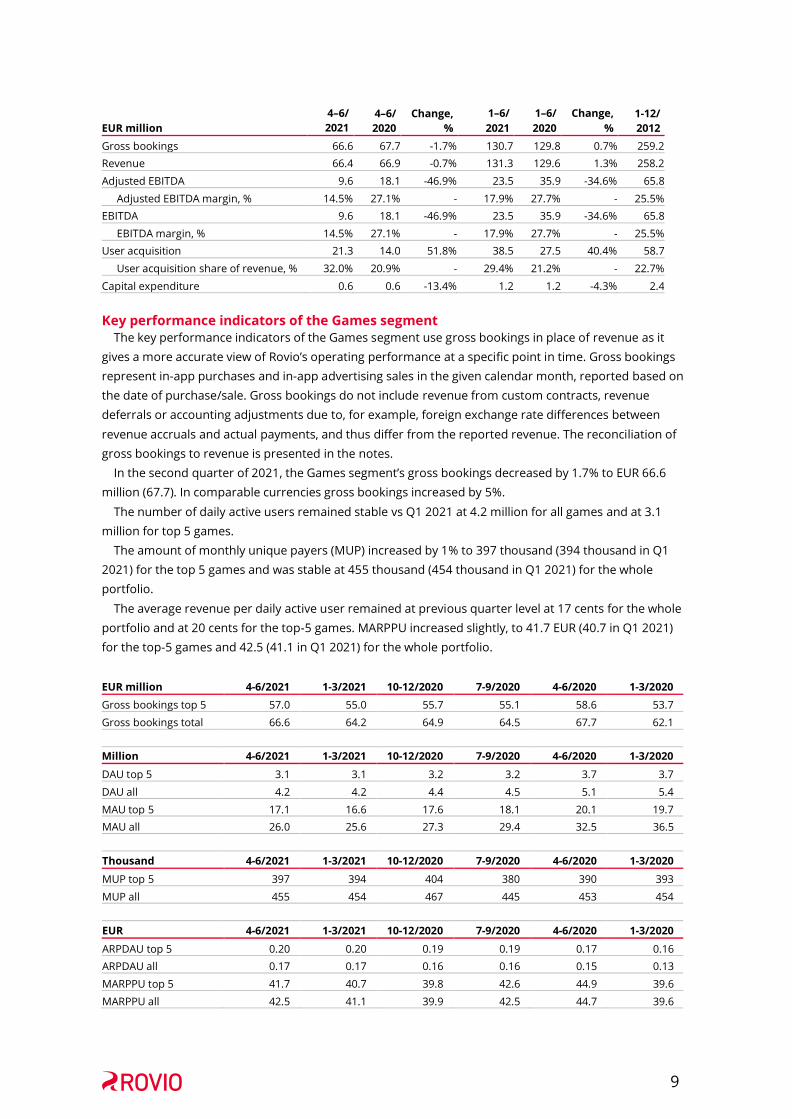
Gross bookings 66.6 67.7 -1.7% 130.7 129.8 0.7% 259.2
Revenue 66.4 66.9 -0.7% 131.3 129.6 1.3% 258.2
Adjusted EBITDA 9.6 18.1 -46.9% 23.5 35.9 -34.6% 65.8
Adjusted EBITDA margin, % 14.5% 27.1% - 17.9% 27.7% - 25.5%
EBITDA 9.6 18.1 -46.9% 23.5 35.9 -34.6% 65.8
EBITDA margin, % 14.5% 27.1% - 17.9% 27.7% - 25.5%
User acquisition 21.3 14.0 51.8% 38.5 27.5 40.4% 58.7
User acquisition share of revenue, % 32.0% 20.9% - 29.4% 21.2% - 22.7%
Capital expenditure 0.6 0.6 -13.4% 1.2 1.2 -4.3% 2.4
Key performance indicators of the Games segment The key performance indicators of the Games segment use gross bookings in place of revenue as it
gives a more accurate view of Rovio’s operating performance at a specific point in time. Gross bookings
represent in-app purchases and in-app advertising sales in the given calendar month, reported based on
the date of purchase/sale. Gross bookings do not include revenue from custom contracts, revenue
deferrals or accounting adjustments due to, for example, foreign exchange rate differences between
revenue accruals and actual payments, and thus differ from the reported revenue. The reconciliation of
gross bookings to revenue is presented in the notes.
In the second quarter of 2021, the Games segment’s gross bookings decreased by 1.7% to EUR 66.6
million (67.7). In comparable currencies gross bookings increased by 5%.
The number of daily active users remained stable vs Q1 2021 at 4.2 million for all games and at 3.1
million for top 5 games.
The amount of monthly unique payers (MUP) increased by 1% to 397 thousand (394 thousand in Q1
2021) for the top 5 games and was stable at 455 thousand (454 thousand in Q1 2021) for the whole
portfolio.
The average revenue per daily active user remained at previous quarter level at 17 cents for the whole
portfolio and at 20 cents for the top-5 games. MARPPU increased slightly, to 41.7 EUR (40.7 in Q1 2021)
for the top-5 games and 42.5 (41.1 in Q1 2021) for the whole portfolio.
EUR million 4-6/2021 1-3/2021 10-12/2020 7-9/2020 4-6/2020 1-3/2020
Gross bookings top 5 57.0 55.0 55.7 55.1 58.6 53.7
Gross bookings total 66.6 64.2 64.9 64.5 67.7 62.1
Million 4-6/2021 1-3/2021 10-12/2020 7-9/2020 4-6/2020 1-3/2020
DAU top 5 3.1 3.1 3.2 3.2 3.7 3.7
DAU all 4.2 4.2 4.4 4.5 5.1 5.4
MAU top 5 17.1 16.6 17.6 18.1 20.1 19.7
MAU all 26.0 25.6 27.3 29.4 32.5 36.5
Thousand 4-6/2021 1-3/2021 10-12/2020 7-9/2020 4-6/2020 1-3/2020
MUP top 5 397 394 404 380 390 393
MUP all 455 454 467 445 453 454
EUR 4-6/2021 1-3/2021 10-12/2020 7-9/2020 4-6/2020 1-3/2020
ARPDAU top 5 0.20 0.20 0.19 0.19 0.17 0.16
ARPDAU all 0.17 0.17 0.16 0.16 0.15 0.13
MARPPU top 5 41.7 40.7 39.8 42.6 44.9 39.6
MARPPU all 42.5 41.1 39.9 42.5 44.7 39.6

10
Game-specific performance in the Games segment During the second quarter, gross bookings increased from Q1-21 by 4%. Most significant changes were
the 22% increase of Small Town Murders to EUR 4.7 million and the 5% increase of Angry Birds 2 to EUR
26.6 million.
Angry Birds 2, Rovio’s largest game’s gross bookings were EUR 26.6 million and declined 8% year-on-
year. The user acquisition investments for the game increased in Q2 2021.
Rovio’s second biggest game in the reporting period was Angry Birds Dream Blast with gross bookings
of EUR 15.0 million. The Q2 gross bookings decreased by 8% versus Q2 2020, following the decreased
user acquisition investments in 2020. The user acquisition investments remained on the same level as in
in Q1 2021.
Angry Birds Friends recorded its highest quarterly gross bookings since Q2 2017 with a total of EUR 8.3
million.
Sugar Blast, which was launched in September 2019, generated EUR 2.5 million gross bookings in the
reporting period and declined 2% year-on-year.
Angry Birds Match gross bookings declined to EUR 2.2 million in the quarter as the user acquisition
virtually ended in 2020.
The Other games -category generated total gross bookings of EUR 7.3 million during the quarter (8.1 in
Q2 2020). Darkfire Heroes was launched in April and generated gross bookings of EUR 1.1 million.
Gross bookings,
EUR million
4-6/2021
1-3/2021
10-12/2020 7-9/2020 4-6/2020 1-3/2020
AB 2 26.6 25.2 26.2 26.5 28.8 25.0
AB Dream Blast 15.0 15.4 15.2 15.5 16.4 16.1
AB Friends 8.3 8.1 8.0 7.2 7.3 5.6
Small Town Murders 4.7 3.9 3.8 3.0 1.0 0.2
Sugar Blast 2.5 2.5 2.5 2.5 2.6 2.3
AB Match 2.2 2.4 2.5 2.9 3.6 4.4
Other games 7.3 6.8 6.6 6.9 8.1 8.4
Total 66.6 64.2 64.9 64.5 67.7 62.1
Brand Licensing
April-June 2021 The revenue of the Brand Licensing segment in the reporting period was EUR 2.4 million (2.3) and
increased 3.3% year-on-year. The revenue consisted of EUR 1.4 million (0.7) from Content Licensing and
EUR 1.0 million (1.6) from Consumer Products. Consumer products sales was weakened by the Covid-19
pandemic that has impacted sales across categories. The revenues of the Angry Birds movies within
Content Licensing are expected to decline over time; however, the timing and size of the revenue streams
can vary significantly on a quarterly basis.
The Brand Licensing segment’s adjusted EBITDA in the reporting period increased to 1.4 million (1.0)
and adjusted EBITDA margin increased to 60.4% (41.3). The higher EBITDA in the reporting period was
due to higher share of Angry Birds movie of revenues.

11
January-June 2021 In the first half of the year, the revenue of the Brand Licensing segment was EUR 4.6 million (6.2) and
declined by 24.9% year-on-year. The revenue consisted of EUR 3.0 million (3.2) from Content Licensing,
the majority of which was income from the first Angry Birds Movie, and EUR 1.6 million (3.0) from
Consumer Products.
The Brand Licensing segment’s adjusted EBITDA was EUR 2.7 million (3.5) and adjusted EBITDA margin
was 57.3% (57.0%). The lower EBITDA in the reporting period was due to lower revenues.
EUR million
4–6/
2021
4–6/
2020
Change,
%
1–6/
2021
1–6/
2020
Change,
%
1–12/
2020
Revenue 2.4 2.3 3.3% 4.6 6.2 -24.9% 14.0
Consumer products 1.0 1.6 -37.7% 1.6 3.0 -45.8% 4.9
Content licensing 1.4 0.7 91.7% 3.0 3.2 -5.1% 9.1
Adjusted EBITDA 1.4 1.0 51.0% 2.7 3.5 -24.6% 8.9
Adjusted EBITDA margin, % 60.4% 41.3% 57.3% 57.0% 64.1%
EBITDA 1.4 1.0 51.0% 2.7 3.4 -21.0% 8.8
EBITDA margin, % 60.4% 41.3% 57.3% 54.4% 62.9%
Capital expenditure 0.1 0.1 21.9% 0.1 0.2 -32.8% 0.3
Amortization 1.0 0.7 40.5% 2.0 2.5 -17.2% 8.1
Other segment
Hatch Entertainment The adjusted EBITDA in the Other segment (consisting of Group functions & expenses and Hatch
Entertainment) in the April-June 2021 reporting period was EUR -2.3 million (-3.2). There were no
adjustments in the reporting period. Adjustments in the comparable period April-June 2020 amounted to
EUR -0.2 million and were related to acquisition of Darkfire Games studio.
Consolidated statement of financial position
Consolidated statement of financial position, EUR million 30 Jun 2021 30 Jun 2020 31 Dec 2020
Non-current assets 42.9 42.9 38.6
Current receivables 35.9 38.5 31.0
Money market funds 50.7 69.6 50.5
Cash and bank deposits 84.8 47.0 88.4
Total assets 214.3 198.1 208.5
Equity 175.4 157.9 165.4
Financial liabilities 8.3 9.1 10.5
Advances received and deferred income 7.6 8.0 7.5
Other payables 23.0 23.1 25.1
Total equity and liabilities 214.3 198.1 208.5

12
Rovio’s consolidated statement of financial position amounted to EUR 214.3 million on June 30, 2021
(198.1), with equity representing EUR 175.4 million (157.9) of the total. Cash and cash equivalents
amounted to EUR 135.5 million (116.7). The cash and bank deposits amounted to EUR 84.8 million and
the investments in money market funds to EUR 50.7 million. The change in cash and cash equivalents in
the second quarter was mainly attributable to cash from operating activities that amounted to EUR 7.6
million that were negatively offset by investments of EUR 5.8 million and financing activities of EUR 7.5
million.
Total advances received, and deferred income were 7.6 million (8.0).
On June 30, 2021, Rovio’s non-current assets were EUR 42.9 million (42.9). During the reporting period,
Rovio announced on June 21st that company has entered a long-term partnership with Moomin
Characters and Gutsy Animation. Rovio became a minority shareholder in Gutsy Animations through an
equity investment of EUR 2.5 million and a convertible loan of EUR 2.5 million which increases the non-
current receivables and other investments. The intangible asset decrease is due to amortization, mainly
of development expenses of the first Angry Birds Movie. Rovio recognizes amortization on the first Angry
Birds movie in each reporting period in an amount that corresponds to 75% of movie’s revenue for the
period. Amortization for the Angry Birds Movie 2 corresponds to 77% of the movie’s revenue for the
period.
Rovio’s net debt on June 30, 2021, amounted to negative EUR 127.2 million. Rovio’s debt consisted of
loans from Business Finland (the Finnish Funding Agency for Innovation) of EUR 0.9 and EUR 7.4 million in
leasing debt mostly related to office lease.
Cash flow and financing
Consolidated statement of
cash flows, EUR million 4-6/2021 4-6/2020
1-6/2021
1-6/2020
1–12/2020
Cash flow from operating activities 7.6 18.7 10.1 30.2 63.6
Cash flow from investing activities -5.8 -0.7 -7.0 -2.0 -4.7
Cash flow from financing activities -7.5 -21.6 -7.4 -36.2 -43.7
Change in cash and cash equivalents -5.8 -3.5 -4.4 -8.0 15.2
Net foreign exchange difference and value changes in money market funds 0.1 -0.9 1.0 -0.1 -1.1 Cash and cash equivalents at the beginning of the period 141.2 121.1 138.9 124.7 124.7 Cash and cash equivalents at the end of the period 135.5 116.7 135.5 116.7 138.9
Rovio’s net cash flow from operating activities amounted to EUR 7.6 million (18.7) in the second
quarter. The decrease year-on-year was mainly due to larger change in working capital.
Cash flows used in investing activities amounted to EUR -5.8 million (-0.7) in the second quarter. The
cash flows used in investing activities in the second quarter is mostly attributable to an equity investment
of EUR 2.5 million and a convertible loan of EUR 2.5 million to Gutsy Animations. In the second quarter
capital expenditure in Games was EUR 0.6 million and Other segment EUR 0.2 million, which include
investments in machinery and equipment and registrations of the trademarks.
Cash flows used in financing activities amounted to EUR -7.5 million (-21.6) in the second quarter. The
cash flows used in financing activities in the second quarter consisted of dividends payment EUR 8.8
million, finance lease payments of EUR 0.7 million and repayment of EUR 1.0 million loan to Business
Finland, offset by the share subscription payments of option rights of EUR 3.2 million.

13
Personnel From April to June 2021, Rovio’s average number of employees was 481 (460). The Games business unit
employed 397 people (372), the Brand Licensing business unit 12 people (20), Group functions 60 people
(40) and Hatch Entertainment 11 people (29). Group functions reported headcount increased partially
due to centralizing some roles that were earlier reported as part of business units.
4-6/
2021
4-6/
2020
Change,
%
1-6/
2021
1-6/
2020
Change,
%
1–12/
2020
Employees (average for the Period) 481 460 4.4%
484
463
4.4%
470
Employees (end of period) 479 472 1.5%
479
472
1.5%
480
Flagging notifications Rovio did not receive any flagging notifications during the reporting period.
Shares and shareholders On June 30, 2021, Rovio’s share capital amounted to EUR 0.7 million and the number of shares was
82,101,203.
The shareholdings of the 10 largest shareholders are presented in the table below (nominee-registered
holdings excluded). Moor Holding AB shareholding is nominee-registered and not explicitly shown in the
table.
On June 30, 2021, Rovio Entertainment Corporation held 7,715,684 of its own shares.
Shareholder
Number of
Shares
Percentage of
shares
and votes
Adventurous Solutions AB 6,459,500 7.9%
Brilliant Problems Oy 6,459,500 7.9%
Impera Oy Ab 5,559,500 6.8%
Ilmarinen Mutual Pension Insurance Company 1,616,810 2.0%
Danske Invest Finnish Institutional Equity Fund 1,600,000 1.9%
Sijoitusrahasto Aktia Capital 1,425,074 1.7%
Hed Niklas Peter 1,365,345 1.7%
The State Pension Fund 1,000,000 1.2%
Elo Mutual Pension Insurance Company 958,004 1.2%
Sijoitusrahasto Aktia Nordic Small Cap 800,000 1.0%
Total 27,243,733 33.2%
Other shareholders 47,141,786 57.4%
Rovio Entertainment Oyj 7,715,684 9.4%
Number of shares total 82,101,203 100%
A monthly updated table of Rovio’s shareholders is available online at
https://investors.rovio.com/en/share-shareholders/major-shareholders

14
Share-based incentive program Rovio operates a long-term incentive program that consists of an employee share savings plan, a
performance share plan for key employees including the CEO and members of the Leadership Team, and
a restricted share plan for selected key employees. In addition to these, Rovio has a long-term incentive
program consisting of an option plan, which was originally provided for all employees, including the CEO
and the Leadership Team.
Rovio has an ESS (employee share savings) plan with the objective to motivate employees to invest in
Rovio shares by offering them additional shares in relation to their investment after a designated holding
period.
The ESS Plan consists of annually commencing plan periods, each one consisting of a 12-month savings
period and a holding period following the savings period. The first launch of the ESS plan was offered to
approximately 420 Rovio employees in Finland and Sweden (excluding employees in Hatch
Entertainment Ltd). The second launch of the ESS plan took place in March 2021 and was offered also to
employees in Denmark and Canada.
The employees will have an opportunity to save a proportion of their salaries and invest those savings
in Rovio shares. The savings will be used for acquiring Rovio shares quarterly after the publication dates
of the respective interim reports. Dividends paid for the shares will be reinvested in additional shares to
be purchased from the market on the next potential acquisition date. As a reward for the commitment,
Rovio grants the participating employees one free matching share (gross) for every two savings shares
acquired with their savings, including the proportion to be paid in cash to cover applicable taxes and tax-
related costs. The prerequisites for receiving the matching shares are continued employment and
holding of savings shares until the end of the holding period. During the first two plan periods, the
savings shares, and the matching shares will be acquired by purchasing shares from the markets.
Participation in the ESS plan is voluntary and the employees are invited to participate in one plan
period at a time. The first plan period commenced on April 1, 2020 and will end on August 31, 2022. The
holding period of the first plan period ends on August 31, 2022, after which matching shares will be paid
out as soon as practicably possible. The second plan period commenced on April 1, 2021 and will end on
August 31,2023. The total amount of all savings during the plan period may not exceed 2,100,000 euros.
The Board of Directors will decide on potential following plan periods and their details separately.
Rovio has a Performance Share Plan (PSP) for key employees including the CEO and members of the
leadership team. The objective of the Performance Share Plan is to motivate the key employees to work
to increase shareholder value in the long term by offering them a share-based reward for achieving the
set performance criteria established by the Board of Directors of Rovio. The Performance Share Plan
consists of three (3) annually commencing performance periods, covering the consecutive calendar years
of 2020, 2021 and 2022. Each performance period is directly followed by a one-year waiting period.
Waiting periods cover calendar years 2021, 2022 and 2023.
The Performance Share Plan offers the participants a possibility to earn shares for reaching the
required levels set for the performance criteria. The required performance levels are decided by the
Rovio Board of Directors on an annual basis for each performance period at a time. The potential
rewards will be paid partly in shares and partly in cash after the end of each relevant waiting period in
spring 2022, 2023 and 2024. The cash proportion is intended to cover taxes and tax-related costs arising
from the rewards. As a rule, no reward will be paid if a participant´s employment or service ends before
the reward payment.

15
The performance criteria for the first performance period of the plan were Rovio’s Adjusted Operating
Profit (EBIT, %, Hatch Entertainment Ltd. excluded) and Relative Games Revenue Growth (%) and for the
second performance period Rovio’s Sales Growth (%) and Rovio’s Adjusted Operating Profit Margin (%).
The potential rewards based on the performance period 2020 corresponded to the value of an
approximate maximum total of 738,000 Rovio Entertainment Corporation shares, including the
proportion to be paid in cash. A total maximum of 565,500 shares (including the proportion to be paid in
cash) subject to performance criteria were allocated under the plan at the end of the performance period
2020. The performance contributed to the realization of 50% of the maximum allocation. The first period
of the plan continues with a one year waiting period.
The performance criteria for the second performance period 2021 are Rovio’s Sales Growth (%) and
Rovio’s Adjusted Operating Profit Margin (%). Potential rewards based on the performance period 2021
correspond to a total maximum gross amount of 613 548 Rovio Entertainment Corporation shares,
including the proportion paid in cash. These shares are subject to performance criteria, and they were
allocated as per March 31, 2021.
The restricted share plan is constructed as a restricted share pool from which a predetermined
number of Rovio shares can be allocated to a limited number of selected key employees. The plan was
published on May 17, 2018 and continues according to the same set of terms. The aim of the restricted
share plan is to commit the Company’s key persons and to link the long-term interests of the participants
and the shareholders. The plan offers selected key personnel an opportunity to receive a predetermined
number of company’s shares after a specific restriction period, which differs from 12 to 36 months based
on needs of business and with decision by the Board of Directors.
The plan’s reward will be paid to the participant as soon as possible after the restriction period. The
payment will be made in company shares and taxes and tax-related costs arising from the reward are
deducted from the gross reward. The value of share shall be determined based on volume weighted
average share price at the payment date. No payment shall be paid if the employment contract is
terminated before the end of the restriction period.
The maximum number of shares that can be distributed through the restricted share plan is 1,300,000.
Once the maximum number of shares has been allocated, the Board of Directors can decide on a new
maximum number. Currently total 675,500 rights entitling to shares had been allocated under the
restricted share plan as of June 30, 2021.
The option plan provided for the issuance of up to 5,000,000 options. The option plan included three
lots of options that were allocated to 2017, 2018, and 2019. These options had a vesting period of two
years. Each option entitles its holder to subscribe for one share. The option plan participants can
execute their reward during a one-year subscription period following each vesting period through either
subscribing for shares or selling options. The option plan participants generally lose the right to their
reward if their employment terminates during the vesting period.
As of June 30, 2021, only the 2019 option plan has an ongoing subscription period. The initial
subscription price for the 2019 options, the trading volume-weighted average quotation of the shares on
Nasdaq Helsinki during May 2 -31, 2019. A total of 935,250 options were allocated under the 2019 option
program as of June 30, 2021.
On May 28 2021 Rovio Entertainment Corporation announced that it will apply for the listing of its
series 2019A and 2019B stock options, complying with its 2017-2019 option scheme, on the Nasdaq
Helsinki Ltd (First North) as of June 1,2021. The total number of the 2019A series option rights under the
2017-2019 option scheme is 1,616,666 and the total number of 2019B series option rights is 50,000. Each
option right entitles its holder to subscribe to one (1) Rovio Entertainment Corporation new share or
Company’s treasury share. Rovio Entertainment Corporation holds 728,916 series 2019A option rights
and 40,000 series 2019B option rights.

16
On June 30, 2021, the share subscription price under the 2019A series option rights is EUR 6.92 per
share. The share subscription price under the 2019B series option rights is EUR 7.13 per share. In
accordance with the terms and conditions of the option scheme, the subscription price has been reduced
by the amount of dividends decided before the share subscription, on the record date of each dividend
payment. The share subscription price shall, nevertheless, always amount to at least EUR 0.01. The
adjustment based on the distribution of assets does not apply to 2019B options.
In accordance with the terms and conditions of the option scheme, the share subscription period for
series 2019A and 2019B option rights began on June 1, 2021 and the subscription period ends on May 31,
2022.
The option holders can subscribe the shares during the subscription period by giving the payment and
subscription details to their own bank. New shares subscribed with option rights 2019A and 2019B will be
listed as additional lots of Company shares on the main list of Nasdaq Helsinki together with the old
shares after the share capital increase has been registered.
Risks As a result of the worldwide coronavirus pandemic Covid-19 the company’s business environment has
changed, and changes are expected to continue. The pandemic and especially the impact it has on the
global economy, may affect Rovio’s business and business performance either directly or indirectly.
The Company’s liquidity and cash flow is strong, and the profitability outlook remains positive, which
enables the Company to continue to execute its business in accordance with its strategy.
Based on the Company’s assessment, there were no material changes in the risks and uncertainties
during the review period.
The most significant risks are related to the financial performance of Rovio’s top games in the market,
the continuous development of these games, and ability to develop new successful games. Risks in user
acquisition relate to the accuracy of the profit models and the impact on the Group’s net profit. New
games introduced by competitors and changes in the competitive landscape may also impact the success
of Rovio’s games revenues, size of user acquisition investments, and the Group’s profit. Changes in
governmental regulations in different countries and content distributor’s terms and policies can have
both short- and long-term implications for the business.
Other significant risks relate to the demand for Angry Birds branded consumer products and other
content that may impact the revenues of the Brand Licensing business unit.
The Company engages in business in several currencies, with the euro and U.S. dollar being the most
significant. Fluctuations in exchange rates, particularly between the euro and the U.S. dollar could have a
material impact on the Company’s result.
More details on the risks, uncertainties, and Rovio’s risk management can be found online at
www.rovio.com and in the most recent published financial statements.

17
2021 outlook (unchanged) The mobile gaming market continues to grow with casual gaming being a major growth driver. The
ongoing changes in consumer behavior and underlying market trends are accelerated by the COVID
pandemic and plays an important role in both current games’ operation and new game development.
This combined with industry changes like Apple’s privacy policy fuels the near-term uncertainty in the
market environment.
We will focus on improving the performance of our key live games and on launching new innovative
products. We continue to show diligence in our UA spend. Depending on market conditions, the
performance of our investments, and the launch of new games, we aim to increase our UA investments
to build growth for the coming years. This may have implications on short-term profitability.
We will continue investing in our Future of Gaming initiatives, taking advantage of the trends we see in
consumer behavior and building our positioning in the rapidly evolving market.
In addition, we seek growth through synergistic acquisitions that can deliver long-term value growth.
Decisions of the Annual General Meeting and the organizing meeting of the
Board of Directors
The Annual General Meeting of Rovio Entertainment Corporation was held on March 30, 2021 at the
Company’s headquarters, Keilaranta 7, FI-02150 Espoo, Finland. To prevent the spread of the Covid-19
pandemic, the Annual General Meeting was held without the presence of shareholders or their
representatives at the meeting venue. Shareholders and their proxy representatives could participate in
the meeting and exercise shareholder rights only by voting in advance or making counterproposals and
presenting questions in advance.
The Annual General Meeting adopted all the proposals to the General Meeting by the Board of
Directors, approved the financial statements for the financial year 2020, approved the remuneration
report for the company’s governing bodies and discharged the company's management from liability.
The Annual General Meeting decided that the Board of Directors shall comprise six (6) members. Ms.
Camilla Hed-Wilson, Mr. Kim Ignatius, Mr. Björn Jeffery, Mr. Jeferson Valadares and Ms. Leemon Wu as
well as Mr. Niklas Hed as a new member were elected members of the Board of Directors for the term of
office ending at the closure of the Annual General Meeting in 2022. Mr. Kim Ignatius was elected
Chairman of the Board of Directors. Mr. Björn Jeffery was elected Vice Chairman of the Board of
Directors.
The remuneration of the members of the Board of Directors was kept unchanged and monthly
remuneration will be paid as follows: to the Chairman of the Board of Directors EUR 9,500, to the Vice
Chairman of the Board of Directors EUR 7,500, to the other members of the Board of Directors EUR 5,000
each, and as additional monthly compensation to the Chairman of the Audit Committee EUR 2,500. If the
Chairman of the Audit Committee is the Chairman or Vice Chairman of the Board of Directors, no
additional compensation will be paid. The company will compensate reasonable travel expenses of the
Board members and committee members arising from Board or committee work.
Ernst & Young Oy, authorized public accountants, was re-elected auditor of the company. Ernst &
Young Oy has notified that Ms. Terhi Mäkinen, APA, will act as the auditor with principal responsibility.
The auditor's term of office will end at the closure of the Annual General Meeting in 2022. The auditor will
be paid remuneration according to the auditor's reasonable invoice approved by the company.

18
The Annual General Meeting authorized the Board of Directors to decide on the repurchase and/or on
the acceptance as pledge of the company's own shares. The number of own shares to be repurchased
and/or accepted as pledge may not exceed 8,146,565 shares, which corresponds to approximately 10
percent of all the current shares of the company. The company together with its subsidiaries cannot at
any moment own or hold as pledge more than 10 percent of all the shares of the company.
The Annual General Meeting authorized the Board of Directors to decide on the issuance of shares and
the issuance of special rights entitling to shares referred to in Chapter 10 Section 1 of the Companies Act.
The number of new shares to be issued on the basis of the authorization may not exceed an aggregate
maximum of 8,146,565 shares, which corresponds to approximately 10 percent of all the current shares
of the company. In addition to the authorization to issue new shares, the Board of Directors may decide
on the conveyance of an aggregate maximum of 8,146,565 own shares held by the company.
The Board of Directors is entitled to decide on all terms of the issuance of shares and of special
rights entitling to shares and it is entitled to deviate from the shareholders' pre-emptive subscription
rights (directed issue).
Both authorizations are in force until the closing of the next Annual General Meeting, however no
longer than until June 30, 2022.
The Annual General Meeting decided to establish a Shareholders' Nomination Board to prepare future
proposals concerning the election and remuneration of the members of the Board of Directors and
remuneration of the members of the Committees of the Board of Directors to the next Annual General
Meetings and, if needed, to Extraordinary General Meetings. In addition, The Annual General Meeting
decided to adopt the Charter of the Shareholders' Nomination Board.
According to the decision of the Annual General Meeting, the Nomination Board shall comprise
representatives appointed by the four largest shareholders of the Company, however so that at least one
of the members has to be appointed by an institutional investor. If there is no institutional investor
among the four largest shareholders, the right of the fourth largest shareholder transfers to the next
largest institutional investor who would not otherwise have an appointment right. The Chairman of the
Board of Directors shall act as an expert member in the Nomination Board. The Chairman of the Board of
Directors shall not take part in the decision-making of the Shareholders’ Nomination Board.
The right to appoint representatives shall be vested with the four shareholders of the Company having
the largest share of the votes represented by all the shares in the Company annually on the first workday
of September preceding the Annual General Meeting. The right to nominate representatives is
determined based on the shareholders' register maintained by Euroclear Finland Ltd. If a shareholder
who has an obligation under the Finnish Securities Market Act to take holdings of shares e.g., in several
funds or group companies into account when disclosing changes in share ownership or who holds
nominee registered shares makes a written request to the Chairman of the Board of Directors no later
than on 31 August, such holdings of the shareholder will be taken into account when determining the
nomination right.
Such shareholders are also required to present a reliable account of the number of shares in their
ownership on the above date to the Chairman of the Board of Directors by the fourth workday of
September at the latest. The Chairman of the Board of Directors invites the four largest shareholders,
who have the right to nominate representatives as determined above, to nominate one member each to
the Shareholders’ Nomination Board.

19
Should a shareholder not wish to exercise his/her nomination right, the right shall be transferred to the
next largest shareholder who otherwise would not be entitled to nominate a member. The Shareholders’
Nomination Board is established to serve until further notice until the General Meeting decides
otherwise. The term of office of the members of the Shareholders’ Nomination Board expires annually
after the new Nomination Board has been nominated. Members of the Shareholders’ Nomination Board
are not remunerated for their membership in the Nomination Board. Travel expenses of the members
are reimbursed in accordance with the Company’s travel policy. The Shareholders’ Nomination Board
may, when necessary, use external experts in connection with the performance of its duties in
accordance with costs approved by the Company.
The establishment of the Shareholders’ Nomination Board changes the method of preparation of the
remuneration proposal defined in the Remuneration Policy regarding the members of the Board of
Directors; going forward, the Shareholders’ Nomination Board prepares the remuneration proposals
concerning the Board of Directors.
In its organizing meeting, which was held immediately after the General Meeting, the Board of
Directors elected from amongst its members Mr. Kim Ignatius, (Chair), Ms. Camilla Hed-Wilson and Ms.
Leemon Wu as members of the Audit Committee, and Ms. Camilla Hed-Wilson (Chair), Mr. Björn Jeffery
and Mr. Jeferson Valadares as members of the Remuneration Committee.
Dividend Distribution The Annual General Meeting decided, in accordance with the proposal of the Board of Directors, to
distribute a dividend of EUR 0.12 per share. The remaining part of the distributable funds will be retained
in the shareholders’ equity. The dividend was paid to shareholders who on the record date of the
dividend payment April 1, 2021 were recorded in the company’s shareholders’ register held by Euroclear
Finland Ltd. The dividend was paid on April 12, 2021.
Share subscriptions with stock options On May 7, 2021 Rovio announced that between 10 February 2020 and 19 April 2021, a total of 235,102
Rovio Entertainment Corporation’s new shares have been subscribed for with the stock option program
2018. 7,000 new shares have been subscribed for with the 2018A stock options at a subscription price of
EUR 5.08 and 228,102 new shares have been subscribed at a subscription price of EUR 4.96. The entire
subscription price of EUR 1,166,945.92 was recorded into the invested unrestricted equity reserve.
As a result of the share subscriptions, the number of Rovio Entertainment shares increased to
81,700,761 shares.
On June 16, 2021 Rovio announced that between 20 April 2021 and 31 May 2021, a total of 400,442
Rovio Entertainment Corporation’s new shares have been subscribed for with the stock option program
2018. 400,442 new shares have been subscribed for with the 2018A stock options at a subscription price
of EUR 4.96. The entire subscription price of EUR 1,986,192.32 was recorded into the invested
unrestricted equity reserve.
As a result of the share subscriptions, the number of Rovio Entertainment shares increased to
82,101,203 shares.
Changes in management On May 26, 2021 Rovio announced that it has named Kieran O’Leary as Chief Operating Officer and
appointed him and CTO Petri Hyökyranta to the leadership team.

20
Events after the review period On August 12, 2021 Rovio announced that it has entered into an agreement to acquire 100% of the
shares in Ruby Games, a hyper-casual studio based in Izmir, Turkey. Ruby Games is the creator of the hit
game, Hunter Assassin, the sixth most downloaded game in the world in 2020.
Under the terms of agreement, Rovio will acquire Ruby Games in multiple tranches. In the first tranche
Rovio will acquire 20% of Ruby’s outstanding shares for USD 10 million in cash. The anticipated closing for
the first tranche is the end of Q3-2021 or beginning of Q4-2021. In October 2022, in the second tranche
Rovio will acquire 50% of Ruby’s outstanding shares for an amount that is dependent on Ruby’s financial
performance as measured by revenue and EBITDA in the previous 12-month period before October 2022,
however, not exceeding USD 80 million. The second tranche will be paid 60% in cash and 40% in Rovio’s
shares. The remaining 30% of Ruby’s outstanding shares will be purchased in five equal tranches over the
next five years with a minimum of 50% in cash and rest in cash or shares at a valuation based on Ruby’s
financial performance measured by EBITDA for each period, however not exceeding total EBITDA
generated during this period. The number of shares for the consideration paid with Rovio shares is
determined by the volume-weighted average daily price during the 20 trading days prior to the closing
date of each tranche. Under the terms of the agreement Ruby Games becomes a Rovio subsidiary at
closing of the first tranche.
In Jan-June 2021, Ruby games generated USD 7.8 million revenue, adjusted EBITDA USD 1.8 million and
adjusted EBITDA margin 23.3%. Total assets of Ruby Games on 30th June amounted to USD 4.3 million.
ROVIO ENTERTAINMENT CORPORATION
Board of Directors

21
Performance measures
4-6/ 4-6/ Change, 1-6/ 1-6/ Change, 1-12/
EUR million 2021 2020 % 2021 2020 % 2020
Revenue 68.8 69.2 -0.6% 135.9 135.8 0.1% 272.3
EBITDA 8.7 16.1 -45.7% 20.5 31.9 -35.9% 60.0
EBITDA margin 12.7% 23.2% 15.1% 23.5% 22.0%
Adjusted EBITDA 8.7 15.9 -45.0% 21.0 32.0 -34.4% 60.1
Adjusted EBITDA margin, % 12.7% 22.9% 15.5% 23.6% 22.1%
Operating profit 6.2 14.1 -56.2% 15.7 26.8 -41.4% 42.5
Operating profit margin, % 8.9% 20.3% 11.5% 19.7% 15.6%
Adjusted operating profit 6.2 13.8 -55.5% 16.2 26.9 -39.6% 47.2
Adjusted operating profit margin, % 8.9% 20.0% 12.0% 19.8% 17.3%
Profit before tax 6.1 14.8 -59.0% 16.5 26.3 -37.4% 40.7
Capital expenditure 0.8 1.1 -21.3% 1.8 1.8 -4.0% 3.9
User acquisition 21.3 14.0 51.8% 38.5 27.5 40.4% 58.7
Return on equity (ROE), % 18.5% 19.7% 18.5% 19.7% 24.4%
Net gearing ratio, % -72.5% -68.1% -72.5% -68.1% -77.6%
Equity ratio, % 84.9% 83.1% 84.9% 83.1% 82.3%
Earnings per share, EUR 0.07 0.15 -54.4% 0.17 0.26 -35.4% 0.43
Earnings per share, diluted EUR 0.07 0.15 -54.5% 0.17 0.26 -35.7% 0.43
Net cash flows from operating activities 7.6 18.7 -59.4% 10.1 30.2 -66.7% 63.6
Employees (average for the period) 481 460 4.4% 484 463 4.4% 470
Rovio presents alternative performance measures as additional information to financial measures
presented in the consolidated income statements, consolidated balance sheets, and consolidated
statements of cash flows prepared in accordance with IFRS. In Rovio’s view, the alternative performance
measures provide the management, investors, securities analysts, and other parties with significant
additional information related to Rovio’s results of operations, financial position or cash flows, and are
often used by analysts, investors, and other parties.
Rovio presents adjusted EBITDA and adjusted operating profit, which have been adjusted for material
items outside the ordinary course of business such as material net gains and losses from business
disposals, direct transaction costs related to business acquisitions, restructuring costs for business
operations and changes in fair value of contingent considerations, significant impairment losses and
reversals, and costs relating to enlargement of the ownership base of the company. Adjusted EBITDA and
adjusted operating profit are presented as complementing measures to the measures included in the
consolidated income statement presented in accordance with IFRS as, in Rovio’s view, they increase
understanding of Rovio’s results of operations.
EBITDA, EBITDA margin, adjusted EBITDA, adjusted EBITDA margin, operating profit, operating profit
margin, adjusted operating profit, and adjusted operating profit margin are shown as complementing
measures to assess the profitability and efficiency of Rovio’s operations. User acquisition costs, user
acquisition costs share of Games business unit’s revenue, %, and gross bookings are presented to
enhance the comparability to other actors in the industry. Dividend per share, equity ratio, return on
equity (ROE), net gearing, and capital expenditure are useful measures in assessing the efficiency of
Rovio’s operations, and Rovio’s ability to obtain financing and service its debts.

22
The alternative performance measures should not be considered in isolation or as substitutes to the
measures under IFRS. All companies do not calculate alternative performance measures in a uniform way
and, therefore, the alternative performance measures presented here may not be comparable with
similarly named measures presented by other companies.
Reconciliation of adjusted operating profit
EUR million 4-6/2021
Items affecting
comparability
Income statement
excluding items affecting
comparability
Revenue 68.8 68.8
Other operating income 0.1 0.1
Materials and services -18.7 -18.7
Employee benefits expense -12.9 -12.9
Depreciation and amortization -2.6 -2.6
Other operating expenses -28.6 -28.6
Operating profit 6.2 6.2
EUR million 4-6/2020
Items affecting
comparability
Income statement
excluding items affecting
comparability
Revenue 69.2 69.2
Other operating income 0.2 -0.2 0.0
Materials and services -19.8 -19.8
Employee benefits expense -12.1 -12.1
Depreciation and amortization -2.0 -2.0
Other operating expenses -21.5 0.0 -21.5
Operating profit 14.1 -0.2 13.8
EUR million 1-6/2021
Items affecting
comparability
Income statement
excluding items affecting
comparability
Revenue 135.9 135.9
Other operating income 0.6 0.6
Materials and services -36.9 -36.9
Employee benefits expense -26.3 0.3 -26.0
Depreciation and amortization -4.8 0.0 -4.8
Other operating expenses -52.9 0.3 -52.6
Operating profit 15.7 0.6 16.2
EUR million 1–6/2020
Items affecting
comparability
Income statement
excluding items affecting
comparability
Revenue 135.8 135.8
Other operating income 0.3 -0.2 0.0
Materials and services -37.8 -37.8
Employee benefits expense -23.3 0.2 -23.2
Depreciation and amortization -5.1 -5.1
Other operating expenses -43.0 0.2 -42.8
Operating profit 26.8 0.1 26.9

23
EUR million 1–12/2020
Items affecting
comparability
Income statement
excluding items affecting
comparability
Revenue 272.3 272.3
Other operating income 0.6 -0.2 0.4
Materials and services -74.6 -74.6
Employee benefits expense -48.9 0.2 -48.7
Depreciation and amortization -17.5 4.6 -12.9
Other operating expenses -89.4 0.2 -89.2
Operating profit 42.5 4.7 47.2
Reconciliation of adjusted operating profit
EUR million 4-6/2021 4-6/2020 1-6/2021 1-6/2020 1–12/2020
Operating profit 6.2 14.1 15.7 26.8 42.5
Income from Bargain Purchase -0.2 -0.2 -0.2
Restructuring costs arising from employee benefits expenses 0.3 0.2 0.2
Restructuring costs in Other operating expenses 0.0 0.3 0.2 0.2
Restructuring costs in Depreciation and amortization 0.0
4.6
Adjusted operating profit 6.2 13.8 16.2 26.9 47.2
Reconciliation of EBITDA and Adjusted EBITDA
EUR million 4-6/2021 4-6/2020 1-6/2021 1-6/2020 1–12/2020
Operating profit 6.2 14.1 15.7 26.8 42.5
Depreciation and amortization 2.6 2.0 4.8 5.1 17.5
EBITDA 8.7 16.1 20.5 31.9 60.0
Income from Bargain Purchase -0.2 -0.2 -0.2
Restructuring costs arising from employee benefits expenses 0.3 0.2 0.2
Restructuring costs in Other operating expenses 0.0 0.3 0.2 0.2
Adjusted EBITDA 8.7 15.9 21.0 32.0 60.1

24
Reconciliation of equity ratio, %, return on equity, %,
net gearing ratio, %, and net debt
EUR million 4-6/2021 4-6/2020 1-6/2021 1-6/2020 1–12/2020
Equity ratio, % 84.9% 83.1% 84.9% 83.1% 82.3%
Equity 175.4 157.9 175.4 157.9 165.4
Advances received 2.0 2.0 2.0 2.0 2.0
Deferred revenue 5.6 6.1 5.6 6.1 5.5
Total assets 214.3 198.1 214.3 198.1 208.5
Return on equity, % 18.5% 19.7% 18.5% 19.7% 24.4%
Profit/loss before tax 30.9 31.7 30.9 31.7 40.7
Shareholder's equity beginning of period 157.9 163.1 157.9 163.1 168.0
Shareholder's equity end of period 175.4 157.9 175.4 157.9 165.4
Net gearing ratio, % -72.5% -68.1% -72.5% -68.1% -77.6%
Total interest-bearing debt 8.3 9.1 8.3 9.1 10.5
Cash and cash equivalents 135.5 116.7 135.5 116.7 138.9
Equity 175.4 157.9 175.4 157.9 165.4
Non-current interest-bearing loans and borrowings 5.7 6.4 5.7 6.4 6.9
Current interest-bearing loans and borrowings 2.6 2.7 2.6 2.7 3.6
Cash and cash equivalents 135.5 116.7 135.5 116.7 138.9
Net debt -127.2 -107.6 -127.2 -107.6 -128.4
Gross bookings The following table sets out reconciliation of gross bookings used in key operational metrics and
reported revenue:
Reconciliation of gross bookings to revenue
EUR million 4-6/2021 4-6/2020 1-6/2021 1-6/2020 1–12/2020
Gross bookings 66.6 67.7 130.7 129.8 259.2
Change in deferred revenue -0.5 -0.2 -0.6 -0.2 0.3
Custom contracts 0.7 0.1 0.9 0.3 0.5
Other adjustments -0.3 -0.8 0.2 -0.3 -1.8
Revenue 66.4 66.9 131.3 129.6 258.2
Custom contracts are distribution contracts that are signed with partners who pre-download Rovio’s
games onto their own devices or distribute Rovio’s games through their proprietary distribution
platforms. Custom contracts usually contain a minimum guarantee and revenue share to Rovio. Rovio
recognizes corresponding minimum guarantee revenue over the contract period. Custom contracts do
not include the application stores operated by Apple and Google.

25
Calculation principles of IFRS performance measures Earnings per share, which is the net result for the review period divided by the average number of
shares in the review period, less treasury shares.
Calculation principles of alternative performance measures EBITDA (Earnings before interest, taxes, depreciation and amortization), which is operating profit
before depreciations and amortizations.
EBITDA margin, %, which is defined as EBITDA as a percentage of revenue.
Items affecting comparability, which are defined as material items outside the ordinary course of
business such as material net gains and losses from business disposals, direct transaction costs related
to business acquisitions, restructuring costs for business operations and changes in fair value of
contingent considerations, significant impairment losses and reversals, and costs relating to enlargement
of the ownership base of the company.
Adjusted EBITDA, which is defined as EBITDA excluding items affecting comparability.
Adjusted EBITDA margin, %, which is defined as comparable EBITDA as a percentage of revenue.
Operating profit margin, %, which is operating profit as a percentage of revenue.
Adjusted operating profit, which is defined as operating profit excluding items affecting
comparability.
Adjusted operating profit margin, %, which is defined as adjusted operating profit as a percentage of
revenue.
User acquisition, which relate to acquisition of new players in the Company’s games through
performance marketing campaigns.
User acquisition share of Games revenue, %, which is user acquisition costs as a percentage of
Games revenue.
Dividend per share, which is total dividend divided by number of shares, adjusted for share issues, at
the end of the financial period less treasury shares.
Equity ratio, %, which is calculated by dividing (i) Total equity by (ii) Total equity and liabilities less
advances received and deferred revenue.
Return on equity (ROE), which is calculated by dividing profit before tax, quarterly reports adjusted to
correspond with 12 months, by the average of total equity in the opening and closing balance sheet
Capital expenditure, which is cash flow of purchase of tangible and intangible assets.
Net debt, which is calculated by subtracting cash and cash equivalents from current and non-current
interest-bearing loans and borrowings.
Net gearing %, which is calculated by dividing net debt by the total equity.
Gross bookings represent in-app purchases and in-app advertising sales in the given calendar month,
reported on the basis of the date of purchase/sale. Gross bookings do not include revenue from custom
contracts, revenue deferrals or accounting adjustments due to e.g., foreign exchange rate differences
between revenue accruals and actual payments, and thus differs from the actual reported revenue.
Player, which is defined as the user who plays one of Rovio’s games on at least one device. A player
can continue playing the game on multiple devices by synchronizing the game progress. Under the
following metrics, a player who plays a given game in two devices is counted as one player.
DAU (Daily Active Users), which is defined as the number of players that played one of our games
during a particular day. Under this metric, a player that plays two different games on the same day is
counted as two DAUs. We primarily use information provided by Rovio’s own technology, but we also use
third-party tracking solutions for historical data and in cases when a game does not contain Rovio’s
tracking tools. Average DAUs for a particular period is the average of the DAUs for each day during that
period.

26
MAU (Monthly Active Users), which is defined as the number of players that played one of our games
during a particular calendar month. Under this metric, a player that plays two different games in the
same month is counted as two MAUs. We primarily use information provided by Rovio’s own technology,
but we also use third party tracking solutions for historical data and in cases when a game does not
contain Rovio’s tracking tools.
MUP (Monthly Unique Payers), which is defined as the number of players that made a payment at least
once during the calendar month through a payment method for which we can quantify the number of
individuals, including payers from our mobile games. MUPs does not include individuals who use certain
payment methods for which we cannot quantify the number of unique payers. We only use information
provided by Rovio’s own payment verification technology.
ARPDAU (Average Revenue Per Daily Active User), which is defined as Sum of quarterly Gross Bookings
divided by number of days in the quarter divided by average DAU for the quarter.
MARPPU (Monthly Average Revenue Per Paying User), which is defined as Monthly Gross IAP Bookings
divided by MUP from verified purchases. MARPPU does not include revenue from custom contracts,
revenue deferrals or accounting adjustments such as foreign exchange rate differences between revenue
accruals and actual payments.

27
Half Year Financial Report
January 1–June 30, 2021 - Tables The figures in the Interim report are unaudited.
Statement of consolidated profit or loss and other comprehensive income
EUR million
4-6/
2021
4-6/
20120
1-6/
2021
1-6/
2020
1–12/
2020
Revenue 68.8 69.2 135.9 135.8 272.3
Other operating income 0.1 0.2 0.6 0.3 0.6
Materials and services 18.7 19.8 36.9 37.8 74.6
Employee benefits expense 12.9 12.1 26.3 23.3 48.9
Depreciation and amortization 2.6 2.0 4.8 5.1 17.5
Other operating expenses 28.6 21.5 52.9 43.0 89.4
Operating profit 6.2 14.1 15.7 26.8 42.5
Finance income and expenses -0.1 0.7 0.8 -0.5 -1.8
Share of profit of associates 0.0 0.0 0.0 0.0 0.0
Profit (loss) before tax 6.1 14.8 16.5 26.3 40.7
Income tax expense -1.1 3.7 -4.1 6.3 -8.6
Profit for the period 4.9 11.1 12.3 20.0 32.1
Equity holders of the parent company 4.9 11.1 12.3 20.0 32.1
Other comprehensive income/expense
Other comprehensive income that will not be reclassified to
profit and loss (net of tax):
Investments in equity instruments 1.0 0.0 1.7 0.0 0.0
Other comprehensive income to be reclassified to profit or
loss in subsequent periods (net of tax):
Translation differences 0.0 0.1 0.1 -0.1 -0.0
Other comprehensive income for the year net of tax 1.1 0.1 1.8 -0.1 -0.0
Total comprehensive income for the period net of tax 6.0 11.1 14.1 19.9 32.1
Equity holders of the parent company 6.0 11.1 14.1 19.9 32.1
Earnings per share for net result attributable to owners
of the parent:
Earnings per share, EUR 0.07 0.15 0.17 0.26 0.43
Earnings per share, diluted EUR 0.07 0.15 0.17 0.26 0.43

28
Consolidated statement of financial position
EUR million 30 Jun 2021 30 Jun 2020 31 Dec 2020
ASSETS
Non-current assets 42.9 42.9 38.6
Property, plant and equipment 1.1 1.1 1.3
Intangible assets 17.2 27.9 18.7
Right-of-use assets 7.2 6.7 8.4
Investments 6.9 1.3 2.0
Non-current receivables 3.3 0.7 0.7
Deferred tax assets 7.2 5.2 7.5
Current assets 171.4 155.2 169.9
Trade receivables 27.4 27.9 21.1
Prepayments and accrued income 7.0 7.6 8.0
Other current financial assets 1.6 3.1 1.8
Money market funds 50.7 69.6 50.5
Cash and cash equivalents 84.8 47.0 88.4
Total assets 214.3 198.1 208.5
EQUITY AND LIABILITIES Equity
Issued capital 0.7 0.7 0.7
Reserves 46.0 41.8 42.1
Translation differences -0.4 -0.6 -0.5
Treasury shares -36.9 -31.0 -37.5
Fair value reserve 1.7 0.0 0.0
Retained earnings 151.9 127.0 128.4
Profit for the period 12.3 20.0 32.1
Equity holders of the parent company 175.4 157.9 165.4
Non-controlling interests 0.0 0.0 0.0
Total equity 175.4 157.9 165.4
Liabilities
Non-current liabilities 6.2 6.4 7.0
Interest-bearing loans and borrowings 0.9 2.1 0.9
Lease liabilities 4.9 4.3 6.1
Deferred tax liabilities 0.5 0.0 0.0
Current liabilities 32.7 33.7 36.1
Trade and other payables 8.6 9.6 7.4
Interest-bearing loans and borrowings 0.1 0.1 1.1
Lease liabilities 2.5 2.6 2.5
Other current financial liabilities 1.4 0.6 0.8
Advances received 2.0 2.0 2.0
Deferred revenue 5.6 6.1 5.5
Income tax payable 0.6 0.1 1.9
Provisions 0.0 0.1 0.7
Accrued liabilities 11.9 12.7 14.1
Total liabilities 38.9 40.1 43.0
Total equity and liabilities 214.3 198.1 208.5

29
Consolidated statement of changes in equity
Attributable to the equity holders of the parent on June 30, 2020
EUR million
Issued
capital
Unrestricte
d
equity
reserve
Treasury
shares
Retained
earnings
Fair
value
reserve
Foreign
currency
translation
reserve
Total
Non-
controlling
interests
Total
equity
Balance at Jan 1, 2020 0.7 41.8 -7.1 133.0 0.0 -0.5 168.0 0.0 168.0
Profit for the period 20.0 20.0 20.0
Treasury share acquisition -24.2
-24.2 -24.2
Other comprehensive income
-0.1 -0.1 -0.1
Cash dividends -6.9 -6.9 -6.9
Share-based payments 0.3 0.9 1.3 1.3
June 30, 2020 0.7 41.8 -31.0 147.0 0.0 -0.6 157.9 0.0 157.9
Attributable to the equity holders of the parent on June 30, 2021
EUR million
Issued
capital
Unrestricted
equity
reserve
Treasury
shares
Retained
earnings
Fair
value
reserve
Foreign
currency
translation
reserve
Total
Non-
controlling
interests
Total
equity
Balance at Jan 1, 2021
0.7 42.1 -37.5 160.5 0.0 -0.5 165.4 0.0 165.4
Profit for the period 12.3 12.3 12.3
Option subscriptions 3.9 3.9 3.9
Other comprehensive income 1.7 0.1 1.8 1.8
Cash dividends -8.8 -8.8 -8.8
Share-based payments 0.6 0.2 0.8 0.8
June 30, 2021 0.7 46.0 -36.9 164.2 1.7 -0.4 175.4 0.0 175.4

30
Consolidated statement of cash flows
EUR million
4-6/
2021
4-6/
2020
1-6/
2021
1-6/
2020
1–12/
2020
Operating activities
Profit (loss) before tax 6.1 14.8 16.5 26.3 40.7
Adjustments:
Depreciation and amortization on tangible and intangible assets 2.6 2.0 4.8 5.1 17.5
Net foreign exchange differences -0.2 0.4 -1.1 -0.4 1.3
Gain on disposal of property, plant and equipment 0.0 0.0 0.0 -0.0 -0.0
Finance costs 0.1 0.2 0.2 0.4 0.6
Other non-cash items 0.4 1.1 0.9 1.2 2.3
Change in working capital:
Change in trade and other receivables and prepayments 2.1 0.4 -4.9 6.3 11.8
Change in trade and other payables -1.9 2.2 -1.0 -4.6 -4.2
Interest received 0.0 -0.1 0.1 0.1 0.2
Interest paid -0.1 -0.1 -0.3 -0.4 -0.8
Income tax paid (received) -1.4 -2.2 -5.0 -4.3 -5.8
Net cash flows from operating activities
7.6
18.7
10.1
30.2
63.6
Investing activities
Purchase of tangible and intangible assets -0.8 -1.1 -1.8 -1.8 -3.9
Other investments -2.5 0.0 -2.8 -0.6 -1.2
Proceeds from sales of tangible and intangible assets 0.0 0.0 0.0 0.0 0.0
Loans granted, investments -2.5 0.0 -2.5 0.0 0.0
Acquisition of subsidiaries, net of cash acquired 0.0 0.4 0.0 0.4 0.4
Net cash flows used in investing activities
-5.8
-0.7
-7.0
-2.0
-4.7
Financing activities
Finance lease repayments -0.7 -0.7 -1.4 -1.3 -2.7
Proceeds from and repayments of borrowings -1.0 -1.0 -1.0 -4.0 -4.0
Share subscriptions based on option rights 3.2 0.2 3.9 0.3 0.3
Acquisition of treasury shares 0.0 -13.2 0.0 -24.2 -30.7
Share-based payments -0.1 0.0 0.0 0.0 0.3
Dividends paid to equity holders of the parent -8.8 -6.9 -8.8 -6.9 -6.9
Net cash flows from/(used in) financing activities -7.5 -21.6 -7.4 -36.2 -43.7
Change in cash and cash equivalents
-5.8
-3.5
-4.4
-8.0
15.2
Net foreign exchange difference and value changes in money
market funds 0.1 -0.9 -1.0 -0.1 -1.1
Cash and cash equivalents at beginning of period 141.2 121.1 138.9 124.7 124.7
Cash and cash equivalents at the end of the period 135.5 116.7 135.5 116.7 138.9
Reconciliation of cash and cash equivalents in statement of
financial position
Cash and cash equivalents in statement of financial position at the
end of period 50.7 69.6 50.7 69.6 88.4
Money market funds at the end of period 84.8 47.0 84.8 47.0 50.5
Cash and cash equivalents at the end of the period 135.5 116.7 135.5 116.7 138.9

31
Notes
1. Key accounting principles Rovio’s consolidated financial statements are prepared in accordance with the International Financial
Reporting Standards (IFRS) adopted by the EU. The Half Year Financial Report has been prepared in
accordance with IAS 34, Interim Financial Reporting. The accounting principles and methods used in the
preparation of the interim report are essentially the same as those applied in the consolidated financial
statements for the year 2020.
The figures in the consolidated interim financial statements have been rounded and consequently the
sum of individual figures may deviate from the sum presented. Key figures have been calculated using
exact figures.
This Financial Statement Bulletin does not include all the information or disclosures as presented in the
consolidated financial statements of December 31, 2020.
2. Notes to the statement of profit or loss 2.1 Segment disclosures
Rovio has defined its operating segments as Games, Brand Licensing (BLU) and Other.
Rovio defines the Group’s Board of Directors as its chief operating decision maker (CODM). The CODM
follows Rovio’s performance on the segment level, which is presented in section 2.2 Segment operating
performance. EBITDA is the primary performance measure that CODM follows. There are no revenues
between the operating segments of Rovio Group.
The segment assets and liabilities except for non-current assets are not reported and reviewed by the
chief operating decision maker and have not been included in the table below. Rovio did not during the
interim period have customers that would require disclosure (i.e. 10% or more of revenues from
transactions with a single customer).

32
2.2 Segment operating performance
The allocations between segments consist of shared functions employee benefits expense as well as
general and administrative expenses that are recognized centrally and allocated to the reportable
segments as a separate line item in management reporting.
Segment profit and loss 4-6/2021
EUR million
Games
Brand
Licensing
Other
Allocation
Total IFRS
segments
Revenue 66.4 2.4 0.0 68.8
Other operating income 0.1 0.0 0.0 0.1
Materials and services 18.4 0.3 0.0 18.7
Employee benefits expense 10.1 0.3 1.3 1.2 12.9
User acquisition 21.3 0.0 0.0 21.3
Other operating expenses 5.5 0.1 0.7 1.1 7.3
Allocations 1.7 0.3 0.4 -2.3 0.0
EBITDA 9.6 1.4 -2.3 0.0 8.7
Depreciation and amortization 1.4 1.0 0.1 2.6
Operating profit 8.2 0.4 -2.5 6.2
EBITDA 9.6 1.4 -2.3 8.7
Adjustments 0.0 0.0 0.0 0.0
Adjusted EBITDA 9.6 1.4 -2.3 8.7
Operating profit 8.2 0.4 -2.5 6.2
Adjustments 0.0 0.0 0.0 0.0
Adjusted operating profit 8.2 0.4 -2.5 6.2
Segment Capital expenditure
4-6/2021
EUR million
Games
Brand
Licensing
Other
Total IFRS
segments
Capital expenditure 0.6 0.1 0.2 0.8
Segment assets June 30,2021
EUR million
Games
Brand
Licensing
Other
Total IFRS
segments
Non-current assets 3.5 11.9 27.5 42.9

33
Segment profit and loss 4-6/2020
EUR million
Games
Brand
Licensing
Other
Allocation
Total IFRS
segments
Revenue 66.9 2.3 0.0 69.2
Other operating income 0.0 0.0 0.2 0.2
Materials and services 19.5 0.3 0.0 19.8
Employee benefits expense 9.3 0.5 1.6 0.7 12.1
User acquisition 14.0 0.0 0.1 14.1
Other operating expenses 4.8 0.4 1.3 1.0 7.4
Allocations 1.2 0.2 0.4 -1.7 0.0
EBITDA 18.1 1.0 -3.0 0.0 16.1
Depreciation and amortization 1.1 0.7 0.2 2.0
Operating profit 17.0 0.2 -3.2 14.1
EBITDA 18.1 1.0 -3.0 16.1
Adjustments 0.0 0.0 -0.2 -0.2
Adjusted EBITDA 18.1 1.0 -3.2 15.9
Operating profit 17.0 0.2 -3.2 14.1
Adjustments 0.0 0.0 -0.2 -0.2
Adjusted operating profit 17.0 0.2 -3.4 13.8
Segment Capital expenditure
4-6/2020
EUR million
Games
Brand
Licensing
Other
Total IFRS
segments
Capital expenditure 0.6 0.1 0.3 1.1
Segment assets June 30, 2020
EUR million
Games
Brand
Licensing
Other
Total IFRS
segments
Non-current assets 7.1 18.9 16.9 42.9

34
Segment profit and loss 1–6/2021
EUR million
Games
Brand
Licensing
Other
Allocation
Total IFRS
segments
Revenue 131.3 4.6 0.0 135.9
Other operating income 0.5 0.0 0.1 0.6
Materials and services 36.4 0.5 0.0 36.9
Employee benefits expense 20.2 0.7 3.1 2.3 26.3
User acquisition 38.5 0.0 0.0 38.5
Other operating expenses 10.1 0.2 2.0 2.1 14.3
Allocations 3.2 0.5 0.7 -4.3 0.0
EBITDA 23.5 2.7 -5.6 0.0 20.5
Depreciation and amortization 2.4 2.0 0.3 4.8
Operating profit 21.0 0.6 -6.0 15.7
EBITDA 23.5 2.7 -5.6 20.5
Adjustments 0.0 0.0 0.5 0.5
Adjusted EBITDA 23.5 2.7 -5.1 21.0
Operating profit 21.0 0.6 -6.0 15.7
Adjustments 0.0 0.0 0.6 0.6
Adjusted Operating profit 21.0 0.6 -5.4 16.2
Segment Capital expenditure
1–6/2021
EUR million
Games
Brand
Licensing
Other
Total IFRS
segments
Capital expenditure 1.2 0.1 0.5 1.8
Segment assets June 30, 2021
EUR million
Games
Brand
Licensing
Other
Total IFRS
segments
Non-current assets 3.5 11.9 27.5 42.9
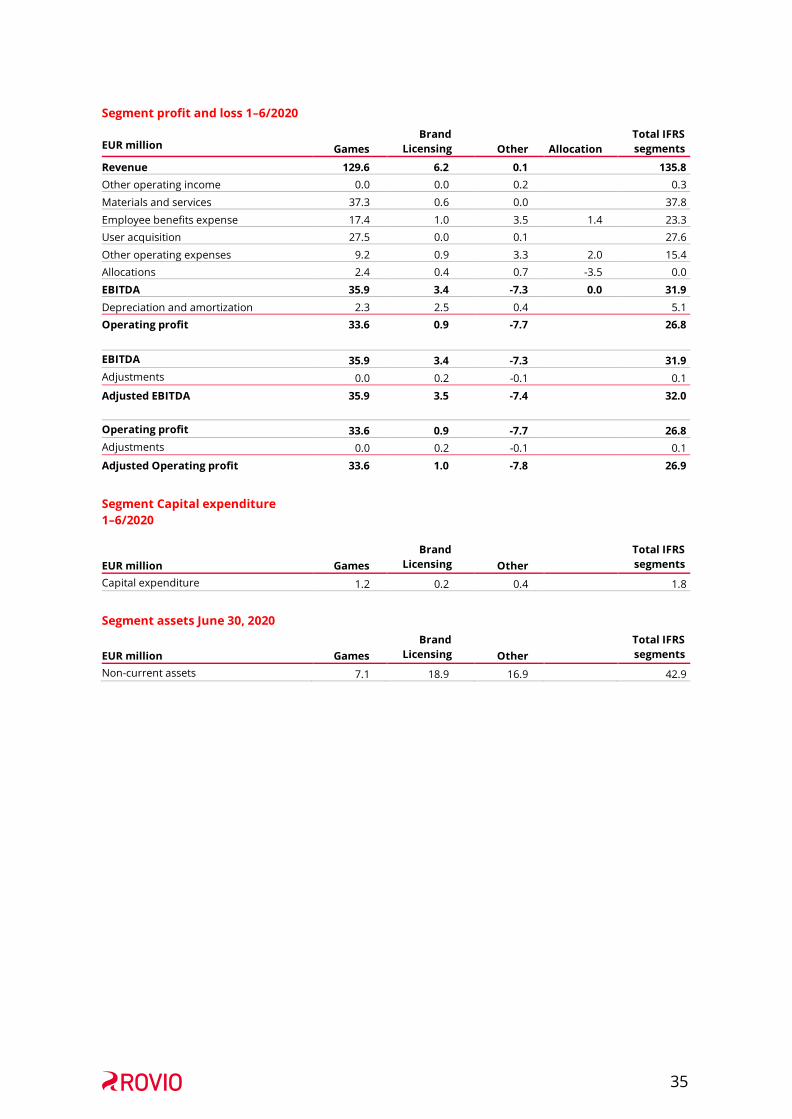
35
Segment profit and loss 1–6/2020
EUR million
Games
Brand
Licensing
Other
Allocation
Total IFRS
segments
Revenue 129.6 6.2 0.1 135.8
Other operating income 0.0 0.0 0.2 0.3
Materials and services 37.3 0.6 0.0 37.8
Employee benefits expense 17.4 1.0 3.5 1.4 23.3
User acquisition 27.5 0.0 0.1 27.6
Other operating expenses 9.2 0.9 3.3 2.0 15.4
Allocations 2.4 0.4 0.7 -3.5 0.0
EBITDA 35.9 3.4 -7.3 0.0 31.9
Depreciation and amortization 2.3 2.5 0.4 5.1
Operating profit 33.6 0.9 -7.7 26.8
EBITDA 35.9 3.4 -7.3 31.9
Adjustments 0.0 0.2 -0.1 0.1
Adjusted EBITDA 35.9 3.5 -7.4 32.0
Operating profit 33.6 0.9 -7.7 26.8
Adjustments 0.0 0.2 -0.1 0.1
Adjusted Operating profit 33.6 1.0 -7.8 26.9
Segment Capital expenditure
1–6/2020
EUR million
Games
Brand
Licensing
Other
Total IFRS
segments
Capital expenditure 1.2 0.2 0.4 1.8
Segment assets June 30, 2020
EUR million
Games
Brand
Licensing
Other
Total IFRS
segments
Non-current assets 7.1 18.9 16.9 42.9
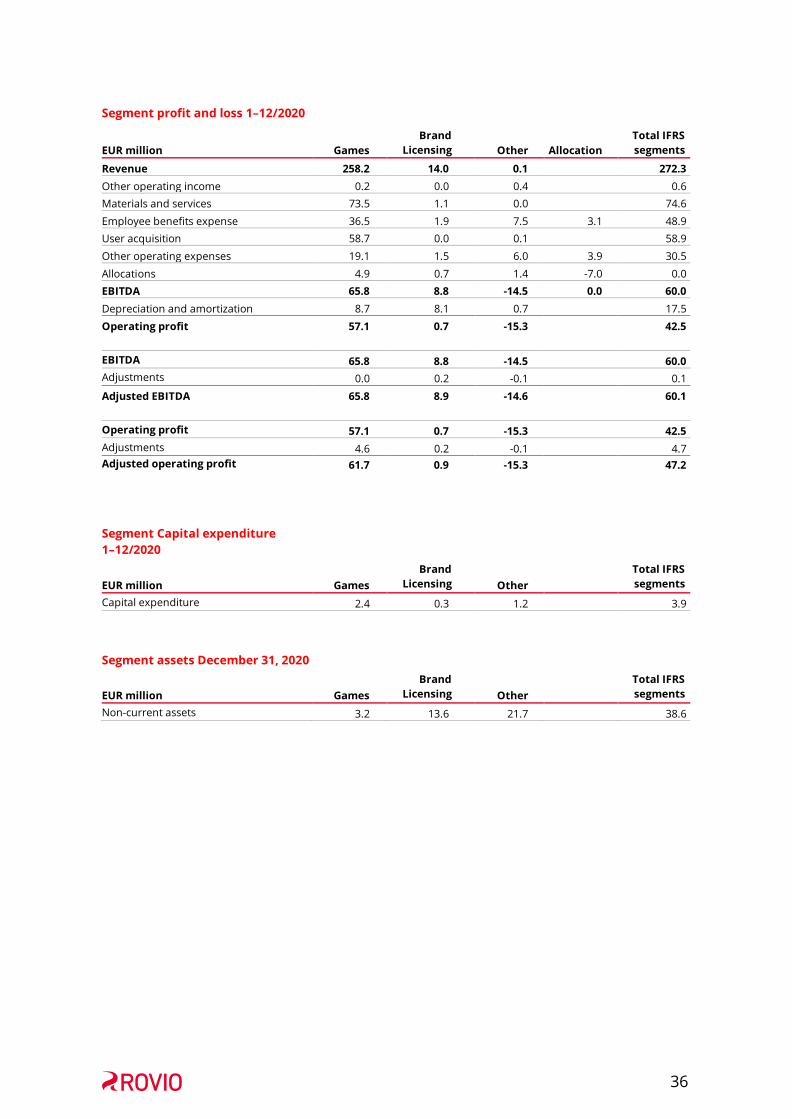
36
Segment profit and loss 1–12/2020
EUR million
Games
Brand
Licensing
Other
Allocation
Total IFRS
segments
Revenue 258.2 14.0 0.1 272.3
Other operating income 0.2 0.0 0.4 0.6
Materials and services 73.5 1.1 0.0 74.6
Employee benefits expense 36.5 1.9 7.5 3.1 48.9
User acquisition 58.7 0.0 0.1 58.9
Other operating expenses 19.1 1.5 6.0 3.9 30.5
Allocations 4.9 0.7 1.4 -7.0 0.0
EBITDA 65.8 8.8 -14.5 0.0 60.0
Depreciation and amortization 8.7 8.1 0.7 17.5
Operating profit 57.1 0.7 -15.3 42.5
EBITDA 65.8 8.8 -14.5 60.0
Adjustments 0.0 0.2 -0.1 0.1
Adjusted EBITDA 65.8 8.9 -14.6 60.1
Operating profit 57.1 0.7 -15.3 42.5
Adjustments 4.6 0.2 -0.1 4.7
Adjusted operating profit 61.7 0.9 -15.3 47.2
Segment Capital expenditure
1–12/2020
EUR million
Games
Brand
Licensing
Other
Total IFRS
segments
Capital expenditure 2.4 0.3 1.2 3.9
Segment assets December 31, 2020
EUR million
Games
Brand
Licensing
Other
Total IFRS
segments
Non-current assets 3.2 13.6 21.7 38.6

37
2.3 Geographical distribution of revenue
The Group’s business is very international. North America, and the United States in particular, is Rovio’s
largest market. The geographical distribution of revenue per segment is presented below.
For in-app purchases and advertising revenue, the Games segment’s revenue has been allocated to the
geographical markets based on gross bookings, which can be monitored on a country-specific basis.
Revenue from custom contracts is presented based on the customer’s home country. Revenue deferrals
and other adjustment items have been allocated to the geographical markets in proportion to gross
bookings, as they are estimated to largely follow the same structure.
The licensing revenue of the Brand Licensing segment has been allocated to the geographical markets
based on reported royalties and, for terminating contracts, according to the partner’s home country.
Revenue from content sales (movie, short form animations) has been allocated to the geographical
markets based on the home country of the distribution partner or contractual partner. The advertising
revenue allocated to the Brand Licensing segment has been allocated to the geographical markets
according to the same principle as in the Games segment.
EUR Million
4–6/2021
Games
Brand Licensing
Other
Total
4–6/2020
Games
Brand Licensing
Other
Total
NAM 44.9 1.3 0.0 46.1 45.7 0.8 0.0 46.5
LATAM 0.7 0.1 0.0 0.8 0.6 0.1 0.0 0.6
EMEA 13.7 0.6 0.0 14.3 13.7 1.1 0.0 14.9
APAC 7.1 0.4 0.0 7.5 6.9 0.3 0.0 7.2
Total 66.4 2.4 0.0 68.8 66.9 2.3 0.0 69.2
EUR Million
1–6/2021
Games
Brand Licensing
Other
Total
1–6/2020
Games
Brand Licensing
Other
Total
NAM 88.6 2.5 0.0 91.1 85.5 3.1 0.0 88.6
LATAM 1.3 0.1 0.0 1.4 1.2 0.1 0.0 1.3
EMEA 27.5 1.2 0.0 28.6 27.6 2.3 0.1 29.9
APAC 13.9 0.8 0.0 14.7 15.2 0.7 0.0 15.9
Total 131.3 4.6 0.0 135.9 129.6 6.2 0.1 135.8
EUR Million
1–12/2020
Games
Brand Licensing
Other
Total
NAM 171.1 8.8 0.0 179.9
LATAM 2.4 0.2 0.0 2.6
EMEA 55.4 3.8 0.1 59.2
APAC 29.4 1.1 0.0 30.5
Total 258.2 14.0 0.1 272.3

38
2.4 Disaggregation of revenue from contracts with Customers
EUR million
Segment and revenue stream Timing of revenue recognition
4–6/
2021
4–6/
2020
1–6/
2021
1–6/
2020
1–12/
2020
Games
In-application purchases At a point in time and over time 57.1 59.9 113.5 114.2 226.1
Subscription payments Over time 0.0 0.0 0.0 0.0 0.0
Custom contracts Over time 0.7 0.1 0.9 0.3 0.5
Advertising At a point in time 8.6 6.8 16.9 15.1 31.6
Games total revenue 66.4 66.9 131.3 129.6 258.2
Brand Licensing
IP Licensing and tangible sales At a point in time and over time 1.0 1.6 1.6 3.0 4.9
Animation broadcasting and distribution
At a point in time 1.3 0.8 2.9 3.0 8.8
Advertising At a point in time 0.1 -0.1 0.1 0.1 0.2
Brand Licensing total revenue 2.4 2.3 4.6 6.2 14.0
Other revenue At a point in time and over time 0.0 0.0 0.0 0.1 0.1
Group revenue 68.8 69.2 135.9 135.8 272.3
3. Notes to the statement of financial position 3.1 Non-Current Assets – Intangible Assets
Reconciliation of beginning and ending balances by classes of assets:
EUR million Development costs - Games
Trademarks Development costs -
Movie Development costs - Other
Total
Cost
At January 1, 2020 29.7 1.8 63.0 20.9 115.3
Additions 1.5 0.1 0.0 0.4 1.9
Disposals -0.1 -0.0 -0.1 0.0 -0.2
Reclassification -0.2 -0.1 0.0 1.1 0.8
At June 30, 2020 30.8 1.8 62.9 22.4 117.9
At January 1, 2021 32.4 2.0 62.9 22.7 119.9
Additions 1.2 0.3 0.0 0.0 1.7
Disposals -0.0 0.0 0.0 0.0 -0.0
Reclassification 0.0 -0.1 0.0 -0.2 -0.2
At June 30, 2021 33.6 2.2 62.9 22.4 121.1
Amortization and impairment
At January 1, 2020 22.7 1.0 43.0 19.6 86.4
Amortization 1.0 0.1 1.9 0.6 3.6
Impairment 0.0 0.0 0.0 0.0 0.0
At June 30, 2020 23.7 1.1 44.9 20.2 90.0
At January 1, 2021 28.8 1.3 50.0 20.7 100.8
Amortization 1.0 0.1 1.6 0.4 3.0
Impairment 0.0 0.0 0.0 0.0 0.0
At June 30, 2021 29.7 1.4 51.6 21.1 103.9
Carrying amount
At June 30, 2020 7.1 0.8 18.0 2.1 27.9
At June 30, 2021 3.9 0.8 11.3 1.5 17.2
At December 31, 2020 3.6 0.7 12.9 1.9 19.0
Development expenses still in production at June 30, 2021 amounted to EUR 0.1 million

39
3.2 Non-Current Assets – Tangible Assets
There were no material changes in tangible assets during the first half of 2021.
EUR million
Machinery and
equipment
Cost
At January 1, 2020 6.0
Additions 0.4
Disposals 0.0
Translation differences -0.0
At June 30, 2020 6.4
At January 1, 2021 6.8
Additions 0.2
Disposals 0.0
Translation differences 0.0
At June 30, 2021
Depreciation and amortization
7.0
At January 1, 2020 -5.1
Depreciation charge for the period -0.2
Disposals 0.0
Translation differences -0.0
At June 30, 2020 -5.3
At January 1, 2021 -5.6
Depreciation charge for the period -0.3
Disposals 0.0
Translation differences 0.0
At June 30, 2021
Carrying amount
-5.8
At June 30, 2021 1.1
At June 30, 2020 1.1
At December 31, 2020 1.3

40
3.3 Non-Current Assets – Right of use assets
There were no material changes in tangible assets during the first half of 2021.
EUR million
Property
Machinery and
equipment
Total
Cost
At January 1, 2020 9.9 0.9 10.7
Additions 0.0 0.0 0.0
Disposals 0.0 0.0 0.0
At June 30, 2020 9.9 0.9 10.7
At January 1, 2021 12.9 0.9 13.8
Additions 0.2 0.0 0.2
Disposals 0.0 0.0 0.0
At June 30, 2021 13.0 0.9 13.9
Amortization and
impairment
At January 1, 2020 2.3 0.5 2.8
Amortization 1.2 0.1 1.3
Disposals 0.0 0.0 0.0
At June 30, 2020 3.5 0.6 4.1
At January 1, 2021 4.7 0.7 5.4
Amortization 1,3 0.0 1.3
Disposals 0.0 0.0 0.0
At June 30, 2021
Carrying amount
6.0 0.7 6.7
At June 30, 2020 6.4 0.2 6.6
At June 30, 2021 7.0 0.1 7.2
At December 31, 2020 8.2 0.2 8.4
3.4 Investments
In the second quarter of 2021, Rovio announced a long-term partnership with Moomin Characters and
Gutsy Animation. Rovio will have the rights to develop and publish Moomin IP based games for any
platform, with exclusive rights for all mobile platforms. Rovio became a minority shareholder in Gutsy
Animations, the creator of the Moominvalley 3D animation series through an equity investment of 2.5
million euros and a convertible loan of 2.5 million euros.
3.Changes in contingent liabilities or contingent assets Future non-cancelable other commitments are as follows.
EUR million
At June 30,
2021
At June 30,
2020
At December 31,
2020
Venture Capital investment commitment 0.4 1.3 0.6
Total
0.4 1.3 0.6

41
4.Related party transactions Rovio’s related parties include its subsidiaries, associates, key persons belonging to the management
and their close family members and entities controlled by them, and entities with significant influence on
Rovio. There were no related party transactions during the reporting period.
5.Calculation of earnings per share 4-6/
2021
4-6/
2020
1-6/ 2021
1-6/ 2020
1-12/
2020
Earnings per share, EUR 0.07 0.15
0.17
0.26
0.43
Earnings per share, diluted, EUR 0.07 0.15 0.17 0.26 0.43
Shares outstanding at the end of the period (thousands) 74,386 74,495 74,386 74,495 73,479
Weighted average adjusted number of shares during the financial period, basic (thousands) 73,881 75,573 73,719 76,993 75,287
Weighted average adjusted number of shares during the financial period, diluted (thousands) 74,230 75,723 73,843 77,125 75,537