habitat restoration of chelan river reach 4 and tailrace ... agreement for the lake chelan...
TRANSCRIPT

60 PERCENT DESIGN REPORT
HABITAT RESTORATION OF THE CHELAN RIVER REACH 4 AND TAILRACE
Prepared for Public Utility District Number 1 of Chelan County
327 North Wenatchee Avenue
Wenatchee, Washington 98801
Prepared by Anchor Environmental, L.L.C.
1423 Third Avenue, Suite 300
Seattle, Washington 98101
Chinook Engineering
Watershed GeoDynamics
Waterfall Engineers
July 2007

Table of Contents
60 Percent Design Report July 2007 Habitat Restoration of the Chelan River Reach 4 and Tailrace i 040034‐01
1 INTRODUCTION................................................................................................................................ 1
2 HYDROLOGY...................................................................................................................................... 2 2.1 Methods....................................................................................................................................... 3
2.1.1 Mean Daily Flow Analysis ................................................................................................. 4 2.1.2 Peak Flow Analysis.............................................................................................................. 4
2.2 Results.......................................................................................................................................... 4 2.2.1 Mean Daily Flow Analysis ................................................................................................. 4 2.2.2 Peak Flow Analysis.............................................................................................................. 6
3 HYDRAULIC MODELING................................................................................................................ 8 3.1 Methods....................................................................................................................................... 8
3.1.1 HEC‐RAS Modeling – Existing Conditions ..................................................................... 8 3.1.2 HEC‐RAS Modeling – Proposed Conditions ................................................................. 10
3.2 Results of Proposed Conditions............................................................................................. 11 3.2.1 Tailrace Spawning and Rearing Terrace......................................................................... 11 3.2.2 Proposed Habitat Channel ............................................................................................... 13 3.2.3 Hydraulic Control Structure ............................................................................................ 13
4 SEDIMENT......................................................................................................................................... 15 4.1 Identification of Sediment Sources ........................................................................................ 16
4.1.1 Analysis of Historic Aerial Photographs........................................................................ 17 4.1.2 Reach 1 Painted Rock Study............................................................................................. 19
4.2 Sediment Deposition in Reach 4 ............................................................................................ 27 4.2.1 Review of Historic Sediment Deposition Documentation........................................... 27 4.2.2 Modeling of Sediment Deposition................................................................................... 29 4.2.3 Reach 4 Grain Size Distribution....................................................................................... 30
4.3 Transport of Spawning Size Sediment from Reach 4.......................................................... 32 4.3.1 Modeling of Sediment Entrainment................................................................................ 32 4.3.2 Reach 4 Painted Rock Study............................................................................................. 33
4.4 Conclusions............................................................................................................................... 37
5 PUMP TEST........................................................................................................................................ 38 5.1 Methods..................................................................................................................................... 38 5.2 Results........................................................................................................................................ 39 5.3 Discussion ................................................................................................................................. 40
6 GEOTECHNICAL ANALYSIS OF HYDRAULIC CONTROL STRUCTURE........................... 46
7 REFERENCES .................................................................................................................................... 47

Table of Contents
60 Percent Design Report July 2007 Habitat Restoration of the Chelan River Reach 4 and Tailrace ii 040034‐01
List of Tables Table 1 Fish Flows Provided into Reach 4 under New License .............................................. 2 Table 2 Peak Flow Recurrence ..................................................................................................... 7 Table 3 Aerial Photographs Used to Investigate Sediment Input from Reach 1 ................ 18 Table 4 Length of Bank Erosion in Reach 1 During Test Spills ............................................. 25 Table 5 Estimated Volume (cy) of Sediment Eroded at Different Spill Levels ................... 27 Table 6 Substrate Size (diameter) Eroded from Reach 4 at Different Spill Levels.............. 36 Table 7 Tests Conducted at Each Station.................................................................................. 39 Table 8 Summary of Falling Head and Pump Test Data........................................................ 39 List of Figures Figure 1 Flows in Reach 4 under New License Settlement Agreement.................................. 3 Figure 2 Historic Chelan River Spill Exceedance – 1974 to 2003 ............................................. 5 Figure 3 Historic Chelan River Days with Average and Median Spill Magnitude – 1974 to
2003 .................................................................................................................................... 6 Figure 4 Proposed Tailrace Spawning Terrace Depths and Velocity at 320, 2000, and 6000
cfs in Proposed Habitat Channel and 2200 cfs flow in powerhouse. (Note: Terrace is located from Main Channel Distance 550 to 850) .................................................. 12
Figure 5 Proposed Tailrace Spawning Terrace Velocity at 320, 2000, and 6000 cfs in Proposed Habitat Channel and 2200 cfs flow in powerhouse. (Note: Terrace is located from Main Channel Distance 400 to 850) ...................................................... 12
Figure 6 Proposed Habitat Channel Velocity and Depths at 320cfs along the channel centerline ......................................................................................................................... 13
Figure 7 Channel Velocity and Depths at 22,400cfs along the channel centerline and across the Hydraulic Control Structure (100 Year Event) .................................................... 14
Figure 8 Reach 4 stage discharge curve at the location of the outlet structure from 0 to 22,400cfs (100 Year Event) along the channel centerline .......................................... 14
Figure 9 Chelan River Geomorphic Zones and Profile ........................................................... 15 Figure 10 Chelan River Reach 1 Streambank Erosion Test Locations..................................... 20 Figure 11 Bank 7 (Reach 1) Marked Rocks Prior to Spill .......................................................... 22 Figure 12 Bank Erosion at Bank 4 (fine‐grained bank).............................................................. 23 Figure 13 Bank Erosion at Bank 6 (coarse‐grained bank) ......................................................... 24 Figure 14 Summary of Bank Erosion in Reach 1........................................................................ 25 Figure 15 Surface Sediment Pebble Count Grain Size Distribution ........................................ 32 Figure 17 Gravel Test Site 1 (Reach 4) Prior to Spill (flow from bottom to top).................... 35 Figure 18 Test Pit Locations .......................................................................................................... 38 Figure 19 STA 8+00 Falling Head Test......................................................................................... 41 Figure 20 STA 9+00 Falling Head Test......................................................................................... 41 Figure 21 STA 12+00 Pump and Falling Head Test ................................................................... 42 Figure 22 STA 15+50 Falling Head Test....................................................................................... 42 Figure 23 STA 18+50 Falling Head Test....................................................................................... 43

Table of Contents
60 Percent Design Report July 2007 Habitat Restoration of the Chelan River Reach 4 and Tailrace iii 040034‐01
Appendices Appendix A Chelan_Spill_Hydrology.xls Appendix B Monthly Flow Exceedance Values Appendix C Reach 1 Painted Rock Study Data Sheets Appendix D Reach 4 Grain Size Data Sheets

Introduction
60 Percent Design Report July 2007 Habitat Restoration of the Chelan River Reach 4 and Tailrace 1 040034‐01
1 INTRODUCTION
As part of Public Utility District Number 1 of Chelan County’s (the District’s) new license and
settlement agreement for the Lake Chelan Hydroelectric Project (Project), the District committed
to providing additional habitat in the Chelan River Reach 4 and tailrace of the powerhouse to
support Chinook salmon and steelhead populations. As part of this commitment, the District
will provide flow releases from the dam and pumped water from the tailrace as much as 320
cubic feet per second (cfs) into Reach 4. To maximize the habitat quantity and quality provided
by the Reach 4 flows, Anchor Environmental, L.L.C.; Chinook Engineering; Watershed
GeoDynamics; and Waterfall Engineering (the Anchor Team) are designing a new habitat
channel that will be created near the right bank (facing downstream) of Reach 4. To direct low
flows into the proposed habitat channel and high flows away from the proposed habitat
channel, the Anchor Team is designing a hydraulic control structure (weir). To provide
additional habitat in the tailrace to meet the District’s relicensing obligations, the Anchor Team
is designing a spawning terrace in the tailrace. The Anchor Team is also designing a canal
system to convey water from a pump station (being designed by CH2M Hill) to the upper
portion of Reach 4. The pump station is adjacent to the tailrace and will pump water from the
tailrace.
This 60 Percent Design Report (Design Report) accompanies the 60 Percent Design Drawings for
the new side channel in Reach 4 of the Chelan River, the hydraulic control structure, the salmon
spawning ground expansion in the tailrace, and the conveyance canal. A separate Design
Memorandum prepared at the outset of the design efforts (Anchor et al. 2007) describes the
restoration objectives and design criteria that are being used to guide the design of the habitat
restoration elements.
This Design Report describes the analysis conducted during the preparation of the 60 Percent
Design to advance the understanding of the site conditions and support the project design.
Many of the analyses are still ongoing and will be completed during the next stages of the
project design. Since the analyses are continuing, this Design Report is a “working document”
that will be refined in content and clarity during the next stages of the project design. All
elevations contained in this document are reported in National Geodetic Vertical Datum of 1929
(NGVD29).

Hydrology
60 Percent Design Report July 2007 Habitat Restoration of the Chelan River Reach 4 and Tailrace 2 040034‐01
2 HYDROLOGY
Flow in the Chelan River Reach 4 is controlled by the operation of the Project. Under past
normal operating conditions, all water stored in Lake Chelan was diverted into the penstocks
and powerhouse and returned to the tailrace, which meets the Chelan River at the downstream
end of Reach 4. Flow was not released into the Chelan River below the dam except during spill
conditions, when the lake level was high and inflow exceeded the turbine capacity. Normal
turbine flows are 2,200 cfs; maximum capacity is approximately 2,300 cfs.
Under the terms of the new license, a minimum of 80 to 320 cfs will be released from the dam,
and additional water will be pumped from the tailrace to meet minimum flow requirements in
Reach 4 (Table 1 and Figure 1).
Table 1
Fish Flows Provided into Reach 4 under New License
Flow Provided By Dry Year Average Year Wet Year 80 cfs spilled July 16 to May 14
80 cfs spilled July 16 to May 14 Dam outlet or spill 80 cfs spilled all months 200 cfs spilled May 15 to
July 15 320 cfs spilled May 15 to July 15
Pumped water from tailrace
Additional 240 cfs pumped March 15 to May 15 and October 15 to November 30
Total of 320 cfs (combined spill plus pumped flow) March 15 to May 15 and October 15 to November 30
Total of 320 cfs (combined spill plus pumped flow) March 15 to May 15 and October 15 to November 30
Source: Lake Chelan Comprehensive Plan, Chapter 7, Table 7‐3 (District 2003)
In addition to the planned releases, spill will also occur under the new license when lake levels
are high and inflow exceeds turbine capacity. In the past, spills occurred occasionally during
winter rain‐on‐snow events and almost every year during spring runoff conditions. Under the
new license, new reservoir operating guidelines will likely result in fewer and lower magnitude
spring spills. However, the exact result of changes under the new license is not known.
Therefore, an analysis of past spills was conducted to provide information on high flow
magnitudes and frequencies.

Hydrology
60 Percent Design Report July 2007 Habitat Restoration of the Chelan River Reach 4 and Tailrace 3 040034‐01
NEW LICENSE - CHELAN RIVER & REACH 4 PUMPED FLOW REGIMES
0
50
100
150
200
250
300
350
Jan Feb Mar April May June July Aug Sept Oct Nov Dec
DATE
FLO
W (C
FS)
Reach 4 Pumped Flow Dam Outlet or Spill Dam Outlet Wet Years Dam Outlet Dry Years
320 cfs March 15 - May 15
Pumped flow regime in Reach 4 and tailrace to
add habitat for spawning of steelhead
320 cfs Oct 15 - Nov 30
Pumped flow regime in Reach 4
and tailrace to add habitat for
spawning of Chinook
80 cfs Year-round Flow
Pumped Pumped
Kayaking 300cfs - 450cfs
2nd and 4th weekends
July and Sept
Dam outlet to establish functional aquatic ecosystem
supportive of native fish in Reach 1 & 2 and to mimic
natural shape of hydrograph320 cfs (wet year)
within 20% exceedance of historical runoff volumes
80 cfs (dry year) within 80% exceedance of
historical runoff volumes
80 cfs Year-round Flow
200 cfs (ave.year)May 15 - July 15within 21% - 79%
of historical runoff volumes
Dam Outlet
Figure 1 Flows in Reach 4 under New License Settlement Agreement
2.1 Methods
Flow records available for the Chelan River downstream of the dam include:
• U.S. Geological Survey (USGS) Gage 12452500 (Chelan River at Chelan, Washington)
- Period of Record – (1903 to 2006) Includes mean daily flow and instantaneous
peak flows (peak flow record began with 2004 water year)
- Remarks – Includes flow through turbines (up to 2,300 cfs), flow through two
irrigation pipes that divert water from the penstocks just above the turbines, and
spill discharge; the hydroelectric project began diverting flows in 1928
• Actual Spill records
- Period of Record – (1974 to 2003) Mean daily flows (not instantaneous peak
flows)
- Remarks – Spill records provided by Public Utility District Number 1 of Chelan
County (the District)

Hydrology
60 Percent Design Report July 2007 Habitat Restoration of the Chelan River Reach 4 and Tailrace 4 040034‐01
2.1.1 Mean Daily Flow Analysis
Actual Spill records were entered into an Excel spreadsheet to calculate monthly flow
exceedance statistics (see Appendix A).
2.1.2 Peak Flow Analysis
Instantaneous peak flow records from the USGS Gage were run through the USGS peak
flow analysis program PKFQWin 5.0 to provide peak flow recurrence statistics (Flynn et
al. 2005). Analyses were run for the following cases:
• USGS Gage, Period of Record (this includes flow through the turbines)
• USGS Gage, 1928 to 2006 (period of project operation; includes flow through
turbines)
• Estimated Spill (i.e., Chelan River flow) – USGS Gage minus 2,200 cfs (the normal
turbine flow), 1928 to 2006 (represents likely spill from dam during peak flow
measurement)
2.2 Results
2.2.1 Mean Daily Flow Analysis
Spill into the Chelan River downstream of the dam occurs most years during the spring
runoff season and occasionally during large fall/winter rain or rain‐on‐snow events. The
10 percent, 25 percent, and 50 percent mean daily reported spill exceedances for each
month were plotted with month on the x‐axis and flow on the y‐axis (Figure 2). Flow
exceedance refers to the percentage of days during each month that a particular flow is
exceeded. For example, a 10 percent flow exceedance of 1,402 cfs during May means
that for a 30‐year analysis period on 10 percent of the days during May, or on average
3 days in May, the mean daily flow was more than 1,402 cfs (conversely, 90 percent of
the days’ flows was less than 1,402 cfs). Flow exceedance values for mean daily
recorded spills shows a monthly 50 percent exceedance value of 200 cfs in June and
544 cfs in July (Figure 2 and Appendix B). Note that this analysis groups all days of each
month together (e.g., all June days for the 30 years of record are treated as a population,
a total of 900 days).

Hydrology
60 Percent Design Report July 2007 Habitat Restoration of the Chelan River Reach 4 and Tailrace 5 040034‐01
0
500
1,000
1,500
2,000
2,500
3,000
3,500
4,000
4,500
5,000
Jan Feb Mar Apr May Jun Jul Aug Sept Oct Nov Dec
Month
Flow
(cfs
)
10%
25%
50%
Figure 2 Historic Chelan River Spill Exceedance – 1974 to 2003
To provide additional detail on the likelihood and magnitude of spill during any given
year, the percent of days over the period of spill records (30 years) that actually had spill
was calculated for each day of the year (Figure 3; daily spill data provided in Appendix
A). This analysis is not grouped by month, but by each day of the year (e.g., the
population for June 1 is the flow on June 1st during each of the 30 years, a total of 30
days). Likelihood of spill is low during the fall, winter, and early spring. On over 10
percent of years, the days between mid‐May and mid‐August had spill. On over 60
percent of the years, days between mid‐June and mid‐July had spill, with median (50
percent exceedance) spill magnitudes between 250 to 1,400 cfs, and an average spill of
1,000 to 2,000 cfs. There was some spill during 26 of the 30 years of spill record.

Hydrology
60 Percent Design Report July 2007 Habitat Restoration of the Chelan River Reach 4 and Tailrace 6 040034‐01
0%
10%
20%
30%
40%
50%
60%
70%
80%
90%
100%
Jan Feb Mar Apr May Jun Jul Aug Sep Oct Nov Dec
Per
cent
of Y
ears
with
Spi
ll on
Thi
s D
ay
0
200
400
600
800
1,000
1,200
1,400
1,600
1,800
2,000
Med
ian
Spi
ll (c
fs)
Percent of Days with Spill Median Spill (cfs) Average Spill (cfs)
Figure 3 Historic Chelan River Days with Average and Median Spill Magnitude – 1974 to 2003
2.2.2 Peak Flow Analysis
Peak instantaneous flows were used to calculate peak flow recurrence intervals
(Table 2). These data were based on the USGS peak instantaneous flow record.
Instantaneous flows are higher than mean daily flows. The estimated with‐project
5‐year spill peak is 10,960 cfs; the 100‐year spill peak is 22,400 cfs. This estimate is based
on subtracting powerhouse flows (2,200 cfs) from each annual peak flow (which
includes spill and powerhouse flow) for the 1928 to 2006 period and computing
recurrence intervals based on this modified flow record (estimated spill column). This
produces different flows than just subtracting 2,200 cfs from the results of the analysis of
reported USGS flows (USGS Gage columns) due to the statistical method the flow
recurrence uses to fit the flow distribution.

Hydrology
60 Percent Design Report July 2007 Habitat Restoration of the Chelan River Reach 4 and Tailrace 7 040034‐01
Table 2 Peak Flow Recurrence
Recurrence Interval (Years)
USGS Gage Period of Record
(1904 to 2006) (cfs)
USGS Gage Period of Project Operation
(1928 to 2006) (cfs) Estimated Spilla
(1928 to 2006) (cfs) 1.5 6,431 6,319 3,949 5 11,530 12,140 10,960 10 13,550 14,600 14,210 25 15,770 17,390 17,900 50 17,200 19,260 20,300 100 18,480 20,960 22,400
Note: a = Estimated Spill is the estimated flow down the Chelan River.
Note that the 100‐year estimated spill peak is higher than the full USGS Gage flow (with
powerhouse flow included) peak. This is the result of the probability distribution
method used to calculate peak flows, and it points out the fact that the absolute
magnitude of longer return interval flows is uncertain. The computed 95 percent
confidence limit on the 100‐year flood is +/‐3,000 to 5,000 cfs. Therefore, there is
statistically no difference between the estimated 100‐year flood among the three flow
scenarios.
The District has suggested that they may be able to control spills to keep them below
approximately 6,000 or 8,000 cfs. Under past spill operations, 6,000 cfs had
approximately a 2‐year peak flow recurrence interval; 8,000 cfs had approximately a
3.1‐year peak flow recurrence interval.

Hydraulic Modeling
60 Percent Design Report July 2007 Habitat Restoration of the Chelan River Reach 4 and Tailrace 8 040034‐01
3 HYDRAULIC MODELING
Hydraulic modeling was conducted to support the design of the proposed habitat channel and
tailrace. This modeling was conducted to investigate the following issues:
1. Verify that no significant increase in flooding or excessive backwater against the
powerhouse occurs in the tailrace reach after construction of the spawning and rearing
terrace in the tailrace and after construction of the proposed habitat channel in Reach 4.
2. Assess flow distributions in Reach 4 between the existing channel and proposed habitat
channel during various flow conditions.
3. Verify that habitat design criteria are satisfied in the proposed habitat channel and the
Tailrace, specifically the minimum hydraulic depth must be 1.0 feet, and target velocities
must be between 1.0 and 2.5 ft/sec in the Reach 4 channel and between 1.0 and 2.0 ft/sec
in the Tailrace. An evaluation of the extent of these conditions will be reported.
4. Provide input to geomorphologic and sediment analysis
3.1 Methods
Hydraulic modeling was conducted using the one‐dimensional flow model HEC‐RAS
Version 4.0 (U.S. Army Corps of Engineers [COE] 2002, 2006). This model was used both in
steady and unsteady mode.
Hydraulic modeling was conducted for two scenarios: existing conditions and proposed
conditions. The existing conditions are based on the topographic survey provided by the
Chelan County PUD. The survey included the tailrace channel, the Chelan River Reach 4
channel, and Chelan River reach downstream of Reach 4 near where it meets the Columbia
River. The proposed conditions include the tailrace channel modified and re‐graded for a
spawning and rearing terrace, Reach 4 channel modified with the proposed habitat channel
and an hydraulic control structure, and the Chelan River reach downstream of Reach 4 that
included limited grade changes.
3.1.1 HEC-RAS Modeling – Existing Conditions
The upstream end of the Chelan River Reach 4 is in the canyon 2,850 feet upstream of
the Tailrace reach. The upstream end of the Tailrace reach is just downstream of the
powerhouse. The downstream end of the model is in the Chelan River Entiat Pool of the
Rocky Reach Forebay, 540 feet downstream of the Reach 4 confluence with the Tailrace.

Hydraulic Modeling
60 Percent Design Report July 2007 Habitat Restoration of the Chelan River Reach 4 and Tailrace 9 040034‐01
The maximum flow modeled entering the Tailrace Reach from the Chelan Powerhouse
is 2,200 cfs. Flows above 2,200 cfs are spilled over Chelan Dam into Reach 1 and are
conveyed into the upstream end of Reach 4 of the model. A portion of the 2200 cfs in the
tailrace consisting of 240 cfs will be pumped from the Tailrace to a receiving pool in
Reach 4 just above the proposed habitat channel at STA 22+00 of the HEC‐RAS
alignment. The HEC‐RAS model assumes no additional flow contributions. The model
does not account for any losses via infiltration or subsurface flow.
For downstream conditions at the Chelan River Entiat Pool, several conditions were
assumed, consistent with previous hydrology data:
• Water surface elevation at 708.2 feet NGVD 29, consistent with low flows and 99
percent exceedance;
• Design water surface elevation at 708.0 feet NGVD29, consistent with average
flows and 50 percent exceedance;
• Water surface elevation at 716.7 feet NGVD29, consistent with the historical
maximum observed elevation.
Model geometry was developed utilizing the Chelan County PUD supplied topography.
Model cross‐sections were placed every 25 feet along Reach 4 and every 25 to 50 feet
along the Tailrace reach. Details on the railroad bridge, downstream of the Tailrace were
obtained using WSDOT plans and specifications. Details of the adjacent highway bridge
were estimated from aerial photos and measured during the field visit. Both bridges
have low chords that are high above the water surface elevations associated with the
highest flows, so only bridge piers interfere with the flow under the bridge. The
highway bridge is located between sections 320 and 350 of the downstream reach; the
width of the four bridge piers were estimated at 8 feet each. The railroad bridge is
located between sections 230 and 260 of the downstream reach; the width of the three
bridge piers were measured to be 10 feet each.
Representative hydraulic roughness was determined based on aerial photography and
photographic documentation, field visits as well as pebble counts throughout the site.
For Reach 4, a hydraulic roughness of 0.040, consistent with an earthen uniform channel
with little vegetation, was used for the main low flow channel, and hydraulic roughness
of 0.05 for floodplain terrace and side overflow channels. For the Tailrace reach and the

Hydraulic Modeling
60 Percent Design Report July 2007 Habitat Restoration of the Chelan River Reach 4 and Tailrace 10 040034‐01
Reach 4 downstream reach, a hydraulic roughness of 0.03 was used for the main river
section, and 0.06 to 0.07 was used for the adjacent floodplain terrace.
Model simulations showed that flow splits from the main channel into the proposed
habitat channel on the right and a high left bank overflow channel downstream of
Section 12+00 of the Reach 4 channel. Flow areas in the left overbank channel and other
high side channels were considered flooded, but ineffective (with zero velocity) during
model simulation. The model simulation focused on the hydraulics in the main channel,
and did not simulate split‐flows in the side channels.
The model was calibrated to the water surface elevations measured during high spill
flows in the Reach 4 channel between April 24 and May 2, 2007. The calibration was
conducted by adjusting Manning roughness to 0.04 in the main channel. Calibration was
not conducted in the Tailrace reach or downstream of the confluence. However, the
Rocky Reach Pool was close to the average water surface elevation of 708.00 feet NGVD
during the monitoring period. Exact representation of hydraulic roughness in Reach 4
was pivotal, as this reach was significantly adjusted during future conditions.
3.1.2 HEC-RAS Modeling – Proposed Conditions
The upstream and downstream boundary conditions were set identical to the boundary
conditions in the existing conditions of the HEC‐RAS model. The existing model
geometry was adjusted in Reach 4 and in the Tailrace Reach to reflect the design for the
proposed habitat channel changes and the construction of the tailrace spawning and
rearing terrace. In Reach 4, the proposed habitat channel will be constructed along the
right bank (looking downstream) of the existing channel of the delta. The channel will be
2,200 feet long and will consist of six pools and six riffles. The riffles will have 2.5
percent design slope and will be moderately V‐shaped to mimic a natural riverbed form.
The pools will have 3.4 to 4.5 – foot depth at the maximum channel design flow of 320
cfs. The proposed habitat channel will be modeled to determine conditions of depth and
velocity when flows are greater than 320 cfs and range up to 500 cfs.

Hydraulic Modeling
60 Percent Design Report July 2007 Habitat Restoration of the Chelan River Reach 4 and Tailrace 11 040034‐01
3.2 Results of Proposed Conditions
Model results for the proposed conditions have been used iteratively for the design process
and are continuing through the final design stages of the project. The results for the tailrace,
proposed habitat channel and hydraulic control structure include velocity and depth values
that are used in design with consideration of meeting criteria for fish and geomorphology
requirements.
3.2.1 Tailrace Spawning and Rearing Terrace
Results indicate that there is a maximum of approximately 0.2 feet of increased water
depth in the tailrace from the existing conditions and the proposed terrace construction.
The terrace will be constructed by filling the tailrace full width approximately 300 lineal
feet upstream of the existing paddlers boat launch and no farther upstream than a line
drawn outward from the restrooms in the park. Excavation of some material will occur
adjacent to the paddlers boat launch to form the terrace at an elevation that is below the
low design elevation of 706 and always covered with water. This will create
approximately 1.5 acres of spawnable gravels with depths and rearing areas that meet
fish production criteria.
The fish criteria goal in this area was to establish a spawning and rearing area in excess
of 1 acre and less than 2 acres that would have depths that range from 2 to 4 feet and
may range up to 7 feet with target velocities of 2fps. Figures 4 and 5 show the resulting
depths and velocity, respectively, along a profile of the tailrace that intersects various
depths.

Hydraulic Modeling
60 Percent Design Report July 2007 Habitat Restoration of the Chelan River Reach 4 and Tailrace 12 040034‐01
600 700 800 900
0
2
4
6
8
Main Channel Distance (ft)
Hyd
r Dep
th (f
t), V
el C
hnl (
ft/s)
Legend
Hydr Depth 320 cfs
Hydr Depth 2000 cfs
Hydr Depth 6000 cfs
Vel Chnl 6000 cfs
Vel Chnl 2000 cfs
Vel Chnl 320 cfs
600 700 800 900
0.5
1.0
1.5
2.0
Main Channel Distance (ft)
Vel
Chn
l (ft/
s)
Legend
Vel Chnl 6000 cfs
Vel Chnl 2000 cfs
Vel Chnl 320 cfs
Figure 4 Proposed Tailrace Spawning Terrace Depths and Velocity at 320, 2000, and 6000 cfs in Proposed Habitat Channel and 2200 cfs flow in powerhouse. (Note: Terrace is located from Main Channel Distance 550 to 850)
Figure 5 Proposed Tailrace Spawning Terrace Velocity at 320, 2000, and 6000 cfs in Proposed Habitat Channel and 2200 cfs flow in powerhouse. (Note: Terrace is located from Main Channel Distance 400 to 850)

Hydraulic Modeling
60 Percent Design Report July 2007 Habitat Restoration of the Chelan River Reach 4 and Tailrace 13 040034‐01
0 500 1000 1500 2000 25000
1
2
3
4
5
6
7
8
Main Channel Distance (ft)
Hyd
r Dep
th (f
t), V
el C
hnl (
ft/s)
Legend
Hydr Depth 320 cfs
Vel Chnl 320 cfs
3.2.2 Proposed Habitat Channel
Results from the model output of the proposed habitat channel show criteria for fish and
geomorphology are met. The area of the channel also meets the required approximate 2‐
acre goal as established. Results show that the depth criteria of 1 to 3 feet (which
includes Chinook criteria of 1 to 3 feet of depth and the steelhead criteria of 1 to 1.7 feet
of depth) are adequate (Figure 6). They also show that the intersection of these depths
with the velocity criteria for Chinook of 1.2 to 2.2 fps and steelhead of 2 to 3.2 fps are met
adequately.
Figure 6 Proposed Habitat Channel Velocity and Depths at 320cfs along the channel centerline
3.2.3 Hydraulic Control Structure
Resultant water velocities across the hydraulic control structure are significant for
upstream fish passage, human safety, and design for high flows. Figure 7 presents
water velocities over a wide range of flows. Results show that during low flows fish
passage opportunity does exist and during extreme high flows velocities are manageable
for scour and erosive forces on the Hydraulic Control Structure. Figure 8 shows the
stage discharge curve for the water surface elevations in the pool above the Hydraulic
Control Structure and at the same position as the outlet structure centerline. This is
shown through a range of flows in Reach 4 from 80 to 22,400 cfs.

Hydraulic Modeling
60 Percent Design Report July 2007 Habitat Restoration of the Chelan River Reach 4 and Tailrace 14 040034‐01
1500 1600 1700 1800 1900 2000 2100
5
10
15
20
Main Channel Distance (ft)
Hyd
r Dep
th (f
t), V
el C
hnl (
ft/s)
Legend
Vel Chnl 22400 cfs
Hydr Depth 22400 cfs
Figure 7 Channel Velocity and Depths at 22,400cfs along the channel centerline and across the Hydraulic Control Structure (100 Year Event)
0 5000 10000 15000 20000 25000718
720
722
724
726
728
730
732
Q Total (cfs)
W.S
. Ele
v (f
t)
Legend
W.S. Elev
Figure 8 Reach 4 stage discharge curve at the location of the outlet structure from 0 to 22,400cfs (100 Year Event) along the channel centerline

Sediment
60 Percent Design Report July 2007 Habitat Restoration of the Chelan River Reach 4 and Tailrace 15 040034‐01
4 SEDIMENT
The Chelan River is comprised of four geomorphic zones based on channel slope (gradient) and
confinement. Figure 9 shows the geomorphic zones and profile of the Chelan River from the
Chelan Dam to its confluence with the Columbia River at the railroad bridge.
600
650
700
750
800
850
900
950
1,000
1,050
1,100
0.00.51.01.52.02.53.03.5
Distance Upstream of Railroad Bridge and Columbia River (river miles)
Elev
atio
n (fe
et)
Chelan Dam
Reach 4(alluvial)
Reach 3 (steep)
Reach 2 (confined)
Reach 1 (unconfined)
Sediment Source Area (valley walls composed of glacial sediments)
Transport Reach (steep/confined)
Deposition Zone
Figure 9 Chelan River Geomorphic Zones and Profile
Reach 1 extends from Chelan Dam downstream for 2.3 miles. This reach is relatively low
gradient (1 percent) and moderately confined by steep slopes of glacial moraine deposits. The
glacial deposits are easily eroded, providing the river with a large source of boulders, cobbles,
gravel, and sand when flows are high enough to erode the valley walls. Reach 2 has a similar
low gradient but is within the upper portion of the narrow bedrock canyon. Reach 3 is the high
gradient portion of the bedrock canyon. This reach is very steep (9 percent) and confined;
sediment supplied from upstream reaches is transported quickly through this reach. Reach 4 is
a very low gradient (0.4 percent), and is a relatively unconfined reach. Because of the extreme

Sediment
60 Percent Design Report July 2007 Habitat Restoration of the Chelan River Reach 4 and Tailrace 16 040034‐01
transition in gradient from Reach 3 to Reach 4, all the boulders, cobbles, gravel, and sand from
upstream reaches are deposited in Reach 4.
The geomorphic setting of Reach 4 is an aggrading delta (i.e., delta is building upward). This
setting presents several challenges to the design of the proposed habitat improvements,
particularly with the goal of making natural, stable, spawning and rearing habitat. River deltas
are not naturally stable systems, but rather they aggrade, and channels often change position
during large storm events. The sediment‐related issues that need to be recognized and
addressed in the design include:
• Likelihood of continued Reach 4 aggradation (the current delta is between 10 to 17 feet
higher than in the mid‐1970s)
• Multiple, shifting channels throughout Reach 4 with shifts occurring during high flow
conditions
• High flows during spill events could transport spawning‐sized substrate out of the
constructed channel improvement reach
To improve the understanding of these issues, the following specific items were identified as
needing additional study during the design process:
• Estimate timing and volume of sediment inputs into Reach 4
• Determine timing and volume of sediment deposition in the pool upstream of the
proposed Reach 4 hydraulic control structure and in the remainder of Reach 4
• Assess stability of substrate placed in the new spawning/rearing channel under high
flow conditions
These items were investigated through a review of historic documentation, modeling using
HEC‐RAS, and field investigations. Following is a description of the methods and findings of
these investigations.
4.1 Identification of Sediment Sources
Through an initial assessment of conditions in the Chelan River, it is apparent that the
primary source of sediment to Reach 4 is from the erosion of banks in Reach 1. As described
at the beginning of Section 4, Reach 1 is moderately confined by steep slopes of
unconsolidated glacial deposits (boulders, cobbles, gravel, and sand) that are easily eroded

Sediment
60 Percent Design Report July 2007 Habitat Restoration of the Chelan River Reach 4 and Tailrace 17 040034‐01
if the river impinges upon them at high flows. Reaches 2 and 3 comprise a narrow bedrock
canyon, which contributes limited or no gravel to the river system. Thus, the identification
of sediment sources focused on Reach 1.
4.1.1 Analysis of Historic Aerial Photographs
4.1.1.1 Methods The location, timing, and extent of terrace and valley wall erosion in Reach 1 was
estimated by comparing bank and channel positions in a series of historic aerial
photographs (Table 3). A subset of these photographs from 1966 to 1990 were the
primary information sources used in this analysis. Table 3 also presents the date and
peak estimated flow for all spill events greater than 12,000 cfs. Spill events of this
magnitude likely cause severe bank erosion of the scale that can be detected in an
analysis of historic aerial photographs.
Channel and bank position were marked on acetate sheets, reduced or enlarged to a
common scale, and overlain on subsequent aerial photographs to determine position
and timing of eroding banks. Average length and width of eroded banks were
measured, and bank heights were estimated from the USGS topographic map to
determine eroded volume.
It was assumed that all sediment eroded from banks was a net input of sediment and
was transported through Reach 1, 2, and 3 and into Reach 4. These are reasonable
assumptions since the eroded banks that were included in the analysis were the high
valley walls composed of glacial deposits or historic river terraces (erosion of
current, low river banks was not counted since bank erosion on the outside of
meander bends is normally offset by deposition on the inside of the meander). The
steep gradient, confined channel, and lack of gravel deposits in Reach 2 and 3 are
consistent with the assumption that sediment eroded from Reach 1 is transported
through Reach 2 and 3 to Reach 4.

Sediment
60 Percent Design Report July 2007 Habitat Restoration of the Chelan River Reach 4 and Tailrace 18 040034‐01
Table 3 Aerial Photographs Used to Investigate Sediment Input from Reach 1
(The dates of all spill events larger than 12,000 cfs are also presented.)
Date Photograph Flight Source 9/20/26 Pre-project survey and boreholes Not applicable District Spill: 5/30/48 – 13,800 cfs
4/27/65 Black and white air photographs 1:3,000 (Reach 1 and 2 only)
CHEL-65 WSDOT (University of Washington Library)
5/23/66 Black and white air photographs 1:24,000 0409 WSDOT
Spill: 6/21/67 – 13,700 cfs Spill: 6/3/68 – 16,200 cfs
7/9/73 Black and white air photographs 1:63,600 CDS-H WSDOT (University of
Washington Library) Spill: 6/22/74 – 12,100 cfs
8/26/78 Color air photographs 1:6,000 CF-78 WSDOT (University of
Washington Library) Spill: 6/3/82 – 16,200 cfs
1986 Black and white orthophotograph 1:24,000 SC-H-86
Washington Department of Natural Resources (University of Washington Library)
9/11/90 Black and white air photographs 1:24,000 CHELAN BL WSDOT
Spill: 11/30/95 – 14,800 cfs Approximately 2002
Color mosaic (photographs are from different flights) Digital District
4.1.1.2 Results Bank erosion rates measured from aerial photographs should be treated as estimates
due to errors associated with the small widths being measured at the scale of the
photographs and the fact that the photographs are not ortho‐rectified. The majority
of bank erosion in Reach 1 occurred in the 0.5‐mile area just upstream of the entrance
to the gorge, between river mile (RM) 1.9 and RM 2.4. Three areas of erosion were
noted in this stretch, with 300 to 400 feet of bank retreat between 1966 and 1990
along much of the bank length. One other very high valley wall (approximately
200 feet high) is also eroding near RM 3.2. However, bank retreat over the period
was not large enough to be measured at the scale of the aerial photographs. It was
assumed that a total of 1 foot of bank retreat occurred along this bank over the
measurement period.
The total estimated volume of sediment erosion in Reach 1 between 1966 and 1990
was 860,000 cubic yards (cy). If it is assumed that this material eroded during peak
flows over 12,000 cfs, an average of 214,000 cy would have eroded during each of the

Sediment
60 Percent Design Report July 2007 Habitat Restoration of the Chelan River Reach 4 and Tailrace 19 040034‐01
four peak flows over 12,000 cfs that occurred during this period. Grain size samples
of valley walls sediments were not taken. However, based on visual observations,
the material consists of a mix of sand, gravel, and cobble material with occasional
boulders.
Several of the eroding banks have been stabilized by placement of riprap during
recent years. This should reduce the frequency and magnitude of erosion in Reach 1
in the future and reduce the amount of sediment transported into Reach 4.
4.1.2 Reach 1 Painted Rock Study
An opportunity to test the level of flow that initiates bank erosion in Reach 1 and
substrate erosion/deposition in Reach 4 (presented in Section 4.3.2) occurred during May
and June 2007. Lake levels and inflows were high enough that spill was required at the
Chelan Dam. A painted rock study was conducted during a series of planned spills to
determine the flow level that resulted in bank erosion in Reach 1. The basic premise of a
painted rock study is to place painted rocks at selected locations in the river’s study area
and to observe whether the rocks are transported away during known flow rates (spill
tests).
4.1.2.1 Methods All unarmored streambank locations in Reach 1 that had shown evidence of past
erosion in the aerial photograph analysis were surveyed and marked. Five banks
(numbers 3 through 7) were selected for monitoring (Figure 10). The banks with
marked rocks were classified as either primarily fine‐grained (Banks 3 and 4) or
coarse‐grained (Banks 5, 6, and 7). The fine‐grained banks had a mantle of
silty/sandy sediment over the underlying glacial deposits. The coarse‐grained banks
had a mantle of cobble/gravel over the underlying glacial deposits.

Sediment
60 Percent Design Report July 2007 Habitat Restoration of the Chelan River Reach 4 and Tailrace 20 040034‐01
Figure 10 Chelan River Reach 1 Streambank Erosion Test Locations

Sediment
60 Percent Design Report July 2007 Habitat Restoration of the Chelan River Reach 4 and Tailrace 21 040034‐01
Along each of the banks, a series of representative‐sized rocks at or just above the
estimated high water level was painted bright orange (Figure 11). Painted rocks
were spaced 10 feet apart in a line along the target elevation. The location of each
marked rock was also surveyed by District personnel using GPS. The length of the
bank painted varied between locations and ranged from 200 feet to 1,800 feet.
A series of six spills were released in May and June 2007 from the Chelan Dam:
• 1,850 cfs
• 3,250 cfs
• 4,780 cfs
• 6,710 cfs
• 8,000 cfs
• 10,000 cfs
The spills were released in increasing order. Between each target spill, flows were
reduced to allow the monitoring locations to be re‐visited to determine if erosion or
gravel movement had taken place. The number of missing rocks at each monitoring
location was noted, and the banks were photographed. In the event a spill washed
away all painted rocks at a monitoring location, then new rocks were painted to
allow further investigation at higher flows. Often the remaining rocks that are
painted after a washout are larger; therefore, only limited comparisons can be made
between flows before and after re‐painting. Re‐painting was necessary at Banks 3
and 4 following the 6,710 cfs spill event and at Bank 7 following the 8,000 cfs spill
event.

Sediment
60 Percent Design Report July 2007 Habitat Restoration of the Chelan River Reach 4 and Tailrace 22 040034‐01
Figure 11 Bank 7 (Reach 1) Marked Rocks Prior to Spill
4.1.2.2 Results The data sheets from the Reach 1 painted rock study are included in Appendix C. In
general, the fine‐grained banks (Banks 3 and 4) had more erosion at lower flows than
the coarse‐grained banks (Banks 5, 6, and 7) (Figures 12, 13, and 14; Table 4).
Orange painted rocks spaced 10 feet apart extend across photo

Sediment
60 Percent Design Report July 2007 Habitat Restoration of the Chelan River Reach 4 and Tailrace 23 040034‐01
Prior to spill During 6,710 cfs spill
Following 8,000 cfs spill Following 10,000 cfs spill
Figure 12 Bank Erosion at Bank 4 (fine-grained bank)
Eroding section of bank

Sediment
60 Percent Design Report July 2007 Habitat Restoration of the Chelan River Reach 4 and Tailrace 24 040034‐01
Prior to spill During 6,710 cfs spill
During 8,000 cfs spill Following 10,000 cfs spill
Figure 13 Bank Erosion at Bank 6 (coarse-grained bank)
Eroding section of bank

Sediment
60 Percent Design Report July 2007 Habitat Restoration of the Chelan River Reach 4 and Tailrace 25 040034‐01
0%
10%
20%
30%
40%
50%
60%
70%
80%
90%
100%
3 4 5 6 7
Bank
Per
cent
of R
ocks
Mis
sing
1,8503,2504,7806,7108,00010,000
re-p
aint
ed re-p
aint
ed
re-p
aint
ed
Flow (cfs)
Figure 14 Summary of Bank Erosion in Reach 1
Table 4
Length of Bank Erosion in Reach 1 During Test Spills
Bank 3 Bank 4 Bank 5 Bank 6 Bank 7 Length of Monitoring Location 200 feet 200 feet 1,800 feet 600 feet 750 feet
Fine-grained or coarse-grained? Fine-grained Fine-grained Coarse-grained Coarse-grained Coarse-grained
1,850 cfs spill 40 feet 0 feet 0 feet 0 feet 0 feet 3,250 cfs spill 60 feet 50 feet 60 feet 10 feet 10 feet 4,780 cfs spill 150 feet 150 feet 60 feet 10 feet 10 feet 6,710 cfs spill 200 feet 180 feet 160 feet 150 feet 130 feet 8,000 cfs spill 0 feeta 50 feeta 350 feet 300 feet 700 feet 10,000 cfs spill 100 feet 150 feet Approx. 600 feet 500 feet 600 feeta Note: a = New paint applied to replace previously washed away rocks
At 1,850 cfs, the lowest flow tested, only Bank 3 showed any signs of erosion (see
Table 4). Painted rocks along 40 feet of the 200‐foot‐long Bank 3 monitoring location
(i.e., 20 percent) had moved at 1,850 cfs. During the 3,250 cfs flow, approximately 25

Sediment
60 Percent Design Report July 2007 Habitat Restoration of the Chelan River Reach 4 and Tailrace 26 040034‐01
to 30 percent of the rocks on Banks 3 and 4 moved following the 3,250 flow, while
only 1 to 3 percent of Banks 5, 6, and 7 eroded. At 4,780 cfs, 75 percent of the painted
rocks had moved from Banks 3 and 4, while no additional erosion was documented
at Banks 5, 6, and 7. Nearly the entire length of Banks 3 and 4 had experienced
erosion following the 6,710 cfs flow, while only 10 to 25 percent of the coarse‐grained
banks had erosion following that flow.
The rocks on Banks 3 and 4 were re‐painted following the 6,710 cfs flow because the
majority of the bank was eroded. The underlying rocks that were painted were
coarser‐grained (cobble/gravel) than the original painted rocks. Limited erosion
occurred along Banks 3 and 4 at the 8,000 flows, but 50 to 75 percent of the banks
eroded during the 10,000 cfs flows. These results suggest that the underlying glacial
deposits on Banks 3 and 4 will begin to erode at flows of approximately 10,000 cfs.
The coarse‐grained Banks (5, 6, and 7) eroded more at flows of 8,000 and 10,000 cfs
than at the lower flows. Bank 5, which has been riprapped, encountered the least
erosion. Bank 6 has also had some riprap work done, which should prevent erosion
from progressing into the bank. However, Bank 6 is actively eroding above the
riprap and the eroded material has covered the riprap. During the high spills, the
eroded material covering the riprap was eroded from the riprap face of Bank 6.
Bank 7 encountered nearly complete erosion of painted rocks during spills of 8,000
and 10,000 cfs.
An estimate of the volume of sediment eroded at different spill levels was made
assuming an eroded height of 5 feet and depth (into the bank) of 2 feet (Table 5).
Note that these volumes were eroded over a relatively short spill length (12 to 24
hours). A larger volume could be eroded if the spill continued for a longer period of
time, particularly the higher magnitude spills (8,000 to 10,000 cfs). This estimate can
be refined if the height and depth of eroded material is measured at each bank.
These measurements are planned to be collected when spill is concluded in early
August.

Sediment
60 Percent Design Report July 2007 Habitat Restoration of the Chelan River Reach 4 and Tailrace 27 040034‐01
The estimated volume of material was summed for each spill event; however, this
sum does not include the material washed away at previous, lower spill events, so it
is not necessarily representative of the total volume that would be eroded during a
spill of that magnitude. The last column in Table 5 shows the cumulative volume
eroded and is more representative of the volume that would be eroded if a spill of
that magnitude occurred without previous spill. As mentioned earlier, these
sediment volumes show the amount eroded during spills of relatively short period
of time; more sediment would presumably be eroded if spills lasted for a longer
period of time, particularly the higher magnitude (8,000 to 10,000 cfs) spills.
Table 5
Estimated Volume (CY) of Sediment Eroded At Different Spill Levels
Bank
Spill Rate 3 4 5 6 7
Total for Spill
Event Cumulative
Total 1,850 cfs 10 0 0 0 0 10 10 3,250 cfs 20 20 20 less than 10 less than 10 70 80 4,780 cfs 60 60 20 less than 10 less than 10 150 230 6,710 cfs 70 70 60 60 50 310 540 8,000 cfs 0a 20a 130 110 260 520 1,060
10,000 cfs 40 60 220 190 220a 730 1,790 Note: a) New paint applied to replace previously washed away rocks.
The majority of the sediment eroded from banks in Reach 1 would likely be
transported through the higher gradient Reaches 2 and 3 and delivered to Reach 4
where the sand, gravel, and larger sediments would be deposited in the pool
upstream of the control weir.
4.2 Sediment Deposition in Reach 4
4.2.1 Review of Historic Sediment Deposition Documentation
4.2.1.1 Methods Timing and volume of sediment deposition in Reach 4 was estimated based on
comparison of historic maps and aerial photographs (see Table 3), observations
made by powerhouse operators, and changes in channel depth measurements
recorded during construction and subsequent inspection of the Chelan Falls Road
Bridge. In the absence of detailed historic topography, a calculation of the volume of

Sediment
60 Percent Design Report July 2007 Habitat Restoration of the Chelan River Reach 4 and Tailrace 28 040034‐01
sediment deposited was estimated based on the assumption that deposition filled in
the average width (500 feet) and length (2,000 feet) of the delta to an average depth.
4.2.1.2 Results Existing surficial sediments in Reach 4 are predominantly boulder and cobble in the
main flow channel, and cobble to boulder in overbank areas. Construction of the fill
for the railroad and road right of way across the mouth of the Chelan River in the
mid‐1970s and the backwater effect of the Rocky Reach Pool in the Columbia River
further exacerbate aggradation in this reach. Observations by the powerhouse
operators suggest the channel has aggraded 8 feet in the past 15 years. This is
consistent with bathymetric measurements made for the Chelan County Public
Works Department on the Chelan Falls Road Bridge (No. 805A), which show
“significant aggradation of the channel, as much as 17 feet between Piers 2 and 3”
between 1975 and 2002 (HPA Engineers 2002). Pre‐project topographic mapping of
Reach 4 is not very detailed but suggests the channel was 10 to 15 feet lower than at
present (map dated Sept. 20, 1926, titled Chelan Station Powerhouse Sites, Location
of Exploration Holes). Comparison of historic oblique photographs during project
construction (1920s) and aerial photographs from 1966, 1973, 1978, 1990, and 2002
also show an aggrading, shifting channel. The long‐term aggradation rates in
Reach 4 are between 0.5 and 0.6 foot per year based on the different sources of data.
However, sediment transport in gravel‐, cobble‐, and boulder‐bedded rivers is not
gradual but occurs episodically during peak flows. Powerhouse operators report
deposition occurs in Reach 4 during flows over about 12,000 cfs. Lower flows are
reported as clear water, with flows between about 4,000 cfs and 12,000 cfs cutting
channels into the deposited sediments. Since the project was constructed in 1928, six
flows over 12,000 cfs have occurred (Table 3).
Based on an average aggradation depth of 10 feet between 1974 and 2000, an
estimated 370,000 cy of sediment accumulated in Reach 4. During this period, three
peak flows over 12,000 cfs occurred. If it is assumed that sediment was transported
primarily during these flow events, an average of 123,000 cy of sediment
(approximately 3 feet of deposition) would have occurred during each of the three
high flows.

Sediment
60 Percent Design Report July 2007 Habitat Restoration of the Chelan River Reach 4 and Tailrace 29 040034‐01
Note that the estimated erosion from Reach 1 was approximately 214,000 cy per
event, and deposition in Reach 4 was approximately 123,000 cy per event. The
difference between these two estimates is due in part to the errors in estimating
sediment volumes and in part to the fact that material eroded in Reach 1 includes a
mix of sand, gravel, cobble, and boulder material, while the sediment deposited in
Reach 4 includes primarily the gravel‐, cobble‐, and boulder‐size fractions with a
smaller percentage of sand. Much of the sand and finer‐grained material eroded
from Reach 1 is transported through Reach 4 and into the Columbia River.
4.2.2 Modeling of Sediment Deposition
4.2.2.1 Methods Outputs of HEC‐RAS modeling were used to estimate sediment deposition in
Reach 4, both upstream and downstream of the proposed hydraulic control
structure. The criteria for determining if sediment that is already moving as bedload
(e.g., moving through Reach 3 and into Reach 4) will continue to be transported or
will settle out on the bed of the river is different from the criteria used to determine
entrainment. Deposition of sediment in the pool upstream of the boulder weir and
in Reach 4 was estimated using the Meyer‐Peter Mueller bedload equation (Meyer‐
Peter and Muller 1948):
Qbj = (39.25 q2/3 S – 9.95 dj)1.5 where Qbj = bedload flux of the j grain size per unit width of river (pound per
second per foot) q = specific water discharge (cfs/foot of channel width) S = water surface gradient dj = diameter of the j grain size (feet)
Sediment in each grain size class was assumed to drop out of transport and deposit
on the bed when the bedload flux of that grain size equaled zero. The HEC‐RAS
output (discharge, width, and gradient) was used to determine the size of sediment
that would drop out of transport at each cross‐section under the different flow
scenarios.

Sediment
60 Percent Design Report July 2007 Habitat Restoration of the Chelan River Reach 4 and Tailrace 30 040034‐01
4.2.3 Reach 4 Grain Size Distribution
4.2.3.1 Methods Subsurface and surface sediment samples were analyzed to characterize the size
distribution of sediments in Chelan River Reach 4. This grain size information is
needed for use in the sediment transport analysis and to determine the suitability of
material for use as substrate for salmon spawning and rearing in the proposed
habitat channel.
Subsurface sediment samples were collected from each of the six pump test pits dug
in January 2007 (see Section 5 and Figure 13). These grab samples were taken from
the subsurface deposits during digging of each of the pits. A 5‐gallon bucket of
sediment was taken from each pit using a shovel. Each bucket was labeled and
transported to a sediment lab for grain size analysis by dry sieving and testing of
Atterberg Limits.
Surface pebble counts were taken at 11 sites in Reach 4. Pebble count sites were
designated based on the stationing marked on the ground by survey stakes1:
• STA 24+00
• STA 21+00
• STA 18+56
• STA 17+00
• STA 15+50
• STA 14+00
• STA 12+00
• STA 10+00
• STA 9+00
• STA 8+00
• STA 4+50
Surface sediment size data were collected using the Wolman pebble count method.
Pebble counts of 100 particles were measured at each site by walking heel to toe in
1 Note that these station numbers are different than those used in the HEC‐RAS model; HEC‐RAS stations are approximately 232 feet higher than corresponding survey locations.

Sediment
60 Percent Design Report July 2007 Habitat Restoration of the Chelan River Reach 4 and Tailrace 31 040034‐01
the sample area and selecting the particle at the toe of the surveyor’s boot. Using a
gravelometer, the diameter of each particle was classified into one of the following
categories:
• less than 2 millimeters (mm)
• 2 to 4 mm
• 4 to 8 mm
• 8 to 16 mm
• 16 to 32 mm
• 32 to 64 mm
• 64 to 128 mm
• 128 to 256 mm
• 256 to 512 mm
• 512 to 1024 mm
A gravelometer is a metal template with square holes corresponding to each of the
noted grain size classes. Data were entered into a spreadsheet for graphing.
4.2.3.2 Results Surface pebble counts and sub‐surface sediment sample data summary sheets with
graphs are provided in Appendix D. Surface pebble count grain size distributions
are summarized in Figure 15. Note that the information in Figure 10 is converted to
grain size in inches. Graphs and data are in mm, the standard unit used for pebble
counts and sieving.
Median particle size of surface layer samples ranged from 77 mm (3 inches) in
diameter near the top of Reach 4 to 12 mm (0.5 inches) in diameter near STA 4+50.
Median particle size of the sub‐surface samples ranged from 15 mm (0.6 inches) to
40 mm (1.5 inches) in diameter. Note that the sub‐surface layers did not include
particles larger than 10 inches due to sampling constraints.

Sediment
60 Percent Design Report July 2007 Habitat Restoration of the Chelan River Reach 4 and Tailrace 32 040034‐01
Note: The station locations described here do not correspond to station locations used in the hydraulic modeling. The hydraulic modeling of the proposed habitat channel design adjusted the station positioning by approximately 232 feet. As a result, STA 4+00 in the test pit analysis corresponds to location 6+32 in the hydraulic modeling analysis.
Figure 15 Surface Sediment Pebble Count Grain Size Distribution
4.3 Transport of Spawning Size Sediment from Reach 4
4.3.1 Modeling of Sediment Entrainment
4.3.1.1 Methods Erosion of substrate in Reach 4 under peak flow conditions was estimated for peak
flows of 4,000; 6,000; 8,000; 11,000; and 14,000 cfs. These peak flows correspond to
flows with a recurrence interval of 1.5, 2, 3.1, 5, and 10 years respectively. The HEC‐
RAS model output was used to determine water depth and shear stress (τ) in the
main channel and left and right overbank at each of the HEC‐RAS stations for each
of the flows. Shear stress at each cross‐section was compared to critical shear stress
(τ*c) for each flow to determine the particle size that could be entrained by the flow.
0%
10%
20%
30%
40%
50%
60%
70%
80%
90%
100%
0.10 1.00 10.00 100.00
Size (in)
2400210018561700155014001000900800450

Sediment
60 Percent Design Report July 2007 Habitat Restoration of the Chelan River Reach 4 and Tailrace 33 040034‐01
The Shields’ Criterion was used to determine the critical shear stress for initiation of
substrate movement:
τ*c = a(γs‐γw)d50 where τ*c = critical Shields stress for mobility of particle size d50
a = constant, 0.039 for this analysis due to type of river and sediment γs and γw are the specific weights of sediment and water, respectively d50 = median particle size at threshold of mobility
4.3.1.2 Results The potential for erosion of substrate placed in the proposed habitat channel was
determined based on Shields’ Criterion and HEC‐RAS hydraulic output at each
cross‐section. Substrate placed in the new spawning/rearing channel is planned to
be gravel‐ and cobble‐sized (0.5 to 6 inches in diameter). In the current Reach 4
setting, substrate larger than approximately 1.5 inches in diameter is calculated to be
stable at all cross‐sections downstream from HEC‐RAS STA 21+00 at flows up to
8,000 cfs, and at most cross‐sections at flows up to 14,000 cfs. When the spawning
channel is constructed, the berm separating it from the main channel of Reach 4 will
further reduce the likelihood of scour of spawning size substrates in the proposed
habitat channel.
4.3.2 Reach 4 Painted Rock Study
4.3.2.1 Methods During the painted rock study of sediment sources in Reach 1 (Section 4.1.2), a
painted rock study was also conducted in Reach 4 to test the flow that caused
erosion or deposition of the existing substrate and rocks representative of the
“fish mix” (0.5‐ to 4‐inch diameter substrate) planned to be placed in the proposed
habitat channel. Painted rocks were also deployed at six monitoring locations in
Reach 4 (Figure 16). At each of these locations, a 3‐ to 4‐foot diameter circle of
yellow was painted on the existing substrate.

Sediment
60 Percent Design Report July 2007 Habitat Restoration of the Chelan River Reach 4 and Tailrace 34 040034‐01
Figure 16 Reach 4 Substrate Erosion Test Locations

Sediment
60 Percent Design Report July 2007 Habitat Restoration of the Chelan River Reach 4 and Tailrace 35 040034‐01
Twelve orange rocks representative of the fish mix size range were placed on top of
the yellow painted substrate in a 3 x 4 grid pattern (Figure 17). Rock spacing along
each row and column of the grid was approximately 1 foot. Each row in the grid
contained a different size rock. The largest rocks were placed at the downstream
end, with incrementally smaller rocks placed in upstream rows. This rock placement
design ensured that the larger orange rocks did not shield the smaller orange rocks
from oncoming flow. Each orange rock was placed in the substrate by removing a
similarly sized existing rock and replacing it with the orange rock to mimic exposure
on the bed of the river.
Figure 17 Gravel Test Site 1 (Reach 4) Prior to Spill (flow from bottom to top)

Sediment
60 Percent Design Report July 2007 Habitat Restoration of the Chelan River Reach 4 and Tailrace 36 040034‐01
As described in Section 4.1.2, painted rock movement was studied during a series of
six spill events from the Chelan Dam: 1,850 cfs; 3,250 cfs; 4,780 cfs; 6,710 cfs; 8,000 cfs;
and 10,000 cfs. Rock movement was assessed following each spill event.
4.3.2.2 Results The painted rock study investigated the substrate sizes that would be entrained by
known spill flow rates in the current configuration of Reach 4. The construction of
the proposed habitat channel and associated berm to keep high flows out of the
channel will reduce the entrainment potential described in this study.
Table 6 lists the median diameter of particles that remain at each of the test locations
following each flow (painted rocks were sized 1 to 2 inches, 2 to 3 inches, and 3 to
4 inches in diameter). All sites were inundated at flows of 3,250 cfs and higher. At
Sites 3 through 6, which were positioned in the proposed habitat channel alignment,
no substrate movement was documented at flows of 4,780 cfs and lower.
At 8,000 cfs, almost all fish mix spawning size substrate would be transported away
in the current Reach 4 configuration.
Table 6
Substrate Size (diameter) Eroded from Reach 4 at Different Spill Levels
Spill Rate Site 1 Site 2 Site 3 Site 4 Site 5 Site 6 1,850 cfs No movement No movement No movement No movement No movement No movement 3,250 cfs No movement No movement No movement No movement No movement No movement
4,780 cfs Smaller than 6 inches
Smaller than 3 inches No movement No movement No movement No movement
6,710 cfs Smaller than 12 inches
Smaller than 8 to 10 inches
Minor movement
Smaller than 2 to 4 inches
Minor movement
Minor movement
8,000 cfs All painted rocks eroded
All painted rocks eroded
Smaller than 3 to 4 inches
Smaller than 3 to 4 inches n/d Smaller than 3
to 4 inches
10,000 cfs All painted rocks eroded
All painted rocks eroded
All painted rocks eroded
Smaller than 4 inches
Smaller than 4 inches
All painted rocks eroded
Note: n/d = No data because the site could not be relocated

Sediment
60 Percent Design Report July 2007 Habitat Restoration of the Chelan River Reach 4 and Tailrace 37 040034‐01
4.4 Conclusions
Based on the sediment erosion and deposition analyses described above, the following
conclusions can be drawn about the proposed habitat channel modifications in Reach 4:
1. Timing and volume of sediment inputs into Reach 4 – In the past, sediment has been
eroded from river banks in Reach 1 and transported into Reach 4 when flow in the
Chelan River is greater than approximately 12,000 cfs. An estimated 370,000 cy of
sediment has accumulated in Reach 4 over the past 30 to 40 years. This
accumulation likely occurred during three peak flow events larger than 12,000 cfs
that have occurred in this time period. Sediment accumulations in Reach 4 should
be at a lower rate in the future as a result of armoring of several of the eroding banks
in Reach 1 and implementing new operating guidelines that will help limit the
magnitude and frequency of spills. Based on the results of the Reach 1 painted rock
study (Section 4.1.2), limiting spill events greater than 10,000 cfs would also reduce
future bank erosion. However, it should be anticipated that some peak flows over
12,000 cfs will occur during the new license period (likely recurrence interval 8 to
10 years) that will result in aggradation and/or channel shifting in Reach 4. Channel
shifting could affect the proposed habitat channel.
2. Timing and volume of sediment deposition in the pool upstream of the hydraulic control
structure – Particles larger than 3 to 4 inches in diameter are calculated to deposit in
the pool during peak flow events large enough to substantially erode streambanks in
Reach 1 (a flow higher than 10,000 cfs; estimated 12,000 cfs based on powerhouse
operator observations).
3. Stability of substrate placed in the new spawning/rearing channel under high flow
conditions – Substrate in the greater than 1‐ to 6‐inch‐size range should be stable
under high flow conditions if the main flow channel remains separate from the
proposed habitat channel. There will likely be winnowing of some particles smaller
than 1 inch in diameter, and local scouring of larger particle sizes. If aggradation or
a large peak flow occurs and the main channel migrates or switches into the
proposed habitat channel, erosion of substrate will occur.

Pump Test
60 Percent Design Report July 2007 Habitat Restoration of the Chelan River Reach 4 and Tailrace 38 040034‐01
5 PUMP TEST
Field and laboratory testing of surface water percolation rates was conducted to evaluate the
ability of the restored channel to hold water at surface.
5.1 Methods
On January 16, 2007, test pits and pumping tests were conducted at the Reach 4 channel.
The weather was cold (10 to 20 degrees Fahrenheit) and the top 16 inches of substrate was
frozen. Six stations distributed throughout Reach 4 were sampled (Figure 18). Station
reference is relative to the original Anchor Environmental, L.L.C. (Anchor), drawing and
channel alignment that was staked in the field by the District2. Station references start with
STA 0+00 at the downstream end of Reach 4 and increase in number reference moving
upstream. Table 7 identifies the tests conducted at each station. Additional tests relevant to
sediments were conducted at each station and are reported in Section 4.
Note: STA 4+00 is not shown.
Figure 18 Test Pit Locations
2 The station locations described for the test pits do not correspond to station locations used in the hydraulic modeling. The hydraulic modeling of the proposed channel design adjusted the station positioning by approximately 232 feet. As a result, STA 4+00 in the test pit analysis corresponds to location 6+32 in the hydraulic modeling analysis.

Pump Test
60 Percent Design Report July 2007 Habitat Restoration of the Chelan River Reach 4 and Tailrace 39 040034‐01
Table 7 Tests Conducted at Each Station
Falling Head Test
Station Field Lab Pump Test STA 4+00 STA 8+00 STA 9+00 STA 12+00 STA 15+50 STA 18+50
Test holes were dug 3 to 5 feet deep with a track mounted excavator. Hole radius at the
bottom ranged from 5 to 7 feet. Water was pumped into the holes from the powerhouse
tailrace to provide a water level. The pump was then shut off and the rate of falling water
recorded. At STA 12+00, a pump test was conducted at a pumping rate of 200 gallons per
minute (gpm).
5.2 Results
Table 8 is a summary of data collected from the falling head tests. Groundwater was not
found in any of the excavation areas. The deepest point of excavation was elevation
704.3 feet at STA 15+50 and 704.7 feet at STA 8+00. Both of these elevations are below the
Chelan River tailrace water surface elevation (WSEL) of 709.1 feet at the time of testing. In a
separate investigation, CH2M Hill reports finding groundwater at one deep excavation
along the flume alignment (CH2M Hill 2007).
Table 8 Summary of Falling Head and Pump Test Data
Hole Volume
Station
Rising Time (min)
Falling Time (min)
Pump Rate
(gpm) Depth
(ft) Radius
(ft) Volume
(cf)
Bottom Elevation
(ft)
Rising Rate
(gpm)
Falling Rate in Field (gpm)
Falling Rate
in Field (in/hr)
Falling Rate
in Lab (in/hr)
STA 4+00 70 STA 8+00 6.7 2.5 5.5 950 704.7 1,114 269 STA 9+00 9.79 2.8 7.1 1,773 706.1 762 253
STA 12+00 6 8 200 2 6.3 997 710.6 1,243 933 93 STA 15+50 12.78 2.72 5.2 924 704.3 584 152 423 STA 18+50 22.37 2.96 6.4 1,523 715.4 334 95
Notes: cf = cubic feet ft = feet in/hr = inches per hour min = minutes

Pump Test
60 Percent Design Report July 2007 Habitat Restoration of the Chelan River Reach 4 and Tailrace 40 040034‐01
Field and laboratory falling head rates ranged from 70 to 423 inches per hour. All field and
laboratory results were within the calculated ranges. This equates to an average loss of
0.0045 feet per second. Graphs of the falling rate for each station evaluated in the field are
shown in Figures 19 through 23. Photographs of each station showing representative
examples of the substrate are also shown in Photographs 1 through 10.
The STA 12+00 pump test included a measurement of a static water elevation at a pumping
rate of 200 gpm in a flow area of 79.1 square feet (sf). An apparent velocity was calculated at
1.6 feet per minute.
5.3 Discussion
The tests were performed within the ranges of the proposed habitat channel and represent a
good cross‐section of the channel profile. Based on observations of the substrate, results of
the falling head tests, and the one static pump test performed, it is apparent Reach 4 of the
Chelan River has a very high potential to percolate water into the surrounding floodplain.
Not only was groundwater not present (even at levels below the Chelan River tailrace
WSEL), but the sediment size and poorly graded gravel with sand appear to extend deep
down into the floodplain.
Applying the average flow rate of 0.0045 feet per second over the proposed channel length
of 1,800 feet and 60 feet wide, potential water loss equals 484 cfs. Powers (1992) developed
empirical relationships between groundwater seepage in floodplains relative to spawning
channels and measured a reduction factor to account for uncertainties in applying a small
test area result to a full channel length. Data showed total groundwater flows were actually
5 to 15 percent of the predicted values. Applying these empirical relationships to the Chelan
Reach 4 site, one would expect a water loss in the range of 25 to 75 cfs. The loss would
likely be less over time as the Reach 4 area receives continuous flow. Losses in the range of
25 cfs or less would not likely reduce the effective operation of the channel. Given the
potential error in estimating the losses, additional monitoring is recommended to measure
downstream flow reduction during an 80 cfs flow release.

Pump Test
60 Percent Design Report July 2007 Habitat Restoration of the Chelan River Reach 4 and Tailrace 41 040034‐01
STA 8+00 Falling Head TestRate = 269 inches/hr
707.0
708.0
709.0
710.0
0 120 240 360 480
Time (seconds)
WSE
L
Figure 19 STA 8+00 Falling Head Test
STA 9+00 Falling Head TestRate = 253 inches/hr
705.0
706.0
707.0
708.0
709.0
710.0
0 120 240 360 480 600
Time (seconds)
WSE
L
Figure 20 STA 9+00 Falling Head Test

Pump Test
60 Percent Design Report July 2007 Habitat Restoration of the Chelan River Reach 4 and Tailrace 42 040034‐01
STA 12+00 Pump TestFalling Rate = 93 in/hr
710.0
711.0
712.0
713.0
0 120 240 360 480 600 720 840 960
Time (seconds)
WSE
L
Figure 21 STA 12+00 Pump and Falling Head Test
STA 15+50 Falling Head TestRate = 152 inches/hour
706.0
707.0
708.0
709.0
710.0
0 120 240 360 480 600 720 840
Time (seconds)
WS
EL
Figure 22 STA 15+50 Falling Head Test

Pump Test
60 Percent Design Report July 2007 Habitat Restoration of the Chelan River Reach 4 and Tailrace 43 040034‐01
STA 18+50 Falling Head TestRate = 95 inches/hr
715.0
716.0
717.0
718.0
719.0
0 120 240 360 480 600 720 840 960 1080 1200 1320 1440
Time (seconds)
WSE
L
Figure 23 STA 18+50 Falling Head Test

Pump Test
60 Percent Design Report July 2007 Habitat Restoration of the Chelan River Reach 4 and Tailrace 44 040034‐01
Photograph 1 – STA 8+00 Falling Head Test
Photograph 2 – STA 8+00 Staff Gage
Photograph 3 – STA 9+00 Test Hole
Photograph 4 – STA 9+00 Substrate
Photograph 5 – STA 12+00 Test Hole

Pump Test
60 Percent Design Report July 2007 Habitat Restoration of the Chelan River Reach 4 and Tailrace 45 040034‐01
Photograph 7 – STA 15+50 Charging Test Hole
Photograph 8 – STA 15+50 Substrate
Photograph 9 – STA 18+50 Charging Test Hole
Photograph 10 – STA 18+50 Falling Head Test

Geotechnical Analysis of Hydraulic Control Structure
60 Percent Design Report July 2007 Habitat Restoration of the Chelan River Reach 4 and Tailrace 46 040034‐01
6 GEOTECHNICAL ANALYSIS OF HYDRAULIC CONTROL STRUCTURE
The hydraulic control structure will consist of a concrete core surrounded by grouted boulders.
Quarry rock will be placed on top of the grouted boulders in order to grade the structure to the
desired slope. Upstream of the hydraulic control structure, native river cobbles will be the
predominant substrate.
A geotechnical analysis of the structure will be performed to evaluate the following factors:
• Bearing capacity of the native subgrade to support the structure
• Sliding stability of the structure under the service loads
• Overturning stability
• Uplift forces resulting from hydraulic pressure differences across the structure
• Potential settlement of the structure
• Seepage through and beneath the hydraulic control structure
The results of the geotechnical analyses will be used to determine the stability of the structure
and to evaluate any changes that may be necessary to meet performance requirements. The
structure will be evaluated under both static and seismic conditions, with the design earthquake
assuming a 100‐year return interval. The target factor of safety for static stability will be 1.5,
and the target seismic factor of safety will be 1.1.
The limit equilibrium software Slide 5.0 will be used to evaluate bearing capacity and sliding
stability. The groundwater module of Slide 5.0 will be used to evaluate seepage and uplift
pressures. Settlement and overturning will be evaluated using standard geotechnical
engineering computation methods.

References
60 Percent Design Report July 2007 Habitat Restoration of the Chelan River Reach 4 and Tailrace 47 040034‐01
7 REFERENCES
Anchor Environmental, L.L.C. (Anchor); Chinook Engineering; Watershed GeoDynamics. 2007.
Design Memorandum: Habitat Restoration of the Chelan River Reach 4 and Tailrace. Prepared
for Public Utility District Number 1 of Chelan County. March 2007.
CH2M Hill. 2007. Draft Geotechnical Data Report for the Chelan Tailrace Pump Station. Prepared
for the Public Utility District Number 1 of Chelan County. March 2007.
Corps – See U.S. Army Corps of Engineers
Flynn, K.M., Kirby, W., and Hummel, P.R. 2005. Userʹs manual for program PeakFQ, annual
flood frequency analysis using Bulletin 17B guidelines: U.S. Geological Survey
Techniques and Methods Report 05‐xxxx. Draft Report. Program downloaded from
http://water.usgs.gov/software/peakfq.html.
HPA Engineers. 2002. Letter report prepared by HPA Engineers. December 2002.
Meyer‐Peter, E. and R. Muller. 1948. Formulas for bedload transportation. Proc. Second
Meeting Int. Assoc. Hydraulic Res. Stockholm, pp. 39‐64.
Powers, P.D. 1992. Draft in Progress. Hydraulics of groundwater fed spawning channels and rearing
ponds. Washington Department of Fish and Wildlife Habitat Program. Olympia,
Washington.
Public Utility District Number 1 of Chelan County (District). 2003. Lake Chelan Comprehensive
Plan. Attachment B to the Lake Chelan Settlement Agreement. Lake Chelan
Hydroelectric Project. FERC Project No. 637. October 8, 2003.
U.S. Army Corps of Engineers (Corps). 2002. Hydrologic Engineering Center. HEC‐RAS –
River Analysis System Hydraulic Reference Manual. November 2002.
U.S. Army Corps of Engineers (Corps). 2006. Hydrologic Engineering Center. HEC‐RAS –
River Analysis System User’s Manual. Version 4.0 – Beta. November 2006.

APPENDIX A
CHELAN_SPILL_HYDROLOGY.XLS (Excel file with daily and peak flow values and analyses)

Chelan River Spill Exceedence 1974-2003
0
500
1,000
1,500
2,000
2,500
3,000
3,500
4,000
4,500
5,000
Jan Feb Mar Apr May Jun Jul Aug Sept Oct Nov Dec
Month
Flow
(cfs
)
10%
25%
50%

Timing and Magnitude of Chelan River Spill (1974-2003)
0%
10%
20%
30%
40%
50%
60%
70%
80%
90%
100%
Jan Feb Mar Apr May Jun Jul Aug Sep Oct Nov Dec
Perc
ent o
f Yea
rs w
ith S
pill
on T
his
Day
0
200
400
600
800
1,000
1,200
1,400
1,600
1,800
2,000
Med
ian
Spill
(cfs
)
Percent of Days with Spill Median Spill (cfs)

Chelan River Spill
0
2,000
4,000
6,000
8,000
10,000
12,000
14,000
16,000
18,00019
28
1931
1934
1937
1940
1943
1946
1949
1952
1955
1958
1961
1964
1967
1970
1973
1976
1979
1982
1985
1988
1991
1994
1997
2000
2003
Year
Spill
(cfs
)

APPENDIX B
MONTHLY FLOW EXCEEDANCE VALUES

Appendix B
60 Percent Design Report July 2007 Habitat Restoration of the Chelan River Reach 4 and Tailrace B‐1 040034‐01
Monthly Flow Exceedance Values Based on mean daily “Actual Spill” flows provided by the District for 1974 to 2003
Percent
Exceedance (%)
Jan (cfs)
Feb (cfs)
Mar (cfs)
Apr (cfs)
May (cfs)
Jun (cfs)
Jul (cfs)
Aug (cfs)
Sept (cfs)
Oct (cfs)
Nov (cfs)
Dec (cfs)
0 0 2,000 33 2,400 6,754 12,763 9,896 6,821 1,200 3,750 14,633 10,700
2 0 1,364 0 900 3,500 8,118 6,117 2,544 200 0 0 0
4 0 100 0 0 2,799 6,992 5,000 1,545 25 0 0 0
6 0 0 0 0 2,400 6,076 4,482 1,100 0 0 0 0
8 0 0 0 0 1,954 5,642 3,999 799 0 0 0 0
10 0 0 0 0 1,402 4,902 3,642 400 0 0 0 0
12 0 0 0 0 686 4,026 3,455 240 0 0 0 0
14 0 0 0 0 0 3,751 3,097 200 0 0 0 0
16 0 0 0 0 0 3,303 2,879 141 0 0 0 0
18 0 0 0 0 0 3,034 2,584 100 0 0 0 0
20 0 0 0 0 0 2,805 2,309 46 0 0 0 0
22 0 0 0 0 0 2,482 2,094 0 0 0 0 0
24 0 0 0 0 0 2,149 2,000 0 0 0 0 0
25 0 0 0 0 0 2,035 1,998 0 0 0 0 0
26 0 0 0 0 0 2,000 1,863 0 0 0 0 0
28 0 0 0 0 0 1,789 1,683 0 0 0 0 0
30 0 0 0 0 0 1,566 1,526 0 0 0 0 0
32 0 0 0 0 0 1,303 1,400 0 0 0 0 0
34 0 0 0 0 0 1,100 1,250 0 0 0 0 0
36 0 0 0 0 0 1,000 1,100 0 0 0 0 0
38 0 0 0 0 0 900 1,071 0 0 0 0 0
40 0 0 0 0 0 653 1,000 0 0 0 0 0
42 0 0 0 0 0 400 898 0 0 0 0 0
44 0 0 0 0 0 378 800 0 0 0 0 0
46 0 0 0 0 0 300 786 0 0 0 0 0
48 0 0 0 0 0 200 683 0 0 0 0 0
50 0 0 0 0 0 200 544 0 0 0 0 0
52 0 0 0 0 0 30 400 0 0 0 0 0
54 0 0 0 0 0 0 400 0 0 0 0 0
56 0 0 0 0 0 0 333 0 0 0 0 0
58 0 0 0 0 0 0 210 0 0 0 0 0
60 0 0 0 0 0 0 200 0 0 0 0 0
62 0 0 0 0 0 0 200 0 0 0 0 0
64 0 0 0 0 0 0 124 0 0 0 0 0
66 to 100 0 0 0 0 0 0 0 0 0 0 0 0

APPENDIX C
REACH 1 PAINTED ROCK STUDY DATA SHEETS

Appendix C
60 Percent Design Report July 2007 Habitat Restoration of the Chelan River Reach 4 and Tailrace C‐1 040034‐01
(attach I:\Projects\Chelan PUD\Bypass and Tailrace Channel Restoration\60 Percent Design\60 Percent Design Report pdf file: Completed Data Sheets for Painted Rock Study)

APPENDIX D
REACH 4 GRAIN SIZE DATA SHEETS

Appendix D
60 Percent Design Report July 2007 Habitat Restoration of the Chelan River Reach 4 and Tailrace D‐1 040034‐01
SURFACE SEDIMENT SIZE DATA FROM PEBBLE COUNTS Station A - Sta 24+00
D65= 115.2 mmArmor Layer Armor Layer D50= 76.8 mm
Size (mm) Size (in) Percent Cum % Avg size No.1 0.04 0% 0% 0.00 02 0.08 0% 0% 0.00 04 0.16 1% 1% 0.06 18 0.31 0% 1% 0.00 0
16 0.63 8% 9% 1.92 832 1.26 15% 24% 7.20 1564 2.52 21% 45% 20.16 21
128 5.04 25% 70% 48.00 25256 10.08 30% 100% 38.40 30
Dg 115.74 mm 1000.3797 ft
Station B - Sta 21+00
D65= 104.2 mmArmor Layer Armor Layer D50= 76.8 mm
Size (mm) Size (in) Percent Cum % Avg size No.1 0.04 0% 0% 0.00 02 0.08 0% 0% 0.00 04 0.16 1% 1% 0.06 18 0.31 3% 4% 0.36 3
16 0.63 7% 11% 1.68 732 1.26 11% 22% 5.28 1164 2.52 21% 43% 20.16 21
128 5.04 35% 78% 67.20 35256 10.08 22% 100% 28.16 22
Dg 122.90 mm 1000.4032 ft
Station C - Sta 18+560; Anchor pit
D65= 58.5 mmArmor Layer Armor Layer D50= 44.8 mm
Size (mm) Size (in) Percent Cum % Avg size No.1 0.04 0% 0% 0.00 02 0.08 2% 2% 0.06 24 0.16 1% 3% 0.06 18 0.31 5% 8% 0.60 5
16 0.63 7% 15% 1.68 732 1.26 21% 36% 10.08 2164 2.52 35% 71% 33.60 35
128 5.04 27% 98% 51.84 27256 10.08 2% 100% 2.56 2
Dg 100.48 mm 1000.3297 ft
A - Sta 24+00
0%10%20%30%40%50%60%70%80%90%
100%
0.1 1 10 100 1000
Size (mm)
Perc
ent P
assi
ng
Armor Layer
B - Sta 21+00
0%10%20%30%40%50%60%70%80%90%
100%
0.1 1 10 100 1000
Size (mm)
Perc
ent P
assi
ng
Armor Layer
C - Sta 18+560; Anchor pit
0%10%20%30%40%50%60%70%80%90%
100%
0.1 1 10 100 1000
Size (mm)
Perc
ent P
assi
ng
Armor Layer
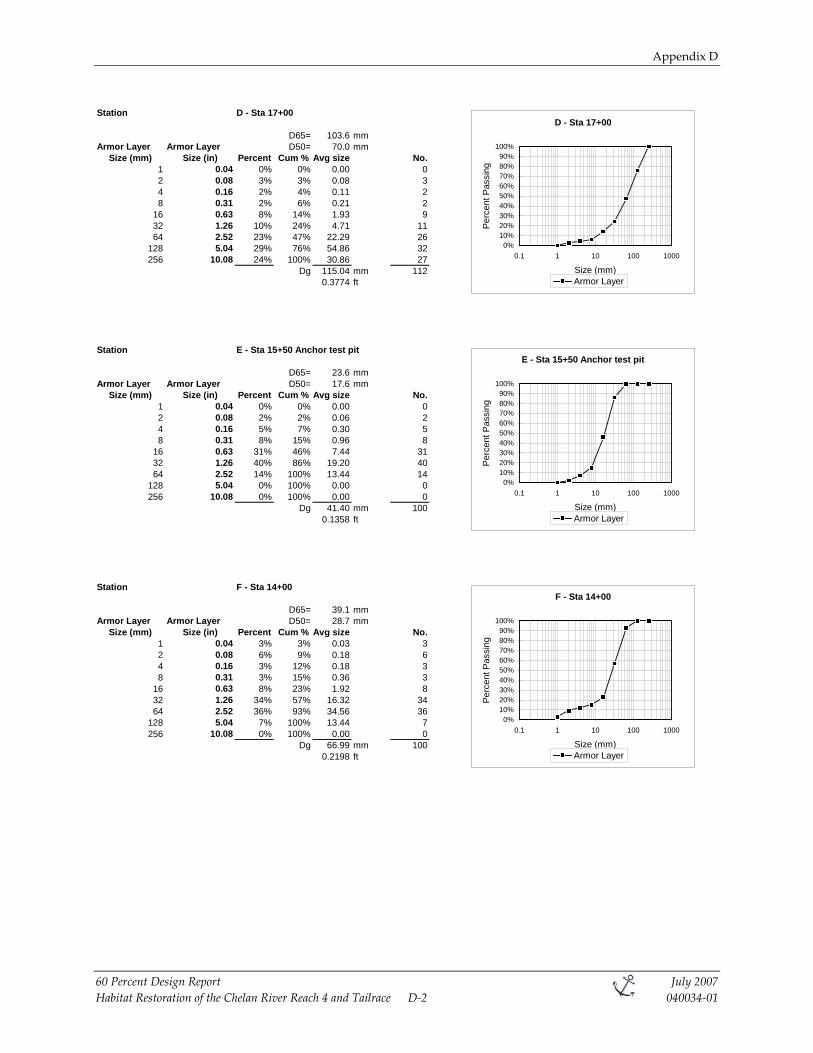
Appendix D
60 Percent Design Report July 2007 Habitat Restoration of the Chelan River Reach 4 and Tailrace D‐2 040034‐01
Station D - Sta 17+00
D65= 103.6 mmArmor Layer Armor Layer D50= 70.0 mm
Size (mm) Size (in) Percent Cum % Avg size No.1 0.04 0% 0% 0.00 02 0.08 3% 3% 0.08 34 0.16 2% 4% 0.11 28 0.31 2% 6% 0.21 2
16 0.63 8% 14% 1.93 932 1.26 10% 24% 4.71 1164 2.52 23% 47% 22.29 26
128 5.04 29% 76% 54.86 32256 10.08 24% 100% 30.86 27
Dg 115.04 mm 1120.3774 ft
Station E - Sta 15+50 Anchor test pit
D65= 23.6 mmArmor Layer Armor Layer D50= 17.6 mm
Size (mm) Size (in) Percent Cum % Avg size No.1 0.04 0% 0% 0.00 02 0.08 2% 2% 0.06 24 0.16 5% 7% 0.30 58 0.31 8% 15% 0.96 8
16 0.63 31% 46% 7.44 3132 1.26 40% 86% 19.20 4064 2.52 14% 100% 13.44 14
128 5.04 0% 100% 0.00 0256 10.08 0% 100% 0.00 0
Dg 41.40 mm 1000.1358 ft
Station F - Sta 14+00
D65= 39.1 mmArmor Layer Armor Layer D50= 28.7 mm
Size (mm) Size (in) Percent Cum % Avg size No.1 0.04 3% 3% 0.03 32 0.08 6% 9% 0.18 64 0.16 3% 12% 0.18 38 0.31 3% 15% 0.36 3
16 0.63 8% 23% 1.92 832 1.26 34% 57% 16.32 3464 2.52 36% 93% 34.56 36
128 5.04 7% 100% 13.44 7256 10.08 0% 100% 0.00 0
Dg 66.99 mm 1000.2198 ft
D - Sta 17+00
0%10%20%30%40%50%60%70%80%90%
100%
0.1 1 10 100 1000
Size (mm)
Perc
ent P
assi
ng
Armor Layer
E - Sta 15+50 Anchor test pit
0%10%20%30%40%50%60%70%80%90%
100%
0.1 1 10 100 1000
Size (mm)
Perc
ent P
assi
ng
Armor Layer
F - Sta 14+00
0%10%20%30%40%50%60%70%80%90%
100%
0.1 1 10 100 1000
Size (mm)
Perc
ent P
assi
ng
Armor Layer

Appendix D
60 Percent Design Report July 2007 Habitat Restoration of the Chelan River Reach 4 and Tailrace D‐3 040034‐01
Station G Sta 12+00 Anchor pit
D65= 27.5 mmArmor Layer Armor Layer D50= 22.7 mm
Size (mm) Size (in) Percent Cum % Avg size No.1 0.04 1% 1% 0.01 12 0.08 7% 8% 0.21 74 0.16 2% 10% 0.12 28 0.31 5% 15% 0.60 5
16 0.63 14% 29% 3.36 1432 1.26 50% 79% 24.00 5064 2.52 20% 99% 19.20 20
128 5.04 1% 100% 1.92 1256 10.08 0% 100% 0.00 0
Dg 49.42 mm 1000.1621 ft
Station H Sta 10+00
D65= 55.4 mmArmor Layer Armor Layer D50= 42.4 mm
Size (mm) Size (in) Percent Cum % Avg size No.1 0.04 0% 0% 0.00 02 0.08 0% 0% 0.00 04 0.16 1% 1% 0.06 18 0.31 1% 2% 0.12 1
16 0.63 8% 10% 1.92 832 1.26 28% 38% 13.44 2864 2.52 37% 75% 35.52 37
128 5.04 23% 98% 44.16 23256 10.08 2% 100% 2.56 2
Dg 97.78 mm 1000.3208 ft
G Sta 12+00 Anchor pit
0%10%20%30%40%50%60%70%80%90%
100%
0.1 1 10 100 1000
Size (mm)
Per
cent
Pas
sing
Armor Layer
H Sta 10+00
0%10%20%30%40%50%60%70%80%90%
100%
0.1 1 10 100 1000
Size (mm)
Perc
ent P
assi
ng
Armor Layer
Station J - Sta 9+00; bar on Powerhouse side
D65= 24.7 mmArmor Layer Armor Layer D50= 15.5 mm
Size (mm) Size (in) Percent Cum % Avg size No.1 0.04 0% 0% 0.00 02 0.08 8% 8% 0.24 84 0.16 4% 12% 0.24 48 0.31 9% 21% 1.08 9
16 0.63 31% 52% 7.44 3132 1.26 24% 76% 11.52 2464 2.52 17% 93% 16.32 17
128 5.04 7% 100% 13.44 7256 10.08 0% 100% 0.00 0
Dg 50.28 mm 1000.1650 ft
J - Sta 9+00; bar on Powerhouse side
0%
20%
40%
60%
80%
100%
0.1 1 10 100 1000
Size (mm)
Perc
ent P
assi
ng
Armor Layer

Appendix D
60 Percent Design Report July 2007 Habitat Restoration of the Chelan River Reach 4 and Tailrace D‐4 040034‐01
Station I - Sta 8+00 Anchor pit
D65= 31.6 mmArmor Layer Armor Layer D50= 25.1 mm
Size (mm) Size (in) Percent Cum % Avg size No.1 0.04 0% 0% 0.00 02 0.08 2% 2% 0.06 24 0.16 1% 3% 0.06 18 0.31 9% 12% 1.08 9
16 0.63 17% 29% 4.08 1732 1.26 37% 66% 17.76 3764 2.52 30% 96% 28.80 30
128 5.04 4% 100% 7.68 4256 10.08 0% 100% 0.00 0
Dg 59.52 mm 1000.1953 ft
I - Sta 8+00 Anchor pit
0%10%20%30%40%50%60%70%80%90%
100%
0.1 1 10 100 1000
Size (mm)
Perc
ent P
assi
ng
Armor Layer
Station K - Sta 4+50; bar on Powerhouse side
D65= 17.8 mmArmor Layer Armor Layer D50= 12.8 mm
Size (mm) Size (in) Percent Cum % Avg size No.1 0.04 0% 0% 0.00 02 0.08 2% 2% 0.06 24 0.16 5% 6% 0.28 58 0.31 27% 33% 3.22 29
16 0.63 28% 61% 6.67 3032 1.26 35% 96% 16.89 3864 2.52 4% 100% 3.56 4
128 5.04 0% 100% 0.00 0256 10.08 0% 100% 0.00 0
Dg 30.67 mm 1080.1006 ft
K - Sta 4+50; bar on Powerhouse side
0%
20%
40%
60%
80%
100%
0.1 1 10 100 1000
Size (mm)
Per
cent
Pas
sing
Armor Layer

Appendix D
60 Percent Design Report July 2007 Habitat Restoration of the Chelan River Reach 4 and Tailrace D‐5 040034‐01
SUB-SURFACE SEDIMENT SIZE DATA FROM DRY SIEVE ANALYSIS

Appendix D
60 Percent Design Report July 2007 Habitat Restoration of the Chelan River Reach 4 and Tailrace D‐6 040034‐01

Appendix D
60 Percent Design Report July 2007 Habitat Restoration of the Chelan River Reach 4 and Tailrace D‐7 040034‐01

Appendix D
60 Percent Design Report July 2007 Habitat Restoration of the Chelan River Reach 4 and Tailrace D‐8 040034‐01

Appendix D
60 Percent Design Report July 2007 Habitat Restoration of the Chelan River Reach 4 and Tailrace D‐9 040034‐01

Appendix D
60 Percent Design Report July 2007 Habitat Restoration of the Chelan River Reach 4 and Tailrace D‐10 040034‐01