habitat and landscape characteristics …millerlab.nres.illinois.edu/pdfs/habitat and...
TRANSCRIPT
Ecological Applications, 18(5), 2008, pp. 1107–1118� 2008 by the Ecological Society of America
HABITAT AND LANDSCAPE CHARACTERISTICS UNDERLYING ANURANCOMMUNITY STRUCTURE ALONG AN URBAN–RURAL GRADIENT
FINN C. PILLSBURY1,3
AND JAMES R. MILLER2
1Department of Natural Resource Ecology and Management, 339 Science II, Iowa State University, Ames, Iowa 50011 USA2Department of Natural Resource Ecology and Management and Department of Landscape Architecture, Iowa State University,
Ames, Iowa 50011 USA
Abstract. Urbanization has been cited as an important factor in worldwide amphibiandeclines, and although recent work has illustrated the important influence of broad-scaleecological patterns and processes on amphibian populations, little is known about the factorsstructuring amphibian communities in urban landscapes. We therefore examined amphibiancommunity responses to wetland habitat availability and landscape characteristics along anurban–rural gradient in central Iowa, USA, a region experiencing rapid suburban growth. Weconducted call surveys at 61 wetlands to estimate anuran calling activity, and quantified wetlandhabitat structure and landscape context. We used canonical correspondence analysis (CCA) toexamine patterns in anuran community structure and identify the most important variablesassociated with those patterns. Urban density at the landscape scale had a significant negativeinfluence on overall anuran abundance and diversity.While every species exhibited a decrease inabundance with increasing urban density, this pattern was especially pronounced for speciesrequiring post-breeding upland habitats. Anurans most affected by urbanization were thoseassociated with short hydroperiods, early breeding activity, and substantial upland habitat use.We suggest that broad-scale landscape fragmentation is an important factor underlying anurancommunity structure in this region, possibly due to limitations on the accessibility of otherwisesuitable habitat in fragmented urban landscapes. This study underscores the importance of aregional approach to amphibian conservation in urban and urbanizing areas; in fragmentedlandscapes, a network of interconnected wetland and upland habitats may be more likely tosupport a successful, diverse anuran community than will isolated sites.
Key words: amphibian; anuran; canonical correspondence analysis; community structure; connectivity;fragmentation; landscape; ordination; spatial scale; upland; urbanization; wetland.
INTRODUCTION
Urbanization is the primary cause of species endan-
germent in the contiguous United States (Czech et al.
2000) and has been shown to be a substantial
component of amphibian population declines (Houla-
han et al. 2000, Stuart et al. 2004). The effect of
urbanization on pond-breeding anurans may be espe-
cially acute because many species require different
breeding, nonbreeding, and hibernation habitats during
their life cycle (Pope et al. 2000, Semlitsch and Bodie
2003, Cushman 2006). Urban development can therefore
have a deleterious effect on anuran populations at
multiple spatial scales. They are not only susceptible to
the impairment of water quality and surface hydrology
that tend to accompany urbanization (Pechmann et al.
1989, Vershinin and Tereshin 1999, Babbitt and Tanner
2000), but also to broad-scale landscape alteration and
the resulting habitat fragmentation and loss of connec-
tivity (Lehtinen et al. 1999, Houlahan and Findlay 2003,
Rothermel 2004).
The loss of habitat connectivity that results from
increased urbanization may also limit anurans’ use of
remnant habitat. Amphibians have demonstrated sensi-
tivity to habitat contiguity and the presence of dispersal
barriers (Hager 1998, Vos and Chardon 1998, Semlitsch
and Bodie 2003, Trenham and Shaffer 2005), and
Rothermel (2004) suggests that even small barriers can
prevent successful juvenile emigration, due to the fine
scale of landscape perception by amphibians. This
underscores the challenges posed by urban landscapes,
which are defined by a high degree of fragmentation,
and thus, a high incidence of barriers to dispersal
(McKinney 2002, 2006). It is possible, then, that
urbanization limits the availability of anuran habitat in
the landscape; otherwise suitable habitat embedded in
an uninhabitable matrix is functionally unavailable to
dispersing juveniles and migrating adults.
Fragmented urban landscapes likely restrict dispersal
and migration, putting populations already subject to
frequent localized extinction and colonization events at
risk of extinction (Hecnar and M’Closkey 1996, Skelly
et al. 1999, Marsh 2001, Marsh and Trenham 2001).
Because anurans live only a few years at most (Lannoo
1998), the ability of juveniles to disperse readily through
the matrix among breeding sites is critical to a
Manuscript received 15 November 2007; accepted 23January 2008. Corresponding Editor: R. A. Relyea.
3 E-mail: [email protected]
1107
population’s long-term survival (Stevens et al. 2004,
Rothermel and Semlitsch 2002, Rothermel 2004).
The persistence of anuran populations in urban
landscapes, therefore, may be influenced by a comple-
ment of factors at different spatial scales from individual
breeding sites to entire landscapes. This idea is
supported by recent literature from a variety of
ecosystems across several continents (e.g., Pellet et al.
2004a, b, Drinnan 2005, Rubbo and Kiesecker 2005).
Although individual species’ responses to urban wetland
habitat and landscape context have been investigated,
studies examining the patterns of anuran community
structure in urban landscapes are notably absent from
the literature.
Recent studies have described factors driving com-
munity structure in urban areas for other taxa using a
variety of multivariate statistics, although these analyt-
ical tools have not yet been applied to anuran
communities (e.g., Germaine and Wakeling 2001,
Hennings and Edge 2003, Miller et al. 2003, 2004,
Hogsden and Hutchinson 2004). The most common
statistical approach in the amphibian literature is logistic
regression, assessing the influence of urbanization on the
presence of individual species. Community-level analy-
ses are generally limited to using multiple regression to
look at factors influencing species richness. The strength
of a multivariate approach is in its ability to provide
insight into the relative importance of factors at multiple
scales, while simultaneously evaluating the response of
all species in the community to those factors. This is
notably different from univariate methods, which allow
only indirect inference about community-level patterns.
Using a combination of univariate and multivariate
methods, we examined the influence of wetland habitat
availability and landscape context on anuran communi-
ty structure along an urban–rural gradient in central
Iowa, USA. We chose a gradient approach, rather than
a categorical classification of land use (e.g., ‘‘urban’’ vs.
‘‘rural’’), because it has the advantage of being able to
quantify continuous differences in community structure
in relation to landscape context, as well as critical
thresholds in that relationship (McDonnell and Pickett
1990, Gibbs 1998, Miller et al. 2001, Homan et al. 2004,
Drinnan 2005, Denoel and Ficetola 2007).
METHODS
Description of study area
Central Iowa is primarily dominated by row crop
agriculture, but .50% of its population now lives in
urban or suburban areas; sprawl has emerged as a major
concern for the area surrounding the city of Des Moines
(Office of Social and Economic Trend Analysis, Iowa
State University, available online).4 Historically, this
region comprised tallgrass prairie and wooded riparian
corridors, with temporary depressional wetlands and
oxbow lakes serving as the primary habitat for breeding
anurans. As a result of human settlement, fewer than
10% of Iowa’s wetlands and 0.01% of its prairies remain
intact (Dahl 1990, Sampson and Knopf 1994). Anuran
breeding habitat in central Iowa is now limited to farm
ponds, subdivision impoundments, and urban lakes, as
well as rural roadside ditches and some remnant and
restored prairie potholes.
With the exception of the bullfrog (Rana catesbeiana),
populations of all native anurans in Iowa have been
declining for at least the last half-century because of
increased rates of habitat fragmentation and loss
(Christiansen 1981, 1998, Lannoo et al. 1994). Of
greatest conservation concern in central Iowa is the
cricket frog (Acris crepitans), which has already experi-
enced severe declines in the northern portion of its range
(Hay 1998, Lannoo 1998). Iowa now marks the species’
northernmost extent (Kane et al. 2004).
Study site selection
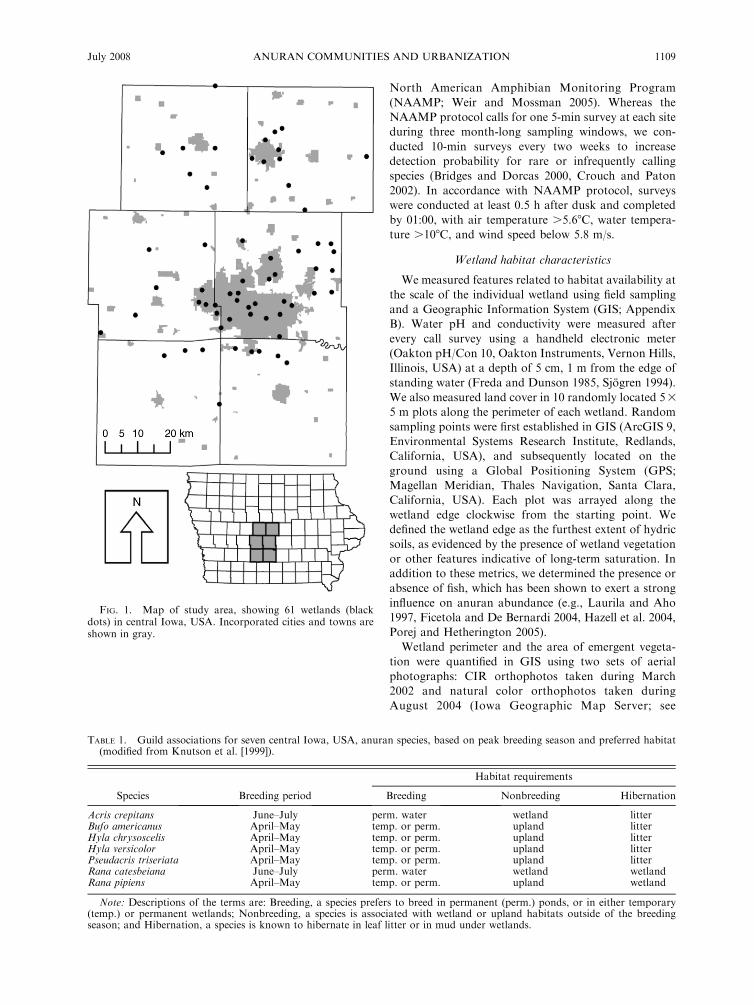
We selected 61 remnant, restored, and constructed
wetlands throughout central Iowa for inclusion in this
study (Fig. 1). Study sites encompassed a gradient of
land use from rural areas to the urban core, and were
located on both private and public land (Appendix A).
Potential sites were identified on color-infrared (CIR)
digital orthophotos produced in 2002 (Iowa Geographic
Map Server, available online).5 Final site selection was
based on two criteria. First, sites had to be at least 2 km
apart to ensure independence in landscape analyses.
Second, sites were restricted to semi-permanent or
permanent ponds, containing at least 50% open water.
Urban wetlands tend to be of this type and inclusion of
temporary wetlands or those dominated by emergent
vegetation would reduce our ability to detect differences
owing to landscape context. Selected sites were ground-
truthed and evaluated for adherence to said criteria.
Call surveys
We conducted a series of call surveys from March
through July 2005, to coincide with the breeding seasons
of all Iowa anurans (Table 1). Call surveys provide a
measure of abundance that can be compared among
sites, and offer an efficient means for collecting data
over a broad spatial extent. We used an anuran call
index as follows: 0, no individuals of a given species
heard; 1, one individual heard; 2, multiple individuals
with no overlap in calls; 3, full chorus (Hemesath 1998,
Mossman et al. 1998).
Sites were organized geographically into nine routes
to expedite call surveys. We visited all sites on a given
route during the same evening, although the order was
changed between visits to minimize the confounding
influence of time of day. We employed a modified
version of the sampling protocol developed for the
4 hhttp://www.seta.iastate.edui 5 hhttp://ortho.gis.iastate.edui
FINN C. PILLSBURY AND JAMES R. MILLER1108 Ecological ApplicationsVol. 18, No. 5
North American Amphibian Monitoring Program
(NAAMP; Weir and Mossman 2005). Whereas the
NAAMP protocol calls for one 5-min survey at each site
during three month-long sampling windows, we con-
ducted 10-min surveys every two weeks to increase
detection probability for rare or infrequently calling
species (Bridges and Dorcas 2000, Crouch and Paton
2002). In accordance with NAAMP protocol, surveys
were conducted at least 0.5 h after dusk and completed
by 01:00, with air temperature .5.68C, water tempera-
ture .108C, and wind speed below 5.8 m/s.
Wetland habitat characteristics
We measured features related to habitat availability at
the scale of the individual wetland using field sampling
and a Geographic Information System (GIS; Appendix
B). Water pH and conductivity were measured after
every call survey using a handheld electronic meter
(Oakton pH/Con 10, Oakton Instruments, Vernon Hills,
Illinois, USA) at a depth of 5 cm, 1 m from the edge of
standing water (Freda and Dunson 1985, Sjogren 1994).
We also measured land cover in 10 randomly located 53
5 m plots along the perimeter of each wetland. Random
sampling points were first established in GIS (ArcGIS 9,
Environmental Systems Research Institute, Redlands,
California, USA), and subsequently located on the
ground using a Global Positioning System (GPS;
Magellan Meridian, Thales Navigation, Santa Clara,
California, USA). Each plot was arrayed along the
wetland edge clockwise from the starting point. We
defined the wetland edge as the furthest extent of hydric
soils, as evidenced by the presence of wetland vegetation
or other features indicative of long-term saturation. In
addition to these metrics, we determined the presence or
absence of fish, which has been shown to exert a strong
influence on anuran abundance (e.g., Laurila and Aho
1997, Ficetola and De Bernardi 2004, Hazell et al. 2004,
Porej and Hetherington 2005).
Wetland perimeter and the area of emergent vegeta-
tion were quantified in GIS using two sets of aerial
photographs: CIR orthophotos taken during March
2002 and natural color orthophotos taken during
August 2004 (Iowa Geographic Map Server; see
FIG. 1. Map of study area, showing 61 wetlands (blackdots) in central Iowa, USA. Incorporated cities and towns areshown in gray.
TABLE 1. Guild associations for seven central Iowa, USA, anuran species, based on peak breeding season and preferred habitat(modified from Knutson et al. [1999]).
Species Breeding period
Habitat requirements
Breeding Nonbreeding Hibernation
Acris crepitans June–July perm. water wetland litterBufo americanus April–May temp. or perm. upland litterHyla chrysoscelis April–May temp. or perm. upland litterHyla versicolor April–May temp. or perm. upland litterPseudacris triseriata April–May temp. or perm. upland litterRana catesbeiana June–July perm. water wetland wetlandRana pipiens April–May temp. or perm. upland wetland
Note: Descriptions of the terms are: Breeding, a species prefers to breed in permanent (perm.) ponds, or in either temporary(temp.) or permanent wetlands; Nonbreeding, a species is associated with wetland or upland habitats outside of the breedingseason; and Hibernation, a species is known to hibernate in leaf litter or in mud under wetlands.
July 2008 1109ANURAN COMMUNITIES AND URBANIZATION
footnote 5). Using these images from early spring and
late summer allowed us to measure more accurately the
temporal variation in spatial extent of saturation and
wetland vegetation.
Landscape composition and configuration
We quantified landscape composition and configura-
tion by digitizing land cover within 1 km of the wetland
perimeter using natural color and CIR orthophotos
(Appendix B). This distance is greater than the home
range any of Iowa’s anuran species, but smaller than the
estimated dispersal distance of the two farthest traveling
native species, R. catesbeiana and R. pipiens, offering a
spatial extent encompassing landscape features relevant
to both migration and dispersal (Knutson et al. 1999,
Weir et al. 2005).
Univariate data analyses
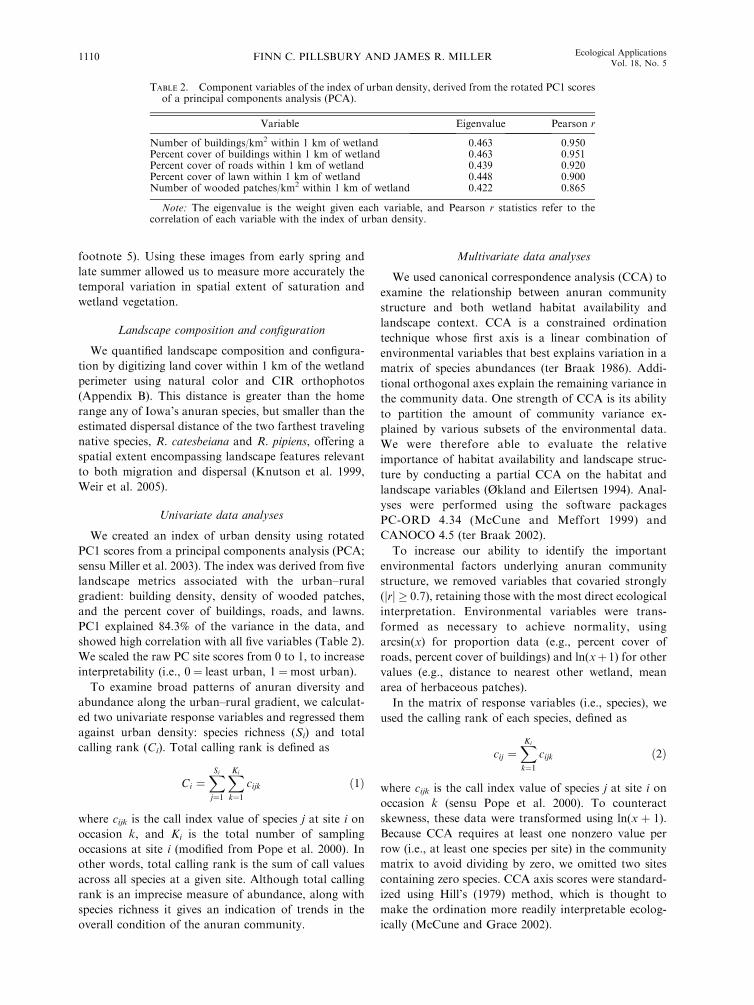
We created an index of urban density using rotated
PC1 scores from a principal components analysis (PCA;
sensu Miller et al. 2003). The index was derived from five
landscape metrics associated with the urban–rural
gradient: building density, density of wooded patches,
and the percent cover of buildings, roads, and lawns.
PC1 explained 84.3% of the variance in the data, and
showed high correlation with all five variables (Table 2).
We scaled the raw PC site scores from 0 to 1, to increase
interpretability (i.e., 0 ¼ least urban, 1 ¼most urban).
To examine broad patterns of anuran diversity and
abundance along the urban–rural gradient, we calculat-
ed two univariate response variables and regressed them
against urban density: species richness (Si) and total
calling rank (Ci). Total calling rank is defined as
Ci ¼XSi
j¼1
XKi
k¼1
cijk ð1Þ
where cijk is the call index value of species j at site i on
occasion k, and Ki is the total number of sampling
occasions at site i (modified from Pope et al. 2000). In
other words, total calling rank is the sum of call values
across all species at a given site. Although total calling
rank is an imprecise measure of abundance, along with
species richness it gives an indication of trends in the
overall condition of the anuran community.
Multivariate data analyses
We used canonical correspondence analysis (CCA) to
examine the relationship between anuran community
structure and both wetland habitat availability and
landscape context. CCA is a constrained ordination
technique whose first axis is a linear combination of
environmental variables that best explains variation in a
matrix of species abundances (ter Braak 1986). Addi-
tional orthogonal axes explain the remaining variance in
the community data. One strength of CCA is its ability
to partition the amount of community variance ex-
plained by various subsets of the environmental data.
We were therefore able to evaluate the relative
importance of habitat availability and landscape struc-
ture by conducting a partial CCA on the habitat and
landscape variables (Økland and Eilertsen 1994). Anal-
yses were performed using the software packages
PC-ORD 4.34 (McCune and Meffort 1999) and
CANOCO 4.5 (ter Braak 2002).
To increase our ability to identify the important
environmental factors underlying anuran community
structure, we removed variables that covaried strongly
(jrj � 0.7), retaining those with the most direct ecological
interpretation. Environmental variables were trans-
formed as necessary to achieve normality, using
arcsin(x) for proportion data (e.g., percent cover of
roads, percent cover of buildings) and ln(xþ 1) for other
values (e.g., distance to nearest other wetland, mean
area of herbaceous patches).
In the matrix of response variables (i.e., species), we
used the calling rank of each species, defined as
cij ¼XKi
k¼1
cijk ð2Þ
where cijk is the call index value of species j at site i on
occasion k (sensu Pope et al. 2000). To counteract
skewness, these data were transformed using ln(x þ 1).
Because CCA requires at least one nonzero value per
row (i.e., at least one species per site) in the community
matrix to avoid dividing by zero, we omitted two sites
containing zero species. CCA axis scores were standard-
ized using Hill’s (1979) method, which is thought to
make the ordination more readily interpretable ecolog-
ically (McCune and Grace 2002).
TABLE 2. Component variables of the index of urban density, derived from the rotated PC1 scoresof a principal components analysis (PCA).
Variable Eigenvalue Pearson r
Number of buildings/km2 within 1 km of wetland 0.463 0.950Percent cover of buildings within 1 km of wetland 0.463 0.951Percent cover of roads within 1 km of wetland 0.439 0.920Percent cover of lawn within 1 km of wetland 0.448 0.900Number of wooded patches/km2 within 1 km of wetland 0.422 0.865
Note: The eigenvalue is the weight given each variable, and Pearson r statistics refer to thecorrelation of each variable with the index of urban density.
FINN C. PILLSBURY AND JAMES R. MILLER1110 Ecological ApplicationsVol. 18, No. 5
In addition to quantifying species responses to the
underlying environmental gradients, we identified poten-
tial mechanisms driving similar responses among differ-
ent species. Species were organized into guilds based on
life history traits to explore distributional patterns
among species with similar breeding, nonbreeding, and
hibernation habitat requirements. This approach gave
insight into whether observed patterns of distribution
were more likely explained by breeding season resource
needs, summer upland habitat use, or overwintering
success. While this was a qualitative approach, it allowed
us to identify specific biological explanations for
observed species distributions. We used the guilds
defined by Knutson et al. (1999), because that study
had a high degree of geographic overlap with our own.
RESULTS
Call surveys
We conducted call surveys on 58 nights, for a total of
339 site visits. Most sites were visited on six occasions,
but some were visited only five times due to weather. To
account for bias in our estimates, five visits to each site
were chosen randomly and only data from those visits
were included in analysis.
A total of nine species were observed, encompassing
all but one species native to central Iowa: the cricket
frog (Acris crepitans), American toad (Bufo americanus),
Cope’s and Eastern gray treefrogs (Hyla chrysoscelis and
H. versicolor), chorus frog (Pseudacris triseriata),
northern and Plains leopard frogs (Rana pipiens and
R. blairi), and bullfrog (R. catesbeiana). Though the
study area was within its recorded range, the green frog
(R. clamitans) is very rare in central Iowa (Christiansen
and Bailey 1991) and was not detected. The study area
marks the range boundary for two species recorded, P.
crucifer and the R. blairi. We omitted these species from
all analyses because we felt their rarity was more
attributable to range extent than any measured envi-
ronmental variables.
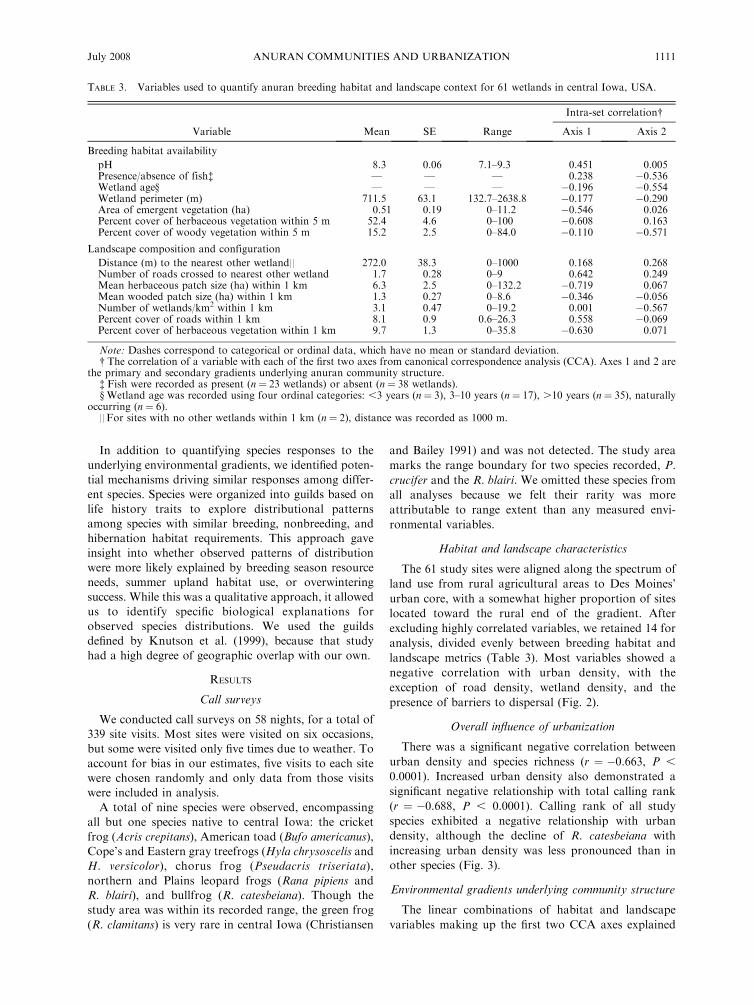
Habitat and landscape characteristics
The 61 study sites were aligned along the spectrum of
land use from rural agricultural areas to Des Moines’
urban core, with a somewhat higher proportion of sites
located toward the rural end of the gradient. After
excluding highly correlated variables, we retained 14 for
analysis, divided evenly between breeding habitat and
landscape metrics (Table 3). Most variables showed a
negative correlation with urban density, with the
exception of road density, wetland density, and the
presence of barriers to dispersal (Fig. 2).
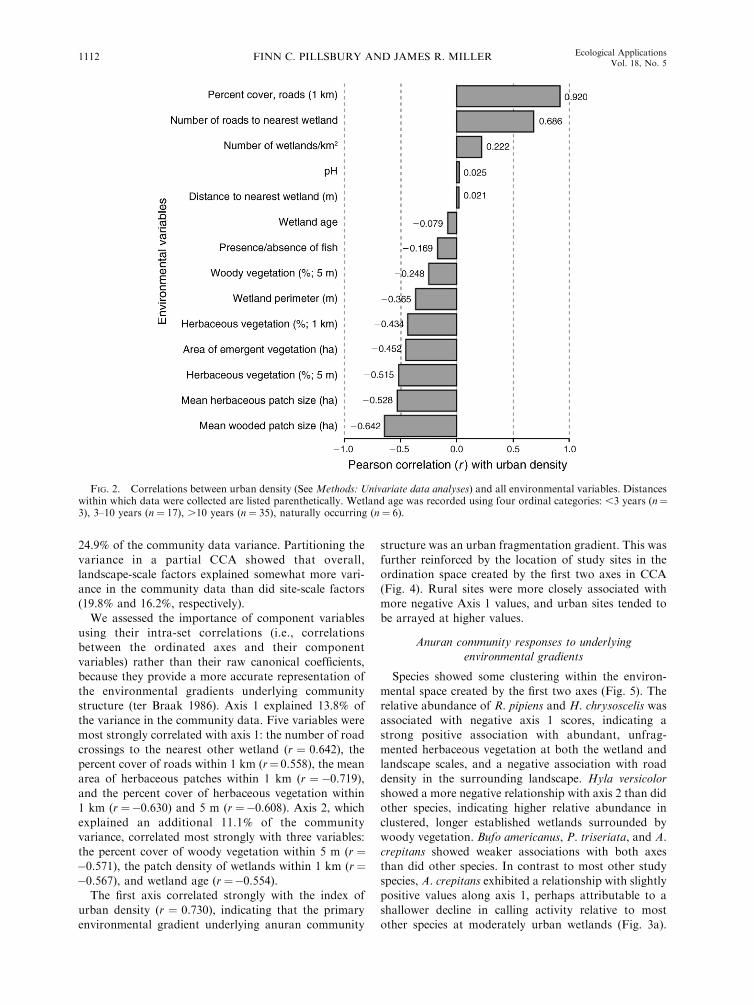
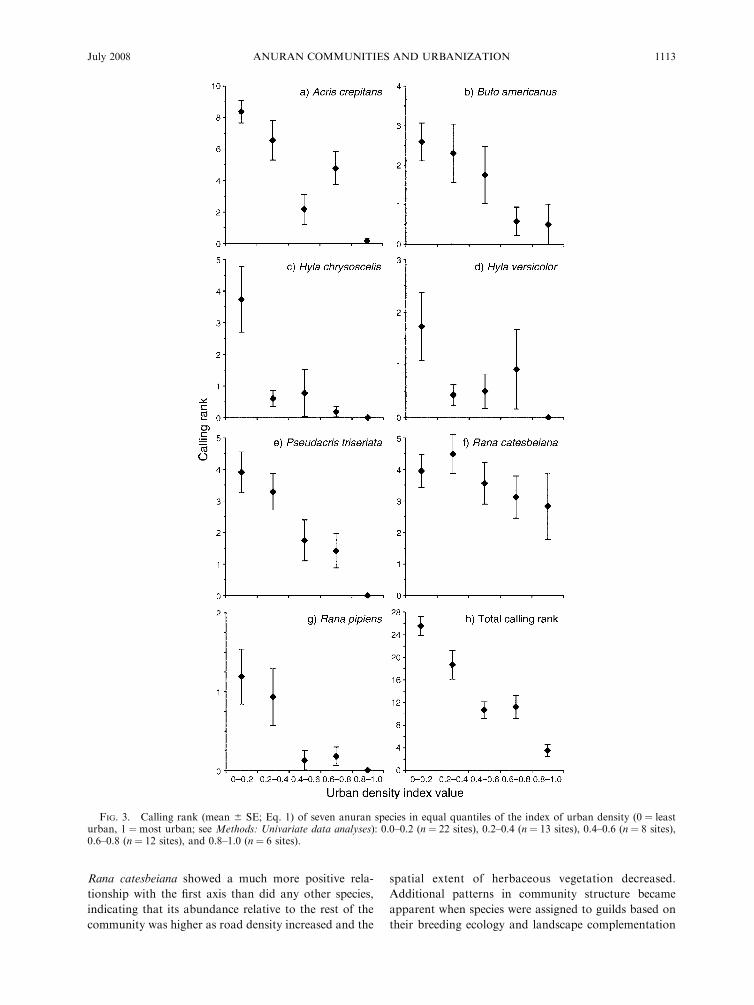
Overall influence of urbanization
There was a significant negative correlation between
urban density and species richness (r ¼ �0.663, P ,
0.0001). Increased urban density also demonstrated a
significant negative relationship with total calling rank
(r ¼ �0.688, P , 0.0001). Calling rank of all study
species exhibited a negative relationship with urban
density, although the decline of R. catesbeiana with
increasing urban density was less pronounced than in
other species (Fig. 3).
Environmental gradients underlying community structure
The linear combinations of habitat and landscape
variables making up the first two CCA axes explained
TABLE 3. Variables used to quantify anuran breeding habitat and landscape context for 61 wetlands in central Iowa, USA.
Variable Mean SE Range
Intra-set correlation�
Axis 1 Axis 2
Breeding habitat availability
pH 8.3 0.06 7.1–9.3 0.451 0.005Presence/absence of fish� — — — 0.238 �0.536Wetland age§ — — — �0.196 �0.554Wetland perimeter (m) 711.5 63.1 132.7–2638.8 �0.177 �0.290Area of emergent vegetation (ha) 0.51 0.19 0–11.2 �0.546 0.026Percent cover of herbaceous vegetation within 5 m 52.4 4.6 0–100 �0.608 0.163Percent cover of woody vegetation within 5 m 15.2 2.5 0–84.0 �0.110 �0.571
Landscape composition and configuration
Distance (m) to the nearest other wetland|| 272.0 38.3 0–1000 0.168 0.268Number of roads crossed to nearest other wetland 1.7 0.28 0–9 0.642 0.249Mean herbaceous patch size (ha) within 1 km 6.3 2.5 0–132.2 �0.719 0.067Mean wooded patch size (ha) within 1 km 1.3 0.27 0–8.6 �0.346 �0.056Number of wetlands/km2 within 1 km 3.1 0.47 0–19.2 0.001 �0.567Percent cover of roads within 1 km 8.1 0.9 0.6–26.3 0.558 �0.069Percent cover of herbaceous vegetation within 1 km 9.7 1.3 0–35.8 �0.630 0.071
Note: Dashes correspond to categorical or ordinal data, which have no mean or standard deviation.� The correlation of a variable with each of the first two axes from canonical correspondence analysis (CCA). Axes 1 and 2 are
the primary and secondary gradients underlying anuran community structure.� Fish were recorded as present (n ¼ 23 wetlands) or absent (n ¼ 38 wetlands).§ Wetland age was recorded using four ordinal categories: ,3 years (n¼ 3), 3–10 years (n¼ 17), .10 years (n¼ 35), naturally
occurring (n ¼ 6).||For sites with no other wetlands within 1 km (n ¼ 2), distance was recorded as 1000 m.
July 2008 1111ANURAN COMMUNITIES AND URBANIZATION
24.9% of the community data variance. Partitioning the
variance in a partial CCA showed that overall,landscape-scale factors explained somewhat more vari-
ance in the community data than did site-scale factors(19.8% and 16.2%, respectively).
We assessed the importance of component variables
using their intra-set correlations (i.e., correlationsbetween the ordinated axes and their component
variables) rather than their raw canonical coefficients,because they provide a more accurate representation of
the environmental gradients underlying communitystructure (ter Braak 1986). Axis 1 explained 13.8% of
the variance in the community data. Five variables weremost strongly correlated with axis 1: the number of road
crossings to the nearest other wetland (r ¼ 0.642), thepercent cover of roads within 1 km (r¼ 0.558), the mean
area of herbaceous patches within 1 km (r ¼ �0.719),and the percent cover of herbaceous vegetation within1 km (r ¼�0.630) and 5 m (r ¼�0.608). Axis 2, which
explained an additional 11.1% of the communityvariance, correlated most strongly with three variables:
the percent cover of woody vegetation within 5 m (r ¼�0.571), the patch density of wetlands within 1 km (r¼�0.567), and wetland age (r ¼�0.554).
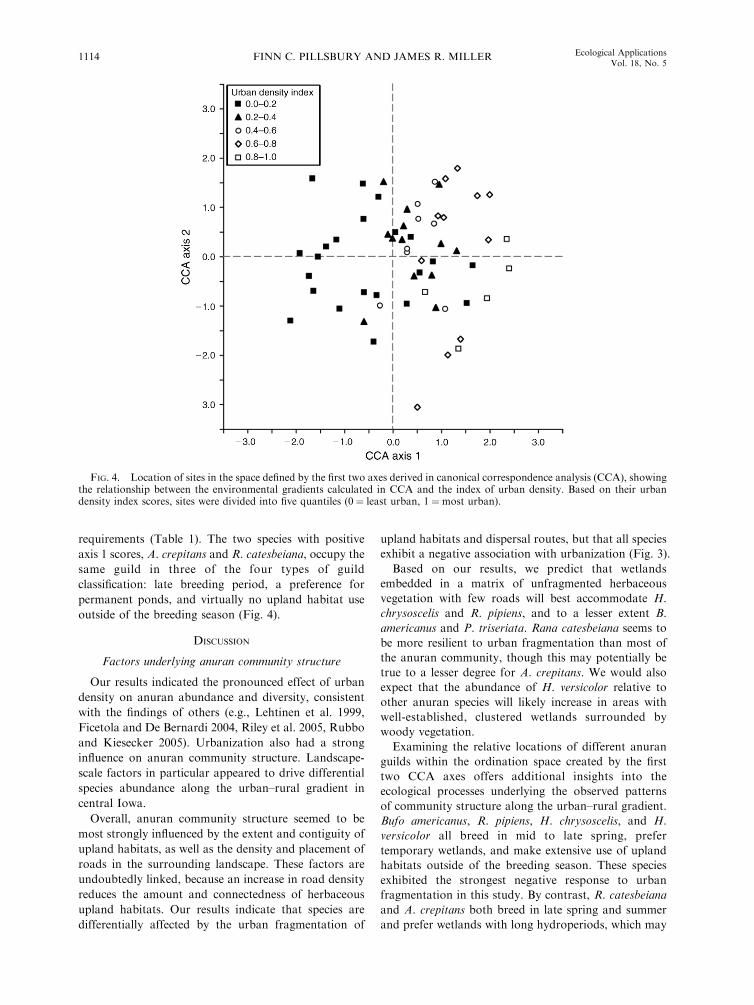
The first axis correlated strongly with the index of
urban density (r ¼ 0.730), indicating that the primary
environmental gradient underlying anuran community
structure was an urban fragmentation gradient. This was
further reinforced by the location of study sites in theordination space created by the first two axes in CCA
(Fig. 4). Rural sites were more closely associated withmore negative Axis 1 values, and urban sites tended to
be arrayed at higher values.
Anuran community responses to underlyingenvironmental gradients
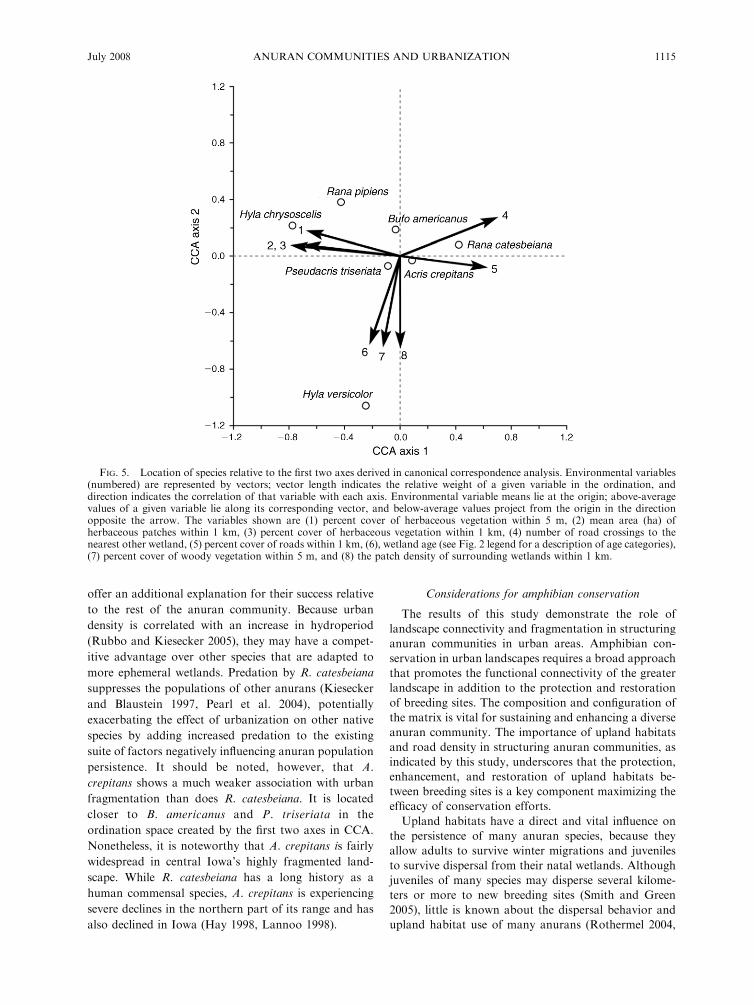
Species showed some clustering within the environ-
mental space created by the first two axes (Fig. 5). Therelative abundance of R. pipiens and H. chrysoscelis was
associated with negative axis 1 scores, indicating astrong positive association with abundant, unfrag-
mented herbaceous vegetation at both the wetland andlandscape scales, and a negative association with road
density in the surrounding landscape. Hyla versicolor
showed a more negative relationship with axis 2 than didother species, indicating higher relative abundance in
clustered, longer established wetlands surrounded bywoody vegetation. Bufo americanus, P. triseriata, and A.
crepitans showed weaker associations with both axesthan did other species. In contrast to most other study
species, A. crepitans exhibited a relationship with slightlypositive values along axis 1, perhaps attributable to a
shallower decline in calling activity relative to most
other species at moderately urban wetlands (Fig. 3a).
FIG. 2. Correlations between urban density (See Methods: Univariate data analyses) and all environmental variables. Distanceswithin which data were collected are listed parenthetically. Wetland age was recorded using four ordinal categories: ,3 years (n¼3), 3–10 years (n ¼ 17), .10 years (n ¼ 35), naturally occurring (n ¼ 6).
FINN C. PILLSBURY AND JAMES R. MILLER1112 Ecological ApplicationsVol. 18, No. 5
Rana catesbeiana showed a much more positive rela-
tionship with the first axis than did any other species,
indicating that its abundance relative to the rest of the
community was higher as road density increased and the
spatial extent of herbaceous vegetation decreased.
Additional patterns in community structure became
apparent when species were assigned to guilds based on
their breeding ecology and landscape complementation
FIG. 3. Calling rank (mean 6 SE; Eq. 1) of seven anuran species in equal quantiles of the index of urban density (0 ¼ leasturban, 1 ¼most urban; see Methods: Univariate data analyses): 0.0–0.2 (n ¼ 22 sites), 0.2–0.4 (n ¼ 13 sites), 0.4–0.6 (n ¼ 8 sites),0.6–0.8 (n ¼ 12 sites), and 0.8–1.0 (n ¼ 6 sites).
July 2008 1113ANURAN COMMUNITIES AND URBANIZATION
requirements (Table 1). The two species with positive
axis 1 scores, A. crepitans and R. catesbeiana, occupy the
same guild in three of the four types of guild
classification: late breeding period, a preference for
permanent ponds, and virtually no upland habitat use
outside of the breeding season (Fig. 4).
DISCUSSION
Factors underlying anuran community structure
Our results indicated the pronounced effect of urban
density on anuran abundance and diversity, consistent
with the findings of others (e.g., Lehtinen et al. 1999,
Ficetola and De Bernardi 2004, Riley et al. 2005, Rubbo
and Kiesecker 2005). Urbanization also had a strong
influence on anuran community structure. Landscape-
scale factors in particular appeared to drive differential
species abundance along the urban–rural gradient in
central Iowa.
Overall, anuran community structure seemed to be
most strongly influenced by the extent and contiguity of
upland habitats, as well as the density and placement of
roads in the surrounding landscape. These factors are
undoubtedly linked, because an increase in road density
reduces the amount and connectedness of herbaceous
upland habitats. Our results indicate that species are
differentially affected by the urban fragmentation of
upland habitats and dispersal routes, but that all species
exhibit a negative association with urbanization (Fig. 3).
Based on our results, we predict that wetlands
embedded in a matrix of unfragmented herbaceous
vegetation with few roads will best accommodate H.
chrysoscelis and R. pipiens, and to a lesser extent B.
americanus and P. triseriata. Rana catesbeiana seems to
be more resilient to urban fragmentation than most of
the anuran community, though this may potentially be
true to a lesser degree for A. crepitans. We would also
expect that the abundance of H. versicolor relative to
other anuran species will likely increase in areas with
well-established, clustered wetlands surrounded by
woody vegetation.
Examining the relative locations of different anuran
guilds within the ordination space created by the first
two CCA axes offers additional insights into the
ecological processes underlying the observed patterns
of community structure along the urban–rural gradient.
Bufo americanus, R. pipiens, H. chrysoscelis, and H.
versicolor all breed in mid to late spring, prefer
temporary wetlands, and make extensive use of upland
habitats outside of the breeding season. These species
exhibited the strongest negative response to urban
fragmentation in this study. By contrast, R. catesbeiana
and A. crepitans both breed in late spring and summer
and prefer wetlands with long hydroperiods, which may
FIG. 4. Location of sites in the space defined by the first two axes derived in canonical correspondence analysis (CCA), showingthe relationship between the environmental gradients calculated in CCA and the index of urban density. Based on their urbandensity index scores, sites were divided into five quantiles (0¼ least urban, 1 ¼most urban).
FINN C. PILLSBURY AND JAMES R. MILLER1114 Ecological ApplicationsVol. 18, No. 5
offer an additional explanation for their success relative
to the rest of the anuran community. Because urban
density is correlated with an increase in hydroperiod
(Rubbo and Kiesecker 2005), they may have a compet-
itive advantage over other species that are adapted to
more ephemeral wetlands. Predation by R. catesbeiana
suppresses the populations of other anurans (Kiesecker
and Blaustein 1997, Pearl et al. 2004), potentially
exacerbating the effect of urbanization on other native
species by adding increased predation to the existing
suite of factors negatively influencing anuran population
persistence. It should be noted, however, that A.
crepitans shows a much weaker association with urban
fragmentation than does R. catesbeiana. It is located
closer to B. americanus and P. triseriata in the
ordination space created by the first two axes in CCA.
Nonetheless, it is noteworthy that A. crepitans is fairly
widespread in central Iowa’s highly fragmented land-
scape. While R. catesbeiana has a long history as a
human commensal species, A. crepitans is experiencing
severe declines in the northern part of its range and has
also declined in Iowa (Hay 1998, Lannoo 1998).
Considerations for amphibian conservation
The results of this study demonstrate the role of
landscape connectivity and fragmentation in structuring
anuran communities in urban areas. Amphibian con-
servation in urban landscapes requires a broad approach
that promotes the functional connectivity of the greater
landscape in addition to the protection and restoration
of breeding sites. The composition and configuration of
the matrix is vital for sustaining and enhancing a diverse
anuran community. The importance of upland habitats
and road density in structuring anuran communities, as
indicated by this study, underscores that the protection,
enhancement, and restoration of upland habitats be-
tween breeding sites is a key component maximizing the
efficacy of conservation efforts.
Upland habitats have a direct and vital influence on
the persistence of many anuran species, because they
allow adults to survive winter migrations and juveniles
to survive dispersal from their natal wetlands. Although
juveniles of many species may disperse several kilome-
ters or more to new breeding sites (Smith and Green
2005), little is known about the dispersal behavior and
upland habitat use of many anurans (Rothermel 2004,
FIG. 5. Location of species relative to the first two axes derived in canonical correspondence analysis. Environmental variables(numbered) are represented by vectors; vector length indicates the relative weight of a given variable in the ordination, anddirection indicates the correlation of that variable with each axis. Environmental variable means lie at the origin; above-averagevalues of a given variable lie along its corresponding vector, and below-average values project from the origin in the directionopposite the arrow. The variables shown are (1) percent cover of herbaceous vegetation within 5 m, (2) mean area (ha) ofherbaceous patches within 1 km, (3) percent cover of herbaceous vegetation within 1 km, (4) number of road crossings to thenearest other wetland, (5) percent cover of roads within 1 km, (6), wetland age (see Fig. 2 legend for a description of age categories),(7) percent cover of woody vegetation within 5 m, and (8) the patch density of surrounding wetlands within 1 km.
July 2008 1115ANURAN COMMUNITIES AND URBANIZATION
Stevens et al. 2004), especially in human-dominated
landscapes. Because roads and other features of
urbanized landscapes are barriers to dispersal (Fahrig
et al. 1995, Vos and Chardon 1998, Forman and
Deblinger 2000), there is likely high mortality with long
dispersal distances.
Additionally, there is increasing evidence that land-
scape composition and configuration influence anuran
populations at spatial scales much larger than those
typically employed in landscape ecology studies. Hou-
lahan and Findlay (2003) found a significant influence of
land use at scales of 2–3 km, and Gibbs et al. (2005)
found strong spatial autocorrelation in species occur-
rences at up to 10 km. There may be, therefore, broad-
scale constraints on the use of available habitat across
the landscape that are unaccounted for in most
landscape ecology studies. The further study of the
ecological mechanisms underlying these patterns would
greatly increase our understanding of broad-scale
population regulation and our ability to successfully
promote long-term population persistence in urban
landscapes.
Overall, our results illustrate that the habitat frag-
mentation and loss accompanying urbanization can be a
driving force behind anuran community structure.
Urbanization is a powerful agent of ecological change
on the landscape, and has proven detrimental to many
different taxa (McKinney 2002); we have illustrated that
this phenomenon has a cascade of effects influencing the
anuran community at spatial scales ranging from
individual wetlands to broad landscapes. The next step
in amphibian conservation biology, however, is to
transcend this broad generalization and work to develop
effective strategies for maintaining amphibian diversity
in urban landscapes. Better integrating natural processes
into the places where people live and work not only
helps sustain biological diversity in an increasingly
degraded world, but gives nature a needed immediacy
to the public, helping to reinforce a broad conservation
ethic while increasing quality of life (Miller and Hobbs
2002, Boyer and Polasky 2004, Turner et al. 2004, Miller
2005). Focusing efforts on urban nature conservation
will also create more attractive, livable urban commu-
nities, potentially reducing development pressures in
peri-urban areas (Merrill 2004, Santelmann and Larson
2004). The long-term success of amphibian conserva-
tion, however, relies on a sustained effort toward
understanding the specific mechanisms driving commu-
nity structure and species distributions in the built
environment, and in using that mechanistic understand-
ing to most effectively conserve and restore amphibian
populations.
ACKNOWLEDGMENTS
We thank E. Creveling, C. DeBoom, and D. Windsor fortheir tireless assistance in the field and laboratory. We are alsograteful to A. Skibbe for lending us his deft facility innavigating the intricacies of ArcGIS. P. Dixon, P. Caragea,and J. Fraterrigo were instrumental in the selection and use of
multivariate analyses. D. Otis and E. Farrar provided valuableguidance throughout this research. This work was supported inpart by an Iowa State University Research Grant to J. R. Millerand by the Department of Natural Resource Ecology andManagement.
LITERATURE CITED
Babbitt, K. J., and G. W. Tanner. 2000. Use of temporarywetlands by anurans in a hydrologically modified landscape.Wetlands 20:313–322.
Boyer, T., and S. Polasky. 2004. Valuing urban wetlands: areview of non-market valuation studies. Wetlands 24:744–755.
Bridges, A. S., and M. E. Dorcas. 2000. Temporal variation inanuran calling behavior: implications for surveys andmonitoring programs. Copeia 2000:587–592.
Christiansen, J. L. 1981. Population trends among Iowa’samphibians and reptiles. Proceedings of the Iowa Academyof Science 88:24–27.
Christiansen, J. L. 1998. Perspectives on Iowa’s decliningamphibians and reptiles. Journal of the Iowa Academy ofScience 105:109–114.
Christiansen, J. L., and R. M. Bailey. 1991. The salamandersand frogs of Iowa. Nongame technical series number 2. IowaDepartment of Natural Resources, Des Moines, Iowa, USA.
Crouch, W. B., III, and P. W. C. Paton. 2002. Assessing the useof call surveys to monitor breeding anurans in Rhode Island.Journal of Herpetology 36:185–192.
Cushman, S. A. 2006. Effects of habitat loss and fragmentationon amphibians: a review and prospectus. Biological Conser-vation 128:231–240.
Czech, B., P. R. Krausman, and P. K. Devers. 2000. Economicassociations among causes of species endangerment in theUnited States. BioScience 50:593–601.
Dahl, T. E. 1990. Wetlands losses in the United States, 1780’s to1980’s. U.S. Department of the Interior, Fish and WildlifeService, Washington, D.C., USA.
Denoel, M., and G. F. Ficetola. 2007. Landscape-levelthresholds and newt conservation. Ecological Applications17:302–309.
Drinnan, I. N. 2005. The search for fragmentation thresholdsin a southern Sydney suburb. Biological Conservation 124:339–349.
Fahrig, L., J. H. Pendlar, S. E. Pope, P. D. Taylor, and J. F.Wegner. 1995. Effect of road traffic on amphibian density.Biological Conservation 73:177–182.
Ficetola, G. F., and F. De Bernardi. 2004. Amphibians in ahuman-dominated landscape: the community structure isrelated to habitat features and isolation. Biological Conser-vation 119:219–230.
Forman, R. T. T., and R. D. Deblinger. 2000. The ecologicalroad-effect zone of a Massachusetts (U.S.A.) suburbanhighway. Conservation Biology 14:36–46.
Freda, J., and W. A. Dunson. 1985. Field and laboratorystudies of ion balance and growth rates of ranid tadpoleschronically exposed to low pH. Copeia 1985:415–423.
Germaine, S. S., and B. F. Wakeling. 2001. Lizard speciesdistributions and habitat occupation along an urban–ruralgradient in Tucson, Arizona, USA. Biological Conservation97:229–237.
Gibbs, J. P. 1998. Distribution of woodland amphibians alonga forest fragmentation gradient. Landscape Ecology 13:263–268.
Gibbs, J. P., K. K. Whiteleather, and F. W. Schueler. 2005.Changes in frog and toad populations over 30 years in NewYork State. Ecological Applications 15:1148–1157.
Hager, H. A. 1998. Area-sensitivity of reptiles and amphibians:are there indicator species for habitat fragmentation?Ecoscience 5:139–147.
Hay, R. 1998. Blanchard’s cricket frogs in Wisconsin: a statusreport. Pages 79–82 in M. J. Lannoo, editor. Status and
FINN C. PILLSBURY AND JAMES R. MILLER1116 Ecological ApplicationsVol. 18, No. 5
conservation of Midwestern amphibians. University of IowaPress, Iowa City, Iowa, USA.
Hazell, D., J. Hero, D. Lindenmayer, and R. Cunningham.2004. A comparison of constructed and natural habitat forfrog conservation in an Australian agricultural landscape.Biological Conservation 119:61–71.
Hecnar, S. J., and R. T. M’Closkey. 1996. Amphibian speciesrichness and distribution in relation to pond water chemistryin southwestern Ontario, Canada. Freshwater Biology 36:7–15.
Hemesath, L. M. 1998. Iowa’s frog and toad survey, 1991–1994.Pages 206–216 in M. J. Lannoo, editor. Status andconservation of Midwestern amphibians. University of IowaPress, Iowa City, Iowa, USA.
Hennings, L. A., and W. D. Edge. 2003. Riparian birdcommunity structure in Portland, Oregon: habitat, urbani-zation, and spatial scale patterns. Condor 105:288–302.
Hill, M. O. 1979. DECORANA: a FORTRAN program fordetrended correspondence analysis and reciprocal averaging.Section of Ecology and Systematics, Cornell University,Ithaca, New York, USA.
Hogsden, K. L., and T. C. Hutchinson. 2004. Butterflyassemblages along a human disturbance gradient in Ontario,Canada. Canadian Journal of Zoology 82:739–748.
Homan, R. N., B. S. Windmiller, and J. M. Reed. 2004. Criticalthresholds associated with habitat loss for two vernal pool-breeding amphibians. Ecological Applications 14:1547–1553.
Houlahan, J. E., and C. S. Findlay. 2003. The effects ofadjacent land use on wetland amphibian species richness andcommunity composition. Canadian Journal of Fisheries andAquatic Sciences 60:1078–1091.
Houlahan, J. E., C. S. Findlay, B. R. Schmidt, A. H. Meyer,and S. L. Kuzmin. 2000. Quantitative evidence for globalamphibian population declines. Nature 404:752–755.
Kane, K. L., E. E. Klaas, K. L. Andersen, P. Brown, and R. L.McNeely. 2004. The Iowa Gap Analysis Project FinalReport. Iowa Cooperative Fish and Wildlife Research Unit,Iowa State University, Ames, Iowa, USA.
Kiesecker, J. M., and A. R. Blaustein. 1997. Populationdifferences in responses of red-legged frogs (Rana aurora)to introduced bullfrogs. Ecology 78:1752–1760.
Knutson, M. G., J. R. Sauer, D. A. Olsen, M. J. Mossman,L. M. Hemesath, and M. J. Lannoo. 1999. Effects oflandscape composition and wetland fragmentation on frogand toad abundance and species richness in Iowa andWisconsin, USA. Conservation Biology 13:1437–1446.
Lannoo, M. J. 1998. Amphibian conservation and wetlandmanagement in the upper Midwest: a catch-22 for the cricketfrog? Pages 330–339 in M. J. Lannoo, editor. Status andconservation of Midwestern amphibians. University of IowaPress, Iowa City, Iowa, USA.
Lannoo, M. J., K. Lang, T. Waltz, and G. S. Phillips. 1994. Analtered amphibian assemblage: Dickinson County, Iowa, 70years after Frank Blanchard’s survey. American MidlandNaturalist 131:311–319.
Laurila, A., and T. Aho. 1997. Do female frogs choose theirbreeding habitat to avoid predation on tadpoles? Oikos 78:585–591.
Lehtinen, R. M., S. M. Galatowitsch, and J. R. Tester. 1999.Consequences of habitat loss and fragmentation for wetlandamphibian assemblages. Wetlands 19:1–12.
Marsh, D. M. 2001. Fluctuations in amphibian populations: ameta-analysis. Biological Conservation 101:327–335.
Marsh, D. M., and P. C. Trenham. 2001. Metapopulationdynamics and amphibian conservation. Conservation Biolo-gy 15:40–49.
McCune, B., and J. B. Grace. 2002. Analysis of ecologicalcommunities. MjM Software Design, Gleneden Beach,Oregon, USA.
McCune, B., and M. J. Meffort. 1999. PC-ORD. Multivariateanalysis of ecological data. Version 4. MjM Software Design,Gleneden Beach, Oregon, USA.
McDonnell, M. J., and S. T. A. Pickett. 1990. Ecosystemstructure and function along urban–rural gradients: anunexploited opportunity for ecology. Ecology 71:1232–1237.
McKinney, M. L. 2002. Urbanization, biodiversity, andconservation. BioScience 52:883–890.
McKinney, M. L. 2006. Urbanization as a major cause of biotichomogenization. Biological Conservation 127:247–260.
Merrill, S. B. 2004. The role of open space in urban planning.Conservation Biology 18:294.
Miller, J. R. 2005. Biodiversity conservation and the extinctionof experience. Trends in Ecology and Evolution 20:430–434.
Miller, J. R., M. D. Dixon, and M. G. Turner. 2004. Responseof avian communities in large-river floodplains to environ-mental variation at multiple scales. Ecological Applications14:1394–1410.
Miller, J. R., J. M. Fraterrigo, N. T. Hobbs, D. M. Theobald,and J. A. Wiens. 2001. Urbanization, avian communities, andlandscape ecology. Pages 117–137 in J. M. Marzluff,R. Bowman, and R. Donnelly, editors. Avian ecology andconservation in an urbanizing world. Kluwer Academic,Norwell, Massachusetts, USA.
Miller, J. R., and R. J. Hobbs. 2002. Conservation wherepeople live and work. Conservation Biology 16:330–337.
Miller, J. R., J. A. Wiens, N. T. Hobbs, and D. M. Theobald.2003. Effects of human settlement on bird communities inlowland riparian areas of Colorado (USA). EcologicalApplications 13:1041–1059.
Mossman, M. J., L. M. Hartman, R. Hay, J. Sauer, andB. Dhuey. 1998. Monitoring long-term trends in Wisconsinfrog and toad populations. Pages 169–198 in M. J. Lannoo,editor. Status and conservation of Midwestern amphibians.University of Iowa Press, Iowa City, Iowa, USA.
Økland, R. H., and O. Eilertsen. 1994. Canonical correspon-dence analysis with variance partitioning: come commentsand an application. Journal of Vegetation Science 5:117–126.
Pearl, C. A., M. J. Adams, R. B. Bury, and B. McCreary. 2004.Asymmetrical effects of introduced bullfrogs (Rana catesbei-ana) on native Ranid frogs in Oregon. Copeia 2004:11–20.
Pechmann, J. H. K., D. E. Scott, J. W. Gibbons, and R. D.Semlitsch. 1989. Influence of wetland hydroperiod ondiversity and abundance of metamorphosing juvenile am-phibians. Wetlands Ecology and Management 1:3–11.
Pellet, J., A. Guisan, and N. Perrin. 2004a. A concentricanalysis of the impact of urbanization on the threatenedEuropean tree frog in an agricultural landscape. Conserva-tion Biology 18:1599–1606.
Pellet, J., S. Hoehn, and N. Perrin. 2004b. Multiscaledeterminants of tree frog (Hyla arborea L.) calling ponds inwestern Switzerland. Biodiversity and Conservation 13:2227–2235.
Pope, S. E., L. Fahrig, and H. G. Merriam. 2000. Landscapecomplementation and metapopulation effects on leopard frogpopulations. Ecology 81:2498–2508.
Porej, D., and T. E. Hetherington. 2005. Designing wetlands foramphibians: the importance of predatory fish and shallowlittoral zones in structuring of amphibian communities.Wetlands Ecology and Management 13:445–455.
Riley, S. P. D., G. T. Busteed, L. B. Kats, T. L. Vandergon,L. F. S. Lee, R. G. Dagit, J. L. Kerby, R. N. Fisher, andR. M. Sauvajot. 2005. Effects of urbanization on thedistribution and abundance of amphibians and invasivespecies in southern California Streams. Conservation Biology19:1894–1907.
Rothermel, B. B. 2004. Migratory success of juveniles: apotential constraint on connectivity for pond-breedingamphibians. Ecological Applications 14:1535–1546.
Rothermel, B. B., and R. D. Semlitsch. 2002. An experimentalinvestigation of landscape resistance of forest versus old-fieldhabitats to emigrating juvenile amphibians. ConservationBiology 16:1324–1332.
July 2008 1117ANURAN COMMUNITIES AND URBANIZATION
Rubbo, M. J., and J. M. Kiesecker. 2005. Amphibian breedingdistribution in an urbanized landscape. Conservation Biology19:504–511.
Sampson, F., and F. Knopf. 1994. Prairie conservation inNorth America. BioScience 44:418–421.
Santelmann, M. V., and K. L. Larson. 2004. Forward.Wetlands 24:717–718.
Semlitsch, R. D., and J. R. Bodie. 2003. Biological criteria forbuffer zones around wetlands and riparian habitats foramphibians and reptiles. Conservation Biology 17:1219–1228.
Sjogren, P. 1994. Distribution and extinction patterns within anorthern metapopulation of the pool frog, Rana lessonae.Ecology 75:1357–1367.
Skelly, D. K., E. E. Werner, and S. A. Cortwright. 1999. Long-term distributional dynamics of a Michigan amphibianassemblage. Ecology 80:2326–2337.
Smith, M. A., and D. M. Green. 2005. Dispersal and themetapopulation paradigm in amphibian ecology and conser-vation: Are all amphibian populations metapopulations?Ecography 28:110–128.
Stevens, V. M., E. Polus, R. A. Wesselingh, N. Schtickzelle, andM. Baguette. 2004. Quantifying functional connectivity:experimental evidence for patch-specific resistance in theNatterjack toad (Bufo calamita). Landscape Ecology 19:829–842.
Stuart, S. N., J. S. Chanson, N. A. Cox, B. E. Young, A. S. L.Rodrigues, D. L. Fischman, and R. W. Waller. 2004. Statusand trends of amphibian declines and extinctions worldwide.Science 306:1783–1786.
ter Braak, C. J. F. 1986. Canonical correspondence analysis: anew eigenvector technique for multivariate direct gradientanalysis. Ecology 67:1167–1179.
ter Braak, C. J. F. 2002. CANOCO. Version 4.5. PlantResearch International, Wageningen University and Re-search Centre, Wageningen, The Netherlands.
Trenham, P. C., and H. B. Shaffer. 2005. Amphibian uplandhabitat use and its consequences for population viability.Ecological Applications 15:1158–1168.
Turner, W. R., T. Nakamura, and M. Dinetti. 2004. Globalurbanization and the separation of humans from nature.BioScience 54:585–590.
Vershinin, V. L., and S. Y. Tereshin. 1999. Physiologicalparameters of amphibians in ecosystems of urbanizedterritories. Russian Journal of Ecology 30:255–259.
Vos, C. C., and J. P. Chardon. 1998. Effects of habitatfragmentation and road density on the distribution pattern ofthe moor frog Rana arvalis. Journal of Applied Ecology 35:44–56.
Weir, L. A., and M. J. Mossman. 2005. North AmericanAmphibian Monitoring Program (NAAMP). Pages 307–313in M. J. Lannoo, editor. Amphibian declines: conservationstatus of United Status species. University of CaliforniaPress, Berkeley, California, USA.
Weir, L. A., J. A. Royle, P. Nanjappa, and R. E. Jung. 2005.Modeling anuran detection and site occupancy on NorthAmerican Amphibian Monitoring Program (NAAMP)routes in Maryland. Journal of Herpetology 39:627–639.
APPENDIX A
Descriptions and locations of 61 central Iowa, USA, wetlands surveyed March–July 2005 (Ecological Archives A018-038-A1).
APPENDIX B
Data collection procedure for all variables of anuran breeding habitat and landscape structure for 61 central Iowa, USA,wetlands surveyed, March–July 2005 (Ecological Archives A018-038-A2).
FINN C. PILLSBURY AND JAMES R. MILLER1118 Ecological ApplicationsVol. 18, No. 5