landscape evaluation of female black bear habitat
TRANSCRIPT
Available online at www.sciencedirect.com
Biological Consenration 125 (2005) 41 1-425
BIOLOOICAL CONSERVATION
Landscape evaluation of female black bear habitat effectiveness and capability in the North Cascades, Washington
William L. Gaines a**, Andrea L. Lyons John F. Lehrnkuhl Kenneth J. Raedeke a U s Forest Service. O b g m and Wenatchee National Forests, 215 Melody Lane, Wenatchee, WA 98801, USA
US Forest Smice. Pan* Northwest Research Station. W e ~ t c h e e Forestry Sciences Lmb. 1133 Western Aw., Wenatchee. WA 98801. USA ' University of Washinglon. Wildfe Sciences Group, Box 352100, Seattle. WA 98195, USA
Reckved 20 Augwt 2004, received in revised form I February 2005; accepted 24 March 2005
Abstract
We used logistic regression to derive scaled resource selection functions (RSFs) for female black bears at two study areas in the North Cascades Mountains. We tested the hypothesis that the influence of roads would result in potential habitat effectiveness (RSFs without the influence of roads) being greater than realized habitat effectiveness (RSFs with roads). Roads consistently had a negative influence on black bear RSFs across seasons and study areas. Roads reduced habitat effectiveness during all seasons at both study areas and changes in the potential habitat values ranged from 1.7% to 16.9%. The greatest reduction in habitat values occurred during the early-season on the west-side study area due to high open road densities. These results support the hypothesis that roads reduce habitat effectiveness for black bears. The influence of roads could be reduced through road closures to reduce open road densities and limit trafiic volumes. We then used the scaled RSFs in a habitat-based population model to assess the influences of timber harvest and roads on potential black bear population sizes. On the west-side study area the potential black bear popula- tion size was most influenced by moderate use roads and timber harvest during the early-season (41% reduction). On the east-side study area, low use roads had the greatest effect on potential black bear population during the early-season (1W reduction). During the late-season, in both study areas, roads had less influence on the potential population sizes as bears were able to access habitats away from roads. The habitat-population model provided reasonable estimates of bear densities compared to other study areas with similar habitats and could be extrapolated to estimate potential black bear populations in other areas with similar habitats. This approach may provide a useful link between the landscape ecology and population biology of black bears, and could eventually be useful in the development of habitat-based population viability analyses. O 2005 Elsevier Ltd. All rights reserved.
KeywordP: Black bear; Habitat eflectiveness; Habitat capability; North Cascades
1. Introduction
Bears and other carnivores are sometimes referred to as "landscape" species because their habitat is not a spe- cific vegetation type but rather an interspersion of vari- ous vegetation associations (Rogers and Allen, 1987; Harris and Kangas, 1988; Schoen, 1990). The large home ranges, omnivorous habits and seasonal use pat-
* Corresponding author Tel.: +I 509 664 9232; fax: +1 509 664 9280. E-mail &ess: [email protected] (W.L. Games).
terns of black bears necessitate that habitat management efforts be directed at the landscape level (Schoen, 1990; Clark et al., 1993).
Understanding the cumulative effects of human activ- ities on wildlife habitats is important to wildlife manag- ers. Advances in spatial statistics, approaches to animal resource use, and geographic information systems have improved our ability to evaluate the effects of human activities on wildlife habitat suitability at large spatial scales (Miadenoff and Host, 1994; Erickson et al., 1998; Mace et al., 1999). These tools provide
0006-3207B - see front matter O 2005 Elsevier Ltd. All rights resewed. doi: 10.1 01 6/j.biocon.200S503.023

412 W. L Gaines et aL I Biological Conservation 125 (2005) 411425
opportunities to expand our knowledge of the effects of human activities on black bear resource use at the land- scape level (Clark et al., 1993; Rudis and Tansey, 1995; Samson and Huot, 1998; Vander Heyden and Meslow, 1999).
Resource use patterns are a consequence of the influence of selection on survival and reproduction, which determines fitness in various habitats (South- wood, 1977; Ruggiero et al., 1988). Therefore, re- source use, estimated by resource selection functions (RSF) (Manly et al., 1993), can be viewed as reliable information about the environments needed for popu- lation persistence, and should be considered a valid basis for management decisions (Ruggiero et al., 1988; Boyce and McDonald, 1999). Recent efforts have used RSFs to relate habitats to population po- tential or size (Mladenoff et al., 1997; Boyce and McDonald, 1999; Boyce and Waller, 2003). Verner et al. (1986) discussed the need for models of habitat relationships to predict wildlife responses to habitat changes. If such a habitat-population link can be established, there are important applications for con- servation and ecological management (Boyce and McDonald, 1999; Roloff and Haufler, 2002). For example, the RSF approach has been used to model populations of spotted owls (Strix occidentalis caurina) in the Pacific Northwest (Boyce et al., 1994), to antic- ipate future wolf (Canis lupus) populations in the northern Great Lakes states (Mladenoff et al., 1997), and to anticipate the distribution and abundance of grizzly bears in the Selway-Bitteroot wilderness of Ida- ho and Montana (Boyce and Waller, 2003).
Fagen (1 988) discussed the assumptions under which the ratio of animal densities equals the ratio of resource availability for any two habitats at equilibrium. Because bears are wide-ranging, highly mobile, long-lived and with relatively low reproductive rates, the assumptions of Fagen (1988) are relatively well met. This reasoning resulted in the development of habitat-based population estimates for bears by others (Schoen et al., 1994; Boyce and Waller, 2003). An important aspect of habitat-based population models for bears has been the influence of human activities on the ability of bears to use and access habitats. As Schoen (1990) points out, any model of bear habitat should include the infiuence of human activities.
We present a landscape-scale evaluation of female black bear habitat in the North Cascades by modeling the potential and realized habitat effectiveness using re- source selection functions (Manly et al., 1993). We de- fine potential habitat eflectiveness as the relative probability of black bears using landscape features in the absence of human activity and realized habitat eflec- tiveness as the relative probability of black bears using landscape features in the presence of human activities (Mace et al., 1999).
We tested the hypothesis that the influence of roads would result in reduced habitat effectiveness for female black bears in our study areas. We based this hypothesis on the result of studies conducted in other areas (Young and Beecham, 1986; Brody and Pelton, 1989; Beecham and Rohlman, 1994). To test this hypothesis we focused on the following objectives: (1) develop a seasonal hab- itat effectiveness model for female black bears for each study area, and (2) compare changes in the relative probability of use of landscape features (vegetation types, elevation zones) with and without the influence of roads. In addition, we proposed a model that can be used to estimate potential black bear population size based on resource selection functions. We used the model to portray the influences that human activities (roads and timber harvest) can have on potential population size within two study areas in the North Cascade range.
1.1. Study area
This study took place at two areas within the North Cascade range in north-central Washington (Fig. 1). The Snoqualmie Study Area (SSA) was approximately 400 km2 in size and was located on the west-side of the North Cascade range. The study area represented habitats typical of the moist western Cascades forests (Henderson et al., 1992). The Okanogan Study Area (OSA) was located within habitats that represented the drier east-side of the Cascades (Lillybridge et al., 1995). The differences in vegetation and climatic factors resulted in very different habitat conditions within each study area.
The Okanogan Study Area (OSA) was approximately 7800 km2 in size and was located on the east-side of the
Fig. I . The Okanogan and Snoqualmie study areas are outlined in white.

W. L Gaines el al. I Biological (
North Cascade range, on the Methow Ranger District, Okanogan National Forest. Radio-collared bears were located in both backcountry and frontcountry areas. Some of the bear locations occurred in areas with lim- ited road access and were only accessible by foot. Most of the radio-collared bears were located in areas used for logging and extensive recreational activities. Elevations range from about 500m in the valley bottoms to 3000 m near the crest of the Cascade mountains. Precip itation near the Cascade crest averaged about 150- 200 d y e a r and precipitation at the lower elevations on the east-side of the study area averaged 25-30cml year, falling mostly as snow.
The Snoqualmie Study Area (SSA) was located on the west-side of the North Cascade range on the Mount Baker-Snoqualmie National Forest and on private tim- ber lands. Most of the radio-collared bears were located in frontcountry areas that were intensively managed for timber production, while a few were located in National Forest lands managed as wilderness. Access was re- stricted in portions of the study area through gate clo- sures onto private timber lands. Elevations ranged from 70 m on the extreme western edge of the study area to 2000 m on the eastern portion. Annual precipitation ranged from 170 to 300 d y e a r , falling mostly as rain.
2. Methods
2.1. Capture and telemetry
Black bears were captured and fitted with radiocol- lars or surgically implanted transmitters (on the SSA only) during April-July, 1994-1 997 (Koehler et al., 2001). Captured bears were ear-tagged and their upper lip was tatooed with an individual identifying number. Total body length, chest girth, and weight were mea- sured. A premolar tooth was extracted for determina- tion of age and blood was collected to assess disease titer and analyze DNA profiles.
Telemetry flights occurred 1-2 tirnedweek, as weather conditions allowed, from den emergence (April) until den entrance (early November). Radio locations sepa- rated by at least 24 h were considered independent (White and Garrot, 1990). Aerial locations were plotted onto 1:24,000 USGS topographic maps and digitized into an ARCINFO geographic information system (GIs). A total of 54 blind tests were conducted on the OSA to assess telemetry accuracy, and telemetry error was 180 f 63 m (95% CI). On the SSA 45 tests were completed with a telemetry error of 460 + 67 m (95% CI). The larger telemetry error on the SSA can be attrib- uted to the use of implanted transmitters (Koehler et al., 2001).
Data from 1793 telemetry relocations representing 19 female black bears (7 on the OSA, 12 on the SSA) were
used for the early-season analyses, and 1585 telemetry relocations from 17 female black bears (8 on the OSA, 9 on the SSA) were used for the late-season analyses. Seasons were determined based on changes in bear diets and plant phenology. Seasons were early-season (den emergence to 31 July) and late-season (1 August to den entrance).
2.2. Map layers
We incorporated telemetry error by generalizing the elevation and road features to categorical variables 0.50 km in width or by using a moving windows routine (Mace et al., 1999). In addition, the vegetation map was generalized by grouping vegetation categories to limit the number of variables in the models.
2.2.1. Roads All road maps within the study areas were obtained
in digital format from the US Forest Service or Wash- ington Department of Natural Resources. Road loca- tion and status (open or closed) was field verified and updated as needed. A combination of magnetic counters and infrared counters were used to quantify the levels of vehicular traffic on a sample of roads from 1995 to 1998. Traffic volume data were categorized into three levels for each season: low use = C1 vehicleh, moderate use = 1- 10 vehicle&, high use = >10 vehicle&. These data were used to extrapolate traffic volume estimates for all roads within the study areas based on their proximity to a sampled road and on road type (primitive, gravel, paved, highway).
Each road was assigned a use level and then a geo- graphic information system (GIs) was used to determine the straight line distance from telemetry relocations and random points to the nearest road within the following categories: ~500,500-1000, and 1001-2000 m. The road network was also converted to a polygon map using a 1 krn2 moving window GIs routine. The categories used were: (1) areas with no open roads >200 ha in size, (2) areas with no open roads 40-200 ha in size, (3) areas with no open roads <40 ha in size, and (4) open road densities >0.1 km/km2.
2.2.2. Habitat and elevation zones The vegetation map developed for the North Cas-
cades using 1986 Landsat Multispectral Scanner (MSS) imagery and ground sampling (Gaines et al., 1994) provided the basis for habitat analyses on the OSA and the eastern half of the SSA. The vegetation data were updated to account for fires and timber har- vest that occurred since the original mapping was com- pleted. Vegetation on the western half of the SSA was mapped using a combination of MSS (1972, 1973, 1985, 1992) and thematic mapper (TM) (1998, 1999) sa- tellite images, and digital aerial photos (1990, 1994) to
414 W.L. Gaines et al. I Biological Co~~~eroafion 125 (ZlW5) 411-425
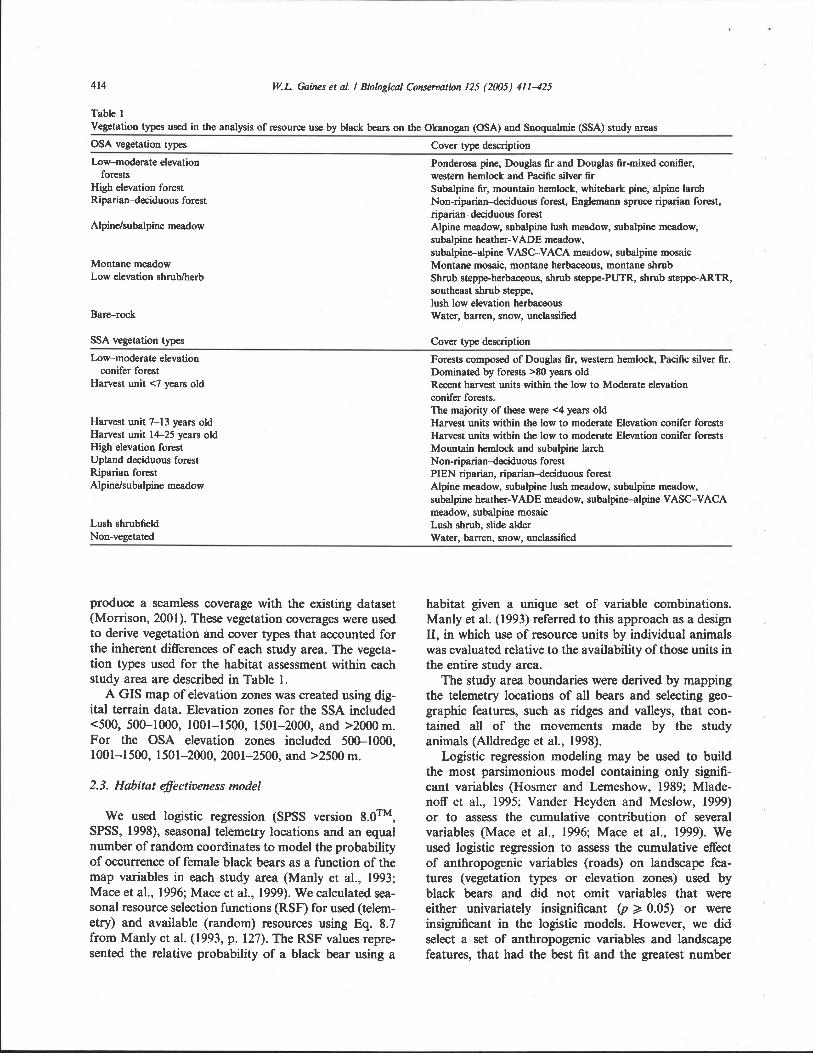
Table I Vegetation types used in the analysis of resource use by black bears on the Okanogan (OSA) and Snoqualmie (SSA) study areas
OSA vegetation types Cover type description
Low-moderate elevation Ponderosa pine, Douglas fir and Douglas fir-mixed conifier, forests western hemlock and Pacific silver fir
High elevation forest Subalpine fir, mountain hemlock, whitebark pine, alpine larch Riparian-deciduous forest Non-riparian-deciduous forest, Englemann spruce riparian forest,
riparian-deciduous forest Alpindsubalpine meadow Alpine meadow, subalpine lush meadow, subalpine meadow,
subalpine heather-VADE meadow, subalpinbalpine VASC-VACA meadow, subalpine mosaic
Montane meadow Montane mosaic, montane herbaceous, montane shrub Low elevation shrubherb Shrub steppe-herbaceous, shrub steppe-PUTR, shrub steppe-ARTR.
southeast shrub steppe. lush low elevation herbaceous
Bare-rock Water, barren, snow, unclassified
SSA vegetation types Cover type description
Low-moderate elevation Forests composed of Douglas fir, western hemlock, Pacific silver fir. conifer forest Dominated by forests >80 years old
Harvest unit <7 years old Recent harvest units within the low to Moderate elevation
Harvest unit 7-13 years old Harvest unit 14-25 years old High elevation forest Upland deciduous forest Riparian forest Alpindsubalpine meadow
conifer forests. The majority of these were <4 years old Harvest units within the low to moderate Elevation conifer forests Harvest units within the low to moderate Elevation conifer forests Mountain hemlock and subalpine larch Non-ripa~ian-deciduous forest PIEN riparian, riparian-deciduous forest Alpine meadow, subalpine lush meadow, subalpine meadow, subalpine heather-VADE meadow, subalpinsalpine VASC-VACA meadow, subalpine mosaic
Lush shrubfield Lush shrub, slide alder Non-vegetated Water, barren, snow, unclassified
produce a seamless coverage with the existing dataset (Morrison, 2001). These vegetation coverages were used to derive vegetation and cover types that accounted for the inherent differences of each study area. The vegeta- tion types used for the habitat assessment within each study area are described in Table 1.
A GIs map of elevation zones was created using dig- ital terrain data. Elevation zones for the SSA included <500, 5W1000, 1001-1500, 1501-2000, and ~ 2 0 0 0 m. For the OSA elevation zones included 500-1000, 1001-1500, 1501-2000, 2001-2500, and >2500 m.
2.3. Habitat eflectiveness model
We used logistic regression (SPSS version 8.0TM, SPSS, 1998), seasonal telemetry locations and an equal number of random coordinates to model the probability of occurrence of female black bears as a function of the map variables in each study area (Manly et al., 1993; Mace et al., 1996; Mace et al., 1999). We calculated sea- sonal resource selection functions (RSF) for used (telern- etry) and available (random) resources using Eq. 8.7 from Manly et al. (1993, p. 127). The RSF values repre- sented the relative probability of a black bear using a
habitat given a unique set of variable combinations. Manly et al. (1993) referred to this approach as a design 11, in which use of resource units by individual animals was evaluated relative to the availability of those units in the entire study area.
The study area boundaries were derived by mapping the telemetry locations of all bears and selecting geo- graphic features, such as ridges and valleys, that con- tained all of the movements made by the study animals (Alldredge et al., 1998).
Logistic regression modeling may be used to build the most parsimonious model containing only signifi- cant variables (Hosmer and Lemeshow, 1989; Mlade- noff et al., 1995; Vander Heyden and Meslow, 1999) or to assess the cumulative contribution of several variables (Mace et al., 1996; Mace et al., 1999). We used logistic regression to assess the cumulative effect of anthropogenic variables (roads) on landscape fea- tures (vegetation types or elevation zones) used by black bears and did not omit variables that were either univariately insignificant (p 2 0.05) or were insignificant in the logistic models. However, we did select a set of anthropogenic variables and landscape features, that had the best fit and the greatest number
W L. G n k s et aL I Biological (
of significant variables ( p < 0.05). This approach re- duces the efficiency of the model, but parameter esti- mates remained unbiased (Menard, 1995). Using this approach, the logistic regression coefficients repre- sented the influence of each variable on black bear re- source use relative to random availability. The association of each variable was determined by each coefficient's sign (negative or positive) and power determined by the p value. Significant negative coeffi- cients implied use of resources less than available, and significant positive coefficients suggested that use was greater than available.
We derived 95% confidence intervals for each coeffi- cient in each season by creating a separate logistic regression model for each n - 1 sample of individual bears (jackknifing). In this manner, we assessed model stability and individual variability in resource use among bears. The significance of each coefficient was calculated from the overall model that included all bears for each season.
Regression models were evaluated using standardized residuals and coefficients of determination (R') (Me- nard, 1995). We also used the classification accuracy ta- bles and correlation matrices in SPSS version 8.0 (SPSS, 1998).
The RSF values were scaled from OOh to 1000! by dividing each unscaled RSF value by the largest un- scaled RSF value (Mace et al., 1999). We used these scaled values to produce two GIs maps: potential habi- tat effectiveness map and realized habitat effectiveness map. The potential habitat effectiveness map repre- sented the relative probability of occurrence of a black bear in the absence of human activity, and was created by replacing the road coefficients with zero. The realized habitat effectiveness map was created by including the road coefficients. The difference in RSF values between the two maps was considered to be the change in habitat effectiveness as a result of roads within black bear habitat.
Potential and realized habitat effectiveness maps were developed for each study area by season. We cal- culated the mean RSF values to compare habitat po- tential and realized habitat effectiveness across study areas. We used the weighting algorithm of Mace et al. (1999) to account for declines in areas with high habitat potential having a greater effect on bears than similar declines in areas of low habitat potential. This algorithm produces an adjusted percent change be- tween realized and potential habitat effectiveness, and ranked declines in areas of high potential higher than similar declines in areas of low potential. It is calculated as
Adjusted % change
- - (potential RSF - realized RSF) x potential RSF 100
2.4. Habitat-based population model
We used the RSF values rescaled from 0.0 to 1.0 to estimate bear density within each habitat and overall po- tential population size for each study area. Females were used because their survival generally regulates bear pop- ulations to a greater degree than male survival (Miller, 1990; Garshelis, 1994). We modified the equation of Schoen et al. (1994) by substituting the scaled RSF val- ues for their Habitat Capability Index (HCI). The HCI estimates used by Schoen et al. (1994) for grimly bears were based on best professional judgment whereas the RSFs we used were mathematically derived based on ac- tual female black bear use. We assume this to be an improvement to the model. The resulting model that we used to estimate the potential black bear population is similar to that of Boyce and McDonald (1999, Box 2).
We used bear density estimates obtained from a por- tion of each study area by the Washington Department of Fish and Wildlife (G. Koehler, pers. comm.) in our habitat-based population model. For the SSA, a 87.6 km2 area was sampled and the density was 0.25 black bears/km2. For the OSA, a 64.0 k d area was sampled and the estimated density was 0.04 black - bears/km2. The density of bears within the landscape feature with the highest RSF value (1.0) was calculated using the following equation:
where Dm = the density of bears in the area with the highest RSF values, N = the number of bears in the study area, RSFi = the scaled resource selection func- tion, and Ai = the area of landscape feature i. The den- sity of bears in the remaining landscape features was calculated by multiplying Dm, by each scaled RSF va- lue. The number of bears in the study area was then determined by the following relationship:
N = ZD, x A,,
where N = the number of bears in the area, Di = the den- sity of bears in landscape feature i, and A, = the area in habitat i. We estimated the influence of roads on the po- tential population for each study area by substituting potential and realized RSF values for low, moderate, and high use roads. We estimated the influence of timber harvest on the potential population on the SSA by (1) adding the area currently classified as timber harvest unit back into the low-mid elevation forest category then recalculating the potential population size, and (2) adjusting the area within harvest units to levels +50% of current levels and recalculating potential pop- ulation size. The 5 W level was used only to demonstrate the influences of timber harvest. The influence of timber

416 KL Gaines er al. I Biological Conservation 125 (2005) 411-425
harvest on the OSA was not estimated because the land- scape units used in the RSF models did not explicitly identify timber harvest units.
3. Results
3.1. Trafic volume
Traffic volume was monitored for 1169 h at 244 sites on the OSA and 566 h at 149 sites on the SSA. Sampling intensity was lower on the SSA because restricted access reduced the variability in use levels. In addition, there were no high use roads within the SSA.
3.2. Habitat efectiveness model
3.2.1. Early-season The early-season logistic regression model for females
on the OSA was significant (-2LL=773.53, Chi Square = 24.37, df = 7, p = 0.001, 2 = 0.51) and in- cluded elevation zones and all road variables. Most of the human activity variables were significant (Table 2). The model correctly classified 82.6% of the used sites and 74.8% of the random sites. Our sample of female black bears was most strongly and negatively associated with areas within 500 m of low use and high use roads (Table 2). In addition small unroaded areas <40 ha in size were significantly and negatively associated.
The early-season logistic regression model for females on the SSA was significant (-2LL= 1024.89, Chi Square = 30.60, df = 8, p = ~0.001, ? = 0.36) (Table 3) for the model with vegetation types, distance to road use level categories, and road density zones. This model correctly classified 77.1% of the used sites and 67.6% of the random sites. The sample of female black bears on the SSA were most strongly and negatively associated with areas within 500 m of low use roads and areas with low and moderate road densities (Table 3).
3.2.2. Late-season The late-season logistic regression model for females
on the OSA was significant (-2LL=602.17, Chi Square = 56.79, df = 8, p = 0.000, ? = 0.60) and in- cluded vegetation and road variables. As with the early-season model, many of the human activity vari- ables were significant and negative (Table 4). This model correctly classified 89.9% of the used sites and 79.3% of the random sites. This sample of female black bears was most strongly and negatively associated with areas with- in 500 m of moderate and high use roads (Table 4). In addition small unroaded areas less than <40 ha in size were significant negative predictor variables.
The late-season logistic regression model for females on the SSA was significant (-2LL= 814.73, Chi Square = 17.79, df = 8, p = 0.013, 2 = 0.34) and in- cluded vegetation types and distance to road use level categories (Table 5). This model correctly classified 75.1% of the used sites and 58.8% of the random sites.
Table 2 Mean early-season logistic regression model coefficients, f95% confidence intervals, range, standard error (SE), and significance levels from 7 female black bean on the Okanogan Study Area. North Cascades, Washington
Variable Mean -95% +95% Min. Max. SE P
Elevation zone Elevation 500-1000 m 20.466 19.949 20.982 19.949 21.555 0.21 1 0.720 Elevation 1001-1MOm 1 1.329 10.689 1 1.969 10.650 12.636 0.261 0.483 Elevation 1501-2000 m 9.595 9.176 10.014 9.214 10.511 0.171 0.550 Elevation 200 1-2500 m 10.207 9.888 10.526 9.833 10.882 0.130 0.552 Elevation >2500 m 18.270 10.081 18.458 17.900 18.512 0.077 0.361
Dbrance to road use level LOW use road <500 m -2.597 -3.017 -2.177 -3.488 - 1.998 0.172 <0.001 Low use road 500-1000 m -1.535 -1.847 - 1.223 -2.092 - 1.027 0.127 <0.001 Low use road 1001-2000m -0.731 -1.034 -0.482 -1.035 -0.234 0.123 0.014 Mod. use road <500 m -0.577 -0.877 -0.276 -1.199 -0.150 0.122 0.146 Mod. use road 500-1000 m -0.026 -0.293 0.241 -0.598 0.283 0.109 0.802 Mod. use road 1001-2000 m 0.728 0.467 0.989 0.538 1.204 0.282 0.116 High use road <500 m -3.873 -4.324 -3.423 -4.894 -3.384 0.184 0.005 High use road 5W1000 m -3.222 -3.677 -2.767 -4.250 -2.828 0.186 0.002 High use road 1001-2000 m -2.818 -3.286 -2.350 -3.813 -2.207 0.192 <0.001
Road density zone No road >200 ha 10.949 10.516 11.384 10.208 11.778 0.177 0.847 No road a 2 0 0 ha - 1.266 - 1.495 - 1.037 -1.719 -0.871 0.093 0.409 No road 4 0 ha - 1.438 -1.581 -1.295 - 1.645 -1.148 0.058 ~0.001 Roaded -0.179 -0.508 0.148 -0.920 0.204 0.134 0.952
Constant -66.777 -69.822 -63.732 -72.899 -63.819 1.244 0.518

W L GaineJ et aL I Biological Consmtion 125 (2005) 411-425 417
Table 3 Mean early-season logistic regression model coeflicients, f 95% confidence intervals, range, standard error (SE), and significance levels from 12 female black bears on the Snoqualmie Study Area, North Cascades, Washington
Variable Mean -95% +95% Min. Max. SE P Vegetation cover type L o w - m h t e elevation forest 1.618 1.485 1.752 1.432 2.122 0.061 0.001 High elevation forest -0.991 -1.125 -0.856 - 1 .504 -0.808 0.061 0.089 Deciduous forest -0.981 -1.099 -0.864 -1.416 -0.801 0.054 0.069 Riparian forest 0.039 -0.075 0.153 -0.412 0.373 0.052 0.940 Alpine-subalpine meadow 0.362 -0.905 1.630 -0.647 6.670 0.576 0.888 Montane meadow - 1.059 -1.192 -0.925 -1.518 -0.854 0.061 0.104 Bare, rock -0.140 -0.344 0.064 -0.701 0.566 0.093 0.826 Harvest unit 14-25 years old -0.107 -0.304 0.089 -0.667 0.473 0.089 0.856 Harvest unit 7-13 years old -0.959 - 1.052 -0.865 - 1.262 -0.719 0.043 0.100 Harvest unit <7 years old -1.060 -1.148 -0.973 - 1.414 -0.878 0.040 0.071 Low elevation lush shrub 7.392 7.139 7.644 6.836 8.499 0.115 0.370
Distance to road use level Low use road <SO0 m Low use road 500-1000 m Low use road 1001-2000 m Mod. use road <SO0 m Mod. use road 500-1000 m Mod. use road 1001-2000 m
Road density zone Open road density >I kmlkm2 Open road density 1-1 kmlkm2
Constant
Table 4 Mean late-season logistic regression model coefficients, f 95% confidence intervals, range, standard error (SE), and significance levels from 8 female black bears on the Okanogan Study Area, North Cascades, Washington
- -
Variable Mean -95% +950/0 Min. Max. SE 4
Vegetation cover type Low-moderate elevation forest High elevation forest Riparian deciduous forest Alpine-subalpine meadow Montane meadow Low elevation shrubherb Bare, rock
Distance to road use lewl Low use road ~ 5 0 0 m Low use road SUO-1000 m Low use Road 1001-2000 m Mod, use road <SO0 m Mod. use road 50&1000 m Mod, use road 1001-2000 m High use road C500 m High use road 500-1000 m High use road 1001-2000 m
Road density zone No road 2200 ha No road 40-200 ha No road c40 ha Roaded
Constant -50.01 -70.58 -29.43 -104.5 -17.51 8.701 0.844

418 K L Gaines el aL I Biological Conservation 125 (2005) 411-425
Table 5 Mean late-season logistic regression model coefficients, f95% confidence intervals, range, standard error (SE), and significance levels from 9 female black bears on the Snoqualmie Study Area, North Cascades. Washington
Variable Mean -95% +95% Min. Max. SE P
Vegetation cover type Low-moderate elevation forest 1.948 1.724 2.173 1.672 2.770 0.099 <0.001 High elevation forest -3.421 -3.647 -3.1% -4.162 -3.122 0.099 <0.001 Deciduous forest -1.859 -2.088 -1.630 -2.644 -1.540 0.101 0.001 Riparian forest 1.228 0.943 1.512 0.544 2.126 0.125 0.050 Alpin~ubalpine meadow -2.658 -2.907 -2.409 -3.465 -2.194 0.110 0.004 Montane meadow 0.479 0.162 0.797 -0.457 1.262 0.140 0.563 Bare, rock -2.317 -2.557 -2.076 -3.170 -2.043 0.106 0.002 Harvest unit 14-25 yean old 0.041 0.346 0.263 -0.884 0.336 0.136 0.952 Harvest unit 7-13 years old -2.134 -2.390 - 1.878 -2.927 - 1.428 0.113 CO.001 Harvest unit <7 years old - 1.948 -2.071 -1.824 -2.400 - 1.758 0.054 0.002 Low elevation lush shrub 6.442 6.234 6.650 5.667 6.678 0.092 0.397
Distance to road use level Low use road <SO0 m -0.129 -2.069 1.811 -7.830 1.227 0.857 0.256 Low use road 540-1000 m -0.395 -2.400 1.610 -8.307 1.460 0.886 0.594 Low use road 1001-2000 m -0.966 -2.692 0.760 -7.830 -0.047 0.763 0.702 Mod. use road <500 m 0.293 0.130 0.455 -0.009 0.718 0.071 0.246 Mod. use road 500-1000 m -0.789 - 1.292 -0.285 - 1.709 0.953 0.222 0.005 Mod. use road 1001-2000 m -1.337 - 1.435 - 1.239 - 1.590 -1.184 0.043 <0.001
Constant -6.483 - 10.50 -2.464 -10.6 6.674 1.77 0.963
Several vegetation variables were significant such as 3.3. Changes to habitat eflectiveness riparian habitat and lush shrub habitats. Female black bears on the SSA were negatively associated with areas 3.3.1. Early-season within 501-1000 and 1001-2000 m of roads that received Early-season habitat potential on the OSA aver- moderate levels of vehicular traffic (Table 5). aged 57.8 (SE = 15.9), whereas realized habitat values
Table 6 Potential and realized resource selection function (RSF)" values, and mean percent adjusted change (in parentheses) for female black bears during the early- and late-seasons on the Okanogan Study Area
Potential Low use road (m) Moderate use road (m) High use road (m)
<500 500-1000 1001-2000 <SO0 500-1000 1001-2000 <500 500-1000 1001-2000
Elat ion zone - eariy-season 500-1000 m 3.6 O(O.l) 0.3(0.1) O(O.l) 1.6(0.) 3.5(0) 3.6(0) l.O(O.1) 7 ( 0 ) O(O.l) 1001-1500m 47.4 36.1(5.4) M.l(l.6) 45.0(1.1) 45.4(1.0) 47.3(0) 47.4(0) 44.8(1.2) 45.5(0.9) 43.3(1.9) 150 1-2000 m 69.6 58.3(7.9) 66.32.3) 67.2(1.7) 67.6(1.4) 69.5(0.1) 69.6(0) 67.0(1.8) 67.7(1.3) 65.5(2.9) 200 1-2500 m 100.0 88.7(11.3) 96.7(3.3) 97.6(2.4) 98.0(2.0) 99.9(0.1) 100(0) 97.4(2.6) 98.1(1.9) 96.0(4.0) >2500 m 68.6 57.2(7.8) 65.3(2.3) 68.6(0) 66.6(1.4) 68.5(0.1) 68.6(0) M.O(l.8) 66.7(1.3) 64.5(2.8)
Vegetation type - late-season L o w 4 d elevation 46.8 43.7 (1.5) 43.5 (1.5) 46.8 (0) 30.9 (7.4) 39.7 (3.3) 41.8 (2.3) 43.0 (1.8) 44.8 (0.9) 44.6 (1.0)
forest High elevation forest 62.8 59.7 (1.9) 59.5 (2.1) 62.80 (0) 46.9 (10.0) 55.6 (4.5) 57.8 (3.1) 59.0 (2.4) 60.8 (1.3) 60.6 (1.4) Riparianldeciduous 100 96.9(3.1) 96.7(3.3) 100(0) M.l(l5.9) 92.9(7.1) 95.0(5.0) %.2(3.8) 98.0(2.0) 97.8(2.2)
forest AJpineIsubapline 86.5 83.4(2.7) 83.2(2.8) 86.5(0) 70.6(13.8) 79.3(6.2) 81.5(4.3) 82.7(3.3) 84.5(1.7) 84.3(1.9)
meadow Montane meadow 47.9 44.8 (1.5) 44.6 (1.6) 47.9 (0) 32.0 (7.6) 40.7 (3.4) 42.9 (2.4) 44.1 (1.8) 45.9 (1.0) 45.7 (1.1) Low elevation 58.3 55.2(1.8) 55.1(1.9) 58.3(0) 42.4(9.3) 51.2(4.1) 53.4(2.9) 54.6(2.2) 56.4(1.1) 56.1(1.3)
shrubherb RocWtalus 53.5 50.4(1.7) 50.2(1.8) 53.5(0) 37.6(8.5) 46.4(3.8) 48.6(2.6) 49.7(2.0) 51.5(l.l) 51.3(1.2)
a RSF values represent the relative probability of a female black bear using each unique variable combination.

W.L. Gaines et aL I Biological Conseruatwn 125 (2005) 411425 419
Table 7 Potential and realized resource selection function (RSF)" values, and mean percent adjusted change (in parentheses) for female black bears during the early- and late-seasons on the Snoqualmie Study Area
Potential Low use road (m) Moderate use road (m)
6 0 0 500-1000 1001-2000 4 0 0 500-1000 1001-2000
Vegetation type - early-season . Low-moderate elevation forest 100.0
High elevation forest 50.9 Deciduous forest 50.6 Riparian forest 57.2 Alpinesubalpine meadow 56.7 Montane meadow 54.2 Bare, rock 56.2 Harvest unit 14-25 years old 56.2 Harvest unit 7-13 years old 53.5 Harvest unit <7 years old 53.6 Low elevation lush shrub 79.3
Vegetarwn type - late-season Low-moderate elevation forest High elevation forest Deciduous forest Riparian forest Alpinwbalpine meadow Montane meadow Bare, rock Harvest unit 14-25 years old Harvest unit 7-13 years old Harvest unit <7 years old Low elevation lush shrub
a RSF values represent the relative probability of a female black bear using each unique variable combination.
averaged 54.9 (SE = 4.8) (Table 6). The average ad- most dramatic changes to the habitat values occurred justed percent change from early-season habitat poten- on the eastern portion of the OSA and western portion tial was 1.7 (SE = 0.3). During the early-season on the of the SSA during the early-season. OSA potential female black bear RSF values were the highest for the elevation zone 2001-2500 m and low- est for 500-1000 m (Table 6). Roads had little influence on RSF values at the low elevations because of the low potential use of these areas (Table 6). However, roads had the greatest influence on the 2001-2500 m elevation zone in areas <500 m from a low use road (Table 6). Overall, RSF values improved as the dis- tance from a road increased and low use roads had the greatest influence on reducing the potential RSF values.
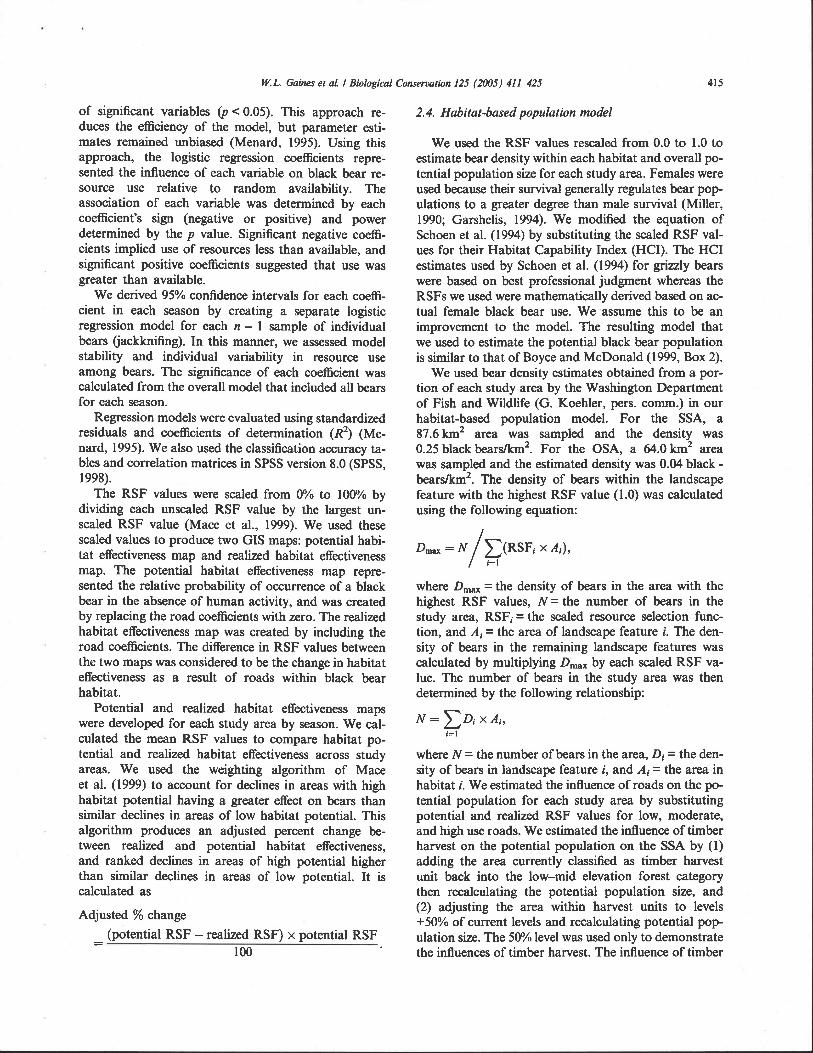
On the SSA early-season potential habitat values averaged 60.7 (SE =4.5) and realized habitat values averaged 34.8 (SE = 2.5) (Table 7). This resulted in an adjusted percent change of 16.9 (SE = 2.3). Potential RSF values for female black bears during the early- season were the highest for the low-moderate elevation forest and low-elevation lush shrub (Table 7). Roads had the greatest influence on RSF values for these hab- itats when they occurred within 500 m of a low use road, and for all distance to road categories for moderate use roads (Table 7).
The potential habitat values for the early-season were similar; however, the realized habitat values were much lower on the SSA than on the OSA (Figs. 2-4). The
Fig. 2. Map showing potential habitat etTectiveness for the early- season on the Okanogan study area. Each 30 x 30 m map pixel represents the relative probability of use by female black bears; darker areas represented higher resource selection function values.
W. L Gaines et al. I Biological Comervation I25 (2005) 411-425
~ E y s w n o n P ~ ( I I
41 -m 1 9 1 - 8 9 C -6l-rn -71-809L
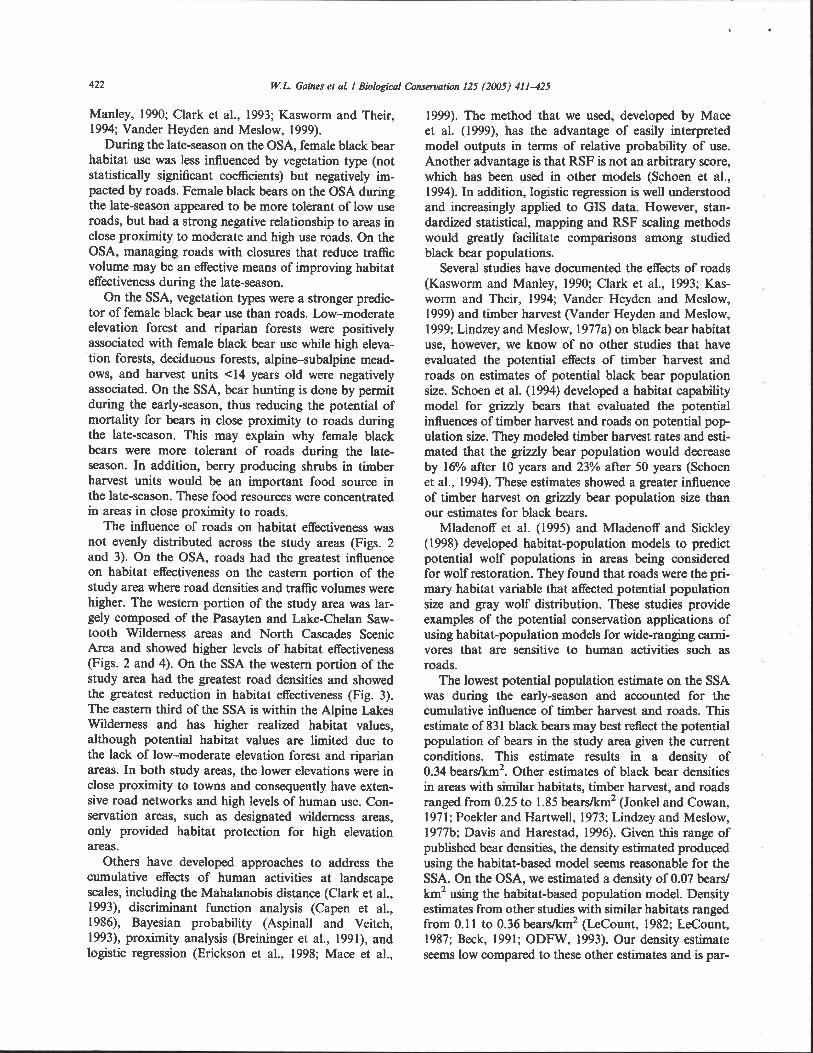
Fig. 3. Maps showing potential (top) and r e a k d (bottom) habitat effectiveness for the early-season on the Snoqualmie study area. Each 30 x 30 m map pixel represents the relative probability of use by female black bears; darker areas represented higher resource selection function values.
3.3.2. Late-season The late-season potential habitat values for the OSA
averaged 65.1 (SE = 7.7) and realized habitat values aver- aged 60.4 (SE = 2.4). The adjusted percent change from potential habitat was 3.1 (SE = 0.4). Riparian, alpine/ subalpine meadows, and high elevation forest were the vegetation types that had the highest RSF values for fe- male black bears on the OSA (Table 6). The realized RSF values were reduced the most when these habitats were located <500 m from a moderate use road (Table 6).
On the SSA the late-season potential habitat values averaged 59.7 (SE = 5.5) and the realized habitat value averaged 54.2 (SE = 2.1) (Table 7). This resulted in an
adjusted percent change that averaged 3.5 (SE = 0.6). During the late-season on the SSA low-moderate eleva- tion forests and lush low elevation shrubs were the veg- etation types with the highest RSF values. Roads had the greatest influence on black bear use of low-moderate elevation forests when this habitat was located within 500 m of a low use road or within 1001-2000 m of a moderate use road (Table 7).
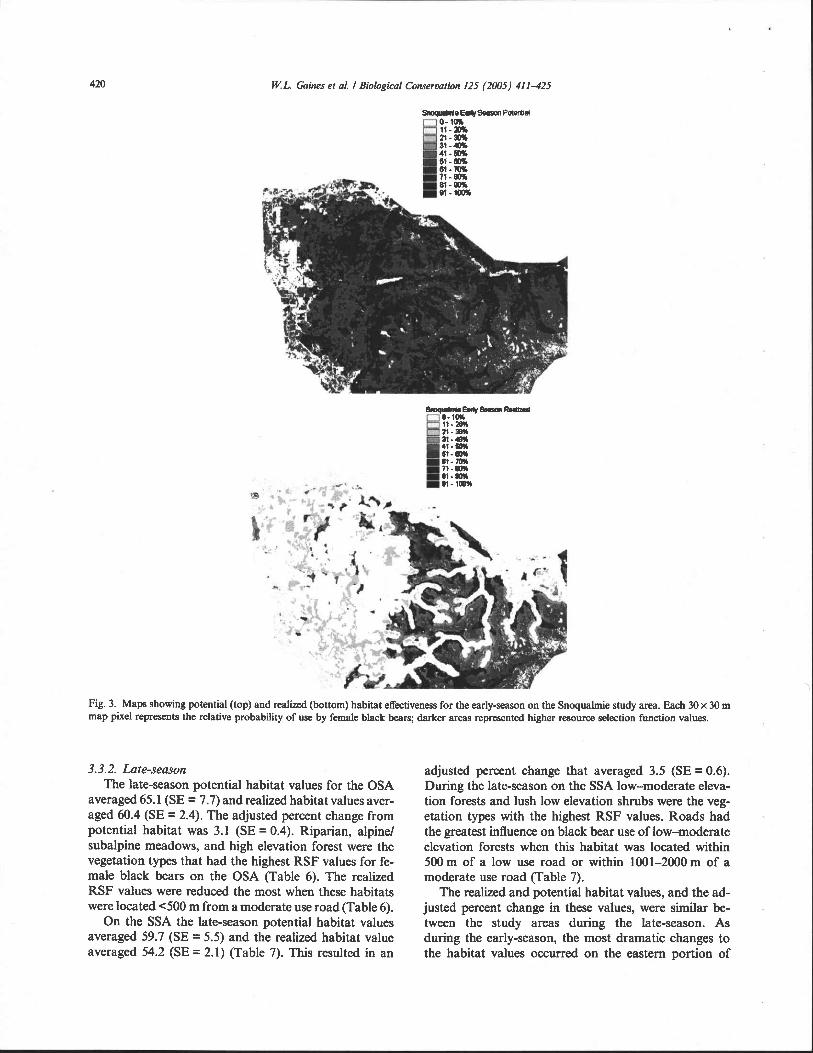
The realized and potential habitat values, and the ad- justed percent change in these values, were similar be- tween the study areas during the late-season. As during the early-season, the most dramatic changes to the habitat values occurred on the eastern portion of

W. L Gaines et al. I Biological (
Fig. 4. Map showing realized habitat effectiveness for the late-season on the Okanogan study area. Each 30 x 30 m map pixel represents the relative probability of use by female black bears; darker areas represented higher resource selection function values.
the OSA (Fig. 4) and western portion of the SSA during the late-season.
These results, combined with the significant and neg- ative road coefficients in our models, support the hypothesis that roads reduced habitat effectiveness for female black bears in the North Cascades. This was especially evident during the early-season on the SSA.
the early-season, we estimated the potential population using RSF values adjusted for road influence (realized values). This resulted in a 33% decrease in potential pop- ulation of black bears to 947 bears within the study area. Low use roads accounted for 10% of this decrease and moderate use roads 23%. No high use roads occurred on the SSA. During the late-season, roads had less influ- ence on the potential population size on the SSA. When realized RSF values were used, the potential population was reduced by 7%, to 1415 bears, due to the influence of roads. Low use roads accounted for 2% of the poten- tial population reduction and moderate use 5%.
On the OSA, as on the SSA, the influence of roads on the potential population size was the greatest during the early-season. During this season road influences reduced the potential black bear population by 10% to 582 bears in the study area. Most of this decrease was due to the influence of low use roads (a%), while moderate and high use roads each reduced the potential population by 1%. During the late-season on the OSA, road influ- ence on potential population size resulted in a 2% reduo tion to an estimated 526 bears. Low use roads had a 1% reduction, while moderate and high use roads each had < 1% reduction in potential black bear population size.
3.4.3. Cumulative influence of r o d and timber harvest The cumulative influence that roads and timber har-
vest had on estimated potential black bear population size on the SSA varied considerably by season. During the early-season the cumulative effect of roads and tim- ber harvest reduced potential black bear population size by 41% to 83 1, and during the late-season it was reduced by 18% to 1259 bears.
3.4. Habitat-based population model
3.4.1. Influence of timber harvest The influence of timber harvest had on the estimated
potential black bear population on the SSA varied little by season. During the early-season, the potential popu- lation size was reduced by the current level of timber harvest from an estimated 1414 bean in the study area to 1297, an 8% reduction. We simulated an additional 50% increase in the area harvested that resulted in a de- crease in potential population size of 13%, to an esti- mate of 1236 bears. During the late-season the estimated potential population changed from 1522 to 1362 bears, an 11% reduction based on the current amount of timber harvest. The simulated timber harvest increase of 50% reduced potential population size by 16% to 1284 bears. The influence of timber harvest was not evaluated on the OSA.
3.4.2. Influence of r o d The influence of roads on the estimated potential
population size on the SSA varied by season. During
The methodology we used modeled the cumulative impacts of roads and road use levels on black bear hab- itat. During the early-season female black bears on the OSA used habitats at a variety of elevations, so that coefficients were insignificant. However on the SSA, fe- male black bear habitat use was strongly associated with low-moderate elevation forests. Traffic volume had a greater influence on the OSA where most roads were open to public access resulting in higher traffic volumes than on the SSA. On the SSA during the early-season, traffic volume had less of an influence on bear resource use but open road density was significantly and nega- tively associated with bear resource use. Traffic volumes (vehicleslh) were lower on the SSA because many of the roads were gated, however, road densities were much higher. The high density of roads greatly reduced real- ized habitat values on the SSA during the early-season. The effects of roads on habitat use by black bears have been documented in several other studies (Kasworm and
422 W.L Gaines er al. I Biological Consemtion 125 (2005) 411425
Manley, 1990; Clark et al., 1993; Kasworm and Their, 1994; Vander Heyden and Meslow, 1999).
During the late-season on the OSA, female black bear habitat use was less influenced by vegetation type (not statistically significant coefficients) but negatively im- pacted by roads. Female black bears on the OSA during the late-season appeared to be more tolerant of low use roads, but had a strong negative relationship to areas in close proximity to moderate and high use roads. On the OSA, managing roads with closures that reduce traffic volume may be an effective means of improving habitat effectiveness during the late-season.
On the SSA, vegetation types were a stronger predic- tor of female black bear use than roads. Low-moderate elevation forest and riparian forests were positively associated with female black bear use while high eleva- tion forests, deciduous forests, alpinesubalpine mead- ows, and harvest units 4 4 years old were negatively associated. On the SSA, bear hunting is done by permit during the early-season, thus reducing the potential of mortality for bears in close proximity to roads during the late-season. This may explain why female black bears were more tolerant of roads during the late- season. In addition, berry producing shrubs in timber harvest units would be an important food source in the late-season. These food resources were concentrated in areas in close proximity to roads.
The influence of roads on habitat effectiveness was not evenly distributed across the study areas (Figs. 2 and 3). On the OSA, roads had the greatest influence on habitat effectiveness on the eastern portion of the study area where road densities and traffic volumes were higher. The western portion of the study area was lar- gely composed of the Pasayten and Lake-Chelan Saw- tooth Wilderness areas and North Cascades Scenic Area and showed higher levels of habitat effectiveness (Figs. 2 and 4). On the SSA the western portion of the study area had the greatest road densities and showed the greatest reduction in habitat effectiveness (Fig. 3). The eastern third of the SSA is within the Alpine Lakes Wilderness and has higher realized habitat values, although potential habitat values are limited due to the lack of low-moderate elevation forest and riparian areas. In both study areas, the lower elevations were in close proximity to towns and consequently have exten- sive road networks and high levels of human use. Con- servation areas, such as designated wilderness areas, only provided habitat protection for high elevation areas.
Others have developed approaches to address the cumulative effects of human activities at landscape scales, including the Mahalanobis distance (Clark et al., 1993), discriminant function analysis (Capen et al., 1986), Bayesian probability (Aspinall and Veitch, 1993), proximity analysis (Breininger et al., 1991), and logistic regression (Erickson et al., 1998; Mace et al.,
1999). The method that we used, developed by Mace et al. (1999), has the advantage of easily interpreted model outputs in terms of relative probability of use. Another advantage is that RSF is not an arbitrary score, which has been used in other models (Schoen et al., 1994). In addition, logistic regression is well understood and increasingly applied to GIs data. However, stan- dardized statistical, mapping and RSF scaling methods would greatly facilitate comparisons among studied black bear populations.
Several studies have documented the effects of roads (Kasworm and Manley, 1990; Clark et al., 1993; Kas- worm and Their, 1994; Vander Heyden and Meslow, 1999) and timber harvest (Vander Heyden and Meslow, 1999; Lindzey and Meslow, 1977a) on black bear habitat use, however, we know of no other studies that have evaluated the potential effects of timber harvest and roads on estimates of potential black bear population size. Schoen et al. (1994) developed a habitat capability model for grizzly bears that evaluated the potential influences of timber harvest and roads on potential pop- ulation size. They modeled timber harvest rates and esti- mated that the grizzly bear population would decrease by 16% after 10 years and 23% after 50 years (Schoen et al., 1994). These estimates showed a greater influence of timber harvest on grizzly bear population size than our estimates for black bears.
Mladenoff et al. (1995) and Mladenoff and Sickley (1998) developed habitat-population models to predict potential wolf populations in areas being considered for wolf restoration. They found that roads were the pri- mary habitat variable that affected potential population size and gray wolf distribution. These studies provide examples of the potential conservation applications of using habitat-population models for wide-ranging carni- vores that are sensitive to human activities such as roads.
The lowest potential population estimate on the SSA was during the early-season and accounted for the cumulative influence of timber harvest and roads. This estimate of 831 black bears may best reflect the potential population of bears in the study area given the current conditions. This estimate results in a density of 0.34 bears/km2. Other estimates of black bear densities in areas with similar habitats, timber harvest, and roads ranged from 0.25 to 1.85 bears/km2 (Jonkel and Cowan, 197 1 ; Poekler and Hartwell, 1973; Lindzey and Meslow, 1977b; Davis and Harestad, 1996). Given this range of published bear densities, the density estimated produced using the habitat-based model seems reasonable for the SSA. On the OSA, we estimated a density of 0.07 bears1 krn2 using the habitat-based population model. Density estimates from other studies with similar habitats ranged from 0.1 1 to 0.36 bears/km2 (LeCount, 1982; LeCount, 1987; Beck, 1991; ODFW, 1993). Our density estimate seems low compared to these other estimates and is par-

W.L. Gaines et al. I Biological (
tially a function of the low initial estimate obtained from the WDFW. An opportunity to further evaluate the potential population estimates will arise when mark- recapture estimates based on DNA sampling are com- pleted for each study area (Pierce, 1995). Until this model is validated it is best to view this as a working hypothesis of the interactions among black bear popula- tions, timber harvest, and roads.
5. Conclusion
Our results emphasize two aspects of road access that managers need to consider. These include: (1) open road densities, which seem to have the greatest influence on where bears establish their home ranges (Young and Beecham, 1986; Brody and Pelton, 1989; Beecham and Rohlman, 1994), and (2) traffic volumes, which can influence the relative probability of use of a given land- scape feature. Either or both of these variables can be managed to influence resource use by black bears. Man- agers can easily influence habitat effectiveness for bears through road closures that reduce open road densities and limit traffic volume.
This modeling approach has the potential to develop habitat-based population viability analyses (PVA) (Boyce and McDonald, 1999), which could have many conservation applications. Boyce (1995), in his review of PVA models for grizzly bears, concluded that an assessment of the long-term viability of grizzly bear pop- ulations is not possible until PVA models interface with habitat, a problem common to PVAs for other species as well (Akcakaya et al., 1995; Beissinger and Westphal, 1998; Roloff and Haufler, 2002; Weilgus, 2002). Eventu- ally, this approach may provide managers with a tool to evaluate the influence of human activities on potential population size. Human activities could be evaluated on an individual basis or by considering their cumulative effects. Currently, most cumulative effects models assess changes to habitat effectiveness (Weaver et al., 1987; Gi- beau, 1998; Suring et al., 1998) but fall short of linking habitat to potential population. Ultimately, wildlife con- servation boils down to the fundamental issue of manag- ing land uses in a manner that is compatible with maintaining viable wildlife populations (Roloff and Haufler, 1997, 2002).
One method that was used to estimate the black bear population in Washington relied on habitat availability and black bear density (WDFW, 1996). Black bear den- sities reported from eastern and western Oregon (ODFW, 1993) were applied to the available habitat within eastern and western Washington to derive an overall population estimate. This method assumes an equal distribution of bears across all habitats and does not account for the influences of habitat quality and roads. Our approach could be extrapolated to other
areas of similar habitats across the state to improve upon the habitat-based population estimate. Habitat- based population estimates in conjunction with DNA- based mark-recapture studies could provide useful tools in the development of predictive models for estimation of bear population sizes (Poole et al., 2001).
The methods that we applied forge a link between the landscape ecology and population biology of black bears. This approach can provide a framework for the development of theory concerning the intersection of these two disciplines. The approaches described by Boyce and McDonald (1999), and the presented here, should be viewed as starting points upon which hypotheses can be proposed and tested. Ultimately, habitat-based population models would be linked to demographic parameters, such as productivity and sur- vival, to create even more powerful management tools (Roloff and Haufler, 1997, 2002; Raphael and Holthau- sen, 2002).
Acknowledgments
Funding was provided by the Washington Depart- ment of Fish and Wildlife Black Bear Project and the US Forest Service. We thank D. Munzing and G. Hol- ser for their field efforts and J. Haberberger for GIs support. We also thank J. Marzluff, J. Agee, and G. Koehler for reviews of earlier versions of this manuscript.
References
Akcakaya, H.R., McCarthy, M.A., Pearce, J.L., 1995. Linking landscape data with population viability analysis: management options for the helmeted honeyeater. Biological Conservation 73, 169-176.
Alldredge, J.R., Thomas, D.L., McDonald, L.L., 1998. Survey and comparison of methods for study of resource selection. Journal of Agricultural, Biological and Environmental Statistics 3 (3), 237- 253.
Aspinall, R.J., Veitch, N., 1993. Habitat mapping from satellite imagery and wildlife survey data using a Bayesian modeling procedure in GIs. Photogrammetric Engineering and Remote Sensing 59, 537-543.
Beck, T.D.I., 1991. Black bears of west-central Colorado. Colorado Division of Wildlife Technical Publications No. 39, 86 pp.
Beecham, J.J., Rohlman, J., 1994. A Shadow in the Forest: Idaho's Black Bear. Idaho Department of Fish and Game, Boise, and University of Idaho Press, Moscow, Idaho.
Beissinger, S.R., Westphal, M.I., 1998. On the use of demographic models of population viability in endangered species management. Journal of Wildlife Management 62, 821-841.
Boyce, M.S., 1995. Population viability for grizzly bears: a critical review. A Report to the Interagency Grizzly Bear Committee, Denver, CO.
Boyce, M.S., McDonald, L.L., 1999. Relating populations to habitats using resource selection functions. Trends in Ecology and Evolu- tion 14 (7), 268-272.

424 K L Gaines el al. I Biological
Boyce, M.S., Waller, J.S., 2003. Grizzly bears for the Bitterroot: predicting potential abundance and distribution. Wildlife Society Bulletin 31, 670-683.
Boyce, M.S., Meyer, J.S., Irwin, L.L., 1994. A habitat based PVA for the northern spotted owl. In: Fletcher, D.J., Manly, B.F. (Eds.), Statistics in Ecology and Environmental Monitoring, Otago Conference Series No. 2, University of Otago Press, pp. 63-85.
Breininger, D.R., Provancha, M.J., Smith, R.B., 1991. Mapping Florida scrub jay habitat for purposes of land-use management. Photogrammetric Engineering and Remote Sensing 57,1467-1474.
Brody, A.J., Pelton, M.P., 1989. Effects of roads on black bear movements in western North Carolina. Wildlife Society Bulletin 17, 5-10.
Capen, D.E., Fenwick, J.W., Inkley, D.B., Boynton, A.C., 1986. Multivariate models of songbird habitat in New England forests. In: Verner, J., Morrison, M.L., Ralph, C.J. (Eds.), Wildlife 2000: Modeling Habitat Relationships of Terrestrial Vertebrates. Uni- versity of Wisconsin Press, Madison, pp. 171-175.
Clark, J.D., Dunn, J.E., Smith, K.G., 1993. A multivariate model of female black bear habitat use for a geographic information system. Journal of Wildlife Management 57, 519-526.
Davis, H., Harestad, AS., 1996. Cannibalism by black bears in the Nipk i sh Valley, British Columbia. Northwest Science 70 (2), 88- 92.
Erickson, W.P., McDonald, T.L., Skinner, R., 1998. Habitat selection using GIs data: a case study. Journal of Agricultural. Biological, and Environmental Statistics 3 (3), 296-310.
Fagen, R., 1988. Population effects of habitat change: a quantitative assessment. Journal of Wildlife Management 52 (1). 4146.
Gaines, W.L., Naney, R.H., Momson, P.H., Eby, J.R., Wooten, G.F., Almack, J.A., 1994. Use of Landsat Multispectral scanner imagery and geographic information systems to map vegetation in the North Cascades grizzly bear ecosystem. International Conference on Bear Research and Management 9 (I), 533-547.
Garshelis, D.L., 1994. Densitydependent population regulation of black bears, pp. 3-14. In: Taylor, M. (Ed.), Densitydependent population regulation in black, brown and polar bears. Interna- tional Conference on Bear Research and Management Monograph Series No. 3,43 pp.
Gibeau, M.L., 1998. Grizzly bear habitat effectiveness model for Banff, Yoho, and Kootney national parks, Canada. Ursus 10, 235-241.
Hams, L.D., Kangas, P., 1988. Reconsideration of the habitat concept. Transactions of the North American Wildlife and Natural Resources Conference 53, 137-143.
Henderson, J.A., Lesher, R.D., Peter, D.H., Shaw, D.C., 1992. Field guide to the forested plant associations of the Mt. Baker-Snoqual- mie National Forest, USDA Forest Service, Pacific Northwest Region, Technical Paper, R6-ECOLTP-028-91.
Hosrner, D.W., Lerneshow, S., 1989. Applied Logistic Regression. Wiley, New York.
Jonkel, C.J., Cowan, I.McT., 1971. The black bear in the sprucefir forest. Wildlife Monograph No. 27.
Kaswonn, W.F., Manley, T., 1990. Road and trail influences on grizzly bean and black bean in northwest Montana. International Conference on Bear Research and Management 8,79-84.
Kaswom, W.F., Their, T.J., 1994. Adult black bear reproduction, survival, and mortality sources in northwest Montana. Interna- tional Conference on Bear Research and Management 9 (I), 223- 230.
Koehler, G.M., Briggs Hall, P., Norton, M.H., Pierce, D.J., 2001. Implant-versus collar-transmitter use on black bears. Wildlife Society Bulletin 29, 6 W 5 .
Lecount, A.L., 1982. Characteristics of a central Arizona black bear population. Journal of Wildlife Management 46, 861-868.
LeCount, A.L., 1987. Characteristics of a northern Arizona black bear population. Federal Aid in Wildlife Restoration Project W-76-R, Final Report, 26 pp.
Lillybridge, T.R., Kovalchick, B.L., Williams, C.K., Smith, B.G., 1995. Field guide for forested plant agpociations of the Wenatchee National Forest. USDA Forest Service, Pacific Northwest Research Station, PNW-GTR-359.
Lindzey, F.G., Meslow, E.C., 1977a. Home range and habitat use by black bears in southwestern Washington. Journal of Wildlife Management 41 (3), 413-425.
Lindzey, F.G., Meslow, E.C., 197%. Population characteristics of black bears on an island in Washington. Journal of Wildlife Management 41 (3). 4 W 1 2 .
Mace, R.D., Waller, J.S., Manley, T.L., Ake, K., Wittinger, W.T., 1999. Landscape evaluation of pizdy bear habitat in Western Montana. Conservation Biology 13, 367-377.
Mace, R.D., Waller, J.S., Manley, T.L., Lyon, L.J., Zwing, H., 1996. Relationships among grizzly bears, roads, and habitat in the Swan Mountains, Montana. Journal of Applied Ecology 33, 1395-1404.
Manly, B., McDonald, L., Thomas, D., 1993. Resource Selection by Animals: Statistical Design and Analysis for Field Studies. Chap man and Hall, New York.
Menard, S.W., 1995. Applied Logistic Regression AnalysisSage University Papers Series. Sage University, Thousand Oaks, CA.
Miller, S.D., 1990. Impact of increased bear hunting on survivorship of young bears. Wildlife Society Bulletin 18, 462-467.
Mladenoff, D.J., Host, G.E., 1994. Ecological perspective: current and potential applications of remote sensing and GIs to ecosystem analysis. In: Sample, V.A. (Ed.), Remote Sensing and GIs in Ecosystem Management. Island Press, Washington, DC, pp. 219- 242.
Mladenoff, D.J., Sickley, T.A., 1998. Assessing potential gray wolf restoration in the northeastern United States: a spatial prediction of favorable habitat and potential population levels. Journal of Wildlife Management 62, 1-10.
Mladenoff, D.J., Haight, R.G., Sickley, T.A., Wydeven, A.P., 1995. A regional landscape analysis and prediction of favorable wolf habitat in the northern Great Lakes region. Conservation Biology 9,279-294.
Mladenoff, D.J., Haight, R.G., Sickley, T.A., Wydeven, A.P., 1997. Causes and implications of species restoration in altered ecosys- tems. BioScience 47, 21-31.
Momson, P.H., 2001. Bear habitat mapping in the central western .
Cascade Mountains of Washington State. Unpublished Report, Pacific Biodiversity Institute, Winthrop, Washington.
Oregon Department of Fish and Wildlife (ODFW), 1993. Oregon's black bear management plan, 1993-1998. Oregon Department of Fish and Wildlife, Portland, 37 pp.
Pierce, J., 1995. A proposal to develop black bear density estimates using DNA and hair snagging technology. Unpublished Report, Washington Department of Fish and Wildlife, Research Division, Olympia.
Poekler, R.J., Hartwell, H.D., 1973. Black bear of Washington: its biology, natural history, and relationship to forest regeneration. Washington State Department of Game, Biological Bulletin No. 14, Olympia, Washington, 180 pp.
Poole, K.G., Mowat, G., Fear, D.A., 2001. DNA-based population estimate for grizzly bears Ursus arctos in northeastern British Columbia, Canada. Wildlife Biology 7, 105-1 15.
Raphael, M.G., Holthausen, R.S., 2002. Using a spatially explicit model to analyze effects of habitat management on northern spotted owls. In: Scott, J.M. et al. (Eds.), Predicting Species Occurrences: Issues of Accuracy and Scale. Island Press, Wash- ington, DC, pp. 701-712.
Rogers, L.L., Allen, A.W., 1987. Habitat suitability index models: black bear, Upper Great Lakes Region. USDI, Fish and Wildlife Service, Biological Report No. 82.
Roloff, G.J., HauBer, J.B., 1997. Establishing population viability planning objectives based on habitat potentials. Wildlife Society Bulletin 25. 895-904.

W L Gaines et aL 1 Biological Conserwtion 125 (2Ml5) 411-425 425
Roloff, G.J., Haufler, J.B., 2002. Modeling habitat-based viability from organism to population. In: Scott, J.M. et al. (Eds.), Predicting Species Occumces: Issues of Accuracy and Scale. Island Press, Washington, DC, pp. 6 7 M 5 .
Rudis, V.A.. Tansey, J.B., 1995. Regional assessment of remote forests and black bear habitat from forest resource surveys. Journal of Wildlife Management 59, 170-180.
Ruggiero. L.F., Holthausen, R.S., Marcot, B.G.. Aubry, K.B., Thomas, J.W., Meslow, E.C., 1988. Ecological dependency: the concept and its implications for research and management. Transactions of the North American Wildlife and Natural Resources Conference 53, 115-126.
Samson, C., Huot, J., 1998. Movements of female black bears in relation to landscape vegetation type in southern Quebec. Journal of Wildliie Management 62, 718-727.
Schoen, J.W., 1990. Bear habitat management: a review and future perspective. International Conference on Bear Research and Management 8, 143-1 54.
Schoen, J.W., Flynn, R.W., Suring, L.H., Titus, K., Beier, L.R., 1994. Habitat-capability model for brown bear in southeast Alaska. International Conference on Bear Research and Management 9, 327-337.
Southwood, T.R.E., 1977. Habitat, the template for ecological strategies? Journal of Animal Ecology 46, 337-365.
Suring, L.H., Barber, K.R.,Schwartz, C.C., Bailey,T.N., Shuster, W.C., Tetreau, M.D., 1998. Analysis of cumulative effects on brown bears on the Kenai Peninsula, southantral Alaska. Ursus 10,107-117.
Vander Heyden, M., Meslow, E.C., 1999. Habitat selection by female black bears in the central Cascades of Oregon. Northwest Science 73 (4), 283-294.
Verner, J., Morrison, M.L., Ralph, C.J. (Eds.), 1986. Wildlife 2000: Modeling Habitat Relationship of Terrestrial Vertebrates. Uni- versity of Wisconsin Press, Madison.
Washington Department of Fish and Wildlife (WDFW), 1996. Environmental impact statement for the Washington state man- agement plan for black bear. Wildlife Management Program, Washington Department of Fish and Wildlife, Olympia. 274 pp.
Weaver, J.L., Escano, R.E., Winn, D.S., 1987. A framework for assessing cumulative effects on grizzly bears. North American Wildlife and Natural Resource Conference 52. 364-376.
Weilgus, R.B.. 2002. Minimum viable population and reserve s h for naturally regulated grizzly bears in British Columbia. Biological Conservation 106 (2). 381-388.
White, G.C., Garrot, R.A., 1990. Analysis of Wildlife Radio-tracking Data. Academic Press, San Diego, CA.
Young, D.D., Beecham, J.J., 1986. Black bear habitat use at Priest Lake, Idaho. International Conference on Bear Research and Management 6, 73-80.