h2020 ict calls 2014- 2015 summary results italy …...h2020 ict calls 2014 -2015 - summary results...
TRANSCRIPT
APRE 2013
www.apre.it
H2020 ICT calls 2014- 2015 Summary Results Italy Results

HORIZON 2020 – ICT calls
H2020 ICT calls 2014 -2015 - Summary results 1
Numbers of Proposals: • Submitted: 1298 • Ranked (above thresholds): 638 • Retained: 159 Quality (ranked/submitted): 49% Success (retained/submitted): 12%
Requested Grant amount (M€): • Submitted: 4.889 • Ranked: 2.485 • Retained: 572,3 Quality (ranked/submitted): 51% Success (retained/submitted) 12%
H2020 ICT-2014
H2020 ICT-2015
• Submitted: 1639 • Ranked (above thresholds): 95 • Retained: 207 Quality (ranked/submitted): 49% Success (retained/submitted): 13%
• Submitted: 5.461 • Ranked: 2.843 • Retained: 660,6 Quality (ranked/submitted): 52% Success (retained/submitted) 12%

HORIZON 2020 – ICT calls
0
200
400
600
800
1000
1200
1400
1600
1800 1681
1448 1413 1501
1014
622 742
484
357 391 287
389 329
240 212 167 163 160 88 79 58 56 53 47 39 37
H2020 ICT calls 2014 -2015 - Summary results 2 Country participation: Number of participants in submitted/ retained proposals
12.8 % Successo Medio 2014
Country Success Rate
Germany 14,3%
UK 14,7%
Italy 11,8%
Spain 10,8%
France 15,7%
HORIZON 2020 – ICT calls
0
200
400
600
800
1000
1200
1400
16001455
1305
873
1323 1268
665
398
613
329 322 229
283
158 214 184
156 127 126 84 71 66 55 38 32 25 24
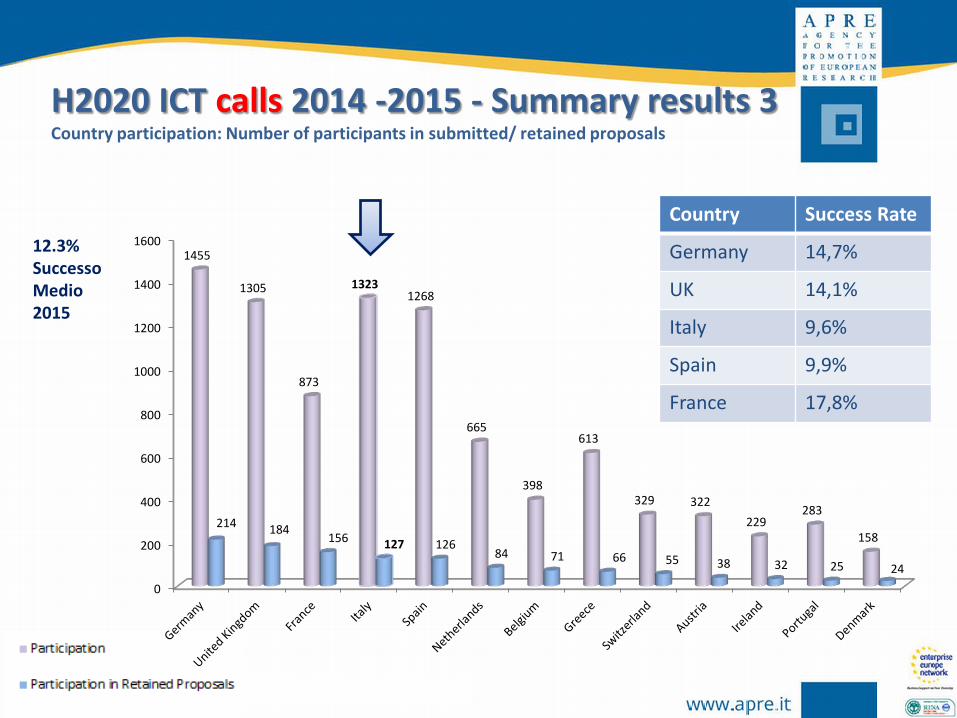
H2020 ICT calls 2014 -2015 - Summary results 3 Country participation: Number of participants in submitted/ retained proposals
12.3% Successo Medio 2015
Country Success Rate
Germany 14,7%
UK 14,1%
Italy 9,6%
Spain 9,9%
France 17,8%

HORIZON 2020 – ICT calls
H2020 ICT calls 2014 -2015 - Summary results 4 Grant Submitted and Retained in 2014 and 2015
€ -
€ 200.000.000,00
€ 400.000.000,00
€ 600.000.000,00
€ 800.000.000,00
€ 1.000.000.000,00
€ 1.200.000.000,00
€ 1.400.000.000,00
€ 1.600.000.000,00
€ 1.800.000.000,00 14,1%
13,9% 9,5% 9,3%
15%
13,1% 10,5%
15,9% 13,3% 12,8% 8%
10,1% 15,3% 12,6% 9,5%

HORIZON 2020 – ICT calls
EC Contribution in Retained proposals
Country ICT - 2015 ICT - 2014
Germany 113.972.109,99 € 116.861.442 €
United Kingdom 87.406.267,14 € 92.968.760 €
France 61.213.582,74 € 69.799.392 €
Italy 47.908.333,81 € 60.626.127 €
Spain 47.038.736,36 € 54.430.949 €
H2020 ICT calls 2014 -2015 - Summary results 5 Grant Retained

HORIZON 2020 – ICT calls
H2020-ICT-2014 Topic Total Retained Success Rate Topic Total Retained Success Rate
01: Smart CPS 156 15 9,62% 17: Language barrier 30 6 20%
02: Smart System Integration 103 10 9,71% 18: Growth Creative SMEs 85 16 18,8%
03: TOLAE 36 9 25% 21: Gamification Tech. 91 4 4,39% 05: Networks & Internet Arch. 37 7 18,92% 22: Computer Interaction 108 10 9,25% 06: Optical and wireless tech. 90 12 13,33% 23: Robotics 154 17 11%
07: Cloud Infrast. 157 23 14,64% 26: Photonics KETs 101 14 13,86%
09: SW development 75 7 9,3% 29: OLED 9 4 44,4%
11: FIRE+ 30 5 16,66% 31: Human digital age 48 5 10,4%
13: Web Entrepr. 108 10 9,25% 32: Cybersecurity 59 9 15,25% 15: Big & Open Data Innov. 106 13 12,26% 35: Entrepr. Support 55 10 18,18%
H2020 ICT calls 2014 -2015 - Summary results 6 Success Rate per Topic in 2014

HORIZON 2020 – ICT calls
H2020-ICT-2015 Topic Total Retained Success Rate
04: Low power computing 61 13 21%
08: PCP Cloud computing 3 1 33%
10: CAPS 193 24 12%
12: Facilities FIRE+ 35 10 29%
16: Big Data Research 124 10 8%
19: Tech. for creative industries 144 14 10%
20: Tech. for learning & teaching 174 12 7%
24: Robotics 193 18 9%
25: Micro- & nano- tech. 50 16 32%
27: Photonics KETs 75 14 19%
28: cross-cutting ICT KETs 51 9 18%
30: IoT 136 9 7%
36: PCP new ICT solutions 4 2 50%
38: Coop. High Income countries 10 3 30%
39: Coop. Low Income countries 45 4 9%
H2020 ICT calls 2014 -2015 - Summary results 7 Success Rate per Topic in 2015

HORIZON 2020 – ICT calls
0
500
1000
1500
2000
2500
ProposalsSubmitted2014+2015
Retained forFunding 2014 +
2015
ProposalsSubmitted2014+2015
Retained forFunding 2014 +
2015
ProposalsSubmitted2014+2015
Retained forFunding 2014 +
2015
Research & Innovation Actions Innovation Actions Coordination & Support Actions
2118
218
578
93 199
51
H2020 ICT calls 2014 -2015 - Summary results 8 Submitted/ retained proposals by type of action

HORIZON 2020 – ICT calls
0
50
100
150
200
250
300
350
400
450
DE ES UK IT FR EL BE NL IE FI NO PT SE AT
412 435
294
374
224 220
97
130
74 66 47
87
41
79 56 51 44 38 32 25 23 16 16 7 7 6 5 4
Presented 2014-15
Retained 2014-15
H2020 ICT calls 2014 -2015 - Summary results 9 Coordinators of Submitted / Retained Proposals

HORIZON 2020 – ICT calls
Total SMEs in Submitted proposals 2015
Total SMEs in retained proposals 2015
H2020 ICT 2014 Data Not Available
H2020 ICT calls 2014 -2015 – Summary results 10 SMEs participation in Submitted and Retained Proposals
2917
331
1.107 M €
114,1 M €
SME Requested Contribution 2015
SME Retained Contribution 2015
HORIZON 2020 – ICT calls
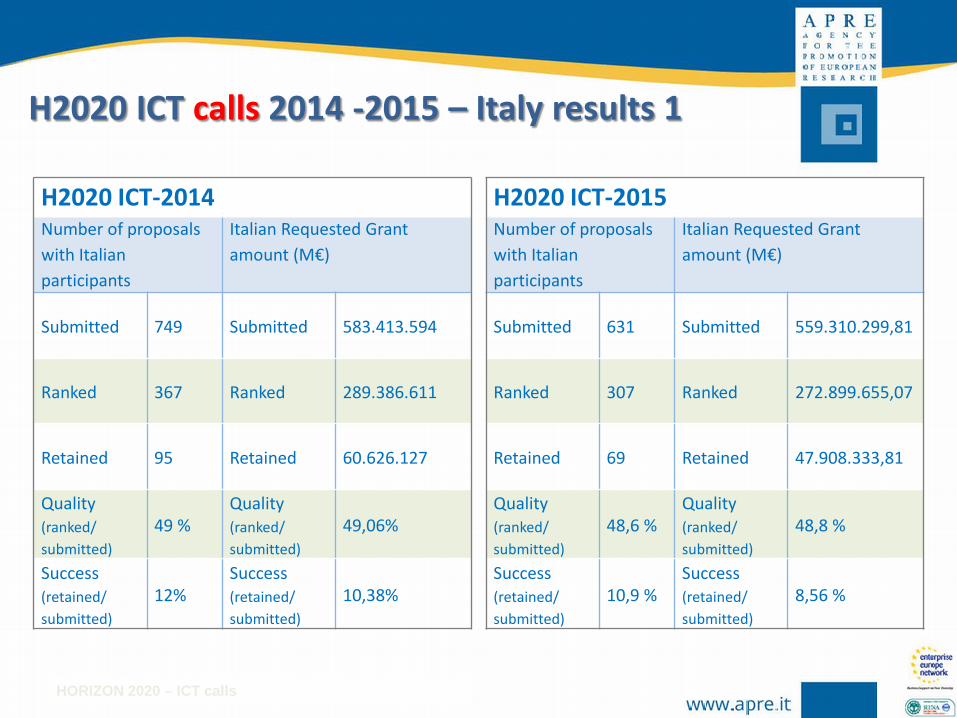
H2020 ICT-2014 Number of proposals with Italian participants
Italian Requested Grant amount (M€)
Submitted 749 Submitted 583.413.594
Ranked 367 Ranked 289.386.611
Retained 95 Retained 60.626.127
Quality (ranked/ submitted)
49 % Quality (ranked/ submitted)
49,06%
Success (retained/ submitted)
12% Success (retained/ submitted)
10,38%
H2020 ICT calls 2014 -2015 – Italy results 1
H2020 ICT-2015 Number of proposals with Italian participants
Italian Requested Grant amount (M€)
Submitted 631 Submitted 559.310.299,81
Ranked 307 Ranked 272.899.655,07
Retained 69 Retained 47.908.333,81
Quality (ranked/ submitted)
48,6 % Quality (ranked/ submitted)
48,8 %
Success (retained/ submitted)
10,9 % Success (retained/ submitted)
8,56 %

HORIZON 2020 – ICT calls
H2020 ICT calls 2014 -2015 – Italy results 2 Italian performance by ICT Topics vs. Total EC Contribution 2014
0,0% 5,0% 10,0% 15,0% 20,0% 25,0% 30,0%
01: Smart CPS
02: Smart System Integration
03: TOLAE
05: Networks & Internet Arch.
06: Optical and wireless tech.
07: Cloud Infrast.
09: SW development
11: FIRE+
13: Web Entrepr.
15: Big & Open Data Innov.
17: Language barrier
18: Growth Creative SMEs
21: Gamification Tech.
22: Computer Interaction
23: Robotics
26: Photonics KETs
29: OLED
31: Human digital age
32: Cybersecurity
35: Entrepr. Support
11,4%
2,7%
3,8%
4,2%
11,6%
11,2%
16,5%
3,3%
13,0%
5,9%
14,4%
8,8%
6,1%
7,1%
16,6%
8,6%
5,0%
28,2%
7,3%
15,6%

HORIZON 2020 – ICT calls
H2020 ICT calls 2014 -2015 – Italy results 3 Italian performance by ICT Topics vs. Total EC Contribution 2015
0,0% 2,0% 4,0% 6,0% 8,0% 10,0% 12,0% 14,0% 16,0%
04: Low power computing
08: PCP Cloud computing
10: CAPS
12: Facilities FIRE+
16: Big Data Research
19: Tech. for creative industries
20: Tech. for learning & teaching
24: Robotics
25: Micro- & nano- tech.
27: Photonics KETs
28: cross-cutting ICT KETs
30: IoT
36: PCP new ICT solutions
38: Coop. High Income countries
39: Coop. Low Income countries
7,2%
5,5%
13,4%
5,1%
7,0%
9,3%
7,0%
14,8%
3,2%
9,1%
2,5%
10,2%
0,0%
10,1%
7,0%
HORIZON 2020 – ICT calls
15
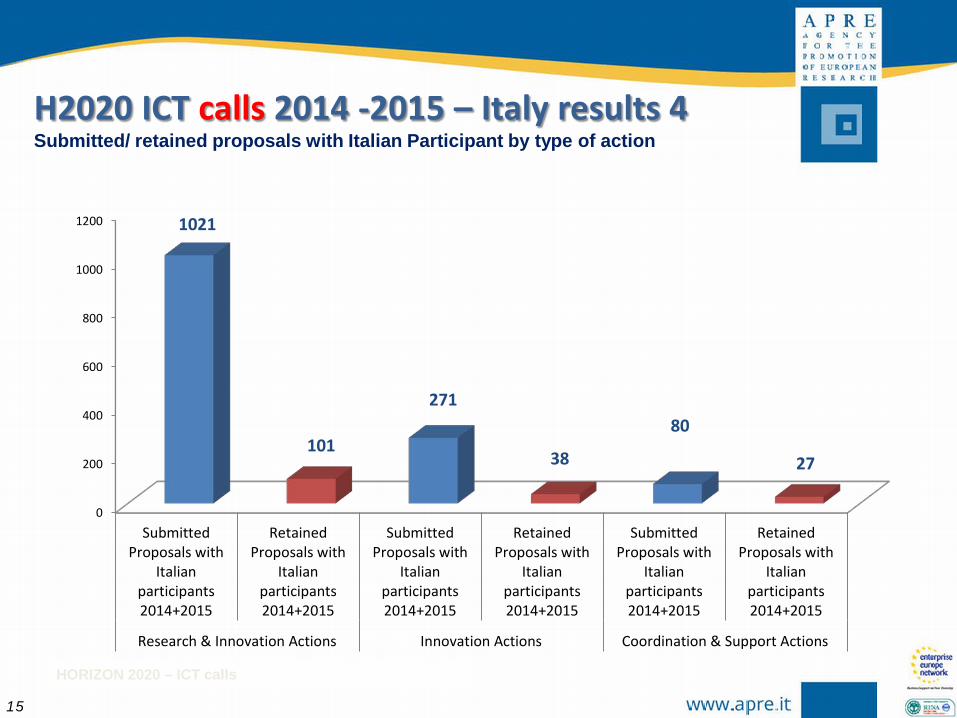
H2020 ICT calls 2014 -2015 – Italy results 4 Submitted/ retained proposals with Italian Participant by type of action
0
200
400
600
800
1000
1200
SubmittedProposals with
Italianparticipants2014+2015
RetainedProposals with
Italianparticipants2014+2015
SubmittedProposals with
Italianparticipants2014+2015
RetainedProposals with
Italianparticipants2014+2015
SubmittedProposals with
Italianparticipants2014+2015
RetainedProposals with
Italianparticipants2014+2015
Research & Innovation Actions Innovation Actions Coordination & Support Actions
1021
101
271
38
80
27

HORIZON 2020 – ICT calls
H2020 ICT calls 2014 -2015 – Italy results 5 Italian coordination
Numbers of Proposals: • Submitted: 184 • Ranked (above thresholds): 90 • Retained: 17 Quality (ranked/submitted): 48,1% Success (retained/submitted): 9,2%
Requested Grant amount (M€): • Submitted: 139.455.713 • Ranked: 68.095.347 • Retained: 12.761.143 Quality (ranked/submitted): 48,8% Success (retained/submitted) 9,15%
H2020 ICT-2014
H2020 ICT-2015
• Submitted: 190 • Ranked (above thresholds): 75 • Retained: 21 Quality (ranked/submitted): 39,47% Success (retained/submitted): 11,05%
• Submitted: 142.667.811 • Ranked: 64.635.795 • Retained: 11.944.284 Quality (ranked/submitted): 45,3% Success (retained/submitted) 8,37 %
HORIZON 2020 – ICT calls
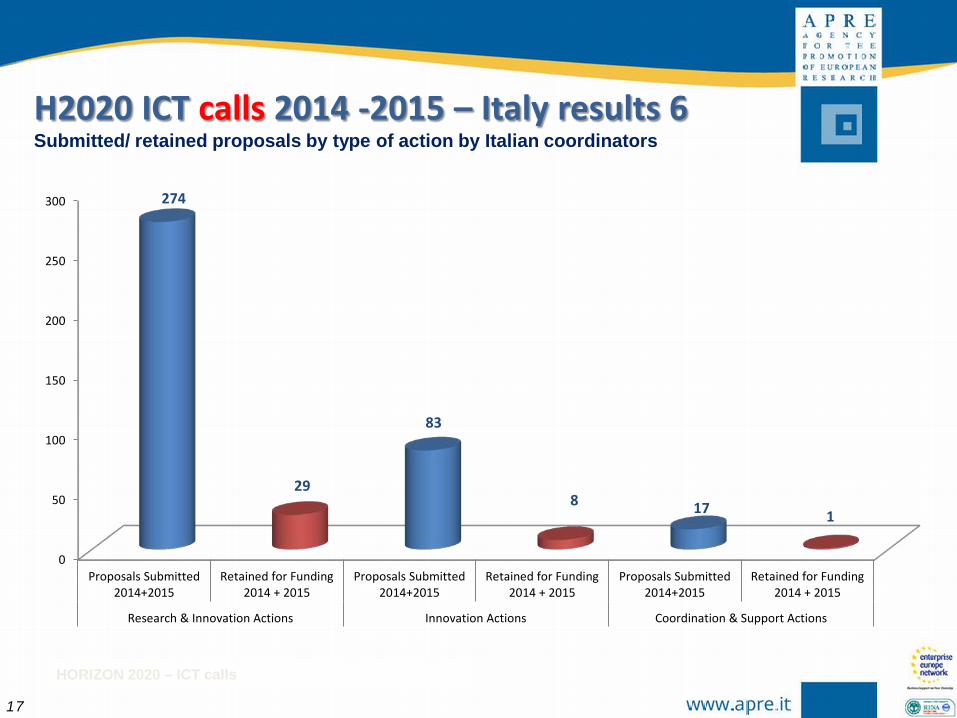
17
0
50
100
150
200
250
300
Proposals Submitted2014+2015
Retained for Funding2014 + 2015
Proposals Submitted2014+2015
Retained for Funding2014 + 2015
Proposals Submitted2014+2015
Retained for Funding2014 + 2015
Research & Innovation Actions Innovation Actions Coordination & Support Actions
274
29
83
8 17 1
H2020 ICT calls 2014 -2015 – Italy results 6 Submitted/ retained proposals by type of action by Italian coordinators

HORIZON 2020 – ICT calls
Higher Educatio
n; 10
Others; 1
Private for Profit;
7
PA; 1
Research Organisat
ions; 2
2014
2015
H2020 ICT calls 2014 -2015 – Italy results 7 Type of Institution of Italian Coordinators in Retained proposals

HORIZON 2020 – ICT calls
H2020 ICT 2014 Data Not Available
H2020 ICT calls 2014 -2015 – Italy results 8 SMEs participation in Submitted and Retained Proposals
328
26
Total Italian SMEs in Submitted proposals 2015
Total Italian SMEs in retained proposals 2015
125,116 M €
7,480 M €
Italian SMEs Requested Contribution 2015
Italian SMEs Retained Contribution 2015

HORIZON 2020 – ICT calls
Considerazioni A LIVELLO COMPLESSIVO
• Con riferimento alle proposte il tasso di successo complessivo del 1° e 2° bando ( 12,4 %)
è leggermente inferiore alla media dei tassi di successo dei bandi ICT in FP7 (13%).
• La Germania mantiene, come in FP7, la prima posizione in termini sia di proposte presentate che di contributo ricevuto, pari a 230 Milioni nel biennio 2014-15.
• La Francia ha conseguito il tasso di successo più elevato sia nella partecipazione (17,2% ) che nel funding (15%), con un miglioramento dei risultati dalla call 2014 nella call 2015. Germania e UK mantengono sostanzialmente gli stessi valori, mentre Italia e Spagna registrano una flessione di circa un punto.
• Il tasso di successo sui topics è molto diversificato. In generale i valori più elevati si registrano nei topics con obiettivi tematici più focalizzati.
• La qualità delle proposte è stata molto elevata in entrambe le call. In molti topics la differenza di score tra la prima e l’ultima proposta retained è stata di 1-2 punti e proposte molto valide sono state escluse dal finanziamento ( v. risultati delle valutazioni che saranno discussi nel pomeriggio)
• I Paesi EU 12 esprimono ancora una scarsa presentazione di proposte e rimane basso il tasso di successo (sui livelli di FP7) .
• Non sono state presentate proposte con lo schema di finanziamento Pre Commercial Procurement (2 retained 2015), Public Procurement for Innovative solutions e ERANET Cofund (1 retained 2015).
• La partecipazione delle PMI è stata elevata. Nella call 2015 Il 25,7% dei partecipanti appartenevano a PMI che hanno conseguito un tasso di successo dell’11,3% in termini di partecipazione e del 10,2% in termini di finanziamento. Valori leggermente inferiori alla media complessiva.

HORIZON 2020 – ICT calls
A LIVELLO ITALIA • La quota di finanziamento conseguito sul totale del contributo CE per le due call è stato
dell’ 8,75 %. In FP7 tale percentuale si è collocava al 10 % del contributo totale destinato dalle CE.
• A livello di topic la % di contributo conseguito rispetto al budget allocato è molto diversificata. Sembra confermarsi una debole proposizione nazionale nelle aree più strettamente collegate allo sviluppo di nuove tecnologie / tecniche di prodotti e di sistemi ( v. micro-nano, TOLAE, smart systems integration..).
• L’Italia si colloca al terzo posto come numero di proposte a coordinamento presentate. Questo rappresenta un progresso rispetto ai PQ precedenti anche il tasso di successo è ancora basso ( 9,8 %).
• E’ consistente la partecipazione, il ruolo di coordinamento e la % di contributo conseguita dalle università. Si conferma una tendenza in crescita già da FP6 e che costituisce un fattore essenziale per mantenere i ritorni nazionali tra quelli dei primi 3-4 paesi europei.
• La partecipazione italiana per tipologia di azione risulta elevata nelle Research and Innovation Actions dove si ha un tasso di successo del 9,8%, notevolmente inferiore a quello delle Innovation Actions ( 14 % , media europea 16,8%).
• Il contributo medio per partecipante italiano nelle proposte retained ( ~ 370 k€) si mantiene più basso di quello dei paesi europei più importanti. Si confermerebbe un minor volume medio di attività e minori costi unitari per i partecipanti nazionali.
• Anche la partecipazione delle PMI è stata elevata. Nella call 2015 il 24,8% dei partecipanti appartenevano a PMI, che hanno conseguito un tasso di successo del 7,9% in termini di partecipazione e del 5,9% in termini di finanziamento. Valori notevolmente inferiori alla media complessiva della call.
Considerazioni (2)