h i -rich dwarf galaxies in the hydra i cluster - i
TRANSCRIPT
ASTRONOMY & ASTROPHYSICS MAY I 1999, PAGE 539
SUPPLEMENT SERIES
Astron. Astrophys. Suppl. Ser. 136, 539–569 (1999)
H i-rich dwarf galaxies in the Hydra I cluster
I. Photometric and H i data?
P.–A. Duc1,2, P. Papaderos3, C. Balkowski4, V. Cayatte4, T.X. Thuan5, and W. van Driel6
1 Institute of Astronomy, Madingley Road, Cambridge, CB3 0HA, UK2 ESO, Karl–Schwarzschild–Str. 2, D–85748 Garching bei Munchen, Germany3 Universitats-Sternwarte, Geismarlandstr. 11, D–37083 Gottingen, Germany4 DAEC, URA 173 associee au CNRS et a l’Universite Paris 7, Observatoire de Paris, F–92195 Meudon Cedex, France5 Astronomy Department, University of Virginia, Charlottesville, VA 22903, U.S.A.6 Unite Scientifique Nancay, CNRS USR B704, Observatoire de Paris, F–92195 Meudon Cedex, France
Received December 7, 1998; accepted March 1, 1999
Abstract. We present H i, optical and near-infrared pho-tometric data of a sample of H i–selected dwarf galaxycandidates in the Hydra I cluster. This database has beencompiled in order to study environmental effects on dwarfgalaxies in clusters, in particular the role of interactionsbetween them and either the intracluster-medium or com-panion galaxies, hitherto studied mainly in massive galax-ies. The atomic gas is supposed to be very sensitive to anyexternal perturbation, as it is more extended than the stel-lar disk especially in the case of dwarf star–forming galax-ies. In that respect, the discovery of a large number of H i
sources presumably associated with dwarf galaxies in acomplete VLA survey of the Hydra I cluster by McMahon(1993) is intriguing since low-mass clouds might be veryfragile in a cluster environment. In order to understand theorigin and survival of these H i sources, we have carried outa multi–wavelength analysis of their host galaxies, whichwere all selected on 21 cm H i line widths smaller than130 km s−1. Sixteen out of the 20 candidates in the ini-tial VLA sample have been reobserved with much highervelocity resolution at Nancay. The H i detection has beenconfirmed for all of them. From the combined H i and opti-cal data, 15 objects turn out to be true dwarf galaxies; forone H i source no optical counterpart was found, and theremaining 4 galaxies are in fact face-on spirals that weretherefore rejected in our final analysis. The H i–selecteddwarf galaxies show a large diversity in their morpholo-gies and surface brightness profiles. They range from bluecompact objects to red low surface brightness galaxies.
Send offprint requests to: P.–A. Duc,e-mail: [email protected]? Based partly on observations collected at the European
Southern Observatory, La Silla, Chile (ESO Nos. 58.A-0369and 60.A-0791).
Key words: galaxies: ISM — galaxies: photometry —galaxies: dwarf — galaxies: clusters: Hydra I cluster —radio lines: galaxies
1. Introduction
It is now well known that the evolution of galaxies islargely governed by their environment. Interactions withcompanion galaxies or with the intergalactic medium mayeither enhance or inhibit their star formation and per-turb their morphology. Such effects have been studied ex-tensively for large galaxies: in particular, the strippingby the intra-cluster medium of atomic gas from clus-ter spiral galaxies (see review by Kenney 1990) and themore dramatic tidal disruption of disks during galacticcollisions (Schweizer 1998) and, in a more general sense,the morphology–density relation that may result from it(Dressler et al. 1997).
However, little is known at present about the role ofthe environment on the evolution of dwarf galaxies thoughthey represent ideal laboratories to study it, as they arenumerous and their low mass should make them verysensitive to any external perturbation. Some preliminarystudies have put forward a number of intriguing proper-ties of dwarf galaxies in clusters. Hoffman et al. (1988)found that dwarf galaxies are not more H i deficient thanspirals, while Valluri & Jog (1990) claimed that the de-ficiency actually depends on the galaxy size, with dwarfsbeing the least deficient. These are apparently surprisingresults, since the H i gas in dwarfs, especially in dwarf ir-regulars, tends to be relatively more diffuse and extendedthan in spirals. However how easily the HI will be stripped

540 P.–A. Duc et al.: Hi–rich dwarf galaxies in the Hydra I cluster. I.
Fig. 1. Locations in the Hydra I cluster of the fields imagedwith the DFOSC CCD camera. Each of the 16 rectangles cov-ers the final field of view of the co-added I–band images. Thefinal area covered by our imaging survey may thus be easilyvisualized. The numbers refer to the field ID of the findingcharts shown in Figs. 2–8. The circle indicates the location ofthe cluster core as indicated by the center of the X–ray gasdistribution and the position of the giant elliptical NGC 3311
from the galaxy depends on how much it is gravitationallybound to the stellar component and to the dark matterhalo which might be the dominant mass.
The complete, three-dimensional coverage made in H i
with the VLA of two clusters, Hydra (McMahon 1993;Valluri et al. 1999) and Hercules (Dickey 1997), has shownthe presence of H i sources not associated with previouslyidentified massive galaxies. Similar H i sources were alsofound in VLA fields centered on bright galaxies in twoother clusters, Virgo (Cayatte et al. 1990) and Coma(Bravo et al. 1999). The survival of such low-mass H i–clouds in the close environment of stripped cluster spirals,as observed in Hercules, Virgo and Coma, is puzzling.
Numerous surveys of optically selected dwarf galaxiesin nearby clusters have already been performed and werenot very conclusive as regards the role of the environment:e.g. Bothun et al. (1986); Gallagher & Hunter (1989),Impey et al. (1988) and Almoznino & Brosch (1998) inVirgo; Secker et al. (1997) and Trentham (1998) in Coma.However, most of the abovementioned works were mainlybased on the study of stellar properties which are a prioriless affected by the environment than the gas. Whenavailable, the H i data of these clusters suffer from severeincompleteness. In a cluster as close as Virgo, H i mapshave been obtained for only a limited number of galaxies.This lead us to adopt a different approach in the studyof environmental effects on dwarf galaxies, i.e., throughselection of H i sources likely to be associated with dwarfgalaxies in complete surveys of the atomic gas in clusters,and studies of the properties of their stellar counterparts.
Among the nearby clusters of galaxies, the Hydra Icluster (Abell 1060), at an adopted distance of 45 Mpc(H0 = 75 km s−1 Mpc−1), has the advantage of not beingas hugely extended over the sky as Virgo. Hence a quasi-complete radio synthesis H i survey towards this clusterwould be feasible with a reasonable amount of pointings,and has in fact been made by McMahon (1993) at theVLA. Hydra I is classified as an irregular cluster of rich-ness class 1 and morphological type III in the nomencla-ture of Bautz & Morgan (1970). This cluster, which ap-pears to have a regular structure in X–ray (Fitchett &Merritt 1988), is at first sight dynamically relaxed and itslarge spirals show apparently only moderate H i deficien-cies (Richter & Huchtmeier 1983). However, various anal-yses of the dynamics of the cluster indicate evidence ofsubstructures that could explain the lack of on-going gasstripping from the massive galaxies (Fitchett & Merritt1988; McMahon et al. 1992 and recently Valluri et al.1999). A major result of the H i survey of Hydra I byMcMahon (1993) is the discovery of numerous H i sourceslikely to be associated with low-mass galaxies.
Several optical catalogs of galaxies in Hydra have al-ready been compiled by Richter et al. (1982) [hereafterR82], Richter (1987) [R87] – updated in 1989 (Richter1989), and more recently by Hamabe (1993). However,they include galaxies brighter than V = 17 only and havetherefore missed a lot of dwarf galaxies, in particular, aswe will see, most of the optical counterparts of the faintVLA H i sources.
In this paper, we present H i line spectra andoptical/near-infrared photometric data for a sampleof H i–selected dwarf galaxies in the Hydra I cluster.The selection criteria are detailed in Sect. 2, whilethe observations made at Nancay and at ESO aredescribed in Sect. 3. Section 4 deals with the principalresults: the identification of the H i sources, a carefulsurface brightness and color profiles analysis of theirstellar counterparts and a preliminary comparison of the

P.–A. Duc et al.: Hi–rich dwarf galaxies in the Hydra I cluster. I. 541
Fig. 2. Identification chart of Field 1. The chart is composed of the co-added DFOSC I–band images obtained at the location ofField 1. The galaxies detected in H i with the VLA (McMahon 1993) are identified with black labels. Several H i–poor galaxiesthat appear to be companions to the H i-detected dwarf galaxies are also indicated with white labels. The bar at the bottomindicates a scale of 2′ or 26 kpc at the adopted distance of Hydra I. North is to the top and East to the left

542 P.–A. Duc et al.: Hi–rich dwarf galaxies in the Hydra I cluster. I.
Fig. 3. Identification chart of Field 2 (see Fig. 2 for details)
structural properties of the Hydra dwarfs with other fieldand cluster dwarf galaxies. Finally, in Sect. 5 notes onindividual objects in the sample are presented. Long-slitspectroscopic data obtained in March 1998 with the ESO3.6 m telescope will be presented in Paper II (Duc et al.,in preparation) whereas the general discussion on theenvironmental effects on the H i–detected Hydra dwarfswill be the subject of another paper of these series.
2. The sample selection
The originality of the present study mainly resides in theselection criteria used and the completeness of our sam-ple. Our H i–selected sample has been extracted from thecatalog of H i sources in the Hydra I cluster compiled byMcMahon (1993) using VLA mapping. The H i observa-tions are also described in detail by Valluri et al. (1999).McMahon’s survey covered the area of the Hydra clustercore with a series of 26 hexagonally positioned pointings.At each pointing the entire radial velocity range of thecluster was covered. Seventy percent of the cluster corevolume has thus been imaged. The spatial resolution in theVLA C/D configuration was 45′′ and the velocity resolu-tion was 42 km s−1. The 5σ sensitivity of the observationsvaried between 2.5 107 M� and 1.1 108 M� per 42 km s−1
wide channel for unresolved objects, with column densi-ties in the range 2.4 1019 − 1.3 1020 cm−2 (Valluri et al.1999).
We initially selected for our catalog all objects with a21 cm line width below 130 km s−1, as objects with such
narrow H i lines are good dwarf candidates. The ratherlow velocity resolution of the VLA, 42 km s−1, degradesthe rigor of this selection criterion, though. Nevertheless,our new 21 cm line observations obtained at Nancay witha considerably higher velocity resolution, 15 km s−1, haveconfirmed the narrowness of the H i lines in almost all cases(see Sect. 4.1). Among the 23 H i–preselected galaxies, 3bright face-on spiral galaxies could already be excludedafter inspection of their images in the Digital Sky Survey.The coordinates and, when available, the optical identifi-cation in the NED and LEDA databases of the 20 objectsof our primary list are indicated in Table 1. The originalVLA H i data from McMahon (1993), used for our sampleselection, are given in Table 2, where it should be notedthat her quoted VLA line width is not a strictly measuredphysical parameter, but only the velocity coverage of theline channels in which a particular object was detected.This is roughly equivalent to the width at 20% of the peakflux density value.
We will see in Sect. 4 that, based on morphological andnew H i data, 4 galaxies in this list cannot be classified asdwarf galaxies and/or do not meet the velocity width crite-ria. Moreover, one H i source has no optical counterpart.Therefore our final list includes 15 H i–selected objectsthat we confirmed to be dwarf galaxies. These are theobjects listed in the first part of Tables 1–3. They haveintegrated 21 cm line fluxes ranging from 0.16 Jy km s−1
to 1.36 Jy km s−1.

P.–A. Duc et al.: Hi–rich dwarf galaxies in the Hydra I cluster. I. 543
Table 1. Primary list of H i-selected dwarf galaxy candidates in the Hydra cluster
Name Identification RA DEC FieldNED/LEDA (J2000)
H1031− 2818 PGC 31270 [R87] 10:34:16.6 −28:34:04 2H1031− 2632 10:34:20.7 −26:47:31 3H1032− 2638 10:34:40.5 −26:54:33 3H1032− 2722 10:34:56.1 −27:38:25 1H1033− 2707 10:35:21.7 −27:23:27 1H1033− 2642 10:35:41.1 −26:58:21 3H1033− 2722 10:35:46.8 −27:38:50 1H1034− 2558 CTS 1015; M02.13 10:36:54.8 −26:14:27 5H1034− 2758 PGC 31541 [R82] 10:37:19.8 −28:14:19 6H1035− 2756 10:37:38.8 −28:12:25 6H1035− 2605 10:37:41.0 −26:20:56 5H1035− 2502 10:37:51.3 −25:18:07 4H1035− 2740 10:38:11.9 −27:56:15 6H1038− 2733 10:40:26.4 −27:48:53 7H1038− 2730 10:40:58.8 −27:45:47 7
H1031− 2734 ESO 436− G038 10:33:53.8 −27:49:47 1H1032− 2819 — 10:35:10.1 −28:34:56 2H1033− 2726 ESO 501− G022 10:35:21.7 −27:41:45 1H1033− 2506 ESO 501− G032 10:36:22.2 −25:22:35 4H1034− 2553 LEDA 155460 [R82] 10:36:50.8 −26:09:18 5
The coordinates correspond to the center of the optical counterparts exceptfor H1032-2819 whose coordinates are taken from the H i catalog of McMahon(1993).
Table 2. H i data of the primary list dwarf galaxy candidates
— VLA — — Nancay —Name VHI Width
∫Sdv VHI W50 W20
∫Sdv rms
km s−1 km s−1 Jy km s−1 km s−1 km s−1 km s−1 Jy km s−1 mJy
H1031− 2818 3578 84 0.31 ± 0.13 3590 87: 102: 0.47 1.3H1031− 2632 4297 ≤42 0.28 ± 0.05 4326 68 81 0.37 1.6H1032− 2638 4509 128 0.38 ± 0.07 — — — — —H1032− 2722 3018 ≤42 0.33 ± 0.09 3021 49 83 0.90 2.7H1033− 2707 3144 126 0.81 ± 0.08 3147 82 116 1.20 2.9H1033− 2642 2598 126 0.64 ± 0.09 2599 88 104: 1.10 2.1H1033− 2722 4764 128 1.36 ± 0.13 4747 94 110 1.53 2.9H1034− 2558 3634 84 0.24 ± 0.09 — — — — —H1034− 2758 3469 127 0.86 ± 0.17 3468 107 136 0.96 2.7H1035− 2756 4700 85 0.80 ± 0.11 4715 55 94 1.30 2.4H1035− 2605 3719 84 0.16 ± 0.04 — — — — —H1035− 2502 4040 84 0.41 ± 0.08 4008 59 88 0.50 2.7H1035− 2740 2872 84 0.31 ± 0.07 — — — — —H1038− 2733 4335 ≥84 ≥ 0.97 ± 0.14 4346 57 67 1.04 3.2H1038− 2730 3996 127 0.97 ± 0.21 4037 155 173 1.28 2.3
H1031− 2734 2724 126 1.22 ± 0.30 2755 186 208 2.11 2.9H1032− 2819 3304 ≤42 0.44 ± 0.10 3280 95 120: 0.96 2.8H1033− 2726 2892 ≥126 2.00 ± 0.23 2891 168 194 1.94 2.4H1033− 2506 4019 127 1.25 ± 0.17 4018 103 170 2.00 2.7H1034− 2553 3655 126 2.42 ± 0.17 3651 78 109 3.84 3.1
VLA data: from McMahon (1993), whose Width is roughly equivalent to W20.The velocities are heliocentric and in the optical convention.

544 P.–A. Duc et al.: Hi–rich dwarf galaxies in the Hydra I cluster. I.
Table 3. Total effective exposure times in minutes
Name Photometric BandB I K′
H1031− 2818 30 30 18H1031− 2632 30 30 25H1032− 2638 30 30 39H1032− 2722 30 30 48H1033− 2707 30 30 35H1033− 2642 30 30 16H1033− 2722 30 30 –H1034− 2558 30 30 35H1034− 2758 15 12 20H1035− 2756 30 30 –H1035− 2605 15 22 13H1035− 2502 30 30 –H1035− 2740 15 15 13H1038− 2733 30 30 5H1038− 2730 15 15 60
H1031− 2734 30 30 –H1032− 2819 15 22 –H1033− 2726 30 30 –H1033− 2506 30 30 –H1034− 2553 30 30 –
3. Observations and data reduction
3.1. Nancay HI observations
During the period November 1997 – November 1998 weobtained, with the Nancay decimetric radio telescope 21-cm, H i line spectra of 19 Hydra cluster galaxies, including16 objects from our primary list (see Table 2), as well as3 spirals close to the sample objects. The remaining 4VLA sources from our primary list were considered tooweak for detection at Nancay, given the data published byMcMahon (1993). Separate observations were also madewith pointing centers around the H i source without anoptical counterpart, H1032−2819, in order to confirm theweak VLA detection.
The Nancay telescope is a meridian transit-type instru-ment with an effective collecting area of roughly 7000 m2
(equivalent to a 94-m parabolic dish). Due to the elon-gated geometry of the telescope, at 21-cm wavelength ithas a half-power beam width of 3′.6 E-W × 22′ N-S at thedeclination of the Hydra cluster. Tracking was generallylimited to about 45 minutes per source. Typical systemtemperatures were ∼40 K.
We obtained our observations in total power (position-switching) mode using consecutive pairs of two-minute on-and two-minute off-source integrations. Off-source integra-tions were taken at approximately 20′ E of the target po-sition. The 1024 channel autocorrelator was divided intotwo pairs of cross-polarized (H and V ) receiver banks,each with 512 channels and a 6.4 MHz wide bandpass. Thisyielded a channel spacing of 2.64 km s−1, for an effectivevelocity resolution of ∼3.3 km s−1 at 21 cm. The center
frequencies of the two banks were tuned to the knownredshifted H i frequency of the target, as measured at theVLA by McMahon (1993). Total integration times wereabout 5 to 6 hours for most galaxies, but shorter for someof the stronger spirals and longer for the faintest objects.
We reduced our H i spectra using the standard Nancayspectral line reduction packages available at the Nancaysite. With this software we subtracted baselines (gener-ally third order polynomials), averaged the two receiverpolarizations, and applied a declination-dependent con-version factor to convert from units of Tsys to flux den-sity in mJy. The Tsys-to-mJy conversion factor is deter-mined via a standard declination-dependent calibrationrelation established by the Nancay staff through regularmonitoring of strong continuum sources. This procedureyields a calibration accuracy of ∼10%. In addition, we ap-plied a flux scaling factor of 1.26 to our spectra based onstatistical comparisons of recent Nancay data on strong,compact spiral galaxies unresolved by the telescope beam(Matthews et al. 1998) with past observations made atNancay and elsewhere.
3.2. Optical imaging
We carried out optical imaging observations in February1997 with the Danish 1.5 meter telescope at La Silla obser-vatory. We used the DFOSC optical camera which offersa large field of view of 13.′7 × 13.′7. The detector was aLORAL 2k × 2k CCD with a pixel size of 0.′′39.
Images through the Bessel B and Gunn I filters wereobtained for sixteen individual positions in 7 distinct fieldsof Hydra I containing the 20 H i sources of the primary list.The location of these fields in the cluster are indicated inFig. 1, the field number of each source is given in Col. 5of Table 1 and the identification charts of the 7 fields arepresented in Figs. 2–8. For most objects,B–band observa-tions consisted of two individual exposures of 900 s each,whereas I–band observations consisted of 4 individual ex-posures of 450 s each. However, due to time constraints,some fields were observed with a lower total exposure time,as indicated in Table 3. Offsets of 10′′ for the observationsin the B–band and 30′′ for the I–band were performed be-tween each exposure. Several standard stars from the fieldsof Landolt (1992) were observed throughout the nights.Weather conditions were photometric.
Standard data reduction was performed using the cc-
dred package in IRAF. A median image had to be pro-duced from adjacent I–band images, by which the origi-nal images were divided in order to remove the prominentfringes seen in the I–band. The reduced frames were thenco-added with a shift-and-add method. The flux calibra-tion has been performed from photometric transformationequations, whose coefficients, i.e., zero-points, color andextinction terms, were determined from our standard starsobservations. The astrometry of all images has been car-ried out with guide stars from the USNO catalog, queried
P.–A. Duc et al.: Hi–rich dwarf galaxies in the Hydra I cluster. I. 545
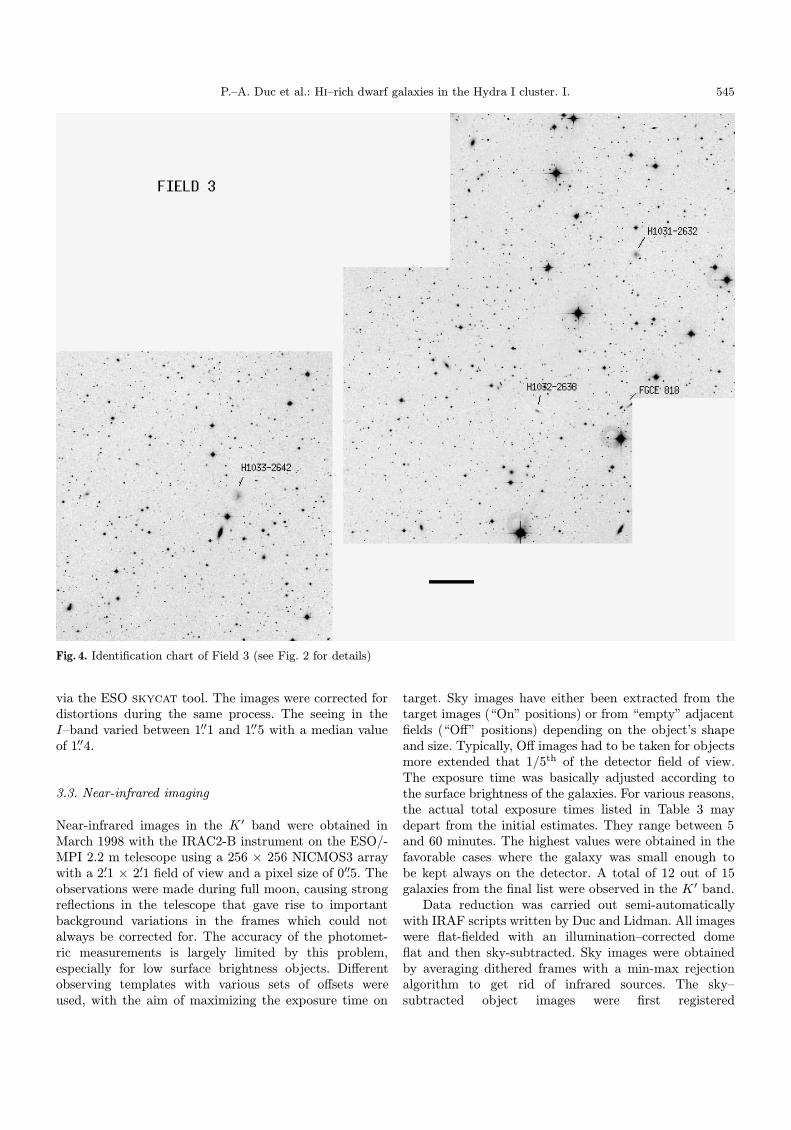
Fig. 4. Identification chart of Field 3 (see Fig. 2 for details)
via the ESO skycat tool. The images were corrected fordistortions during the same process. The seeing in theI–band varied between 1.′′1 and 1.′′5 with a median valueof 1.′′4.
3.3. Near-infrared imaging
Near-infrared images in the K ′ band were obtained inMarch 1998 with the IRAC2-B instrument on the ESO/-MPI 2.2 m telescope using a 256 × 256 NICMOS3 arraywith a 2′.1 × 2′.1 field of view and a pixel size of 0′′.5. Theobservations were made during full moon, causing strongreflections in the telescope that gave rise to importantbackground variations in the frames which could notalways be corrected for. The accuracy of the photomet-ric measurements is largely limited by this problem,especially for low surface brightness objects. Differentobserving templates with various sets of offsets wereused, with the aim of maximizing the exposure time on
target. Sky images have either been extracted from thetarget images (“On” positions) or from “empty” adjacentfields (“Off” positions) depending on the object’s shapeand size. Typically, Off images had to be taken for objectsmore extended that 1/5th of the detector field of view.The exposure time was basically adjusted according tothe surface brightness of the galaxies. For various reasons,the actual total exposure times listed in Table 3 maydepart from the initial estimates. They range between 5and 60 minutes. The highest values were obtained in thefavorable cases where the galaxy was small enough tobe kept always on the detector. A total of 12 out of 15galaxies from the final list were observed in the K ′ band.
Data reduction was carried out semi-automaticallywith IRAF scripts written by Duc and Lidman. All imageswere flat-fielded with an illumination–corrected domeflat and then sky-subtracted. Sky images were obtainedby averaging dithered frames with a min-max rejectionalgorithm to get rid of infrared sources. The sky–subtracted object images were first registered

546 P.–A. Duc et al.: Hi–rich dwarf galaxies in the Hydra I cluster. I.
Fig. 5. Identification chart of Field 4 (see Fig. 2 for details)
Fig. 6. Identification chart of Field 5 (see Fig. 2 for details)

P.–A. Duc et al.: Hi–rich dwarf galaxies in the Hydra I cluster. I. 547
Fig. 7. Identification chart of Field 6 (see Fig. 2 for details)
548 P.–A. Duc et al.: Hi–rich dwarf galaxies in the Hydra I cluster. I.
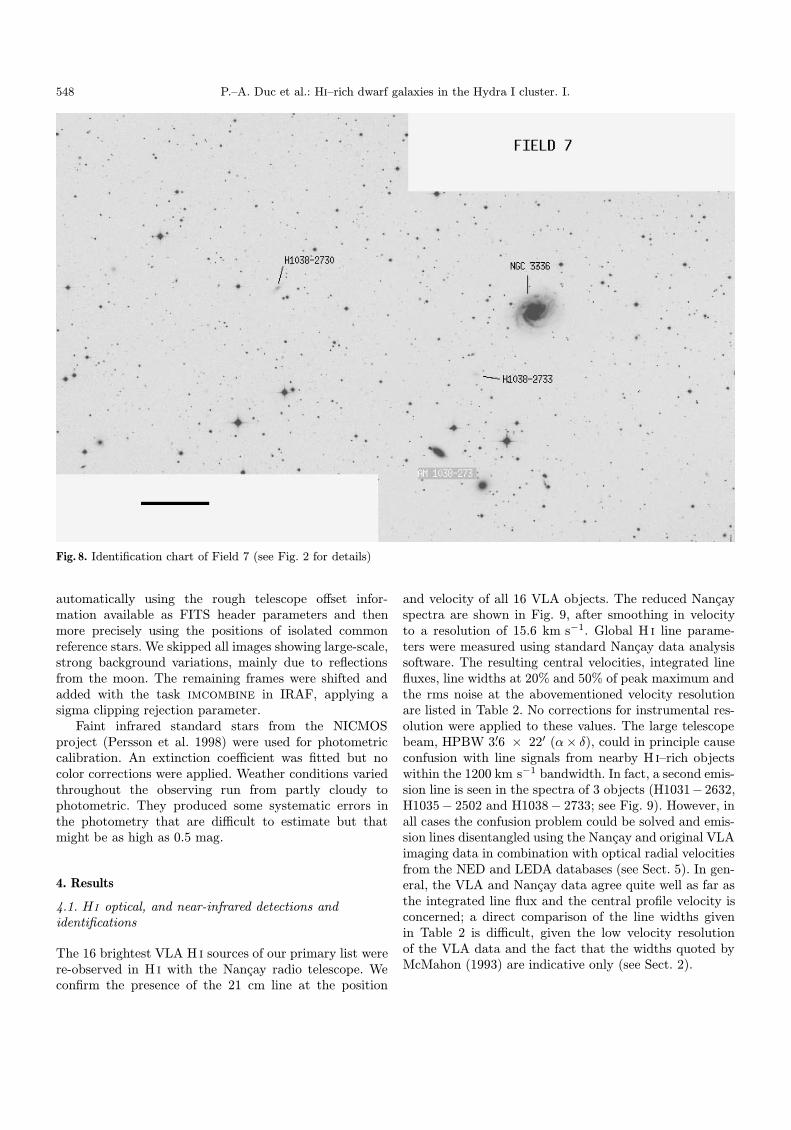
Fig. 8. Identification chart of Field 7 (see Fig. 2 for details)
automatically using the rough telescope offset infor-mation available as FITS header parameters and thenmore precisely using the positions of isolated commonreference stars. We skipped all images showing large-scale,strong background variations, mainly due to reflectionsfrom the moon. The remaining frames were shifted andadded with the task imcombine in IRAF, applying asigma clipping rejection parameter.
Faint infrared standard stars from the NICMOSproject (Persson et al. 1998) were used for photometriccalibration. An extinction coefficient was fitted but nocolor corrections were applied. Weather conditions variedthroughout the observing run from partly cloudy tophotometric. They produced some systematic errors inthe photometry that are difficult to estimate but thatmight be as high as 0.5 mag.
4. Results
4.1. HI optical, and near-infrared detections andidentifications
The 16 brightest VLA H i sources of our primary list werere-observed in H i with the Nancay radio telescope. Weconfirm the presence of the 21 cm line at the position
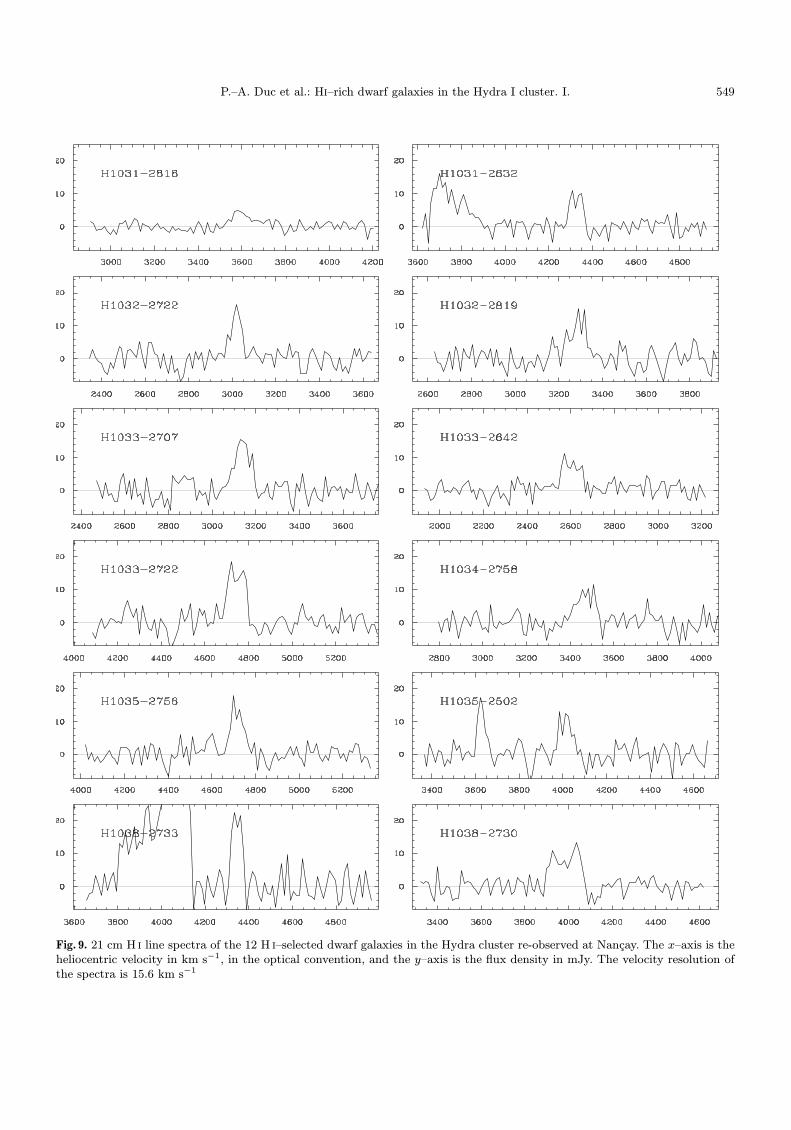
and velocity of all 16 VLA objects. The reduced Nancayspectra are shown in Fig. 9, after smoothing in velocityto a resolution of 15.6 km s−1. Global H i line parame-ters were measured using standard Nancay data analysissoftware. The resulting central velocities, integrated linefluxes, line widths at 20% and 50% of peak maximum andthe rms noise at the abovementioned velocity resolutionare listed in Table 2. No corrections for instrumental res-olution were applied to these values. The large telescopebeam, HPBW 3′.6 × 22′ (α× δ), could in principle causeconfusion with line signals from nearby H i–rich objectswithin the 1200 km s−1 bandwidth. In fact, a second emis-sion line is seen in the spectra of 3 objects (H1031− 2632,H1035− 2502 and H1038− 2733; see Fig. 9). However, inall cases the confusion problem could be solved and emis-sion lines disentangled using the Nancay and original VLAimaging data in combination with optical radial velocitiesfrom the NED and LEDA databases (see Sect. 5). In gen-eral, the VLA and Nancay data agree quite well as far asthe integrated line flux and the central profile velocity isconcerned; a direct comparison of the line widths givenin Table 2 is difficult, given the low velocity resolutionof the VLA data and the fact that the widths quoted byMcMahon (1993) are indicative only (see Sect. 2).
P.–A. Duc et al.: Hi–rich dwarf galaxies in the Hydra I cluster. I. 549
Fig. 9. 21 cm H i line spectra of the 12 H i–selected dwarf galaxies in the Hydra cluster re-observed at Nancay. The x–axis is theheliocentric velocity in km s−1, in the optical convention, and the y–axis is the flux density in mJy. The velocity resolution ofthe spectra is 15.6 km s−1

550 P.–A. Duc et al.: Hi–rich dwarf galaxies in the Hydra I cluster. I.
Fig. 10. Nancay H i spectra at various positions around H1032 − 2819, a VLA-H i source for which we found no clear opticalcounterpart. In the finding chart of the field (Fig. 3) we identified other sources in the vicinity that may in principle contributeto the emission line seen towards H1032 − 2819: ESO 436 − G046, 4.′3 to the West and ESO 436 − IG042 7.′2 to the West ofH1032 − 2819. The optical centers of these two ESO galaxies were used as pointing centers for the Nancay H i spectra shownhere; the spectra labeled 2E and 2W were taken with pointing centers 2′ East and West, respectively, of the VLA H i source.Clearly the reality of the H i detection of H1032-2819 suffers no ambiguity
Fig. 11. Nancay H i spectra of 4 other galaxies that missed our dwarf galaxy selection criteria; see Fig. 9 for details
We found an optical counterpart to all but one of our20 primary targets – at the location of the H i sourceH1032 − 2819 no extended stellar object was found, toan I–band surface brightness limit of 25 mag arcsec−2
(see Fig. 3). The closest optical object is a faint galaxyseen in the I–band 7′′ East of the central position ofH1032 − 2819 and undetected in the B–band; it is mostlikely a red background galaxy. H1032 − 2819 is 4.′3 and134 km s−1 in radial velocity away from an H i–rich spi-ral galaxy, ESO 436 − G046. In the VLA data, this sourceis only a ∼ 4σ detection in a single channel map, butour Nancay observations pointed towards H1032 − 2819,
ESO 436 − G046 and two positions 2′ East and West ofH1032 − 2819 (see Figs. 3 and 10) confirmed the realityof this H i source: it cannot be a sidelobe detection as itsvelocity does not match with that of any of the closebysources. These observations will be discussed in a futurePaper in these series.
Three candidate dwarf galaxies of the primary listappear on the CCD images as small face-on spirals:H1031− 2734 (= ESO 436 − G038; Fig. 2), H1033− 2506(= the barred spiral ESO 501 − G032; Fig. 5) andH1034 − 2553 (included in the catalog of Richter et al.(1982), where it was misidentified as ESO 501 − G040,

P.–A. Duc et al.: Hi–rich dwarf galaxies in the Hydra I cluster. I. 551
Fig. 12. B–band images of the 15 H i–selected dwarf galaxies in the Hydra I cluster displayed with the same spatial and intensityscales. The galaxies are ordered according to their integrated B− I color index, with the bluest objects displayed at the top leftand the reddest at the bottom right. The lowest contour is 24.5 mag arcsec−2 and the interval is 0.5 mag. Note the diversity ofthe morphologies, ranging from compact objects to large low-surface brightness galaxies

552 P.–A. Duc et al.: Hi–rich dwarf galaxies in the Hydra I cluster. I.
Fig. 13. K′– band images of the 12 dwarf galaxies observed at 2.2 µm wavelength. The images have been smoothed with acircular Gaussian function and calibrated. The surface brightness levels of the overlayed contours in mag arcsec−2 are given atthe bottom of each image. The arrows indicate the position of the dwarf galaxies in ambiguous cases. The size of each image is1′ × 1′. North is up and East left

P.–A. Duc et al.: Hi–rich dwarf galaxies in the Hydra I cluster. I. 553
Fig. 14. H1031 − 2818. (top-left) I–band image. The thick contour shows the extent of the galaxy at the Galactic extinction-corrected I surface brightness level of 23 mag arcsec−2. Contour levels are separated by 0.5 mag. (top-right): B − I map of thegalaxy. The overlayed contours correspond to the B-band image. (bottom-left) Surface brightness profiles in B (filled circles),I (open circles) and K′ (triangles). The vertical error bars correspond to 2σ uncertainties. The FWHM of point sources isindicated by vertical lines of decreasing thickness for B, I and K′, respectively. The B-band SBP is decomposed into an LSBcomponent (thick curve) plus the luminosity excess above the LSB profile (small circles). The luminosity of the LSB componentcan be described by a modified exponential distribution with (b, q) = (1.8, 0.65). (bottom-right) Radially averaged B − I profile
however; see Fig. 5). Another galaxy with a more ir-regular morphology, H1033 − 2726 (ESO 501 − G022;Fig. 2), turns out to have an H i width (FWHM 168km s−1) considerably larger than the 130 km s−1 limitof our initial selection. The latter four objects havetherefore all been excluded from further analysis. Onegalaxy, H1038 − 2730, with an H i line width (FWHM155 km s−1) exceeding slightly our selection criterionhas nevertheless been kept in the sample as its absolutemagnitude (MB = −15.8) lies clearly within the range ofdwarf galaxies.
Among the 15 remaining dwarf galaxies, only 3 werealready listed as catalogued elsewhere in the NED andLEDA databases (see Table 1): H1031 − 2818 as [R87]
103156.2 − 281833, PGC 31270 (Richter & Huchtmeier1987; Paturel et al. 1989), H1034 − 2558 as CTS 1015,M02.13 (Maza et al. 1991; Pena et al. 1991) and H1034−2758 as [R82] 103458.9−275843, PGC 31541 (Richter et al.1982; Paturel et al. 1989). The calibrated images of all ob-jects in our final list are shown in Figs. 14 to 28, and athumbnail picture representation of all objects is displayedin Fig. 12. In the near-infrared K ′ band, 5 galaxies out ofthe 12 observed were detected clearly, 4 only marginallyand 3 not at all (see Fig. 13). Limiting factors for detec-tion were the central surface brightness of the galaxies aswell as the stability of the sky background and, in general,weather conditions.

554 P.–A. Duc et al.: Hi–rich dwarf galaxies in the Hydra I cluster. I.
Fig. 15. H1031 − 2632. (top-left) I–band image. The thick contour shows the extent of the galaxy at the Galactic extinction-corrected I surface brightness of 23 mag arcsec−2. Contour levels are separated by 0.5 mag. (top-right): B−I map of the galaxy.The overlayed contours correspond to the B-band image. (bottom-left) Surface brightness profile in B (filled circles) and I (opencircles), corrected for Galactic extinction. The vertical error bars correspond to 2σ uncertainties. The FWHM of point sourcesis indicated by the vertical thick and thin lines for B and I, respectively. (bottom-right) Radially averaged B − I profile
4.2. Surface brightness profiles
Surface brightness profiles (SBPs) were computed for theB and I–bands following Papaderos et al. (1996ab), anddisplayed in Figs. 14 to 28 for the 15 dwarfs of our finallist. The SBPs were corrected for foreground Galactic ab-sorption. The extrapolated central surface brightness µ0
and exponential scale length α of the low surface bright-ness (LSB) disk component were derived from linear fitsto the outer parts of each profile, weighted by the photo-metric uncertainties of each point. For three galaxies withsufficiently high surface brightness, an SBP could be de-rived in the K ′ band with the same method as used in theoptical. It should be noted that the errors indicated forthe K ′ profiles are purely statistical and do not take intoaccount the systematic errors indicated above. Relevantphotometric properties of the observed galaxy sample,
corrected for foreground Galactic absorption, are listedin Table 4. Column 3 contains the extrapolated centralsurface brightness of the LSB disk component in units ofmag arcsec−2 and Col. 4 the exponential disk scale lengthin pc. Columns 5 and 6 list the apparent luminosity anddimension of each dwarf determined at the surface bright-ness level of 25 mag arcsec−2. Column 7 contains the totalapparent luminosity of each dwarf, as determined from acombination of numerical integration of each SBP out tothe outermost point and the flux measurements withinpolygonal apertures, with contaminating foreground ob-jects screened out. For K ′, the total magnitude, whichcould be determined for 5 objects only, has been measuredwithin a polygonal aperture. Column 8 lists the effectiveradius for each profile in kpc, and Col. 9 the concentra-tion index CI, defined, after James (1991), as log(r80/r20),where r80 and r20 denote the radii within which 80% and
P.–A. Duc et al.: Hi–rich dwarf galaxies in the Hydra I cluster. I. 555
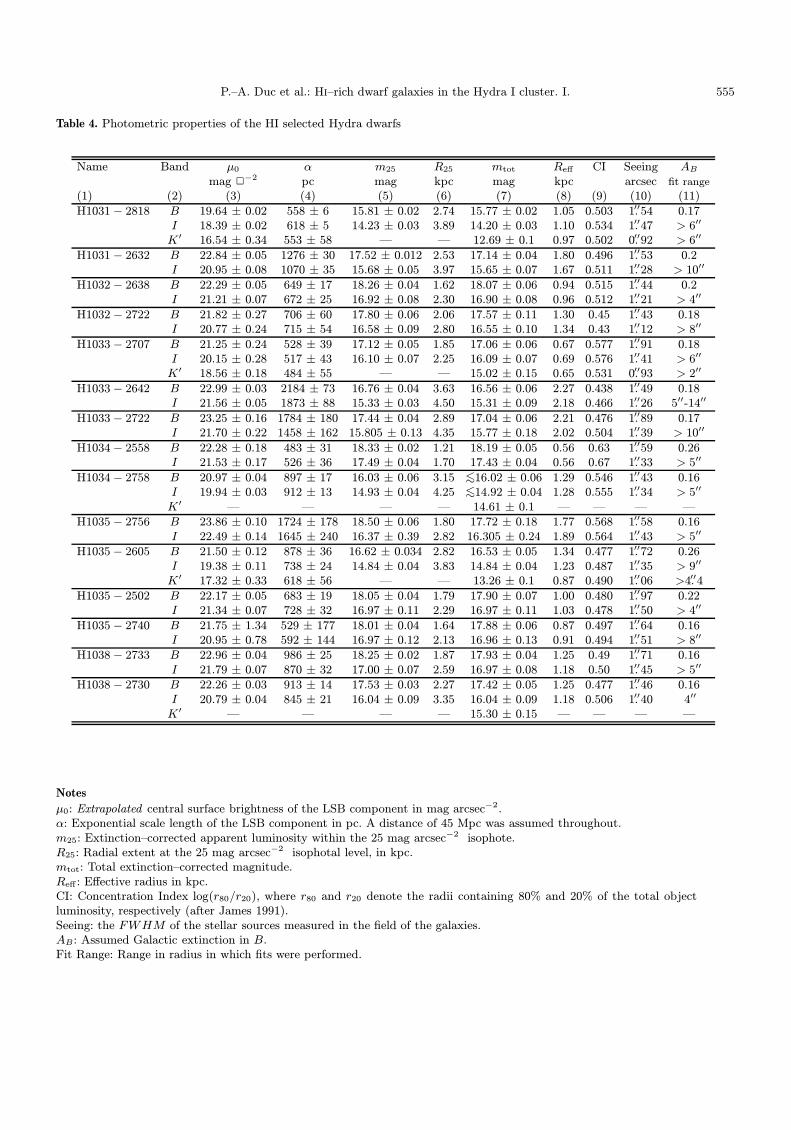
Table 4. Photometric properties of the HI selected Hydra dwarfs
Name Band µ0 α m25 R25 mtot Reff CI Seeing ABmag 2−2 pc mag kpc mag kpc arcsec fit range
(1) (2) (3) (4) (5) (6) (7) (8) (9) (10) (11)
H1031− 2818 B 19.64 ± 0.02 558 ± 6 15.81 ± 0.02 2.74 15.77 ± 0.02 1.05 0.503 1.′′54 0.17I 18.39 ± 0.02 618 ± 5 14.23 ± 0.03 3.89 14.20 ± 0.03 1.10 0.534 1.′′47 > 6′′
K′ 16.54 ± 0.34 553 ± 58 — — 12.69 ± 0.1 0.97 0.502 0.′′92 > 6′′
H1031− 2632 B 22.84 ± 0.05 1276 ± 30 17.52 ± 0.012 2.53 17.14 ± 0.04 1.80 0.496 1.′′53 0.2I 20.95 ± 0.08 1070 ± 35 15.68 ± 0.05 3.97 15.65 ± 0.07 1.67 0.511 1.′′28 > 10′′
H1032− 2638 B 22.29 ± 0.05 649 ± 17 18.26 ± 0.04 1.62 18.07 ± 0.06 0.94 0.515 1.′′44 0.2I 21.21 ± 0.07 672 ± 25 16.92 ± 0.08 2.30 16.90 ± 0.08 0.96 0.512 1.′′21 > 4′′
H1032− 2722 B 21.82 ± 0.27 706 ± 60 17.80 ± 0.06 2.06 17.57 ± 0.11 1.30 0.45 1.′′43 0.18I 20.77 ± 0.24 715 ± 54 16.58 ± 0.09 2.80 16.55 ± 0.10 1.34 0.43 1.′′12 > 8′′
H1033− 2707 B 21.25 ± 0.24 528 ± 39 17.12 ± 0.05 1.85 17.06 ± 0.06 0.67 0.577 1.′′91 0.18I 20.15 ± 0.28 517 ± 43 16.10 ± 0.07 2.25 16.09 ± 0.07 0.69 0.576 1.′′41 > 6′′
K′ 18.56 ± 0.18 484 ± 55 — — 15.02 ± 0.15 0.65 0.531 0.′′93 > 2′′
H1033− 2642 B 22.99 ± 0.03 2184 ± 73 16.76 ± 0.04 3.63 16.56 ± 0.06 2.27 0.438 1.′′49 0.18I 21.56 ± 0.05 1873 ± 88 15.33 ± 0.03 4.50 15.31 ± 0.09 2.18 0.466 1.′′26 5′′-14′′
H1033− 2722 B 23.25 ± 0.16 1784 ± 180 17.44 ± 0.04 2.89 17.04 ± 0.06 2.21 0.476 1.′′89 0.17I 21.70 ± 0.22 1458 ± 162 15.805 ± 0.13 4.35 15.77 ± 0.18 2.02 0.504 1.′′39 > 10′′
H1034− 2558 B 22.28 ± 0.18 483 ± 31 18.33 ± 0.02 1.21 18.19 ± 0.05 0.56 0.63 1.′′59 0.26I 21.53 ± 0.17 526 ± 36 17.49 ± 0.04 1.70 17.43 ± 0.04 0.56 0.67 1.′′33 > 5′′
H1034− 2758 B 20.97 ± 0.04 897 ± 17 16.03 ± 0.06 3.15 <∼16.02 ± 0.06 1.29 0.546 1.′′43 0.16I 19.94 ± 0.03 912 ± 13 14.93 ± 0.04 4.25 <∼14.92 ± 0.04 1.28 0.555 1.′′34 > 5′′
K′ — — — — 14.61 ± 0.1 — — — —
H1035− 2756 B 23.86 ± 0.10 1724 ± 178 18.50 ± 0.06 1.80 17.72 ± 0.18 1.77 0.568 1.′′58 0.16I 22.49 ± 0.14 1645 ± 240 16.37 ± 0.39 2.82 16.305 ± 0.24 1.89 0.564 1.′′43 > 5′′
H1035− 2605 B 21.50 ± 0.12 878 ± 36 16.62 ± 0.034 2.82 16.53 ± 0.05 1.34 0.477 1.′′72 0.26I 19.38 ± 0.11 738 ± 24 14.84 ± 0.04 3.83 14.84 ± 0.04 1.23 0.487 1.′′35 > 9′′
K′ 17.32 ± 0.33 618 ± 56 — — 13.26 ± 0.1 0.87 0.490 1.′′06 >4.′′4
H1035− 2502 B 22.17 ± 0.05 683 ± 19 18.05 ± 0.04 1.79 17.90 ± 0.07 1.00 0.480 1.′′97 0.22I 21.34 ± 0.07 728 ± 32 16.97 ± 0.11 2.29 16.97 ± 0.11 1.03 0.478 1.′′50 > 4′′
H1035− 2740 B 21.75 ± 1.34 529 ± 177 18.01 ± 0.04 1.64 17.88 ± 0.06 0.87 0.497 1.′′64 0.16I 20.95 ± 0.78 592 ± 144 16.97 ± 0.12 2.13 16.96 ± 0.13 0.91 0.494 1.′′51 > 8′′
H1038− 2733 B 22.96 ± 0.04 986 ± 25 18.25 ± 0.02 1.87 17.93 ± 0.04 1.25 0.49 1.′′71 0.16I 21.79 ± 0.07 870 ± 32 17.00 ± 0.07 2.59 16.97 ± 0.08 1.18 0.50 1.′′45 > 5′′
H1038− 2730 B 22.26 ± 0.03 913 ± 14 17.53 ± 0.03 2.27 17.42 ± 0.05 1.25 0.477 1.′′46 0.16I 20.79 ± 0.04 845 ± 21 16.04 ± 0.09 3.35 16.04 ± 0.09 1.18 0.506 1.′′40 4′′
K′ — — — — 15.30 ± 0.15 — — — —
Notes
µ0: Extrapolated central surface brightness of the LSB component in mag arcsec−2.α: Exponential scale length of the LSB component in pc. A distance of 45 Mpc was assumed throughout.m25: Extinction–corrected apparent luminosity within the 25 mag arcsec−2 isophote.R25: Radial extent at the 25 mag arcsec−2 isophotal level, in kpc.mtot: Total extinction–corrected magnitude.Reff : Effective radius in kpc.CI: Concentration Index log(r80/r20), where r80 and r20 denote the radii containing 80% and 20% of the total objectluminosity, respectively (after James 1991).Seeing: the FWHM of the stellar sources measured in the field of the galaxies.AB: Assumed Galactic extinction in B.Fit Range: Range in radius in which fits were performed.

556 P.–A. Duc et al.: Hi–rich dwarf galaxies in the Hydra I cluster. I.
Fig. 16. H1032 − 2638. (top-left) I–band image. The thick contour shows the extent of the galaxy at the Galactic extinction-corrected I surface brightness of 23 mag arcsec−2. Contour levels are separated by 0.5 mag. (top-right): B−I map of the galaxy.The overlayed contours correspond to the B-band image. The crosses indicate the position of two spectroscopically identifiedforeground stars that were removed when computing the SBPs. (bottom-left) Surface brightness profile in B (filled circles) andI (open circles), corrected for Galactic extinction. The vertical error bars correspond to 2σ uncertainties. The FWHM of pointsources is indicated by the vertical thick and thin lines for B and I, respectively. (bottom-right) Radially averaged B− I profile
20% of the total luminosity are contained, respectively.In Col. 10 we list the seeing, i.e. the FWHM (in arcsec)of stellar sources in the field of each dwarf. Column 11contains the adopted Galactic extinction in the B–bandand the range in radius used for the linear disk fit to eachprofile.
The LSB component of the SBPs can be divided inthree main categories:
i. Pure exponential profilesThe surface brightness distribution of the LSB componentof these dwarfs can be approximated, in at least one band,by a normal exponential law of the form:
I(R∗) = I0 exp
(−R∗
α
)(1)
where R∗ is the radius, I0 the central intensity and αthe exponential disk scale length. About half the dwarfsin our sample belong to this category and show, withinthe 1σ uncertainties, a profile shape compatible withEq. (1). These objects are H1032 − 2638, H1033 − 2707,H1033−2722, H1034−2558, H1034−2758, H1035−2740,H1038− 2733 and H1038− 2730.
ii. Exponential profiles flattening near the centerThese profiles, designated as type–V in the nomenclatureof Binggeli & Cameron (1991), exhibit an intensity de-pression with respect to a pure exponential distributionin their inner parts, typically for radii <∼ 2α. In thesecases the extrapolated central surface brightness of theLSB component, µ0, may differ significantly from the ac-tually observed central surface brightness value.

P.–A. Duc et al.: Hi–rich dwarf galaxies in the Hydra I cluster. I. 557
Fig. 17. H1032 − 2722. (top-left) I–band image. The thick contour shows the extent of the galaxy at the Galactic extinction-corrected I surface brightness of 23 mag arcsec−2. Contour levels are separated by 0.5 mag. (top-right): B − I map of thegalaxy. The overlayed contours correspond to the B-band image. (bottom-left) Surface brightness profile in B (filled circles) andI (open circles), corrected for Galactic extinction. The vertical error bars correspond to 2σ uncertainties. The FWHM of pointsources is indicated by the vertical thick and thin lines for B and I, respectively. The B-band SBP is decomposed into an LSBcomponent (thick curve) plus the luminosity excess above the LSB profile (small circles). The luminosity of the LSB componentcan be described by a modified exponential distribution with (b, q) = (1.8, 0.7). (bottom-right) Radially averaged B − I profile
The LSB component of these galaxies can be describedby a modified exponential distribution (Papaderos et al.1996b) of the form
I(R∗) = I0 exp
(−R∗
α
){1− q exp(−P3(R∗))} (2)
where P3(R∗) is defined as
P3(R∗) =
(R∗
bα
)3
+
(R∗
α
1− q
q
). (3)
The parameters q = ∆I/I0 and b denote, respectively, thedepression of the flattened exponential distribution withrespect to a pure exponential distribution and the radialextent within which the flattening occurs.
Dwarfs with this type of profile constitute ∼1/3 of oursample. They are H1031− 2818, H1031− 2632, H1032−2722, H1035− 2605 and H1035− 2502.
For two of these, we have illustrated the decomposi-tion of the B–band profile using Eq. (2), as well as theresidual light remaining after fitting. As shown in Figs. 14and 17, the q-parameter can be as high as 0.7 in the pro-file fits, implying an observed central surface brightness∼ 1.3 mag fainter than the extrapolated central value ofthe outer exponential profile. The physical origin of thistype of profile is unclear; it has been conjectured that itmay be due to early extensive mass loss via galactic winds(Fukunaga-Nakamura & Tosa 1989).
iii. Peculiar profilesThese are observed in two cases: H1033−2642 and H1035−

558 P.–A. Duc et al.: Hi–rich dwarf galaxies in the Hydra I cluster. I.
Fig. 18. H1033 − 2707. (top-left) I–band image. The thick contour shows the extent of the galaxy at the Galactic extinction-corrected I surface brightness of 23 mag arcsec−2. Contour levels are separated by 0.5 mag. (top-right): B − I map of thegalaxy. The overlayed contours correspond to the B-band image. (bottom-left) Surface brightness profile in B (filled circles), I(open circles) and K′ (triangles). An offset of 4 mag has been added to the K′ SBP. The vertical error bars correspond to 2σuncertainties. The FWHM in each band is indicated at the bottom left. (bottom-right) Radially averaged B − I profile
2756. The former shows an exponential intensity distribu-tion for intensities brighter than µB ∼ 24.5 mag arcsec−2
which is truncated in the outer regions. This truncationmay be due to a tidal interaction with a nearby S0 galaxy.In H1035 − 2756 the LSB component appears filamen-tary and patchy, and it dominates the light for intensitiesfainter than µB ∼ 25 mag arcsec−2 .
4.3. Color distribution
The B−I color maps are displayed at the upper right-handpanels of Figs. 14-28. The overlaying contours correspondto the B–band images. Note, that the color distributionof the dwarfs is not always spatially correlated with theB–band luminosity pattern; e.g. the intensity maximumdoes not necessarily coincide with a region exhibiting ex-treme colors with respect to the mean color of the galaxy.
In most cases the bluest colors are found off-center, atthe location of spectroscopically confirmed H ii regions(see Paper II). Examples of dwarfs with off-center colorminima are H1031− 2818, H1033 − 2722, H1034− 2758,H1035− 2605, H1035− 2502 and H1038− 2733.
Radial color profiles (Figs. 14-28, lower-right panels)were computed by direct subtraction of the I–band SBPfrom the B–band SBP, after matching both profiles tothe same resolution. In general, no strong color gradi-ents are observed in the sample. The only exception isH1034− 2558, a blue compact dwarf galaxy showing a in-ward bluing by 1.8 mag kpc−1 within its starburst nucleus.The LSB components show a variety of radially averagedcolor distributions, ranging between weak outward bluingof the order of <∼ −0.2 mag kpc−1 and zero color gradient.

P.–A. Duc et al.: Hi–rich dwarf galaxies in the Hydra I cluster. I. 559
Fig. 19. H1033 − 2642. (top-left) I–band image. The thick contour shows the extent of the galaxy at the Galactic extinction-corrected I surface brightness of 23 mag arcsec−2. Contour levels are separated by 0.5 mag. (top-right): B−I map of the galaxy.The overlayed contours correspond to the B-band image. (bottom-left) Surface brightness profile in B (filled circles) and I (opencircles), corrected for Galactic extinction. The vertical error bars correspond to 2σ uncertainties. The FWHM of point sourcesis indicated by the vertical thick and thin lines for B and I, respectively. (bottom-right) Radially averaged B − I profile
4.4. Classification of the Hydra dwarfs
Table 5 summarizes some integrated properties of the pri-mary list objects. The absolute blue magnitude (Col. 2)and the B−I color index (Col. 5) were calculated using thetotal magnitudes listed in Table 4. The H i masses (Col. 3)were derived from the Nancay data, when available; other-wise, the original VLA line fluxes were used (those valuesare listed in parentheses in Table 5). All galaxies in ourfinal list of H i–selected dwarf galaxies are fainter thanabsolute blue magnitude −17.5 and have H i masses rang-ing from 0.7 108 M� to 7.3 108 M�. The mean H i-mass-to-blue luminosity ratios of the 15 Hydra dwarf galaxiesin our final list is about 1 M�/L�,B, a rather typicalvalue for gas-rich dwarf irregulars (Thuan 1985; Skillman1996; Hoffman et al. 1996), though for individual objects itranges from a low 0.1 (for H1031−2818 and H1035−2605),
a value rather befitting quiescent lenticulars, to values ex-ceeding 2 (for H1035− 2756 and H1038− 2733) which arenot unexceptional for dwarf irregulars, however.
From the morphological point of view, the dwarfs ofthe H i–selected sample show a striking variety of proper-ties. This diversity is clearly illustrated in Fig. 12, wheresurface brightness images of all 15 dwarfs are displayedtogether with the same spatial and intensity scales. InFigs. 29a,b we compare, respectively, the MB vs. µ0 andthe MB vs. log(α) correlation of our sample galaxies withthose of other dwarf irregulars (dIrrs) and blue compactdwarfs (BCDs) taken from various other samples (seePatterson & Thuan 1996; Papaderos et al. 1996a, and ref-erences therein). In both diagrams the Hydra dwarfs spana wide range in the µ0 and log(α) parameter space, fromBCD-like objects to LSB dIrrs. Objects BCD H1034−2558and LSB H1033− 2642 are the two most extreme cases.

560 P.–A. Duc et al.: Hi–rich dwarf galaxies in the Hydra I cluster. I.
Fig. 20. H1033 − 2722. (top-left) I–band image. The thick contour shows the extent of the galaxy at the Galactic extinction-corrected I surface brightness of 23 mag arcsec−2. Contour levels are separated by 0.5 mag. (top-right): B−I map of the galaxy.The overlayed contours correspond to the B-band image. (bottom-left) Surface brightness profile in B (filled circles) and I (opencircles), corrected for Galactic extinction. The vertical error bars correspond to 2σ uncertainties. The FWHM of point sourcesis indicated by the vertical thick and thin lines for B and I, respectively. (bottom-right) Radially averaged B − I profile
5. Notes on individual objects
We hereafter present some notes on each dwarf galaxy inthe final list. The optical velocities of companion galaxiesand the location of some H ii regions mentioned were de-rived from long-slit spectroscopic data obtained in March1998 with the ESO 3.6 m telescope. These observationswill be presented in detail in Paper II.
• H1031 − 2818: This system is the most luminous dwarfin our sample, at MB ≈ −17.5 mag. Its surface bright-ness profiles in both B and I suggest a central depres-sion with respect to a normal exponential fitting law. Thisflattening appears more pronounced in B, where the ex-trapolation of the outer slope of the LSB component toR∗ = 0′′ leads to a central surface brightness ∼ 0.7 B magbrighter than the observed value. In Fig. 14 the intensity
distribution of the LSB component in B is fitted with amodified exponential distribution of the form Eq. (2) with(b, q) = (1.8, 0.65). We determined the apparent B lumi-nosity of the LSB component as 15.83 mag and that of thecomponent in excess of it as 18.79 mag. Thus, the latterluminosity component, due to ongoing star-forming activ-ity, represents only a minor contribution, ∼ 6%, to thetotal luminosity of the system.
Within an area ∼ 14′′ in diameter there are three moder-ately blue (B − I ∼ 1.3 mag) off-center regions immersedin the relatively red (B − I ∼ 1.8) LSB stellar contin-uum. The latter knots host H ii regions. For radii ≥ 4′′
the radially averaged B − I profile shows a monotoniccolor increase with a gradient of ∼ 0.18 mag kpc−1.
P.–A. Duc et al.: Hi–rich dwarf galaxies in the Hydra I cluster. I. 561
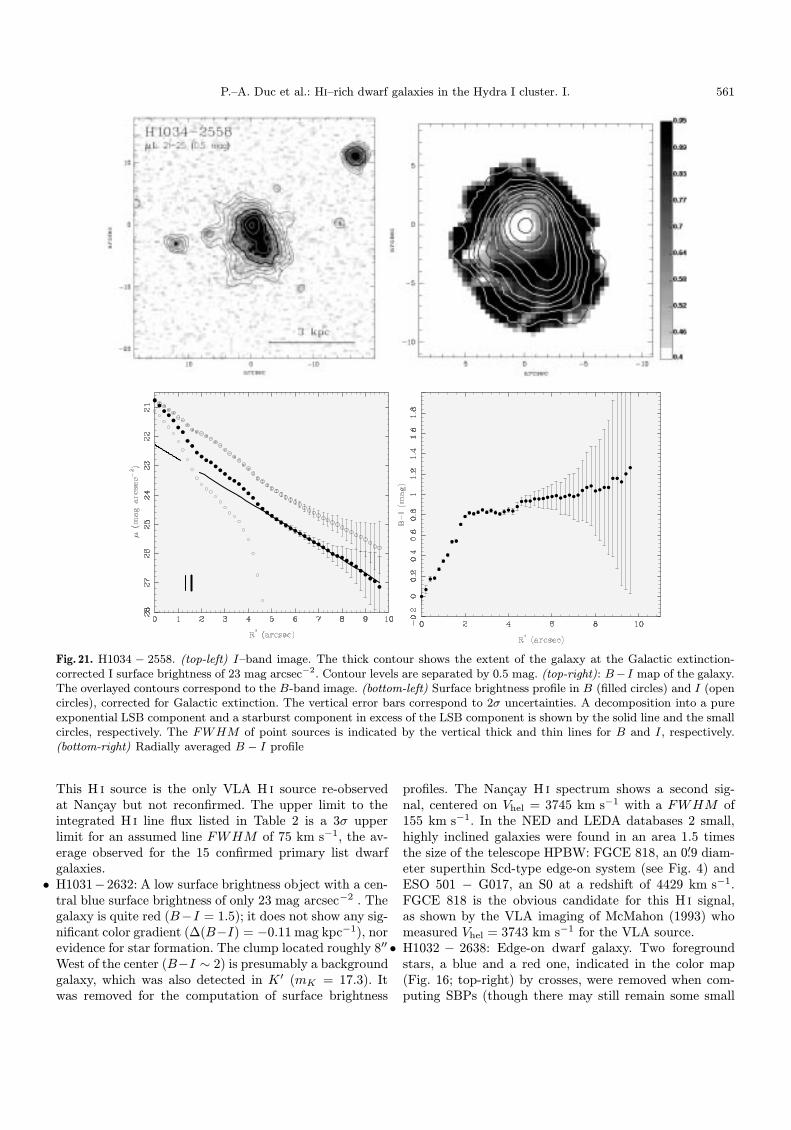
Fig. 21. H1034 − 2558. (top-left) I–band image. The thick contour shows the extent of the galaxy at the Galactic extinction-corrected I surface brightness of 23 mag arcsec−2. Contour levels are separated by 0.5 mag. (top-right): B−I map of the galaxy.The overlayed contours correspond to the B-band image. (bottom-left) Surface brightness profile in B (filled circles) and I (opencircles), corrected for Galactic extinction. The vertical error bars correspond to 2σ uncertainties. A decomposition into a pureexponential LSB component and a starburst component in excess of the LSB component is shown by the solid line and the smallcircles, respectively. The FWHM of point sources is indicated by the vertical thick and thin lines for B and I, respectively.(bottom-right) Radially averaged B − I profile
This H i source is the only VLA H i source re-observedat Nancay but not reconfirmed. The upper limit to theintegrated H i line flux listed in Table 2 is a 3σ upperlimit for an assumed line FWHM of 75 km s−1, the av-erage observed for the 15 confirmed primary list dwarfgalaxies.• H1031−2632: A low surface brightness object with a cen-
tral blue surface brightness of only 23 mag arcsec−2 . Thegalaxy is quite red (B−I = 1.5); it does not show any sig-nificant color gradient (∆(B−I) = −0.11 mag kpc−1), norevidence for star formation. The clump located roughly 8′′
West of the center (B−I ∼ 2) is presumably a backgroundgalaxy, which was also detected in K ′ (mK = 17.3). Itwas removed for the computation of surface brightness
profiles. The Nancay H i spectrum shows a second sig-nal, centered on Vhel = 3745 km s−1 with a FWHM of155 km s−1. In the NED and LEDA databases 2 small,highly inclined galaxies were found in an area 1.5 timesthe size of the telescope HPBW: FGCE 818, an 0′.9 diam-eter superthin Scd-type edge-on system (see Fig. 4) andESO 501 − G017, an S0 at a redshift of 4429 km s−1.FGCE 818 is the obvious candidate for this H i signal,as shown by the VLA imaging of McMahon (1993) whomeasured Vhel = 3743 km s−1 for the VLA source.• H1032 − 2638: Edge-on dwarf galaxy. Two foreground
stars, a blue and a red one, indicated in the color map(Fig. 16; top-right) by crosses, were removed when com-puting SBPs (though there may still remain some small

562 P.–A. Duc et al.: Hi–rich dwarf galaxies in the Hydra I cluster. I.
Fig. 22. H1034 − 2758. (top-left) I–band image. The thick contour shows the extent of each galaxy at the Galactic extinction-corrected I surface brightness of 23 mag arcsec−2. Contour levels are separated by 0.5 mag. The H i-dwarf is indicated by thevertical thick lines. (top-right): B− I map of the galaxy. The overlayed contours correspond to the B-band image. (bottom-left)Surface brightness profile in B (filled circles) and I (open circles), corrected for Galactic extinction. The vertical error barscorrespond to 2σ uncertainties. The FWHM of point sources is indicated by the vertical thick and thin lines for B and I,respectively. (bottom-right) Radially averaged B − I profile, showing a nearly constant color
residuals). The galaxy itself was not detected in K ′. Theblue region to the South-West hosts a strong H ii region.• H1032− 2722: A low surface brightness object exhibiting
an off-center blue clump. Its surface brightness profiles inboth B and I suggest for radii ≤ 7′′ a central depressionwith respect to a normal exponential fitting law. In Fig. 17the intensity distribution of the LSB component in B isfitted with a modified exponential distribution of the formEq. (2) with (b, q) = (1.8, 0.7).The central surface brightness of the modified expo-nential distribution (23.13 B mag arcsec−2) is 1.3 magfainter than the extrapolated value of the outer slope(21.82 mag arcsec−2). The apparent B luminosity of theLSB component was determined as 17.64 mag and thatof the excess light as 20.62 mag (representing ∼6% ofthe total B luminosity of the system). This H i–dwarf
exhibits an off-center blue clump to the East. The lattershows up in K ′ whereas the low-surface brightness diskis barely detected in this band. Within the inner 1 kpc(≤ 4′′) the radially averaged color profile shows a strongcolor gradient (0.57 mag kpc−1) whereas a constantblue color (B − I = 1.09 ± 0.08) is measured in theLSB component. Widespread star formation is detectedthrough spectroscopy. It is more active at the location ofthe blue clump.• H1032−2819: As discussed in Sect. 4.1, no optical counter-
part was found to this H i cloud, situated less than 60 kpcaway from the spiral galaxy ESO 436 − G046 (see Fig. 3).One cannot exclude that this cloud has been detachedfrom the spiral by tidal interaction. Although the latterdoes not exhibit strong signs of interaction, it has a nearby

P.–A. Duc et al.: Hi–rich dwarf galaxies in the Hydra I cluster. I. 563
Fig. 23. H1035 − 2756. (top-left) I–band image. The thick contour shows the extent of the galaxy at the Galactic extinction-corrected I surface brightness of 23 mag arcsec−2. Contour levels are separated by 0.5 mag. (top-right): B−I map of the galaxy.The overlayed contours correspond to the B-band image. (bottom-left) Surface brightness profile in B (filled circles) and I (opencircles), corrected for Galactic extinction. The vertical error bars correspond to 2σ uncertainties. The FWHM of point sourcesis indicated by the vertical thick and thin lines for B and I, respectively. (bottom-right) Radially averaged B − I profile
companion, ESO 436 − IG042 whose Nancay H i spectrais shown in Fig. 10.• H1033− 2707: A rather blue, high-surface brightness ob-
ject, with an integrated B − I index of ∼ 1.0 mag. Colorsare getting even bluer to the North along its major axis,where they attain a value ∼ 0.75; a star forming region isobserved there.
• H1033− 2642: A red low-surface brightness object show-ing a truncation of its exponential profile at levels µB >∼25 mag arcsec−2. The galaxy is interacting with the S0galaxy to the South-East (labeled as G1 in Fig. 19) whichis at the same optical redshift (Vopt = 2510 km s−1; mB =15.2; mI = 13.2). H1033− 2642 has a red (B − I ∼ 1.45mag) central region with a B − I index getting bluer(−0.09 ± 0.015 mag kpc−1) with increasing galactocen-
tric radius. It is barely detected in K ′. A low level of star-formation is seen all along the South-North axis.• H1033 − 2722: A red low-surface brightness object with
a decreasing B − I color towards larger radii (−0.145 ±0.015 mag kpc−1). An off-centered blue region associatedwith an H ii region is seen to the North-West.• H1034−2558: A blue compact dwarf galaxy detected pre-
viously in the objective-prism survey by Maza et al. (1991)and catalogued as CTS 1015 and M01.13. It shows an ex-tended, blue off-centered nucleus (B − I <∼ 0.2 mag) anda relatively constant color (∼ 0.9 − 1.0 mag) in the LSBcomponent. The averaged color gradient for radii ≤ 0.5kpc is as strong as∼ 1.76 mag kpc−1. The luminosity com-ponent in excess (mB = 19.31 mag) of the LSB compo-nent as modelled by a pure exponential law (mB = 18.61)contributes <∼ 40% of the total light of H1034−2558, con-trary to other H i–detected dwarfs in our sample, which

564 P.–A. Duc et al.: Hi–rich dwarf galaxies in the Hydra I cluster. I.
Fig. 24. H1035 − 2605. (top-left) I–band image. The thick contour shows the extent of the galaxy at the Galactic extinction-corrected I surface brightness of 23 mag arcsec−2. Contour levels are separated by 0.5 mag. The H i-dwarf is indicated by thehorizontal thick lines. (top-right): B−I map of the galaxy. The overlayed contours correspond to the B-band image. (bottom-left)Surface brightness profile in B (filled circles), I (open circles) and K′ (triangles). An offset of 5 mag has been added to the K′
SBP. The vertical error bars correspond to 2σ uncertainties. The FWHM of point sources in each band is indicated by thevertical lines. (bottom-right) Radially averaged B − I profile
generally show a moderate (if any) luminosity contribu-tion of a younger stellar population superimposed on theirLSB components. Very strong emission lines typical ofa BCD are associated with the blue compact nucleus.The latter is detected in K ′, at which wavelength anotherclump is seen 10′′ to the South–East without any counter-part in the I–band.• H1034 − 2758: A distorted object with off-centered blue
knots. Two galaxies lie at a small projected distance fromH1034− 2758 (see Fig. 22): G1 (mB = 17.5, mB = 16.1)and G2 (mB = 18.3,mI = 17.3). The northern object, G2,is a background starburst galaxy at Vopt = 10577 km s−1.G1 with Vopt = 3630 km s−1 appears as a quiescent dwarfgalaxy, a very close interacting companion to H1034−2758at a projected distance of only 26′′ or 5.7 kpc. The inner
isophotes of H1034 − 2758 seem to be slightly distorted.However, contrary to H1033 − 2642, no signs of trunca-tion in the SBPs profiles are seen in the outer part of thegalaxy. The exponential profile of H1034−2758 reveals anexcess in the central core, though less pronounced thanin H1034 − 2558. The diffuse relatively blue (B − I <∼0.9 mag) region ∼ 6′′ West of the nuclear region corre-sponds to a strong H ii region.• H1035− 2756: A peculiar galaxy showing two distinct lu-
minosity knots embedded in a patchy very low-surfacebrightness (µB >∼ 25 mag arcsec−2) continuum. Only theeastern clump shows signs of current star formation.• H1035−2605: An elongated face-on object having the red-
dest integrated color in the sample (B − I = 1.7). Thegalaxy shows two relatively bluer knots at each extremity
P.–A. Duc et al.: Hi–rich dwarf galaxies in the Hydra I cluster. I. 565
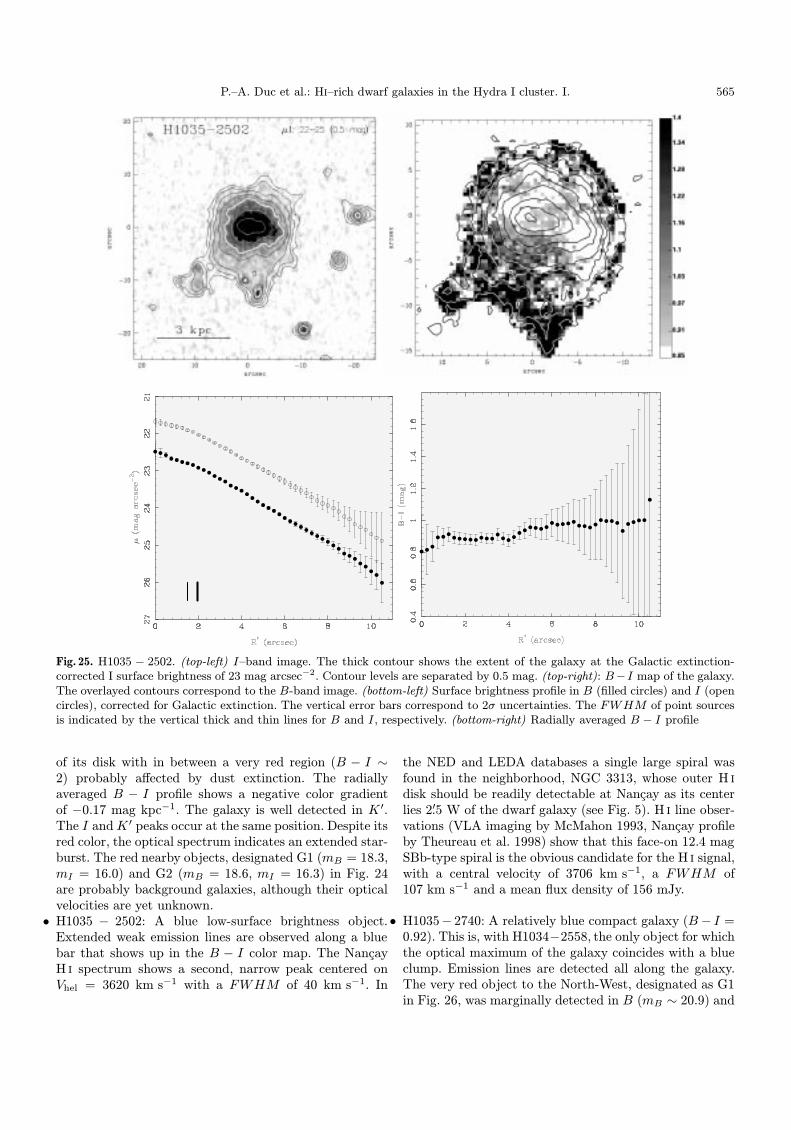
Fig. 25. H1035 − 2502. (top-left) I–band image. The thick contour shows the extent of the galaxy at the Galactic extinction-corrected I surface brightness of 23 mag arcsec−2. Contour levels are separated by 0.5 mag. (top-right): B−I map of the galaxy.The overlayed contours correspond to the B-band image. (bottom-left) Surface brightness profile in B (filled circles) and I (opencircles), corrected for Galactic extinction. The vertical error bars correspond to 2σ uncertainties. The FWHM of point sourcesis indicated by the vertical thick and thin lines for B and I, respectively. (bottom-right) Radially averaged B − I profile
of its disk with in between a very red region (B − I ∼2) probably affected by dust extinction. The radiallyaveraged B − I profile shows a negative color gradientof −0.17 mag kpc−1. The galaxy is well detected in K ′.The I andK ′ peaks occur at the same position. Despite itsred color, the optical spectrum indicates an extended star-burst. The red nearby objects, designated G1 (mB = 18.3,mI = 16.0) and G2 (mB = 18.6, mI = 16.3) in Fig. 24are probably background galaxies, although their opticalvelocities are yet unknown.• H1035 − 2502: A blue low-surface brightness object.
Extended weak emission lines are observed along a bluebar that shows up in the B − I color map. The NancayH i spectrum shows a second, narrow peak centered onVhel = 3620 km s−1 with a FWHM of 40 km s−1. In
the NED and LEDA databases a single large spiral wasfound in the neighborhood, NGC 3313, whose outer H i
disk should be readily detectable at Nancay as its centerlies 2′.5 W of the dwarf galaxy (see Fig. 5). H i line obser-vations (VLA imaging by McMahon 1993, Nancay profileby Theureau et al. 1998) show that this face-on 12.4 magSBb-type spiral is the obvious candidate for the H i signal,with a central velocity of 3706 km s−1, a FWHM of107 km s−1 and a mean flux density of 156 mJy.
• H1035− 2740: A relatively blue compact galaxy (B− I =0.92). This is, with H1034−2558, the only object for whichthe optical maximum of the galaxy coincides with a blueclump. Emission lines are detected all along the galaxy.The very red object to the North-West, designated as G1in Fig. 26, was marginally detected in B (mB ∼ 20.9) and
566 P.–A. Duc et al.: Hi–rich dwarf galaxies in the Hydra I cluster. I.
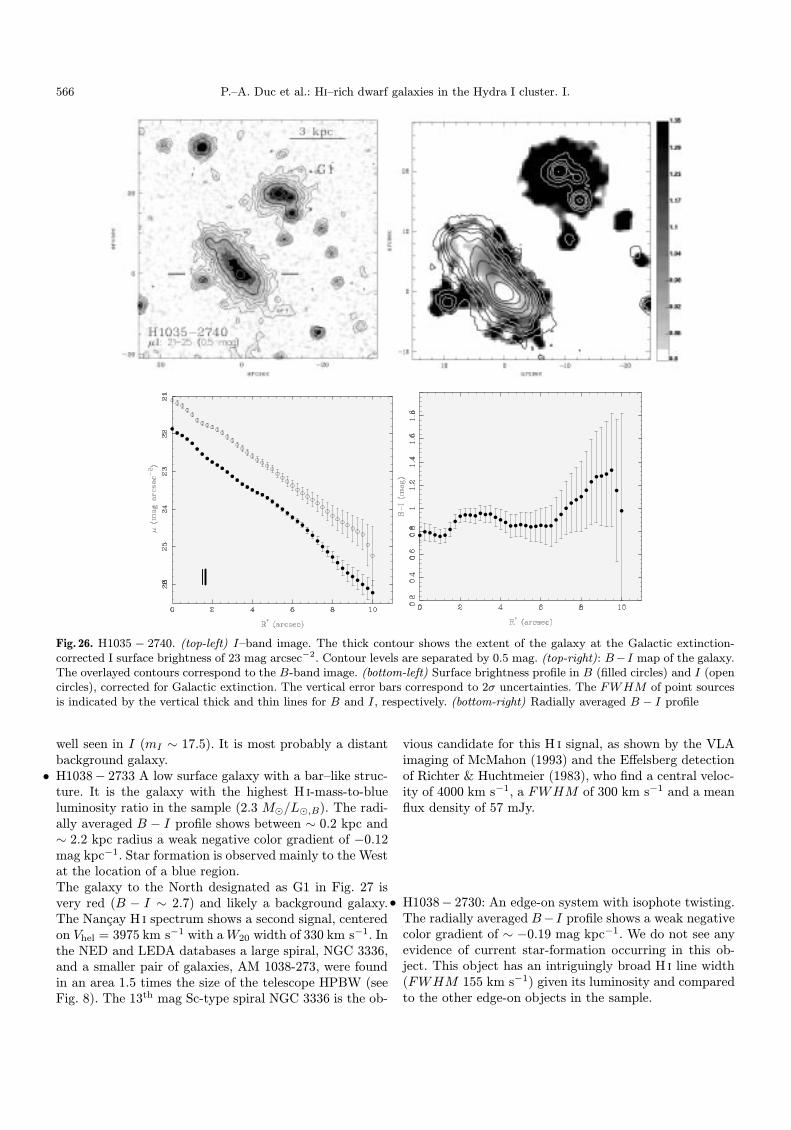
Fig. 26. H1035 − 2740. (top-left) I–band image. The thick contour shows the extent of the galaxy at the Galactic extinction-corrected I surface brightness of 23 mag arcsec−2. Contour levels are separated by 0.5 mag. (top-right): B−I map of the galaxy.The overlayed contours correspond to the B-band image. (bottom-left) Surface brightness profile in B (filled circles) and I (opencircles), corrected for Galactic extinction. The vertical error bars correspond to 2σ uncertainties. The FWHM of point sourcesis indicated by the vertical thick and thin lines for B and I, respectively. (bottom-right) Radially averaged B − I profile
well seen in I (mI ∼ 17.5). It is most probably a distantbackground galaxy.• H1038− 2733 A low surface galaxy with a bar–like struc-
ture. It is the galaxy with the highest H i-mass-to-blueluminosity ratio in the sample (2.3 M�/L�,B). The radi-ally averaged B − I profile shows between ∼ 0.2 kpc and∼ 2.2 kpc radius a weak negative color gradient of −0.12mag kpc−1. Star formation is observed mainly to the Westat the location of a blue region.The galaxy to the North designated as G1 in Fig. 27 isvery red (B − I ∼ 2.7) and likely a background galaxy.The Nancay H i spectrum shows a second signal, centeredon Vhel = 3975 km s−1 with aW20 width of 330 km s−1. Inthe NED and LEDA databases a large spiral, NGC 3336,and a smaller pair of galaxies, AM 1038-273, were foundin an area 1.5 times the size of the telescope HPBW (seeFig. 8). The 13th mag Sc-type spiral NGC 3336 is the ob-
vious candidate for this H i signal, as shown by the VLAimaging of McMahon (1993) and the Effelsberg detectionof Richter & Huchtmeier (1983), who find a central veloc-ity of 4000 km s−1, a FWHM of 300 km s−1 and a meanflux density of 57 mJy.
• H1038− 2730: An edge-on system with isophote twisting.The radially averaged B− I profile shows a weak negativecolor gradient of ∼ −0.19 mag kpc−1. We do not see anyevidence of current star-formation occurring in this ob-ject. This object has an intriguingly broad H i line width(FWHM 155 km s−1) given its luminosity and comparedto the other edge-on objects in the sample.

P.–A. Duc et al.: Hi–rich dwarf galaxies in the Hydra I cluster. I. 567
Fig. 27. H1038 − 2733. (top-left) I–band image. The thick contour shows the extent of the galaxy at the Galactic extinction-corrected I surface brightness of 23 mag arcsec−2. Contour levels are separated by 0.5 mag. (top-right): B−I map of the galaxy.The overlayed contours correspond to the B-band image. (bottom-left) Surface brightness profile in B (filled circles) and I (opencircles), corrected for Galactic extinction. The vertical error bars correspond to 2σ uncertainties. The FWHM of point sourcesis indicated by the vertical thick and thin lines for B and I, respectively. (bottom-right) Radially averaged B − I profile
6. Conclusions
We have presented an optical/near-infrared imaging andH i database for a complete sample of 15 H i–selecteddwarf galaxies in the Hydra I cluster. The absolute bluemagnitude of their optical counterparts ranges between−15.1 mag and −17.5 mag and their H i mass to blue lu-minosity between 0.1 and 2.4 M�/L�,B. Their integratedB − I color index varies between 0.8 and 1.7 mag. Thelow surface brightness components of half of the Hydradwarfs have an undisturbed exponential profile; the re-maining galaxies either show a flattening of their SBP inthe central regions or a truncation in the outer regions.One of the H i sources lying in the vicinity of a HI–richspiral has no optical counterpart.
The heterogeneity of the sample may well be due tothe variety of the local environment of each galaxy: in
particular the pressure of the intra-cluster medium andthe density of the galaxy population. Indeed the dwarfs inHydra are not uniformly distributed and tend to clusterin substructures, like the more massive galaxies (Valluriet al. 1999). The presence of companions, as commonlyobserved for the H i–rich dwarfs, may directly affect theirmorphology and their star formation history. In this pa-per, we have remarked on these issues on a case-by-casebasis only. We will present a general discussion on the roleof the environment on the global properties of the HydraH i–rich dwarfs in another article of these series.
Acknowledgements. This work has greatly benefited from dis-cussions with J. van Gorkom. We are grateful to the 2p2team at la Silla who helped us with the observations, es-pecially Isabel Peres and Thomas Augusteijn for their effi-cient and friendly introductions at the D1.5 m and 2.2 mtelescopes. We wish to thank our referee, C. Carignan, for

568 P.–A. Duc et al.: Hi–rich dwarf galaxies in the Hydra I cluster. I.
Fig. 28. H1038 − 2730. (top-left) I–band image. The thick contour shows the extent of the galaxy at the Galactic extinction-corrected I surface brightness of 23 mag arcsec−2. Contour levels are separated by 0.5 mag. (top-right): B−I map of the galaxy.The overlayed contours correspond to the B-band image. (bottom-left) Surface brightness profile in B (filled circles) and I (opencircles), corrected for Galactic extinction. The vertical error bars correspond to 2σ uncertainties. The FWHM of point sourcesis indicated by the vertical thick and thin lines for B and I, respectively. (bottom-right) Radially averaged B − I profile
Fig. 29. a) Absolute B luminosity vs. extrapolated central surface brightness of the LSB component for the H i–detected Hydradwarfs. For comparison, dwarf irregulars and the LSB component of BCDs from the samples of Patterson & Thuan (1996)and Papaderos et al. (1996b), respectively, have been added. Note that roughly 1/3 of the surface brightness profiles of theH i–detected d warfs belong to the type-V class; e.g. they exhibit an outer exponential slope and a flattening towards the center.In these cases, the extrapolated central surface brightness µ0 may differ significantly from the value actually observed at thecenter of the galaxy. b) Absolute B luminosity vs. exponential scale length. All quantities shown for the Hydra dwarfs arecorrected for foreground Galactic extinction

P.–A. Duc et al.: Hi–rich dwarf galaxies in the Hydra I cluster. I. 569
Table 5. Integrated properties
Name MB MHI MHI/LB B − Imag 108 M� M�/L�,B mag
(1) (2) (3) (4) (5)
H1031− 2818 −17.50 2.3 0.16 1.57H1031− 2632 −16.13 1.8 0.40 1.49H1032− 2638 −15.20 (1.8) 0.97 1.17H1032− 2722 −15.70 4.3 1.46 1.02H1033− 2707 −16.21 5.7 1.22 0.97H1033− 2642 −16.71 5.2 0.71 1.25H1033− 2722 −16.23 7.3 1.52 1.27H1034− 2558 −15.08 (1.1) 0.69 0.76H1034− 2758 −17.25 4.7 0.39 1.10H1035− 2756 −15.55 6.2 2.40 1.42H1035− 2605 −16.74 (0.7) 0.10 1.69H1035− 2502 −15.37 2.4 1.10 0.93H1035− 2740 −15.39 (1.5) 0.67 0.92H1038− 2733 −15.34 5.0 2.34 0.96H1038− 2730 −15.85 6.1 1.80 1.38
H1031− 2734 −17.70 10.1 0.54 1.32H1032− 2819 — 4.6 — —H1033− 2726 −17.36 9.3 0.68 1.11H1033− 2506 −19.00 9.5 0.15 1.53H1034− 2553 −18.04 18.3 0.72 1.39
valuable comments. Research by P.P. has been supportedby Deutsche Agentur fur Raumfahrtangelegenheiten (DARA)GmbH grant 50 OR 9407 6. The Unite Scientifique Nancayof the Observatoire de Paris is associated as USR B704 tothe French Centre National de Recherche Scientifique (CNRS).Nancay also gratefully acknowledges the financial supportof the Region Centre in France. DAEC, the Department ofExtragalactic Astronomy and Cosmology of the Observatoirede Paris is associated with the Universite de Paris 7 and asURA 173 to the CNRS. This research has made use of theLyon-Meudon Extragalactic Database (LEDA) supplied by theLEDA team at the CRAL-Observatoire de Lyon (France), aswell as of the NASA/IPAC Extragalactic Database (NED)which is operated by the Jet Propulsion Laboratory, CaliforniaInstitute of Technology, under contract with the NationalAeronautics and Space Administration.
References
Almoznino E., Brosch N., 1998, MNRAS 298, 931Bautz L.P., Morgan W.W., 1970, ApJ 162, L149Binggeli B., Cameron L.M., 1991, A&A 252, 27Bothun G.D., Mould J.R., Caldwell N., Macgillivray H.T.,
1986, AJ 92, 1007Bravo H., Cayatte V., van Gorkom J., Balkowski C., 1999 (in
preparation)
Cayatte V., van Gorkom J.H., Balkowski C., Kotanyi C., 1990,AJ 100, 604
Dickey J.M., 1997, AJ 113, 1939Dressler A., Oemler A.J., Couch W.J., et al., 1997, ApJ 490,
577Fitchett M., Merritt D., 1988, ApJ 335, 18Fukunaga-Nakamura A., Tosa M., 1989, PASP 41, 953Gallagher J.S. III, Hunter D.A., 1989, AJ 98, 806Hamabe M., 1993, ApJS 85, 249Hoffman G.L., Helou G., Salpeter E.E., 1988, ApJ 324, 75Hoffman G.L., Salpeter E.E., Farhat B., Roos T., Williams H.,
Helou G., 1996, ApJS 105, 269Impey C., Bothun G., Malin D., 1988, ApJ 330, 634James P., 1991, MNRAS 250, 544Kenney J.D.P., 1990, in The interstellar Medium in Galaxies,
Thronson H.A., Shull M. (eds.). Kluwer AcademicPublishers, p. 151
Landolt A.U., 1992, AJ 104, 340Matthews L.D., van Driel W., Gallagher J.S. III, 1998, AJ 116,
1169Maza J., Ruiz M.T., Gonzalez L.E., Wischnjewsky M., Pena
M., 1991, A&AS 89, 389McMahon P.M., 1993, Ph.D. thesis. Columbia UniversityMcMahon P.M., Van Gorkom J.H., Richter O.G., Ferguson
H.C., 1992, AJ 103, 399Papaderos P., Loose H.H., Fricke K.J., Thuan T.X., 1996a,
A&A 314, 59Papaderos P., Loose H.H., Thuan T.X., Fricke K.J., 1996b,
A&AS 120, 207Patterson R.J., Thuan T.X., 1996, ApJS 107, 103Paturel G., Fouque P., Bottinelli L., Gouguenheim L., 1989,
Catalogue of Principal Galaxies. Observatoires de Lyon etde Paris-Meudon
Pena M., Ruiz M.T., Maza J., 1991, A&A 251, 417Persson S.E., Murphy D.C., Krzeminski W., Roth M., Rieke
M.J., 1998, AJ 116, 2475Richter O.-G., 1987, A&AS 67, 237Richter O.-G., 1989, A&AS 77, 237Richter O.-G., Huchtmeier W.K., 1983, A&A 125, 187Richter O.-G., Huchtmeier W.K., 1987, A&AS 68, 427Richter O.-G., Huchtmeier W.K., Materne J., 1982, A&A 111,
193Schweizer F., 1998, in Galaxies: interactions and induced star
formation Kennicutt R., Schweizer F., Barnes J. (eds.).Springer
Secker J., Harris W.E., Plummer J.D., 1997, PASP 109, 1377Skillman E., 1996, in The Minnesota Lectures on Extragalactic
Neutral Hydrogen Skillman E. (ed.), ASP Conf. Ser. 106,208
Theureau G., Bottinelli L., Coudreau-Durand N., et al., 1998,A&AS 130, 333
Thuan T.X., 1985, ApJ 299, 881Trentham N., 1998, MNRAS 293, 71Valluri M., Jog C.J., 1990, ApJ 357, 367Valluri M., van Gorkom J., McMahon P., 1999, AJ (submitted)