guyana elections commission report 2006 oct to 2007 sept.pdf · guyana elections commission media...
TRANSCRIPT

Guyana Elections Commission Media Monitoring Unit
Monitoring Report: 1st October 2006 – 30th September 2007 Introduction: This report highlights but is not limited to the current reporting period of 1 July – 30 September 2007. It takes into account the fact that the end of this reporting period (30/09/07) culminates one (1) year since the continuation of the Media Monitoring Unit (MMU) after its official mandate to monitor and analyze Guyana’s media for the 2006 General and Regional elections expired on 30th September 2006. In recognition of this milestone the Unit is presenting within this report a comparative analysis of trends that evolved from each media organization (both broadcast and print) over the past year. This analysis is somewhat limited by the fact that the Unit only began doing quantitative analysis of local media content from 1st April 2007. However, this limitation has been neutralized by using the cross-sectional approach to arrive at a generalized picture of evolving media patterns over the past year. The six-month period between April and September 2007 is being used as a representative sample of the period under review because it gives an accurate snapshot of local media trends over the past year. The conclusions, generalizations and recommendations coming out of this report are premised on the observations and findings taken from this period. In future, the Unit intends to do this kind of comparative analysis bi-annually, in addition to the usual quarterly reports. Also, this report is being presented in a layout/format that allows for easy understanding of the information being presented. It essentially depicts quantitative analyses done in bar graphs and pie-charts for each medium which basically condenses or summarizes the amounts of positive and negative coverage in minutes and column inches (in the case of newspapers) given to each parliamentary party by the following TV stations, newspapers and radio station: Television GWTV Ch 2 CNS Ch 6 WRHM Ch 7 HBTV Ch 9 NCN Ch 11 VCT Ch 28 MTV Ch 65 Newspaper Stabroek News Kaieteur News Guyana Chronicle Radio Station Voice Of Guyana (VOG)
1

The Unit continues to be guided by the standards set out in the 2006 Media Code of Conduct, and as was done in our previous reports, we have highlighted and commented on instances where there has been serious breaches of the Code and where the norms and ethics of professional journalism have been violated in newspaper articles, TV talk-shows, newscasts and political programs. And, just for the record, the Unit wishes to point out that over the past year its monitoring activities were limited to the media’s coverage of those parties represented in parliament, namely: PPP/C, PNCR-1G, AFC, GAP/ROAR and TUF. Staff Changes: Mr. Jainarine Deonauth, resigned the position of manger of the MMU from 7th September 2007 and Mr. Remington Eastman assumed duties as the new manger with effect from 10th September 2007. The staff structure remains the same, that is, Manager, Deputy Manager and six (6) Media Monitors.
2

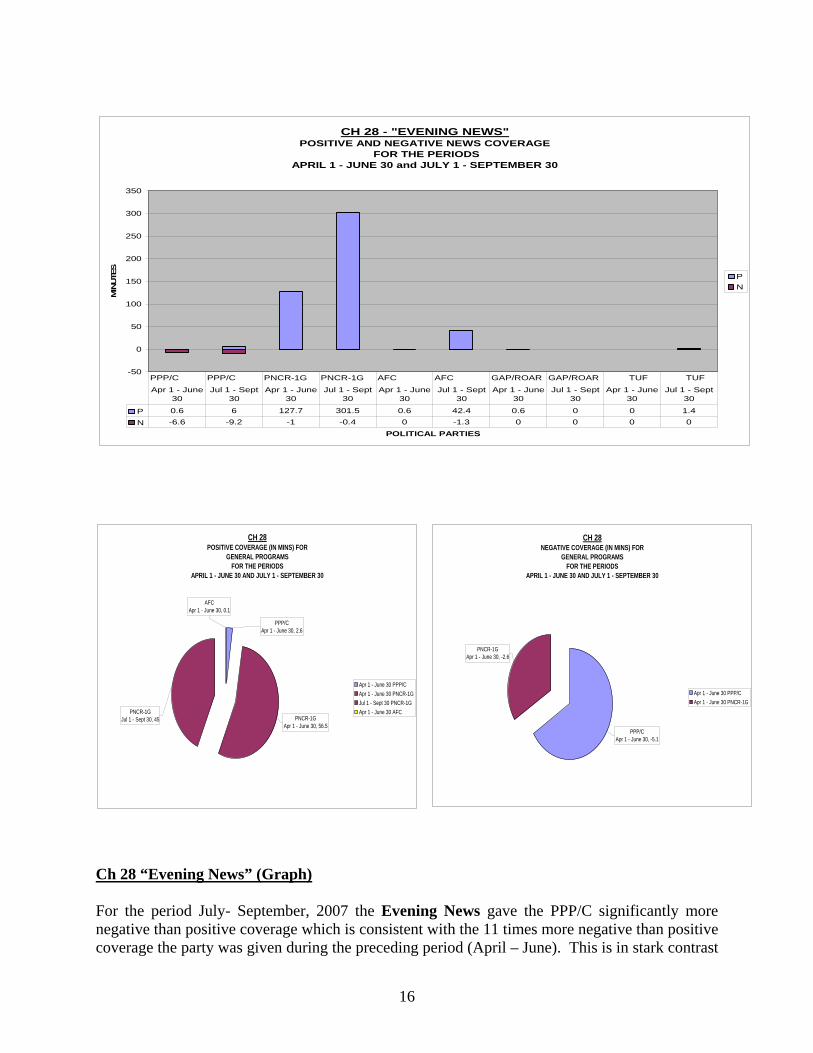
N B: The figures given on the bar graphs below depict the amounts of positive and negative coverage given for the periods April – June and July – September, 2007 to the Parliamentary Political Parties by each TV Station’s newscast, the newspapers and radio station. The Pie- Charts show the coverage given to the parties in the general programs of each TV station. General Programs are exclusive of the newscast and includes programs that contain political content such as Talk Shows, Current Affairs Programs, Magazine Programs, Commentaries and (Political) Party Programs. Even though the charts highlight the types and amounts of coverage each party received for the two periods under review, all the parties are not shown on every chart, because once a political party did not receive any measurable coverage for one or both of the periods it is not shown.
3

CH 02- "NEWS 2" POSITIVE AND NEGATIVE NEWS COVERAGE
FOR THE PERIODS APRIL 1 - JUNE 30 and JULY 1 - SEPTEMBER 30
-40
-20
0
20
40
60
80
100
120
POLITICAL PARTIES
MIN
UTE
S
PN
P 10.7 0.4 87.8 97.2 3 15.6 2.4 0 0 0
N -1.2 -1.2 -4.5 -21.7 0 0 0 0 0 0
PPP/C PPP/C PNCR-1G PNCR-1G AFC AFC GAP/ROAR GAP/ROAR TUF TUF
Apr 1 - June 30
Jul 1 - Sept 30
Apr 1 - June 30
Jul 1 - Sept 30
Apr 1 - June 30
Jul 1 - Sept 30
Apr 1 - June 30
Jul 1 - Sept 30
Apr 1 - June 30
Jul 1 - Sept 30
CH 02NEGATIVE COVERAGE (IN MINS) FOR
GENERAL PROGRAMSFOR THE PERIODS
APRIL 1 - JUNE 30 AND JULY 1 - SEPTEMBER 30
PPP/CApr 1 - June 30, -4
PNCR-1GJul 1 - Sept 30, -0.1
Apr 1 - June 30 PPP/CJul 1 - Sept 30 PNCR-1G
CH 02POSITIVE COVERAGE(IN MINS) FOR
GENERAL PROGRAMSFOR THE PERIODS
APRIL 1 - JUNE 30 AND JULY 1 - SEPTEMBER 30
PPP/CJul 1 - Sept 30, 1.4
PNCR-1GApr 1 - June 30, 0.2
Jul 1 - Sept 30 PPP/CApr 1 - June 30 PNCR-1G
CH 2 “News 2” (Graph) For the period July – September, 2007, News 2 gave 3 times more negative than positive coverage to the PPP/C compared to the preceding period of April – June, 2007 when the party received over 8 times more positive than negative coverage. On the other hand, the PNCR-1G received over 4 times more positive than negative coverage for July – September, 2007 and 19 times more positive than negative for the preceding period of April- June, 2007. Both the AFC and GAP/ROAR got comparatively small amounts of positive coverage for the two periods as against zero negative coverage, whilst the TUF did not register any positive or negative coverage for both periods. However, what is most striking about the distribution of coverage on this
4

newscast is that for the period July – September, 2007 the PNCR-1G received almost 6 times more positive coverage than all the other parties combined mirroring the preceding period of April – June when the party was given over 5 times more positive coverage than the other parties. General Programs (Charts) In the station’s general programs only the PNCR/1G and the PPP/C received any measurable coverage, with the PPP/C receiving a fair amount of positive coverage for the period July – September and a sizeable amount of negative coverage for the period April–June. Contrastingly, the PNCR-1G received a reasonable amount of positive coverage for the period April–June and an infinitesimally small amount of negative for the period July – September. The PPP/C did not register any negative coverage for the period April – June, neither the PNCR-1G for the period July – September. Analysis The graph for the newscast shows the PNCR-1G was given a tremendous amount of positive coverage compared to the other parties. However, it was the only party that received any significant amount of negative coverage. What is instructive though, is that the other political parties including the PPP/C were not covered much in the contents of the newscast. The evidence available to us at the Unit suggests that the PNCR- 1G is sought out more often by the News Team for that party’s views on current issues than the other parties, hence the disparity in the graph’s figures. News 2 is a fairly good newscast but needs more balance in its output. The station’s general programs featured only the two main political parties and the coverage both received does not imply any particular trend worth commenting on.
5

CH 06- "NEWS TODAY"POSITIVE AND NEGATIVE NEWS COVERAGE
FOR THE PERIODS APRIL 1 - JUNE 30 and JULY 1 - SEPTEMBER 30
-20
0
20
40
60
80
100
120
POLITICAL PARTIES
MIN
UTE
S
PN
P 4.2 8.2 71.6 112.2 0 10.2 0 0 0 0
N -3.2 -10 -1.3 -8.4 0 0 0 0 0 0
PPP/C PPP/C PNCR-1G PNCR-1G AFC AFC GAP/ROAR GAP/ROAR TUF TUF
Apr 1 - June 30
Jul 1 - Sept 30
Apr 1 - June 30
Jul 1 - Sept 30
Apr 1 - June 30
Jul 1 - Sept 30
Apr 1 - June 30
Jul 1 - Sept 30
Apr 1 - June 30
Jul 1 - Sept 30
CH 06 NEGATIVECOVERAGE (IN MINS) FOR
GENERAL PROGRAMSFOR THE PERIODS
APRIL 1 - JUNE 30 AND JULY 1 - SEPTEMBER 30
AFCJul 1 - Sept 30, -5.65AFC
Apr 1 - June 30, -1.4
PPP/CApr 1 - June 30, -15.1
PNCR-1GJul 1 - Sept 30, -23.15
PNCR-1GApr 1 - June 30, -10.5
PPP/CJul 1 - Sept 30, -67.5
Apr 1 - June 30 PPP/CJul 1 - Sept 30 PPP/CApr 1 - June 30 PNCR-1GJul 1 - Sept 30 PNCR-1GApr 1 - June 30 AFCJul 1 - Sept 30 AFC
CH 06POSITIVE COVERAGE (IN MINS) FOR
GENERAL PROGRAMSFOR THE PERIODS
APRIL 1 - JUNE 30 AND JULY 1 - SEPTEMBER 30
PNCR-1GJul 1 - Sept 30, 53.9
AFCApr 1 - June 30, 0.46
AFCJul 1 - Sept 30, 0.4
TUFJul 1 - Sept 30, 0.1
PPP/CApr 1 - June 30, 4.36
PPP/CJul 1 - Sept 30, 4.6
PNCR-1GApr 1 - June 30, 2.06
Apr 1 - June 30 PPP/CJul 1 - Sept 30 PPP/CApr 1 - June 30 PNCR-1GJul 1 - Sept 30 PNCR-1GApr 1 - June 30 AFCJul 1 - Sept 30 AFCJul 1 - Sept 30 TUF
CH 6 “News Today” (Graph) For the period July – September 2007, News Today gave the PPP/C slightly more negative coverage than positive which contrasts with what occurred during the previous reporting period of April – June when the party received slightly more positive than negative coverage. The PNCR-1G received 13 times more positive coverage than negative for the period July – September and though this may be considered a bit uneven it pales in magnitude to the previous reporting period (April – June) when the positive to negative coverage was in the ratio of almost
6
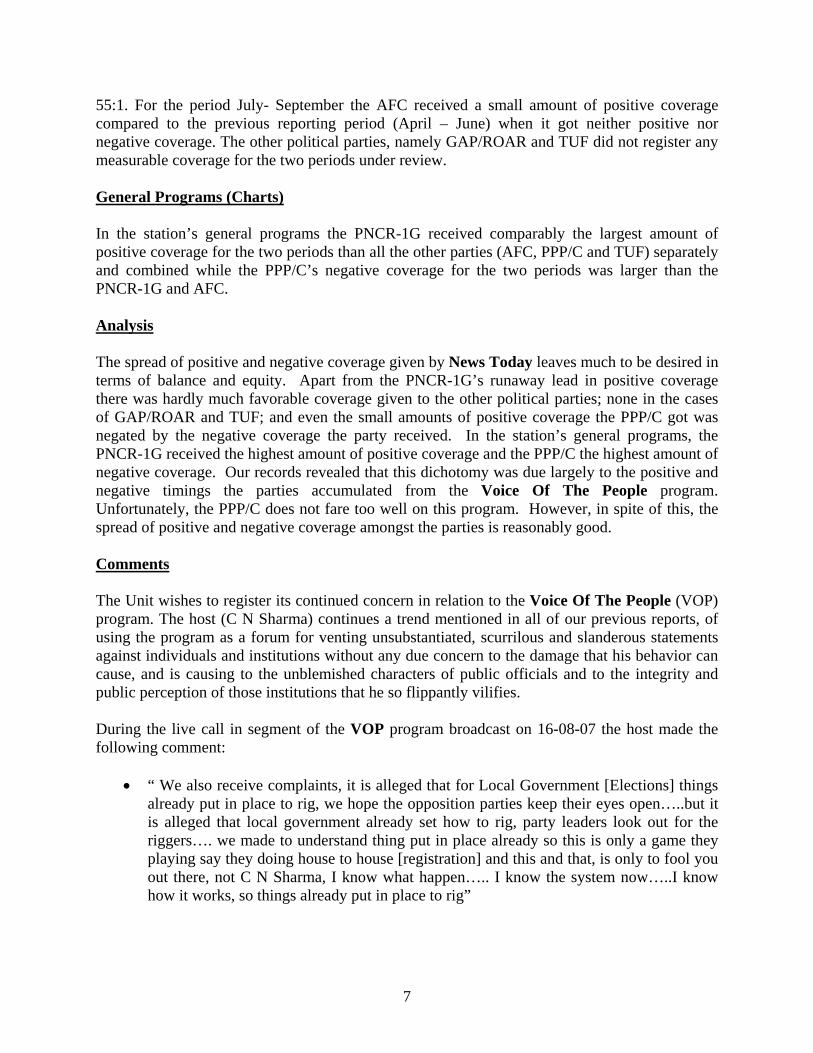
55:1. For the period July- September the AFC received a small amount of positive coverage compared to the previous reporting period (April – June) when it got neither positive nor negative coverage. The other political parties, namely GAP/ROAR and TUF did not register any measurable coverage for the two periods under review. General Programs (Charts) In the station’s general programs the PNCR-1G received comparably the largest amount of positive coverage for the two periods than all the other parties (AFC, PPP/C and TUF) separately and combined while the PPP/C’s negative coverage for the two periods was larger than the PNCR-1G and AFC. Analysis The spread of positive and negative coverage given by News Today leaves much to be desired in terms of balance and equity. Apart from the PNCR-1G’s runaway lead in positive coverage there was hardly much favorable coverage given to the other political parties; none in the cases of GAP/ROAR and TUF; and even the small amounts of positive coverage the PPP/C got was negated by the negative coverage the party received. In the station’s general programs, the PNCR-1G received the highest amount of positive coverage and the PPP/C the highest amount of negative coverage. Our records revealed that this dichotomy was due largely to the positive and negative timings the parties accumulated from the Voice Of The People program. Unfortunately, the PPP/C does not fare too well on this program. However, in spite of this, the spread of positive and negative coverage amongst the parties is reasonably good. Comments The Unit wishes to register its continued concern in relation to the Voice Of The People (VOP) program. The host (C N Sharma) continues a trend mentioned in all of our previous reports, of using the program as a forum for venting unsubstantiated, scurrilous and slanderous statements against individuals and institutions without any due concern to the damage that his behavior can cause, and is causing to the unblemished characters of public officials and to the integrity and public perception of those institutions that he so flippantly vilifies. During the live call in segment of the VOP program broadcast on 16-08-07 the host made the following comment:
• “ We also receive complaints, it is alleged that for Local Government [Elections] things already put in place to rig, we hope the opposition parties keep their eyes open…..but it is alleged that local government already set how to rig, party leaders look out for the riggers…. we made to understand thing put in place already so this is only a game they playing say they doing house to house [registration] and this and that, is only to fool you out there, not C N Sharma, I know what happen….. I know the system now…..I know how it works, so things already put in place to rig”
7

And in the VOP program broadcast on 23-08-07 the host stated: • “Mr. Sattaur, you are the one responsible, you are responsible for crime in this country,
you responsible for all the children starving in the streets, you responsible for all the women doing prostitution in the street, because you know why? they cannot find money to maintain their children…..you responsible for all those people committing suicide, you responsible for all those senior citizens who cannot get food to eat….you are responsible for the destitute in the streets”
Though CN Sharma is renowned for making crass statements, his modus operandi of attacking institutions (in this case GECOM) and public officials (in this case Mr. Kurshid Sattaur, Commissioner- General of the Guyana Revenue Authority) without any factual evidence to support his allegations, should be seen against the background of his program being immensely popular in the country and accessible to a large external audience via the internet. These factors when taken into consideration underscore the potential of the host to negatively influence a large gullible mass of people through the peddling of inaccuracies and falsehoods. The Unit wishes to express its oft stated view (reflected in previous reports) that the host of the VOP program should be cautioned for unprofessional conduct and bringing the profession into disrepute.
8
CH 07 - "CAPITOL NEWS" POSITIVE AND NEGATIVE NEWS COVERAGE
FOR THE PERIODS APRIL 1 - JUNE 30 and JULY 1 - SEPTEMBER 30
-10
0
10
20
30
40
50
60
70
80
POLITICAL PARTIES
MIN
UTE
S
PN
P 0.4 12.1 26.9 72 0.8 24 0.4 0.1 0 0.1
N 0 -1.6 -0.2 -1.7 0 0 0 0 0 0
PPP/C PPP/C PNCR-1G PNCR-1G AFC AFC GAP/ROAR GAP/ROAR TUF TUF
Apr 1 - June 30
Jul 1 - Sept 30
Apr 1 - June 30
Jul 1 - Sept 30
Apr 1 - June 30
Jul 1 - Sept 30
Apr 1 - June 30
Jul 1 - Sept 30
Apr 1 - June 30
Jul 1 - Sept 30
CH 07POSITIVE COVERAGE (IN MINS) FOR
GENERAL PROGRAMSFOR THE PERIODS
APRIL 1 - JUNE 30 AND JULY 1 - SEPTEMBER 30
PNCR-1GJul 1 - Sept 30, 36.1
PPP/CJul 1 - Sept 30, 0.8
GAP/ROARApr 1 - June 30, 0.2
Jul 1 - Sept 30 PPP/CJul 1 - Sept 30 PNCR-1GApr 1 - June 30 GAP/ROAR
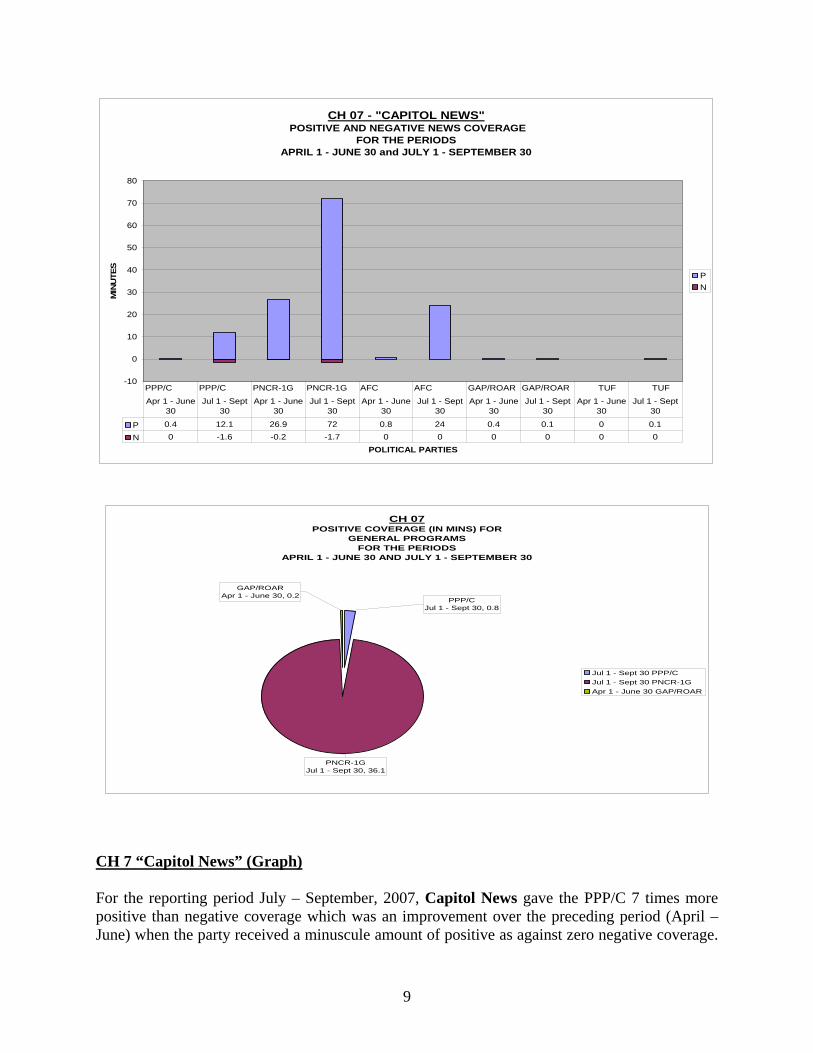
CH 7 “Capitol News” (Graph) For the reporting period July – September, 2007, Capitol News gave the PPP/C 7 times more positive than negative coverage which was an improvement over the preceding period (April – June) when the party received a minuscule amount of positive as against zero negative coverage.
9
On the other hand, the PNCR-1G received approximately 42 times more positive than negative coverage for the period July – September which is far less compared to the previous period of April – June when the party was given 134 times more positive than negative coverage. The AFC got a reasonable share of positive coverage for the period July – September compared to the measly amount the party received during April – June. During both periods the party did not received any negative coverage. GAP/ROAR and TUF barely received either positive or negative coverage for both periods. General Program (Chart) Only 3 parties were covered in the station’s general programs for the periods under review and of the 3 the PNCR-1G received a larger amount of positive coverage than the PPP/C for the period July – September. GAP/ ROAR was the only party positively covered for the period April – June while none of the 3 parties received any negative coverage for the two periods (hence only one (1) chart is depicted above). Analysis The graph for Capitol News and the chart for the station’s general programs show a disproportionate spread of positive coverage in favor of the PNCR-1G. The AFC and PPP/C received varying amounts of positive coverage for one period only. To rectify this obvious imbalance, the newscast needs to solicit and publicize the views of all the parliamentary stakeholders on those issues for which only the PNCR-1G’s views are given publicity. The Unit knows that this may not be possible in every instance but it is worth the effort in order to achieve balance and equity in the station’s programs.
10

CH 09 - "PRIME NEWS"POSITIVE AND NEGATIVE NEWS COVERAGE
FOR THE PERIODS APRIL 1 - JUNE 30 and JULY 1 - SEPTEMBER 30
-20
0
20
40
60
80
100
120
POLITICAL PARTIES
MIN
UTE
S
PN
P 7.1 3.2 58.2 113 7.1 24.1 0.2 0 0.2 0
N -2.2 -3.2 -1.8 -8.8 0 0 0 0 0 0
PPP/C PPP/C PNCR-1G PNCR-1G AFC AFC GAP/ROAR GAP/ROAR TUF TUF
Apr 1 - June 30
Jul 1 - Sept 30
Apr 1 - June 30
Jul 1 - Sept 30
Apr 1 - June 30
Jul 1 - Sept 30
Apr 1 - June 30
Jul 1 - Sept 30
Apr 1 - June 30
Jul 1 - Sept 30
CH O9NEGATIVE COVERAGE (IN MINS) FOR
GENERAL PROGRAMSFOR THE PERIODS
APRIL 1 - JUNE 30 AND JULY 1 - SEPTEMBER 30
PPP/CJul 1 - Sept 30, -88.4
PNCR-1GApr 1 - June 30, -28.7
PNCR-1GJul 1 - Sept 30, -10.5 AFC
Apr 1 - June 30, -1
PPP/CApr 1 - June 30, -29.7
Apr 1 - June 30 PPP/CJul 1 - Sept 30 PPP/CApr 1 - June 30 PNCR-1GJul 1 - Sept 30 PNCR-1GApr 1 - June 30 AFC
CH 09POSITIVE COVERAGE(IN MINS) FOR
GENERAL PROGRAMSFOR THE PERIODS
APRIL 1 - JUNE 30 AND JULY 1 - SEPTEMBER 30
PNCR-1GJul 1 - Sept 30, 1793.6
TUFJul 1 - Sept 30, 0.1
TUFApr 1 - June 30, 2.6
GAP/ROARJul 1 - Sept 30, 1.6
GAP/ROARApr 1 - June 30, 0.6
AFCJul 1 - Sept 30, 1AFC
Apr 1 - June 30, 1.6 PPP/CJul 1 - Sept 30, 10.2
PPP/CApr 1 - June 30, 11.4
PNCR-1GApr 1 - June 30, 1178.1
Apr 1 - June 30 PPP/CJul 1 - Sept 30 PPP/CApr 1 - June 30 PNCR-1GJul 1 - Sept 30 PNCR-1GApr 1 - June 30 AFCJul 1 - Sept 30 AFCApr 1 - June 30 GAP/ROARJul 1 - Sept 30 GAP/ROARApr 1 - June 30 TUFJul 1 - Sept 30 TUF
Ch 9 “Prime News” (Graph) For the period July – September, 2007 Prime News gave the PPP/C similar amounts of positive and negative coverage. This varies from the preceding period (April – June) when the party was given 3 times more positive than negative coverage. The PNCR-1G received almost 13 times more positive than negative coverage for the period July – September which is less when compared to a ratio of 32:1 for the period April – June. The AFC received a fair amount of positive coverage for the period July – September which was an improvement over the preceding
11

period (April – June). Moreover, for both periods the party did not received any negative coverage. Conversely, for both periods, GAP/ROAR and TUF did not receive any measurable positive or negative coverage. General Program (Charts) In the station’s general programs, all the political parties received varying amounts of positive coverage but the PNCR-1G accumulated almost 73 times more positive coverage than the other parties combined for the period April – June and 139 times more positive coverage for the period July – September. Only 3 parties were negatively covered: the AFC for one period (April – June) and the PPP/C and PNCR-1G for both periods. The PPP/C received the largest amount of negative coverage during both periods; however, for the period July – September, the party accumulated 8 times more negative coverage than the PNCR-1G. Analysis The figures on the Prime News graph indicate that the PNCR-1G received an overwhelming amount of positive coverage compared to the other parties and correspondingly it also got the highest amount of negative coverage. However, the negative coverage the party received is quite insignificant compared to its positive coverage. The PPP/C and AFC are the only other parties to receive any measurable positive coverage, though in one instance the PPP/C’s positive coverage is balanced out by the negative coverage it received. What the graph shows is that the newscast still has a long way to go to achieve balance and equity amongst the political parties. The station’s general programs also show the PNCR-1G receiving a monopoly of positive coverage. This trend is directly related to the party hosting a paid political program (Nation Watch) on the station twice weekly. Comment On the program “Walter Rodney Groundings” broadcast on HBTV Ch 9 (14-08-07) the host Deon Abrams made the following unsubstantiated remarks which the Unit feels were laced with racially divisive overtones and deliberately intended to impugn the integrity of our justice system.
• “We also have another bill…..we see what has been happening, we know that even prior to this bill that was passed, certain cases, all the government cases would have gone before a Singh and a Ramlall and we know where the judgements would be, so now in this instance you know what could happen, it gives scope for wider discrimination in terms of how cases can be handled in the courts…”
The extremist views of this host has already been highlighted and commented upon in many of our previous reports, the latest being our report for the period April – June, 2007. It is obvious that Mr. Abrams’ personal dislike for the current government knows no bounds and he uses this program as a forum to express his subjectivities in an unprofessional and unrefined way having no regards for the veracity of the information that is being disseminated to the public.
12

The unit reiterates its position that communicators of information to the general public who utilize the national airwaves, have a duty to put the national good above all other considerations. Likewise, the owners/mangers/editors of TV stations should exercise more control/sanctions over the programs that are broadcast from their channels, especially in those instances where program content is at variance with the spirit of the 2006 Media Code of Conduct.
• On Thursday, 20th September 2007, “Prime News” aired a story in connection with the alleged beating and torture of two male residents of Buxton by the security forces. In the insert to the story one of the victims in describing his ordeal used the F word twice. The Unit would like to point out that the insert was recorded rather than live and as such the editor of the newscast had ample time to edit out the expletives for good taste before broadcasting the story on national television. Further, at that time of the evening when the newscast was aired [18:30hrs-19:00hrs], it is very likely that children at home were part of the viewing audience. The Unit wishes to advise the management of the station and the editor of Prime News in particular to treat more carefully with the material that is being disseminated to the public since the unedited broadcast of profane language on national TV can contribute to the erosion of the moral fabric of our society.
13

CH 11 - "NCN 6 O'CLOCK NEWS"
POSITIVE AND NEGATIVE NEWS COVERAGE FOR THE PERIODS
APRIL 1 - JUNE 30 and JULY 1 - SEPTEMBER 30
-60
-40
-20
0
20
40
60
80
100
120
POLITICAL PARTIES
MIN
UTE
S
PN
P 31.7 44.4 48.3 98.5 11.8 26.5 2.3 0 0.1 0
N -1.4 -1.2 -21.5 -40.4 -0.1 0 -0.9 0 0 0
PPP/C PPP/C PNCR-1G PNCR-1G AFC AFC GAP/ROAR GAP/ROAR TUF TUF
Apr 1 - June 30
Jul 1 - Sept 30
Apr 1 - June 30
Jul 1 - Sept 30
Apr 1 - June 30
Jul 1 - Sept 30
Apr 1 - June 30
Jul 1 - Sept 30
Apr 1 - June 30
Jul 1 - Sept 30
CH 11
NEGATIVE COVERAGE (IN MINS) FORGENERAL PROGRAMS
FOR THE PERIODSAPRIL 1 - JUNE 30 AND JULY 1 - SEPTEMBER 30
PNCR-1GJul 1 - Sept 30, -10.3
PNCR-1GApr 1 - June 30, -4.4
Apr 1 - June 30 PNCR-1GJul 1 - Sept 30 PNCR-1G
CH 11 POSITIVE COVERAGE (IN MINS) FOR
GENERAL PROGRAMSFOR THE PERIODS
APRIL 1 - JUNE 30 AND JULY 1 - SEPTEMBER 30
PPP/CJul 1 - Sept 30, 67.2
AFCJul 1 - Sept 30, 4.1 GAP/ROAR
Apr 1 - June 30, 0.4AFC
Apr 1 - June 30, 0.7
PNCR-1GJul 1 - Sept 30, 7.6
PNCR-1GApr 1 - June 30, 2.9
PPP/CApr 1 - June 30, 9.4
Apr 1 - June 30 PPP/CJul 1 - Sept 30 PPP/CApr 1 - June 30 PNCR-1GJul 1 - Sept 30 PNCR-1GApr 1 - June 30 AFCJul 1 - Sept 30 AFCApr 1 - June 30 GAP/ROAR
Ch 11 “NCN 6 O’clock News” (Graph) For the period July – September, 2007 the 6 O’ Clock News gave the PPP/C 37 times more positive than negative coverage which is slightly more than the previous reporting period of April – June when the party received 22 times more positive than negative coverage. The PNCR-1G was given approximately 2 times more positive than negative coverage for both
14
periods. The AFC received comparatively fair amounts of positive coverage for both periods and a barely measurable amount of negative. Both GAP/ROAR and TUF got tiny amounts of positive coverage for April – June while TUF did not receive any negative coverage for the two periods. GAP/ROAR was given a very minute amount of negative coverage for the period April – June. General Programs (Charts) In this station’s general programs, 4 political parties received varying amounts of positive coverage, however, GAP/ROAR recorded coverage for only one period (April – June). The PPP/C accumulated almost 6 times more positive coverage than the other parties combined for the period July – September and twice the amount for the period April – June. Interestingly only the PNCR-1G received negative coverage for both periods. Analysis The graph for the 6 0’Clock News and the charts for the station’s general programs show a consistent trend, that is, only the PNCR-1G was given significant amounts of negative coverage in both instances. As a matter a fact, in the general programs only the PNCR-1G received negative coverage; the other parties did not. The newscast did manag to achieve some amount of equity in its allotment of positive coverage to the parties. However, in the general programs of the station, the PPPC/C received the largest amount of positive coverage which our records show is a direct result of the surfeit of government (GINA) programs aired on this channel which are mostly favorable to the ruling party (PPP/C) and unfavorable to the main opposition party (PNCR-1G). More balance needs to be injected into the general programming (especially GINA programs) aired on this station.
15
CH 28 - "EVENING NEWS"
POSITIVE AND NEGATIVE NEWS COVERAGE FOR THE PERIODS
APRIL 1 - JUNE 30 and JULY 1 - SEPTEMBER 30
-50
0
50
100
150
200
250
300
350
POLITICAL PARTIES
MIN
UTE
S
PN
P 0.6 6 127.7 301.5 0.6 42.4 0.6 0 0 1.4
N -6.6 -9.2 -1 -0.4 0 -1.3 0 0 0 0
PPP/C PPP/C PNCR-1G PNCR-1G AFC AFC GAP/ROAR GAP/ROAR TUF TUF
Apr 1 - June 30
Jul 1 - Sept 30
Apr 1 - June 30
Jul 1 - Sept 30
Apr 1 - June 30
Jul 1 - Sept 30
Apr 1 - June 30
Jul 1 - Sept 30
Apr 1 - June 30
Jul 1 - Sept 30
CH 28
NEGATIVE COVERAGE (IN MINS) FORGENERAL PROGRAMS
FOR THE PERIODSAPRIL 1 - JUNE 30 AND JULY 1 - SEPTEMBER 30
PNCR-1GApr 1 - June 30, -2.6
PPP/CApr 1 - June 30, -5.1
Apr 1 - June 30 PPP/CApr 1 - June 30 PNCR-1G
CH 28POSITIVE COVERAGE (IN MINS) FOR
GENERAL PROGRAMSFOR THE PERIODS
APRIL 1 - JUNE 30 AND JULY 1 - SEPTEMBER 30
AFCApr 1 - June 30, 0.1
PPP/CApr 1 - June 30, 2.6
PNCR-1GJul 1 - Sept 30, 45 PNCR-1G
Apr 1 - June 30, 56.5
Apr 1 - June 30 PPP/CApr 1 - June 30 PNCR-1GJul 1 - Sept 30 PNCR-1GApr 1 - June 30 AFC
Ch 28 “Evening News” (Graph) For the period July- September, 2007 the Evening News gave the PPP/C significantly more negative than positive coverage which is consistent with the 11 times more negative than positive coverage the party was given during the preceding period (April – June). This is in stark contrast
16

to the PNCR-1G which was given comparatively huge amounts of positive coverage for both periods as against the negative coverage the party was accorded. The PNCR-1G received 753 times more positive than negative coverage for the July – September period, while in the April – June period, the ratio of positive to negative was approximately 127:1. The AFC received a fairly good amount of positive coverage for the period July – September and an insignificant amount for April – July. GAP/ROAR and TUF hardly received any kinds of coverage for either period. General Programs (Charts) Three (3) parties were positively covered in this station’s general programs with the PNCR-1G being the only party receiving positive coverage for both periods. The PNCR-1G was given almost 21 times more positive coverage than the PPP/C and the AFC combined for the period April – June and was the only party that received any measurable or significant positive coverage for July – September. The PNCR-1G and PPP/C were the only 2 parties receiving negative coverage for the period April – June. During this period (April – June) the PPP/C received almost twice the amount of negative coverage given to the PNCR-1G. Analysis The skewness of the Evening News graph in favor of the PNCR-1G is most revealing when viewed against the fact that the party received zero negative coverage compared to the huge amount of positive coverage it was given. The small amounts of positive coverage the PPP/C accrued in the newscast and the station’s general programs were considerably less than the negative it received. The AFC barely made an impression. The Evening News needs to be fairer to the other political parties especially the PPP/C, and it goes without saying that the newscast needs a stiff and sustained injection of balance and equity to bring it on par with what is expected from a professional newscast. The larger positive coverage that the PNCR-1G received over the other parties in the station’s general programs is a direct result of the broadcast of the program “Commentary” hosted by the owner of the station who is also a PNCR-1G Parliamentarian.
17

CH 65 - "NEWS UPDATE"POSITIVE AND NEGATIVE NEWS COVERAGE
FOR THE PERIODS APRIL 1 - JUNE 30 and JULY 1 - SEPTEMBER 30
-30
-20
-10
0
10
20
30
40
50
60
70
POLITICAL PARTIES
MIN
UTE
S
PN
P 48.53 48.7 30.93 60.7 0.73 6.8 0.3 0.2 0.3 0.2
N -0.1 -0.2 -13.1 -25.6 -0.3 0 -0.3 0 0 0
PPP/C PPP/C PNCR-1G PNCR-1G AFC AFC GAP/ROAR GAP/ROAR TUF TUF
Apr 1 - June 30
Jul 1 - Sept 30
Apr 1 - June 30
Jul 1 - Sept 30
Apr 1 - June 30
Jul 1 - Sept 30
Apr 1 - June 30
Jul 1 - Sept 30
Apr 1 - June 30
Jul 1 - Sept 30
CH 65NEGATIVE COVERAGE (IN MINS)FOR
GENERAL PROGRAMSFOR THE PERIODS
APRIL 1 - JUNE 30 AND JULY 1 - SEPTEMBER 30
PNCR-1GJul 1 - Sept 30, -33.6
PPP/CApr 1 - June 30, -0.1
AFCJul 1 - Sept 30, -5
PNCR-1GApr 1 - June 30, -4
Apr 1 - June 30 PPP/CApr 1 - June 30 PNCR-1GJul 1 - Sept 30 PNCR-1GJul 1 - Sept 30 AFC
CH 65POSITIVE COVERAGE (IN MINS) FOR
GENERAL PROGRAMSFOR THE PERIODS
APRIL 1 - JUNE 30 AND JULY 1 - SEPTEMBER 30
PPP/CJul 1 - Sept 30, 400
AFCApr 1 - June 30, 0.6
PNCR-1GJul 1 - Sept 30, 8.5
PNCR-1GApr 1 - June 30, 1.6
AFCJul 1 - Sept 30, 0.4
GAP/ROARApr 1 - June 30, 0.6
GAP/ROARJul 1 - Sept 30, 0.2
TUFJul 1 - Sept 30, 0.2
PPP/CApr 1 - June 30, 31.03
Apr 1 - June 30 PPP/CJul 1 - Sept 30 PPP/CApr 1 - June 30 PNCR-1GJul 1 - Sept 30 PNCR-1GApr 1 - June 30 AFCJul 1 - Sept 30 AFCApr 1 - June 30 GAP/ROARJul 1 - Sept 30 GAP/ROARJul 1 - Sept 30 TUF
Ch 65 “News Update” (Graph) During the period July – September 2007, News Update gave the PPP/C approximately 243 times more positive than negative coverage and for the period April – June the ratio was considerably higher at 485:1. For both periods the negative coverage given to the party was
18

barely measurable. The PNCR-1G consistently received approximately 2 times more positive than negative coverage for both periods. The AFC, GAP/ROAR and TUF all received small amounts of positive coverage during both periods, however, only the AFC and GAP/ROAR received negative coverage in quantifiable amounts for the April – June period. General Programs (Charts) In the general programs of this station all the political parties with the exception of TUF were positively covered during both periods; the TUF was only given positive coverage for the period July – September, 2007. The PPP/C accumulated 11 times more positive coverage than all the other parties combined for the period April – June, while the equation was 43 times more for the period July – September. On the other hand, only the PPP/C, PNCR-1G and AFC were negatively covered with the PNCR-1G alone receiving negative coverage for both periods. For the period July – September, the PNCR-1G accumulated 67 times more negative coverage than the AFC and for the period April – June the party was given 40 times more negative coverage than the PPP/C. Analysis The graph for News Update shows that only the PNCR-1G was negatively covered but the party also received the largest positive coverage for any of the periods. All the other parties were positively covered for both periods including TUF which is a commendable feat on the part of the news team. The comparably disproportionate amounts of negative coverage given to the PNCR-1G needs to be addressed; this aside, the figures on the graph indicate that over the past 6 months the news team has tried to achieve some measure of balance and equity in their output. The charts depicting the general programs of the station show the PPP/C gaining the largest amount of positive coverage and the PNCR-1G the biggest amount of negative. The Unit’s records show that there is a direct relationship between this trend and the twice weekly broadcast of the program “Getting It Right”. This program is a paid PPP/C party program and is noted for being critical of the opposition parties especially the PNCR-1G.
19

20
General Observations – Television
The interpretation of the figures seen on the graphs and charts for each television station makes for informative and instructive reading. The figures revealed a trend amongst TV stations whereby news and information are being disseminated to the general public in a biased and unbalanced way designed to portray particular political parties in a favorable light. The Unit’s records show that the apportioning of positive and negative coverage to political parties in most instances has nothing to do with their participation or non-participation in the country’s political and social affairs, but rather the virtual monopoly given to these parties (most notably the PNCR-1G and PPP/C) to air their views on current issues. Some newscasts have willingly or unwittingly become the public relations arm for political parties and the graphs bring out this practice in a profoundly scientific and objective way that is unchallengeable. Notwithstanding the fact that some political parties accumulate lots of positive coverage on television through paid political programs complemented by other programs such as talk-shows, which in most cases have a political hue, there is a definite lack of balance and equity in most newscasts.

TOTAL POSITIVE AND NEGATIVE COVERAGE (MINS) EACH PARTY RECEIVED FROM TELEVISION STATIONS FOR THE PERIOD
APRIL – JUNE AND JULY – SEPTEMBER, 2007
POSITIVE COVERAGE(MINS) NEGATIVE COVERAGE (MINS)
NEWS GENERAL PROGRAMS TOTAL POSITIVE
COVERAGE (MINS) NEWS
GENERAL
PROGRAMS
TOTAL NEGATIVE COVERAGE (MINS)
CHANNEL
PARTY
Apr 1- June 30
July 1- Sept 30
Apr 1- June 30
July 1- Sept 30
Apr 1- June 30
July 1- Sept 30
Apr 1- June 30
July 1- Sept 30
Apr 1- June 30
July 1- Sept 30
Apr 1- June 30
July 1- Sept 30
PPP/C 10.7 0.4 0 1.4 10.7 1.8 -1.2 -1.2 -4 0 -5.2 -1.2PNCR-1G 87.8 97.2 0.2 0 88 97.2 -4.5 -21.7 0 -0.1 -4.5 -21.8AFC 3 15.6 0 0 3 15.6 0 0 0 0 0 0 GAP/ROAR 2.4 0 0 0 2.4 0 0 0 0 0 0 0
2
TUF 0 0 0 0 0 0 0 0 0 0 0 0 PPP/C 4.2 8.2 4.36 4.6 8.56 12.8 -3.2 -10 -15.1 -67.5 -18.3 -77.5 PNCR-1G 71.6 112.2 2.06 53.9 73.66 166.1 -1.3 -8.4 -10.5 -23.15 -11.8 -31.55 AFC 0 10.2 0.46 0.4 0.46 10.6 0 0 -1.4 -5.65 -1.4 -5.65GAP/ROAR 0 0 0 0 0 0 0 0 0 0 0 0
6
TUF 0 0 0 0.1 0 0.1 0 0 0 0 0 0 PPP/C 6 0 0 0 -1.6 0.4 12.1 0 0.8 0.4 12.9 0 -1.PNCR-1G 26.9 72 0 36.1 26.9 108.1 -0.2 -1.7 0 0 -0.2 -1.7AFC 0.8 24 0 0 0.8 24 0 0 0 0 0 0 GAP/ROAR 0.4 0.1 0.2 0 0.6 0.1 0 0 0 0 0 0
7
TUF 0 0.1 0 0 0 0.1 0 0 0 0 0 0 PPP/C 7.1 3.2 11.4 10.2 18.5 13.4 -2.2 -3.2 -29.7 -88.4 -31.9 -91.6 PNCR-1G 58.2 113 1178.1 1793.6 1236.3 1906.6 -1.8 -8.8 -28.7 -10.5 -30.5 -19.3 AFC 7.1 24.1 1.6 1 8.7 25.1 0 0 -1 0 -1 0GAP/ROAR 0.2 0 0.6 1.6 0.8 1.6 0 0 0 0 0 0
9
TUF 0.2 0 2.6 0.1 2.8 0.1 0 0 0 0 0 0 PPP/C 31.7 44.4 9.4 67.2 41.1 111.6 -1.4 -1.2 0 0 -1.4 -1.2PNCR-1G 48.3 98.5 2.9 7.6 51.2 106.1 -21.5 -40.4 -4.4 -10.3 -25.9 -50.7 AFC 11.8 26.5 0.7 4.1 12.5 30.6 -0.1 0 0 0 -0.1 0 GAP/ROAR 2.3 0 0.4 0 2.7 0 -0.9 0 0 0 -0.9 0
11
TUF 0.1 0 0 0 0.1 0 0 0 0 0 0 0
21
22
POSITIVE COVERAGE(MINS) NEGATIVE COVERAGE (MINS)
NEWS GENERAL PROGRAMS TOTAL POSITIVE
COVERAGE (MINS) NEWS
GENERAL
PROGRAMS
TOTAL NEGATIVE COVERAGE (MINS)
CHANNEL
PARTY
Apr 1- June 30
July 1- Sept 30
Apr 1- June 30
July 1- Sept 30
Apr 1- June 30
July 1- Sept 30
Apr 1- June 30
July 1- Sept 30
Apr 1- June 30
July 1- Sept 30
Apr 1- June 30
July 1- Sept 30
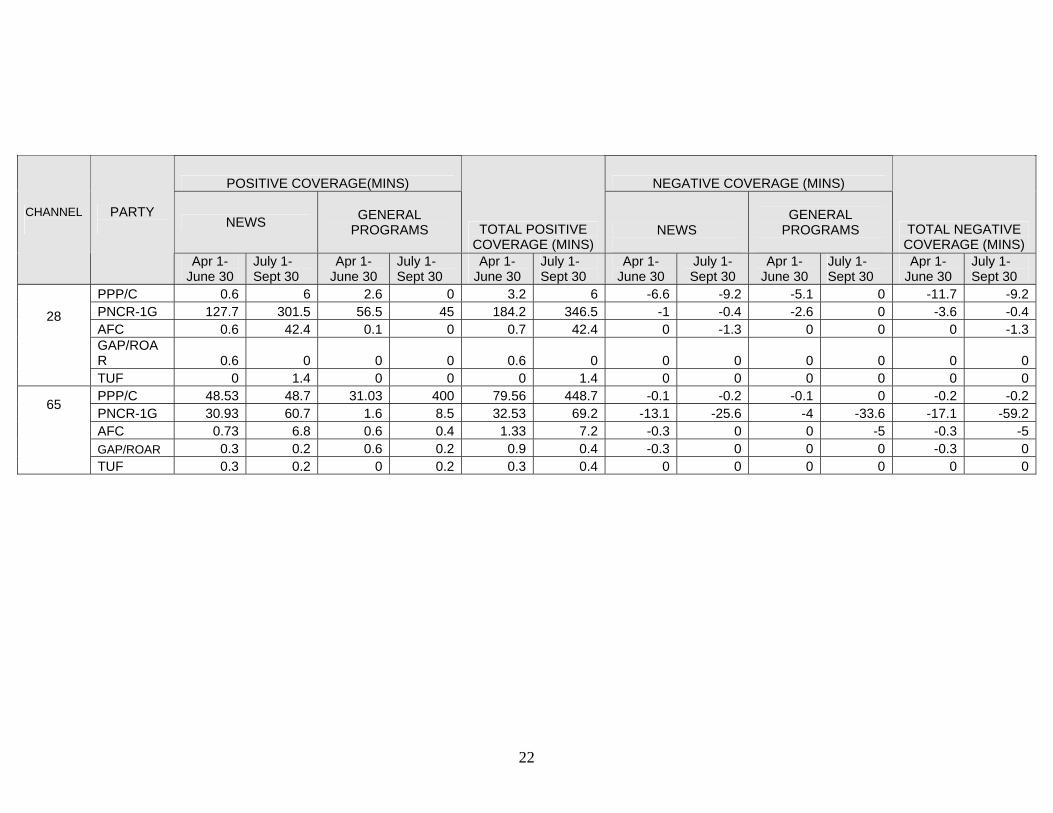
PPP/C 0.6 6 2.6 0 3.2 6 -6.6 -9.2 -5.1 0 -11.7 -9.2PNCR-1G 127.7 301.5 56.5 45 184.2 346.5 -1 -0.4 -2.6 0 -3.6 -0.4AFC 0.6 42.4 0.1 0 0.7 42.4 0 -1.3 0 0 0 -1.3 GAP/ROAR 0.6 0 0 0 0.6 0 0 0 0 0 0 0
28 TUF 0 1.4 0 0 0 1.4 0 0 0 0 0 0
PPP/C 48.53 48.7 31.03 400 79.56 448.7 -0.1 -0.2 -0.1 0 -0.2 -0.2 PNCR-1G 30.93 60.7 1.6 8.5 32.53 69.2 -13.1 -25.6 -4 -33.6 -17.1 -59.2 AFC 0.73 6.8 0.6 0.4 1.33 7.2 -0.3 0 0 -5 -0.3 -5GAP/ROAR 0.3 0.2 0.6 0.2 0.9 0.4 -0.3 0 0 0 -0.3 0
65 TUF 0.3 0.2 0 0.2 0.3 0.4 0 0 0 0 0 0

STABROEK NEWSPOSITIVE AND NEGATIVE COVERAGE
FOR THE PERIODS APRIL 1 - JUNE 30 and JULY 1 - SEPTEMBER 30, 2007
-600
-400
-200
0
200
400
600
800
1000
1200
1400
1600
POLITICAL PARTIES
COLU
MN IN
CHES
PN
P 143.55 138.18 538.5 1312.53 108 387.5 73.1 29.2 4.2 0
N -80.83 -180.73 -384.98 -484.9 -26.93 -16.5 -6 0 0 -0.6
PPP/C PPP/C PNCR-1G PNCR-1G AFC AFC GAP/ROAR GAP/ROAR TUF TUF
Apr 1 - June 30
Jul 1 - Sept 30
Apr 1 - June 30
Jul 1 - Sept 30
Apr 1 - June 30
Jul 1 - Sept 30
Apr 1 - June 30
Jul 1 - Sept 30
Apr 1 - June 30
Jul 1 - Sept 30
Stabroek News (Graph) The PPP/C received slightly more negative than positive coverage from the Stabroek News for the period July – September, 2007 which contrasted with the preceding period of April – June when the party was given considerably more positive than negative coverage. On the other hand, the PNCR-1G, consistently received more positive than negative coverage during both periods. The AFC received 23 times more positive than negative coverage during the period July - September compared to a ratio of 4:1 for the period of April – June. GAP/ROAR was given fairly reasonable positive coverage in both periods and a negligible amount of negative for the April – June period. TUF registered a small amount of positive coverage for the period April – June and a tiny amount of negative for July – September. Analysis The spread of positive and negative coverage given to the 5 political parties though good is somewhat sullied by the greater amount of negative to positive coverage the PPP/C received for the period July – September, 2007. This variation from the general trend is attributable to the excessive negative publicity the party received through the newspaper’s letter columns and editorials for that reporting period. Stabroek News editors will need to pay keener attention to the principle of balance in their editorials and letter columns in order to prevent a repetition of the pattern of coverage observed during July-September. Apart from this aberration, the newspaper’s general coverage of the political parties was fair.
- 23 -

CHRONICLEPOSITIVE AND NEGATIVE COVERAGE
FOR THE PERIODS APRIL 1 - JUNE 30 and JULY 1 - SEPTEMBER 30
-500
-400
-300
-200
-100
0
100
200
300
400
500
POLITICAL PARTIES
CO
LUM
N IN
CH
ES
PN
P 211.85 340 143.3 378.6 62.15 119.75 14.3 4 0.6 0
N -13.5 -23.55 -97.75 -418.75 -8.5 -21.0 0 0 0 -1.0
PPP/C PPP/C PNCR-1G PNCR-1G AFC AFC GAP/ROAR GAP/ROAR TUF TUF
Apr 1 - June 30
Jul 1 - Sept 30
Apr 1 - June 30
Jul 1 - Sept 30
Apr 1 - June 30
Jul 1 - Sept 30
Apr 1 - June 30
Jul 1 - Sept 30
Apr 1 - June 30
Jul 1 - Sept 30
Guyana Chronicle(Graph) For the reporting period July – September, 2007 the PPP/C received approximately 14 times more positive than negative coverage from the Guyana Chronicle and 15 times more positive than negative coverage for the period April – June. Contrastingly, the PNCR-1G had mixed fortunes. The party received slightly more negative than positive coverage in the period July – September and a small amount more positive than negative coverage during April – June. The AFC received almost 6 times more positive than negative coverage during July – September, while the ratio was 7:1 for the period April – June. Both GAP/ROAR and TUF received comparatively minuscule amounts of positive coverage during both periods Analysis Taking into consideration the relative sizes of the parliamentary political parties, the Guyana Chronicle managed to achieve a fairly decent balance in the distribution of positive and negative coverage for the periods under review. However, there is one glaring exception to this trend and that is the coverage given to the PNCR-1G. The PNCR-1G’s positive coverage for April – June is almost balanced out by the negative coverage the party was given, while in the July – September period the negative coverage the party received is considerably more than the positive it accumulated. The Unit’s records show that there is a definite correlation between the large
- 24 -

amount of published letters to the editor that are critical of the PNCR-1G and the comparably high negative coverage that is reflected in the newspaper’s graph for the party. The Unit feels that the editor of the newspaper’s letter section should address this anomaly by giving more space to those letters which attempt to articulate and propagate opposing political views, thereby adding some measure of balance to the newspaper’s output.
- 25 -

KAIETEUR NEWSPOSITIVE AND NEGATIVE COVERAGE
FOR THE PERIODS APRIL 1 - JUNE 30 and JULY 1 - SEPTEMBER 30, 2007
-800
-600
-400
-200
0
200
400
600
800
1000
1200
POLITICAL PARTIES
CO
LUM
N IN
CH
ES
PN
P 105.2 221.75 453.7 1034.25 252.95 559.8 60.05 75.95 0.6 0.3
N -242.25 -382.55 -382.8 -554.07 -22 -24.7 -0.5 0 0 -1.5
PPP/C PPP/C PNCR-1G PNCR-1G AFC AFC GAP/ROAR GAP/ROAR TUF TUF
Apr 1 - June 30
Jul 1 - Sept 30
Apr 1 - June 30
Jul 1 - Sept 30
Apr 1 - June 30
Jul 1 - Sept 30
Apr 1 - June 30
Jul 1 - Sept 30
Apr 1 - June 30
Jul 1 - Sept 30
Kaieteur News (Graph) For both periods under review the Kaieteur News gave the PPP/C approximately 2 times more negative than positive coverage. In contrast the PNCR-1G was given almost twice the amount of positive coverage compared to the negative it received for the period July – September, 2007. For the period April – June, the party (PNCR-1G) received slightly more positive than negative coverage, but not in any great disproportion. The AFC received 21 times more positive than negative coverage for the period July – September and 11 times more positive than negative in the period April to June. GAP/ROAR received comparably reasonable amounts of positive coverage during both periods but was more positively covered during July – September than April – June. The TUF hardly received any positive or negative coverage for the two periods. Analysis A cursory look at Kaieteur News output shows that the PPP/C was the only political party that consistently received more negative than positive coverage over the past six (6) months. All the other parties were given fairly reasonable amounts of positive coverage in relation to the negative coverage they received. Our records revealed that there is an undisguised relationship between the disproportionate amount of negative coverage the PPP/C accumulated and the amount of space the newspaper allots to certain Columnists to express their views. Most of the articles written by these Columnists carry a distinct anti- government and anti- PPP/C bias, especially the daily ones written by Frederick Kissoon.
- 26 -

This situation can be rectified if management and/or the editors of the newspaper make an effort to solicit and publish the views of the ruling party on political, economic and social issues that are of interest to the general public. Such an approach if adopted will go a long way towards achieving balance; providing the public with a broader and diverse spectrum of views on issues; and eliminate the perception of the newspaper being overtly favorable to the opposition political parties. Comment The Unit advises a greater effort on the part of Kaieteur News editors to exercise stronger editorial sanctions over what is printed in that medium for public consumption. This is in the interest of the public good and for the maintenance of a peaceful and stable society. Two examples that give credence to this observation are as follows: In the Kaieteur News of Wednesday, 22 August 2007, Columnist, Frederick Kissoon wrote an article captioned “Changing the Guards: Political theory and the Guyana army” (page 10), in which he stated the following:
• “Many academics and political pundits since the sixties have agreed that the Indianised PPP cannot sustain itself in power because the state sectors are staffed with African Guyanese that have a natural affinity to the PNC….When the PPP came to power in 1992, it completely embraced the thesis and used it to marginalized African Guyanese in every corner of the public sector or any unit in which the state had a say….Africans have become marginalized; African Guyanese have been contemptuously sidelined in the state sector bureaucracy; the security forces have shown no interest in destabilizing the PPP regime even in the months when the PPP has displayed wanton, unapologetic and vicious anti-African racism of which the latest is Ingrid Griffith at the GRA”
The Unit is of the opinion that the above excerpt is tendentious, inflammatory, racially divisive and intended to stir the emotions of Afro-Guyanese in a way that can adversely impact the nation’s peace and stability. And, in a letter printed in the Kaieteur News of Wednesday, 19 September 2007, titled “Is Freddie able to see what’s going on?”(Page 5), the author, Sean Adams made the following unsubstantiated and provocative statement:
• “What Freddie needs to understand is that in the 1960’s African Guyanese destabilized Guyana”
The Unit feels that this statement is racially divisive and attempts to show a significant section of the country’s population in a negative light. Better editorial judgment could have been exercised by expunging these offensive remarks.
- 27 -

General Observations – Newspapers
A careful and objective analysis of the trends coming out of the three (3) newspapers over the past six months pellucidly revealed that the PNCR-1G got the most positive coverage compared to the other parliamentary parties while TUF received the least. However, it must be noted that even though the PPP/C is the ruling party in government, their positive ratings are affected to the extent that the Unit draws a line between what can be considered positive to the party as against what is positive to the government. A clear distinction between the media’s coverage of the government and the ruling party continues to be observed and adhered to for the purposes of monitoring and analysis, hence, a common feature that is observed amongst the newspapers except the Chronicle is the comparably small amounts of positive coverage given to the PPP/C party (taking into consideration it is the ruling party) compared to the PNCR-1G. One of the main factors that influenced the amounts of positive and negative coverage the political parties received was their levels of vocality on issues of the day and in this regard TUF and to a large extent GAP/ROAR failed abysmally to attract media attention due to there silence on most issues.
- 28 -

VOG NEWSPOSITIVE AND NEGATIVE COVERAGE
FOR THE PERIODS APRIL 1 - JUNE 30 and JULY 1 - SEPTEMBER 30
-10
-5
0
5
10
15
20
25
POLITICAL PARTIES
MIN
UTE
S
PN
P 3.5 2.2 19.87 5.1 5.3 5.7 0 0 0 0
N 0 0 -5.5 -3.8 -0.2 0 -0.2 0 0 0
PPP/C PPP/C PNCR-1G PNCR-1G AFC AFC GAP/ROAR GAP/ROAR TUF TUF
Apr 1 - June 30
Jul 1 - Sept 30
Apr 1 - June 30
Jul 1 - Sept 30
Apr 1 - June 30
Jul 1 - Sept 30
Apr 1 - June 30
Jul 1 - Sept 30
Apr 1 - June 30
Jul 1 - Sept 30
Voice Of Guyana News (Graph) For both periods under review the VOG News gave the PPP/C small amounts of positive as against zero negative coverage whilst the PNCR-1G and AFC received comparably larger amounts of positive than negative coverage for both periods. GAP/ROAR registered a barely measurable amount of negative coverage for April – June and TUF did not receive either positive or negative coverage for both periods. Analysis The Voice Of Guyana News graph can be considered fairly consistent throughout except for the disproportionately large amount of positive coverage given to the PNCR-1G during one period (April – June). However, the PNCR-1G is the only party that received significant negative coverage vis-a-vis the other parties. The performance of the newscast can be considered creditable, though there still exist the need to solicit and publicize the views of the two smaller parties (GAP/ROAR and TUF) in order to ensure that the desired level of equity amongst the parties is achieved and maintained.
- 29 -
Conclusion: The general findings in relation to local media performance over the past year show that there has definitely been a retrogressive slide in terms of the standards that were achieved during the major part of 2006 when members of the media community were fully aware that they were in the spotlight and under the microscope of the Unit (so to speak). Old habits that were put on a leash during that period have resurfaced to cancel out the gains in improved standards that were accomplished. Talk-show hosts are using the principle of freedom of expression to libel with impunity; reporters are blatantly expressing opinions as factual news; and the tenets of accuracy, fairness and balance in news reporting have taken a back seat in the headlong plunge to the current disappointing level of performance. The local media is also guilty of accommodating an invasive culture of low standards which is having a negative impact on the quality of their offerings to the Guyanese public. One of the more noticeable trends that has become pervasive in our media is the proclivity of some TV stations (and newspapers) to shamelessly favor certain political parties while being unfavorably biased against others. This is observable from the way they report news and disseminate information to the public. Only the PPP/C and PNC/R-1G command any meaningful attention or attracted significant coverage from the media, which is understandable taking into consideration that they are the two largest parliamentary and national political parties. However, the blatant practice of TV newscasts (in particular) to mainly publicize only one party’s views on current issues is an unprofessional conduct that makes the public’s perception of media bias a concrete reality that ought to be seriously addressed by the editors of those media outlets guilty of this practice. In spite of the foregoing, the Unit would like to compliment those media organizations which despite the many challenges-the perennial one being to achieve fairness, equity and balance- have not been cited over the past year for any major breaches of the media code such as racial incitement, inflammatory language and unsubstantiated allegations. The media trends objectively brought out in the findings of this report demonstrably justifies the need for all year- round monitoring and analyzing of the media’s performance and for operators to be made cognizant of and continually reminded of their shortcomings. Through this proactive approach the Unit aspires to raise standards and bring to fruition what was envisioned in 2006-with the formation of the Unit- that is, contributing to the development of a responsible, professional and democratic media in Guyana.
……………………………………………. Remington Eastman Manager Media Monitoring Unit (GECOM)
- 30 -