guidelines for preparation of business plans for
TRANSCRIPT
“OUR COMMUNITY PRACTICING MORE EFFICIENT USE OF MATERIALS IN THEIR
LIFESTYLES AND ACTIVITIES”
2012-2015 DDrraafftt BBuussiinneessss PPllaann
North East Victorian Regional Waste Management Group
“OUR COMMUNITY PRACTICING MORE EFFICIENT USE OF MATERIALS IN THEIR
LIFESTYLES AND ACTIVITIES”
Contents
Foreword .............................................................................................................................. 1
Introduction ............................................................................................................................ 3
Who We Are ....................................................................................................................... 3
Permanent Population and Households ............................................................................. 3
Alpine Resort Visitors ......................................................................................................... 4
Legislative Functions and Business Planning ..................................................................... 5
Functions ........................................................................................................................ 5
Towards Zero Waste Strategy ........................................................................................ 5
TZW Targets ................................................................................................................... 6
Performance To Date ............................................................................................................. 6
Waste Reduction and TZW Target 1 .................................................................................. 6
Recovery Rate and TZW Target 3 ...................................................................................... 8
Litter Reduction and TZW Target 4 .................................................................................... 9
Summary of Objectives ........................................................................................................ 10
Objectives and Strategies .................................................................................................... 11
Financials ............................................................................................................................ 21
Appendix A – Project Summary and Budgets ...................................................................... 24
Appendix B – Legislative Requirements ............................................................................. 247
Appendix C – Risk Management .......................................................................................... 28
1
Foreword From the Chairperson On behalf of my fellow Directors, it is my pleasure to present this North East Victorian Regional Waste Management Group (NevRwaste), 2012 - 2015 Business Plan. This 2012 - 2015 Business Plan provides the vision, strategic direction, agreed priorities and financial planning to achieve the three main objectives of the Victoria Government, "Towards Zero Waste Strategy" over the three year life of the Business Plan. These three main objectives are:
to generate less waste to increase the amount of materials recycled and reprocessed to reduce damage to our environment caused by waste
During the past year a number of exciting projects and initiatives have been completed in partnership with our seven member Councils and three member Alpine Resorts as part of our ongoing commitment to achieving less waste to landfill. With the provision of good governance from the Directors and the ongoing commitment of NevRwaste management and staff working in partnership with the local communities, this Business Plan will result in achieving “Our Communities Practising More Efficient Use of Materials in their Lifestyles and Activities”.
Cr Ron Webb Chairperson
2
From the Executive Officer This coming year will see NevRwaste well resourced to deliver projects with funding provided by Sustainability Victoria (SV) to assist delivery of Business Plan projects. This is in addition to the Core funding received from the Environment Protection Authority (EPA). Over the life of this plan, and with the support of SV, NevRwaste will undertake the key bodies of work to provide the region with an update to the North East Victorian Regional Waste Management Plan. Partnerships with North East Catchment Management Authority (NECMA) and North East Regional Water Authority (NERWA) will support continued delivery of the Schools Environment Education Directory (SEED) and away from home recycling will be enhanced throughout the region via project contributions from the Product Stewardship Forum (PSF) to establish a trial of the National Bin Network. The North East Region will continue to demonstrate leadership in regional Victoria with the introduction of new kerbside systems by NevRwaste Members, driven by the need to reduce waste to landfill and recover resources. Visitors, households and businesses will be asked to separate organic material from waste, which requires their partnership in changing behaviour to accommodate new systems. NevRwaste will also commence engaging in resource recovery programs specifically targeting the commercial and industrial sector presenting materials to NevRwaste Member facilities Achieving this Business Plan’s objectives relies on the ongoing strong partnership between NevRwaste and its Members and will be demonstrated through the continued integration of regional waste management planning and Member’s waste management strategies. Realising the overarching objectives of waste reduction, resource recovery and reduction in harm to the environment hinges on the effective engagement with our communities in the programs and activities planned.
David Cocks Executive Officer
3
Introduction Who We Are
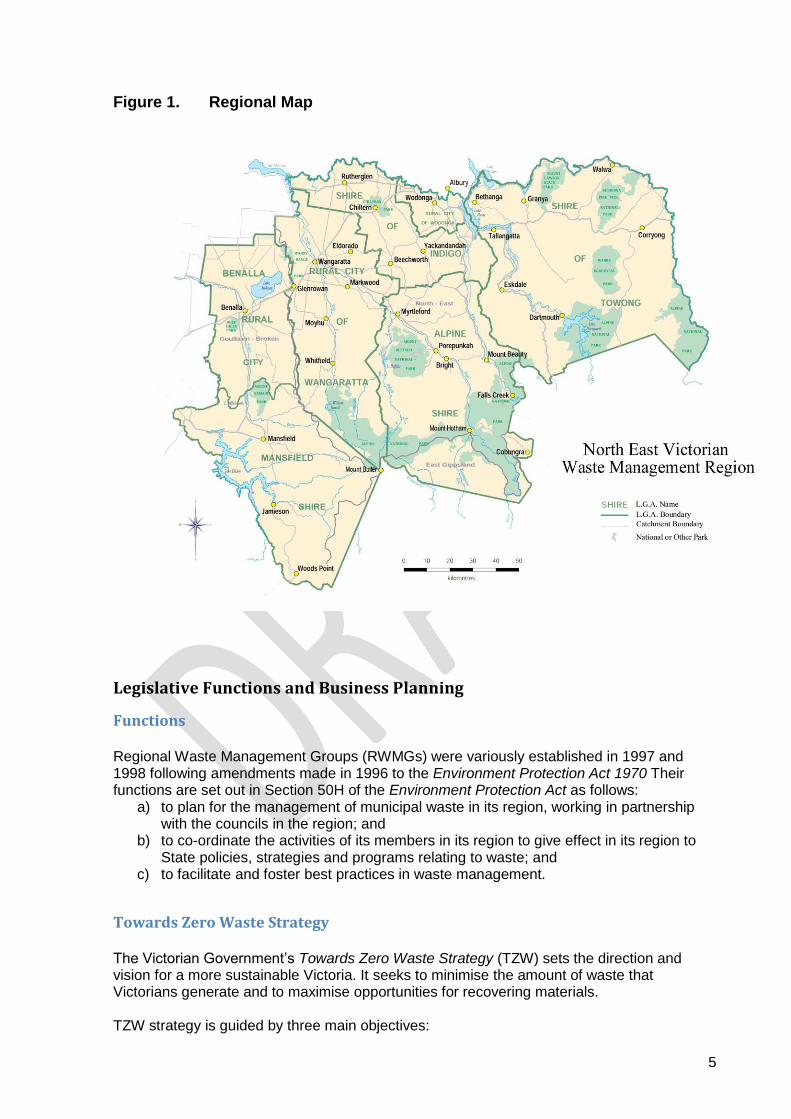
The North East region is bordered by significant topographical features. Its Northern boundary shares a State border with NSW along the Murray River. In the South-East the region extends to the peaks of the Great Dividing Range and includes the Alpine resorts of Falls Creek, Mt Buller-Mt Stirling and Mt Hotham. The range provides a significant topographical barrier to the region. The Hume Highway straddles the region’s North-West corner, passing through the major Regional Cities of Benalla, Wangaratta, and Wodonga and providing an efficient national transport corridor through and across the region. The Great Alpine Road, a significant national touring route, winds through the region’s alpine landscapes, heritage towns, and local food and wine areas through Wangaratta, Myrtleford, Bright, Harrietville and Mt Hotham, and beyond the region to Bairnsdale and the Gippsland Lakes. The South-West edge of the region meets Lake Eildon and extends as far south as Woods Point. A map of the region, seen in Figure 1, illustrates the extent of the region and many of the town centres. The map indicates the location of many of the town centres, the seven municipal boundaries, state and national parks, and major roadways within the region. The region has significant permanent and seasonal populations in terms of their contribution to the waste infrastructure and services. As shown in Table 1 the permanent regional population was estimated to be 123,8451 people in 2011, accounting for 2.2% of Victoria’s population, recorded at 5.62 million. A significant seasonal population resides in the region during the ski season (Alpine resorts), and, during peak holiday periods (accommodation and hospitality industry). The resultant transient population bring a range of attitudes and practices that will influence the success of systems provided by the resorts, hospitality and accommodation sectors.
Permanent Population and Households
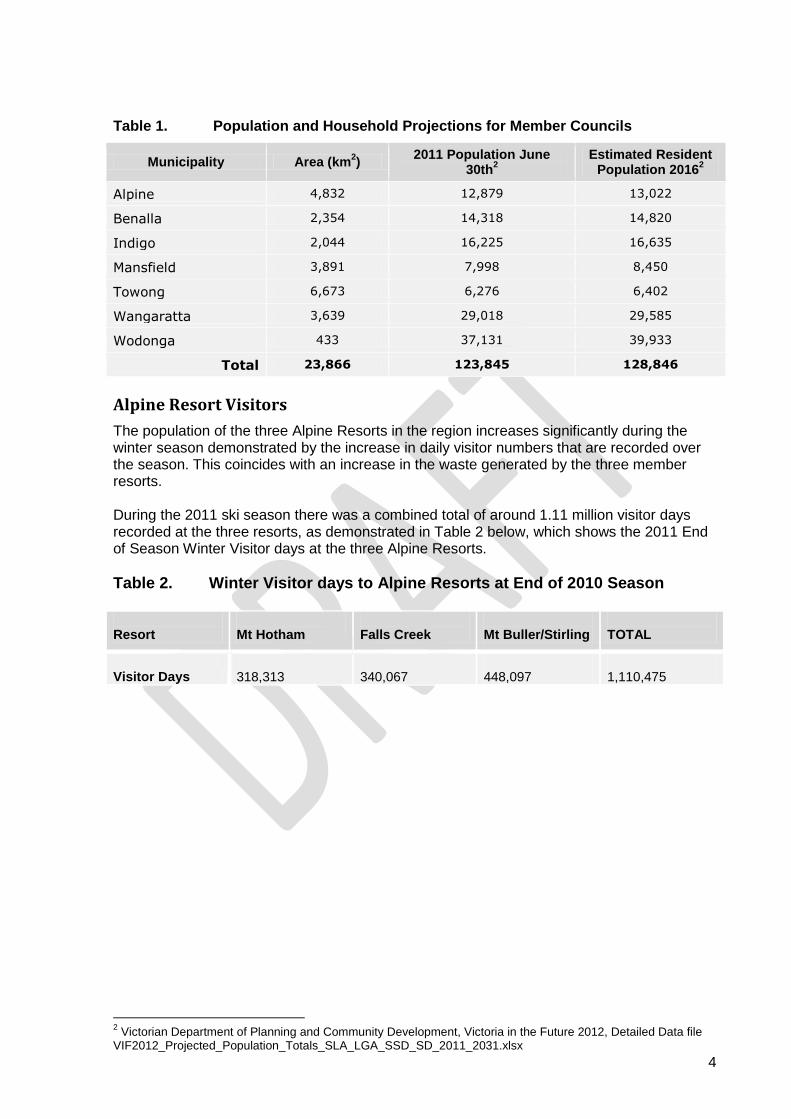
This document places regional population and household growth in terms of state and regional trends and projections. The Victorian Department of Planning and Community Development projections for Regional Victoria estimate a population growth of 6.7% in from 2011 to 2016. For the NevRwaste region the prediction is lower at 4% growth refer Table 1., the number of households (occupied private dwellings) is expected to grow from 49273, per 2011 Census, by 6.4% to a predicted 52751 with a reduction in the average resident household size from 2.44 to 2.39 persons.
1 Victorian Department of Planning and Community Development, Victoria in the Future 2012. Detailed Data File,
VIF2012_Projected_Pop_Hholds_Dwellings_SLA_LGA_SSD_SD_2011_2031.xlsx
4
Table 1. Population and Household Projections for Member Councils
Municipality Area (km2)
2011 Population June 30th
2
Estimated Resident Population 2016
2
Alpine 4,832 12,879 13,022
Benalla 2,354 14,318 14,820
Indigo 2,044 16,225 16,635
Mansfield 3,891 7,998 8,450
Towong 6,673 6,276 6,402
Wangaratta 3,639 29,018 29,585
Wodonga 433 37,131 39,933
Total 23,866 123,845 128,846
Alpine Resort Visitors
The population of the three Alpine Resorts in the region increases significantly during the winter season demonstrated by the increase in daily visitor numbers that are recorded over the season. This coincides with an increase in the waste generated by the three member resorts. During the 2011 ski season there was a combined total of around 1.11 million visitor days recorded at the three resorts, as demonstrated in Table 2 below, which shows the 2011 End of Season Winter Visitor days at the three Alpine Resorts.
Table 2. Winter Visitor days to Alpine Resorts at End of 2010 Season
Resort
Mt Hotham
Falls Creek
Mt Buller/Stirling
TOTAL
Visitor Days
318,313
340,067
448,097
1,110,475
2 Victorian Department of Planning and Community Development, Victoria in the Future 2012, Detailed Data file
VIF2012_Projected_Population_Totals_SLA_LGA_SSD_SD_2011_2031.xlsx
5
Figure 1. Regional Map
Legislative Functions and Business Planning
Functions Regional Waste Management Groups (RWMGs) were variously established in 1997 and 1998 following amendments made in 1996 to the Environment Protection Act 1970 Their functions are set out in Section 50H of the Environment Protection Act as follows:
a) to plan for the management of municipal waste in its region, working in partnership with the councils in the region; and
b) to co-ordinate the activities of its members in its region to give effect in its region to State policies, strategies and programs relating to waste; and
c) to facilitate and foster best practices in waste management.
Towards Zero Waste Strategy The Victorian Government’s Towards Zero Waste Strategy (TZW) sets the direction and vision for a more sustainable Victoria. It seeks to minimise the amount of waste that Victorians generate and to maximise opportunities for recovering materials. TZW strategy is guided by three main objectives:
6
to generate less waste
to increase the amount of materials recycled and reprocessed
to reduce damage to our environment caused by waste.
TZW Targets To achieve TZW’s objectives, a number of targets were set for waste management and resource recovery across Victoria. The targets relevant to RWMGs are as follows.
TZW Target 1: a 1.5 million tonne reduction in the projected quantity of solid waste in Victoria generated by 2014
TZW Target 3: Sectoral target for municipal waste – to recover (by weight), 45% by 2008-09; and 65% by 2014
TZW Target 4: a 25% improvement, from 2003 levels, in littering behaviour by 2014.
Performance To Date This section is intended to document the current regional situation and performance to date in relation to three Towards Zero Waste targets: waste reduction, resource recovery and litter.
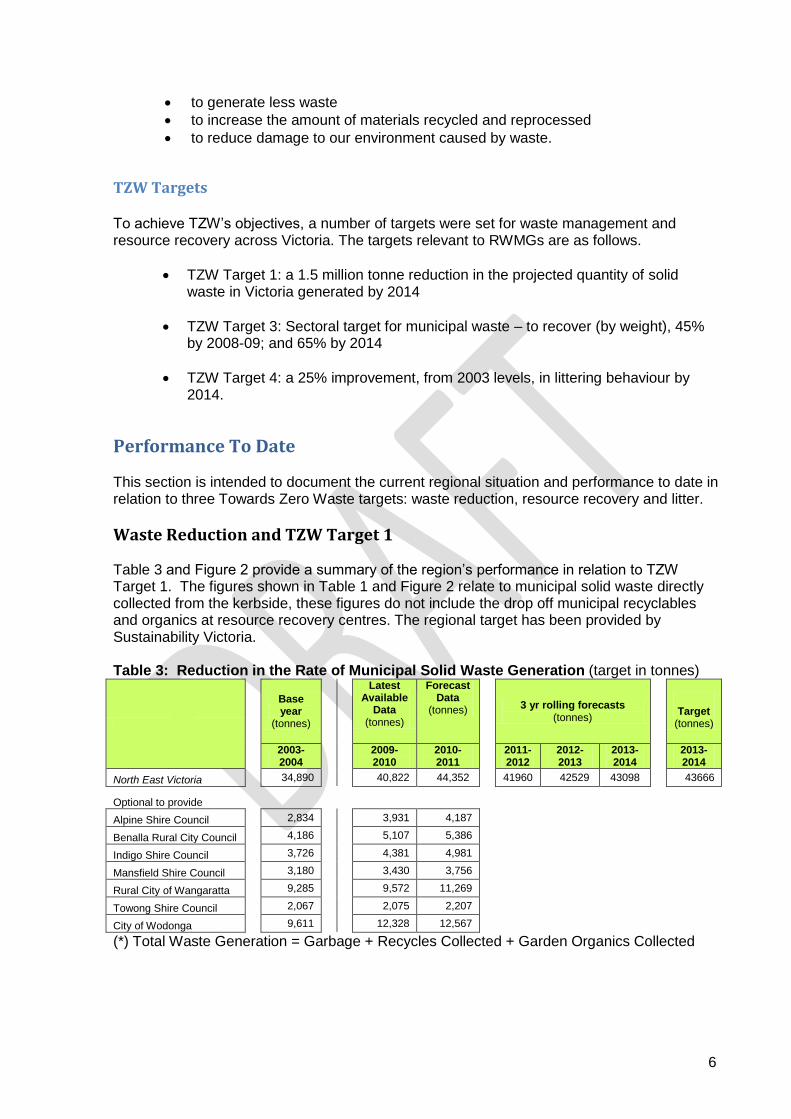
Waste Reduction and TZW Target 1 Table 3 and Figure 2 provide a summary of the region’s performance in relation to TZW Target 1. The figures shown in Table 1 and Figure 2 relate to municipal solid waste directly collected from the kerbside, these figures do not include the drop off municipal recyclables and organics at resource recovery centres. The regional target has been provided by Sustainability Victoria. Table 3: Reduction in the Rate of Municipal Solid Waste Generation (target in tonnes)
Base year
(tonnes)
Latest Available
Data (tonnes)
Forecast Data
(tonnes) 3 yr rolling forecasts
(tonnes)
Target
(tonnes)
2003-2004
2009-2010
2010-2011
2011-2012
2012-2013
2013-2014
2013-2014
North East Victoria 34,890 40,822 44,352 41960 42529 43098 43666
Optional to provide
Alpine Shire Council 2,834 3,931 4,187
Benalla Rural City Council 4,186 5,107 5,386
Indigo Shire Council 3,726 4,381 4,981
Mansfield Shire Council 3,180 3,430 3,756
Rural City of Wangaratta 9,285 9,572 11,269
Towong Shire Council 2,067 2,075 2,207
City of Wodonga 9,611 12,328 12,567
(*) Total Waste Generation = Garbage + Recycles Collected + Garden Organics Collected
7
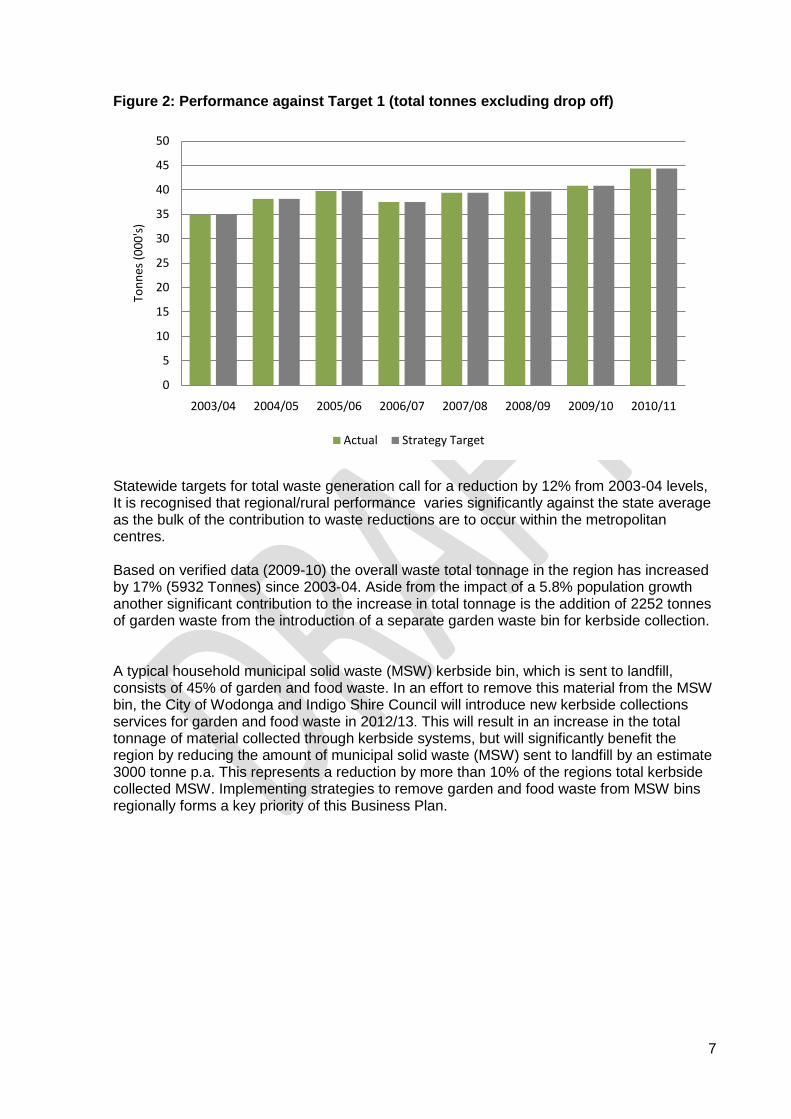
Figure 2: Performance against Target 1 (total tonnes excluding drop off)
Statewide targets for total waste generation call for a reduction by 12% from 2003-04 levels, It is recognised that regional/rural performance varies significantly against the state average as the bulk of the contribution to waste reductions are to occur within the metropolitan centres. Based on verified data (2009-10) the overall waste total tonnage in the region has increased by 17% (5932 Tonnes) since 2003-04. Aside from the impact of a 5.8% population growth another significant contribution to the increase in total tonnage is the addition of 2252 tonnes of garden waste from the introduction of a separate garden waste bin for kerbside collection. A typical household municipal solid waste (MSW) kerbside bin, which is sent to landfill, consists of 45% of garden and food waste. In an effort to remove this material from the MSW bin, the City of Wodonga and Indigo Shire Council will introduce new kerbside collections services for garden and food waste in 2012/13. This will result in an increase in the total tonnage of material collected through kerbside systems, but will significantly benefit the region by reducing the amount of municipal solid waste (MSW) sent to landfill by an estimate 3000 tonne p.a. This represents a reduction by more than 10% of the regions total kerbside collected MSW. Implementing strategies to remove garden and food waste from MSW bins regionally forms a key priority of this Business Plan.
0
5
10
15
20
25
30
35
40
45
50
2003/04 2004/05 2005/06 2006/07 2007/08 2008/09 2009/10 2010/11
Ton
nes
(0
00
's)
Actual Strategy Target
8
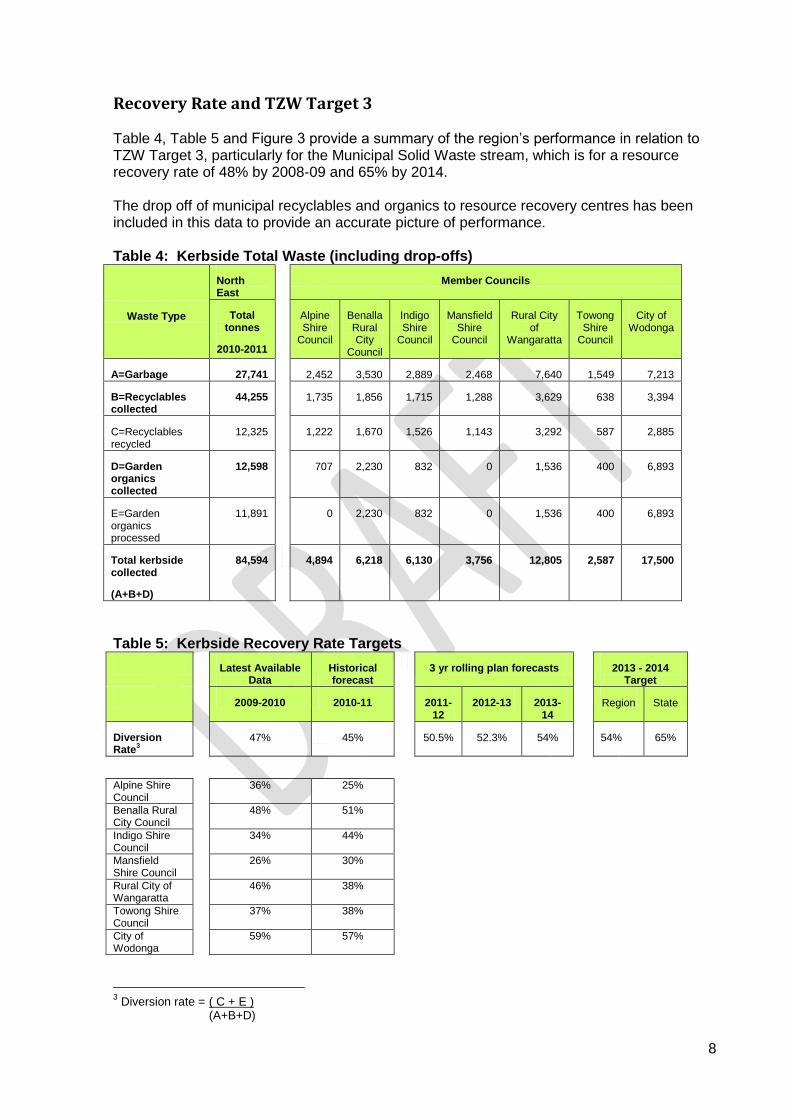
Recovery Rate and TZW Target 3 Table 4, Table 5 and Figure 3 provide a summary of the region’s performance in relation to TZW Target 3, particularly for the Municipal Solid Waste stream, which is for a resource recovery rate of 48% by 2008-09 and 65% by 2014. The drop off of municipal recyclables and organics to resource recovery centres has been included in this data to provide an accurate picture of performance. Table 4: Kerbside Total Waste (including drop-offs)
Waste Type
North East
Member Councils
Total tonnes
2010-2011
Alpine Shire
Council
Benalla Rural City
Council
Indigo Shire
Council
Mansfield Shire
Council
Rural City of
Wangaratta
Towong Shire
Council
City of Wodonga
A=Garbage 27,741 2,452 3,530 2,889 2,468 7,640 1,549 7,213
B=Recyclables collected
44,255 1,735 1,856 1,715 1,288 3,629 638 3,394
C=Recyclables recycled
12,325 1,222 1,670 1,526 1,143 3,292 587 2,885
D=Garden organics collected
12,598 707 2,230 832 0 1,536 400 6,893
E=Garden organics processed
11,891 0 2,230 832 0 1,536 400 6,893
Total kerbside collected
(A+B+D)
84,594 4,894 6,218 6,130 3,756 12,805 2,587 17,500
Table 5: Kerbside Recovery Rate Targets
Latest Available Data
Historical forecast
3 yr rolling plan forecasts 2013 - 2014 Target
2009-2010 2010-11 2011-12
2012-13 2013-14
Region State
Diversion Rate
3
47% 45% 50.5% 52.3% 54% 54% 65%
Alpine Shire Council
36% 25%
Benalla Rural City Council
48% 51%
Indigo Shire Council
34% 44%
Mansfield Shire Council
26% 30%
Rural City of Wangaratta
46% 38%
Towong Shire Council
37% 38%
City of Wodonga
59% 57%
3 Diversion rate = ( C + E )
(A+B+D)
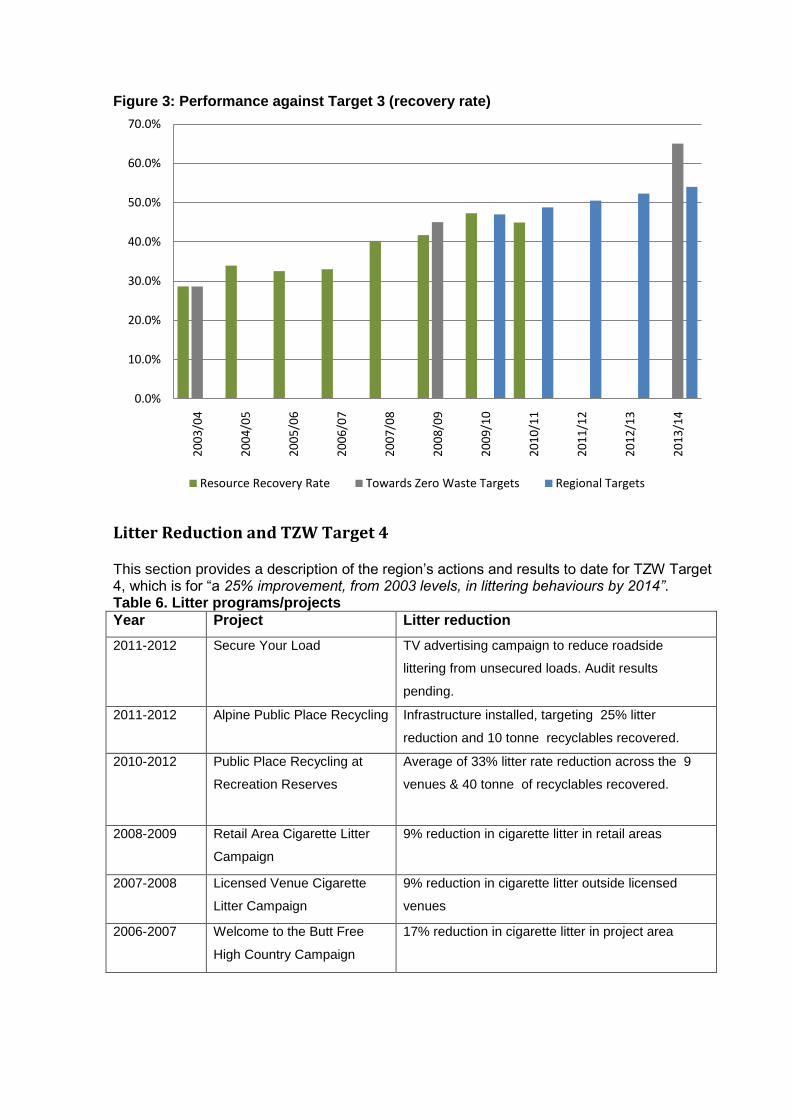
Figure 3: Performance against Target 3 (recovery rate)
Litter Reduction and TZW Target 4 This section provides a description of the region’s actions and results to date for TZW Target 4, which is for ―a 25% improvement, from 2003 levels, in littering behaviours by 2014”. Table 6. Litter programs/projects
Year Project Litter reduction
2011-2012 Secure Your Load TV advertising campaign to reduce roadside
littering from unsecured loads. Audit results
pending.
2011-2012 Alpine Public Place Recycling Infrastructure installed, targeting 25% litter
reduction and 10 tonne recyclables recovered.
2010-2012 Public Place Recycling at
Recreation Reserves
Average of 33% litter rate reduction across the 9
venues & 40 tonne of recyclables recovered.
2008-2009 Retail Area Cigarette Litter
Campaign
9% reduction in cigarette litter in retail areas
2007-2008 Licensed Venue Cigarette
Litter Campaign
9% reduction in cigarette litter outside licensed
venues
2006-2007 Welcome to the Butt Free
High Country Campaign
17% reduction in cigarette litter in project area
0.0%
10.0%
20.0%
30.0%
40.0%
50.0%
60.0%
70.0%
20
03
/04
20
04
/05
20
05
/06
20
06
/07
20
07
/08
20
08
/09
20
09
/10
20
10
/11
20
11
/12
20
12
/13
20
13
/14
Resource Recovery Rate Towards Zero Waste Targets Regional Targets
10
Summary of Objectives
Priority Area - Organics Diversion
1. Increase the diversion of food and garden organics from the municipal waste
stream.
2. Increase the diversion of food and garden organics from Small to Medium
Enterprises (SME) and other Commercial and Industrial (C&I) sources.
Priority Area - Resource Recovery
3. Increase the tonnages and variety of materials recovered in the region. 4. C&I resource recovery activities of Members co-ordinated and planned for within
the region.
Priority Area - Security Residual Waste
5. High quality waste management planning within the region.
6. Rehabilitation of priority old landfill sites.
Priority Area - Community Engagement & Education
7. Reduce Household waste generation. 8. Households properly using kerbside and drop off systems to maximise
resource recovery. 9. Improved Away From Home (AFH) recycling and reduced litter.
Priority Area - Governance & Compliance
10. High quality governance & compliance with statutory requirements.
11
Objectives and Strategies
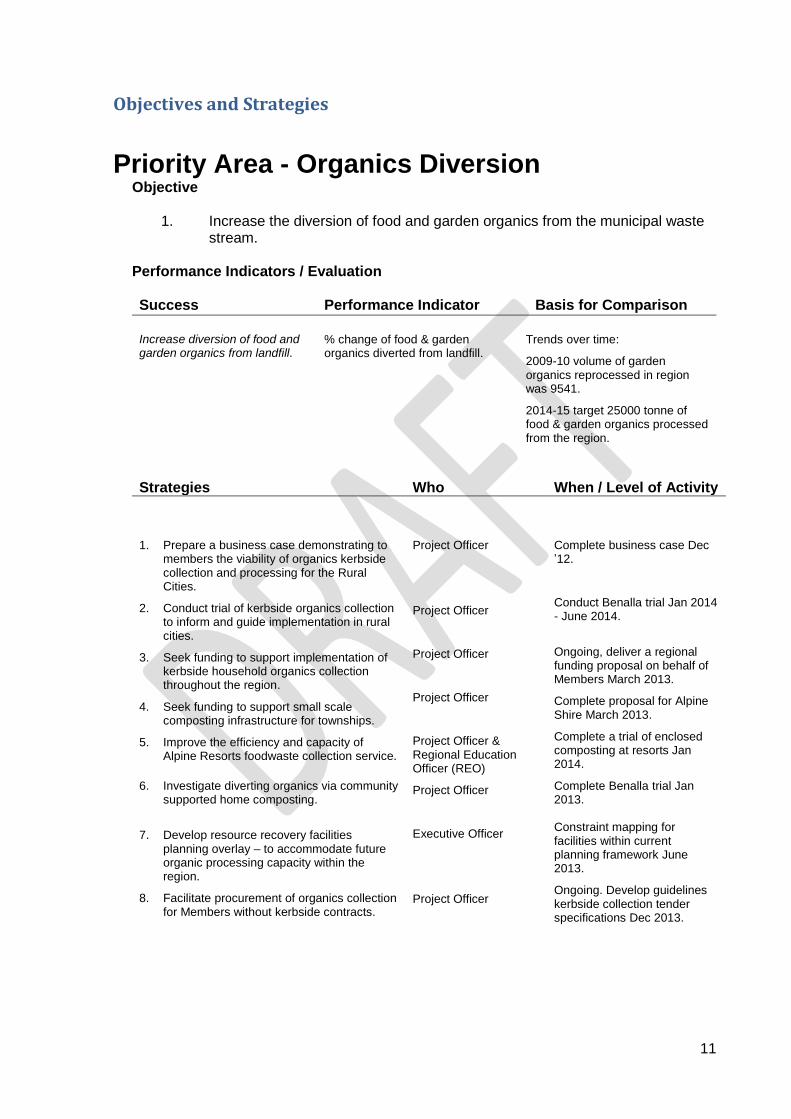
Priority Area - Organics Diversion Objective
1. Increase the diversion of food and garden organics from the municipal waste
stream.
Performance Indicators / Evaluation
Success Performance Indicator Basis for Comparison
Increase diversion of food and garden organics from landfill.
% change of food & garden organics diverted from landfill.
Trends over time:
2009-10 volume of garden organics reprocessed in region was 9541.
2014-15 target 25000 tonne of food & garden organics processed from the region.
Strategies Who When / Level of Activity
1. Prepare a business case demonstrating to members the viability of organics kerbside collection and processing for the Rural Cities.
2. Conduct trial of kerbside organics collection to inform and guide implementation in rural cities.
3. Seek funding to support implementation of kerbside household organics collection throughout the region.
4. Seek funding to support small scale composting infrastructure for townships.
5. Improve the efficiency and capacity of Alpine Resorts foodwaste collection service.
6. Investigate diverting organics via community supported home composting.
7. Develop resource recovery facilities planning overlay – to accommodate future organic processing capacity within the region.
8. Facilitate procurement of organics collection for Members without kerbside contracts.
Project Officer
Project Officer
Project Officer
Project Officer
Project Officer & Regional Education Officer (REO)
Project Officer
Executive Officer
Project Officer
Complete business case Dec ’12.
Conduct Benalla trial Jan 2014 - June 2014.
Ongoing, deliver a regional funding proposal on behalf of Members March 2013.
Complete proposal for Alpine Shire March 2013.
Complete a trial of enclosed composting at resorts Jan 2014.
Complete Benalla trial Jan 2013. Constraint mapping for facilities within current planning framework June 2013.
Ongoing. Develop guidelines kerbside collection tender specifications Dec 2013.
12
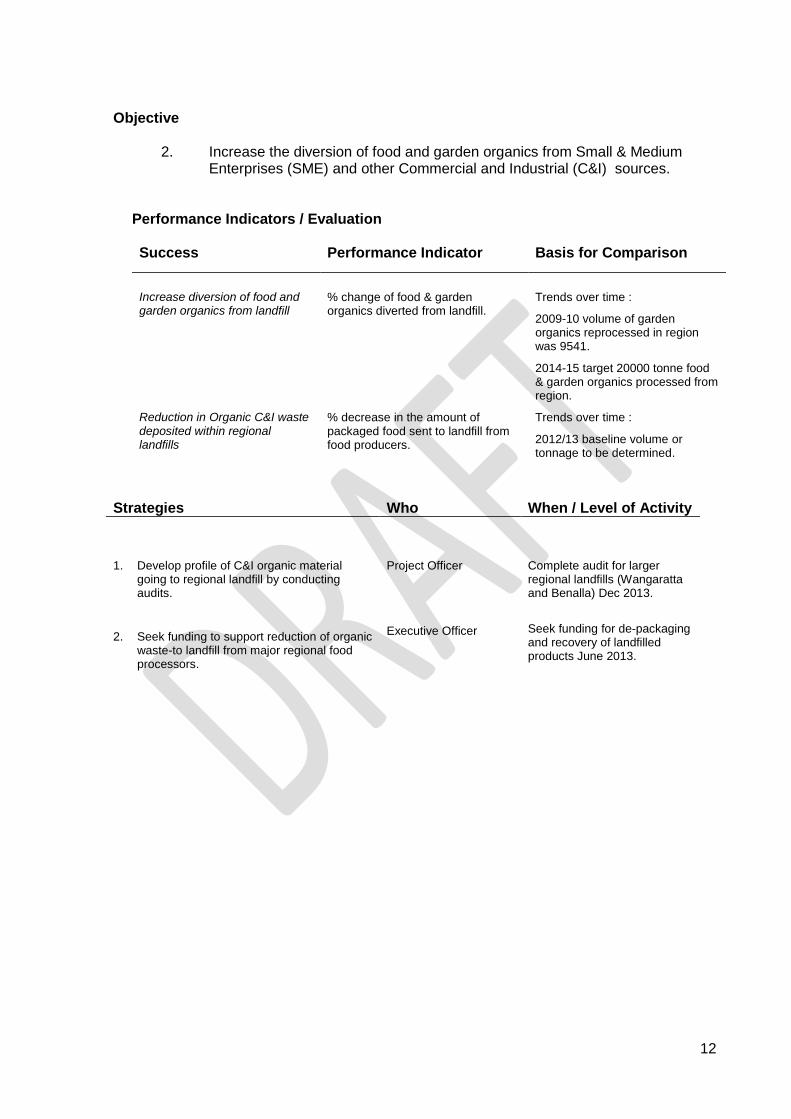
Objective
2. Increase the diversion of food and garden organics from Small & Medium Enterprises (SME) and other Commercial and Industrial (C&I) sources.
Performance Indicators / Evaluation
Success Performance Indicator Basis for Comparison
Increase diversion of food and garden organics from landfill
% change of food & garden organics diverted from landfill.
Trends over time :
2009-10 volume of garden organics reprocessed in region was 9541.
2014-15 target 20000 tonne food & garden organics processed from region.
Reduction in Organic C&I waste deposited within regional landfills
% decrease in the amount of packaged food sent to landfill from food producers.
Trends over time :
2012/13 baseline volume or tonnage to be determined.
Strategies Who When / Level of Activity
1. Develop profile of C&I organic material going to regional landfill by conducting audits.
2. Seek funding to support reduction of organic waste-to landfill from major regional food processors.
Project Officer
Executive Officer
Complete audit for larger regional landfills (Wangaratta and Benalla) Dec 2013.
Seek funding for de-packaging and recovery of landfilled products June 2013.
13
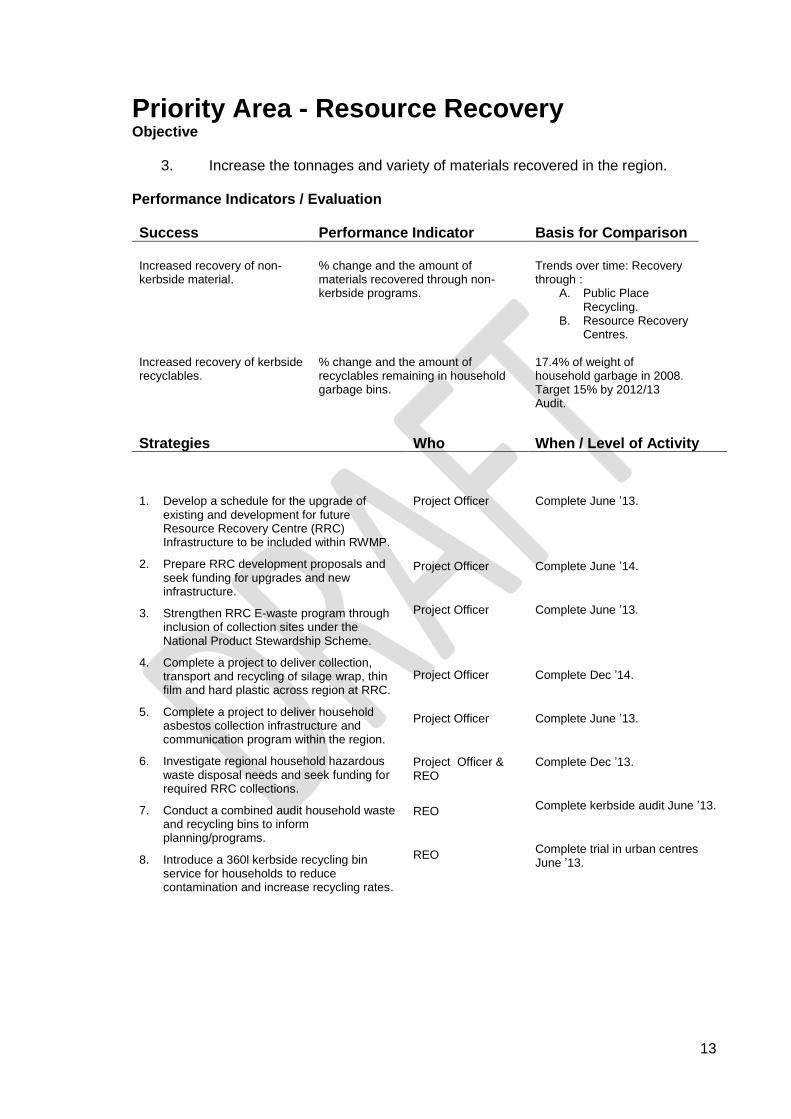
Priority Area - Resource Recovery Objective
3. Increase the tonnages and variety of materials recovered in the region.
Performance Indicators / Evaluation
Success Performance Indicator Basis for Comparison
Increased recovery of non-kerbside material.
% change and the amount of materials recovered through non-kerbside programs.
Trends over time: Recovery through :
A. Public Place Recycling.
B. Resource Recovery Centres.
Increased recovery of kerbside recyclables.
% change and the amount of recyclables remaining in household garbage bins.
17.4% of weight of household garbage in 2008. Target 15% by 2012/13 Audit.
Strategies Who When / Level of Activity
1. Develop a schedule for the upgrade of existing and development for future Resource Recovery Centre (RRC) Infrastructure to be included within RWMP.
2. Prepare RRC development proposals and seek funding for upgrades and new infrastructure.
3. Strengthen RRC E-waste program through inclusion of collection sites under the National Product Stewardship Scheme.
4. Complete a project to deliver collection, transport and recycling of silage wrap, thin film and hard plastic across region at RRC.
5. Complete a project to deliver household asbestos collection infrastructure and communication program within the region.
6. Investigate regional household hazardous waste disposal needs and seek funding for required RRC collections.
7. Conduct a combined audit household waste and recycling bins to inform planning/programs.
8. Introduce a 360l kerbside recycling bin service for households to reduce contamination and increase recycling rates.
Project Officer
Project Officer
Project Officer
Project Officer
Project Officer
Project Officer & REO
REO
REO
Complete June ’13.
Complete June ’14.
Complete June ’13.
Complete Dec ’14.
Complete June ’13.
Complete Dec ’13.
Complete kerbside audit June ’13.
Complete trial in urban centres June ’13.
14
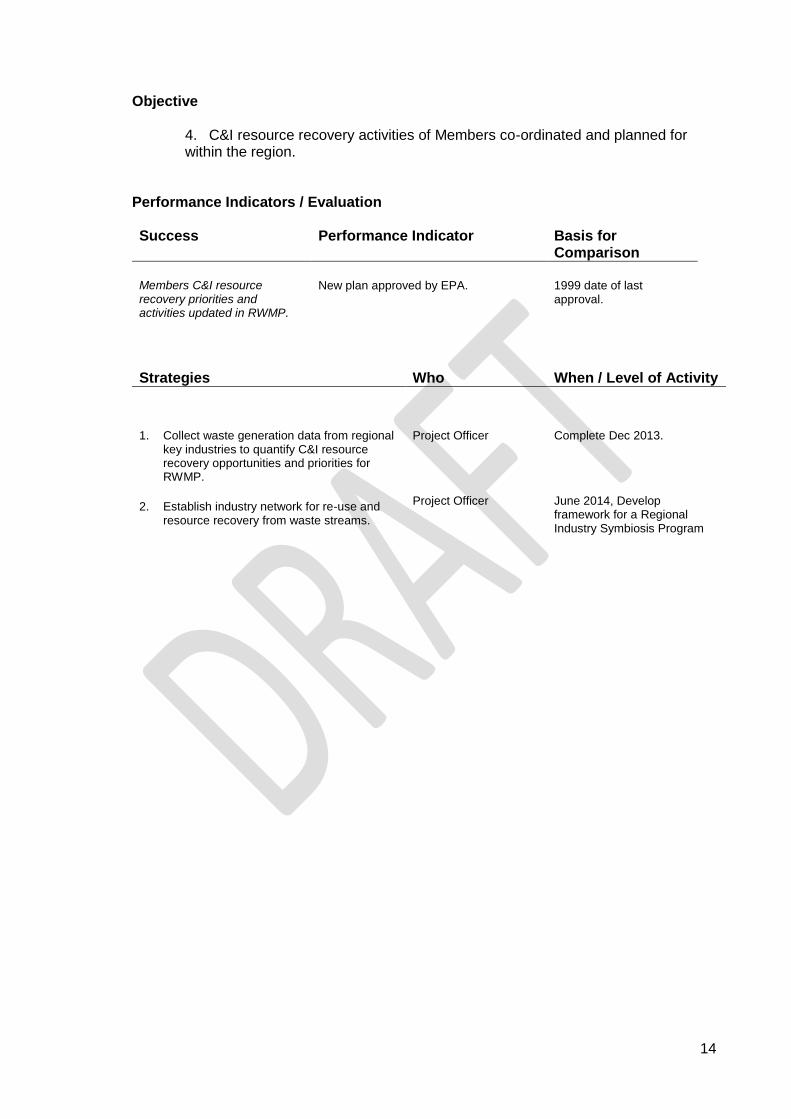
Objective
4. C&I resource recovery activities of Members co-ordinated and planned for within the region.
Performance Indicators / Evaluation
Success Performance Indicator Basis for Comparison
Members C&I resource recovery priorities and activities updated in RWMP.
New plan approved by EPA. 1999 date of last approval.
Strategies Who When / Level of Activity
1. Collect waste generation data from regional key industries to quantify C&I resource recovery opportunities and priorities for RWMP.
2. Establish industry network for re-use and resource recovery from waste streams.
Project Officer
Project Officer
Complete Dec 2013.
June 2014, Develop framework for a Regional Industry Symbiosis Program
15
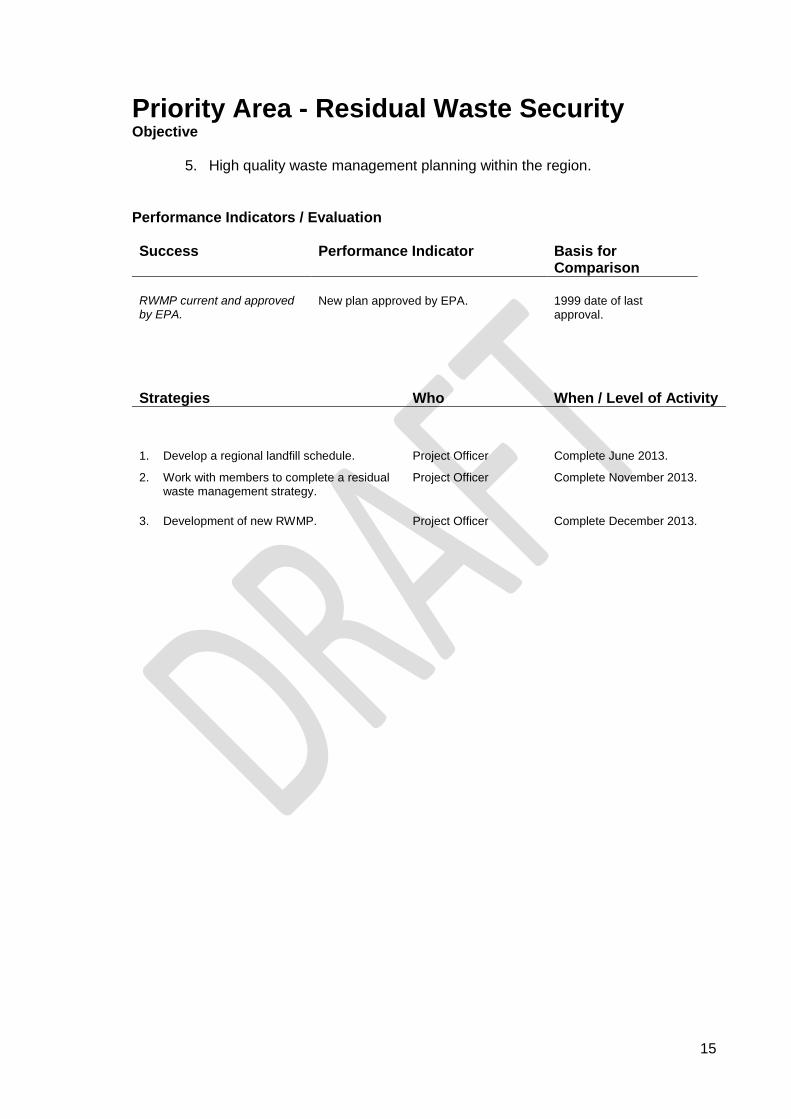
Priority Area - Residual Waste Security Objective
5. High quality waste management planning within the region.
Performance Indicators / Evaluation
Success Performance Indicator Basis for Comparison
RWMP current and approved by EPA.
New plan approved by EPA.
1999 date of last approval.
Strategies Who When / Level of Activity
1. Develop a regional landfill schedule.
2. Work with members to complete a residual waste management strategy.
3. Development of new RWMP.
Project Officer
Project Officer
Project Officer
Complete June 2013.
Complete November 2013.
Complete December 2013.
16
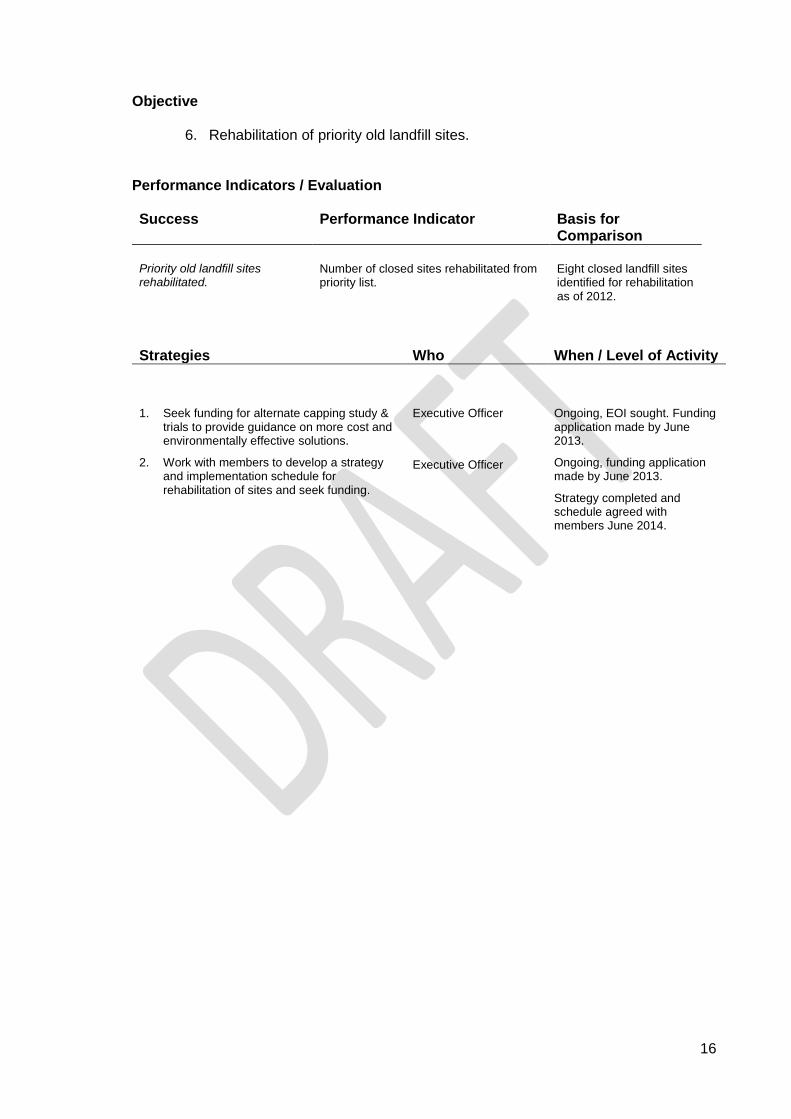
Objective
6. Rehabilitation of priority old landfill sites.
Performance Indicators / Evaluation
Success Performance Indicator Basis for
Comparison
Priority old landfill sites rehabilitated.
Number of closed sites rehabilitated from priority list.
Eight closed landfill sites identified for rehabilitation as of 2012.
Strategies Who When / Level of Activity
1. Seek funding for alternate capping study & trials to provide guidance on more cost and environmentally effective solutions.
2. Work with members to develop a strategy and implementation schedule for rehabilitation of sites and seek funding.
Executive Officer
Executive Officer
Ongoing, EOI sought. Funding application made by June 2013.
Ongoing, funding application made by June 2013.
Strategy completed and schedule agreed with members June 2014.
17
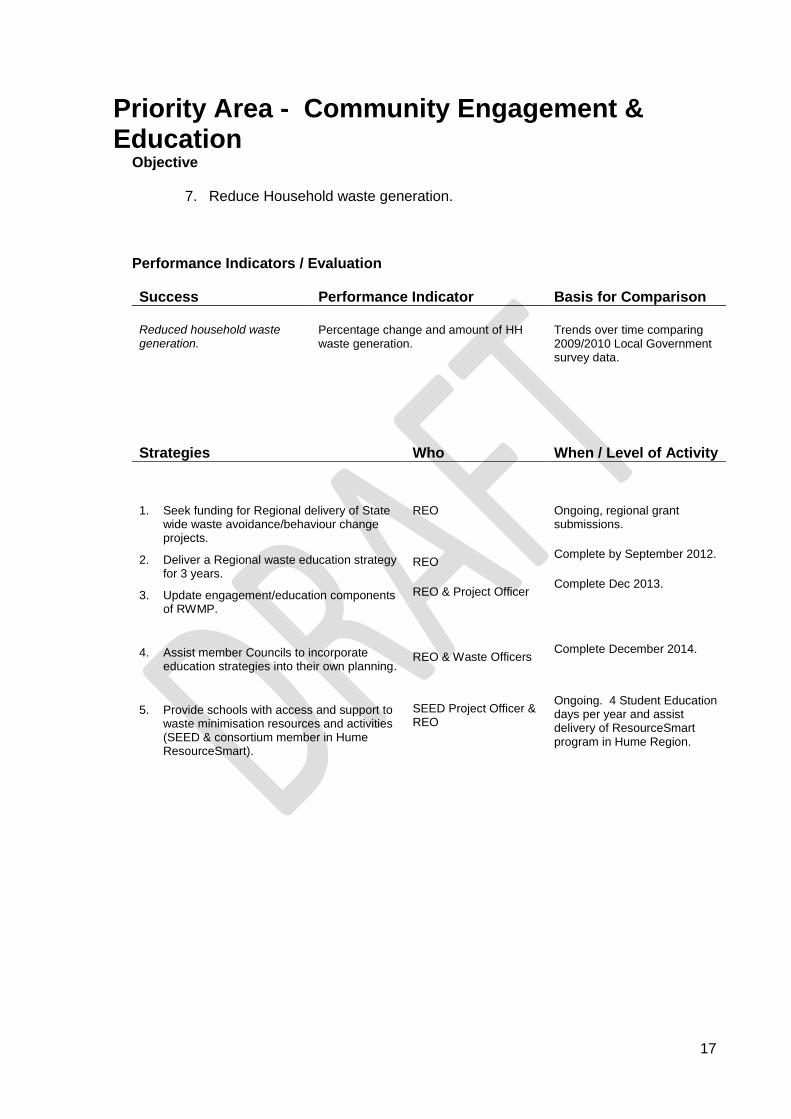
Priority Area - Community Engagement & Education
Objective
7. Reduce Household waste generation.
Performance Indicators / Evaluation
Success Performance Indicator Basis for Comparison
Reduced household waste generation.
Percentage change and amount of HH waste generation.
Trends over time comparing 2009/2010 Local Government survey data.
Strategies Who When / Level of Activity
1. Seek funding for Regional delivery of State wide waste avoidance/behaviour change projects.
2. Deliver a Regional waste education strategy for 3 years.
3. Update engagement/education components of RWMP.
4. Assist member Councils to incorporate education strategies into their own planning.
5. Provide schools with access and support to waste minimisation resources and activities (SEED & consortium member in Hume ResourceSmart).
REO
REO
REO & Project Officer
REO & Waste Officers
SEED Project Officer & REO
Ongoing, regional grant submissions.
Complete by September 2012.
Complete Dec 2013.
Complete December 2014.
Ongoing. 4 Student Education days per year and assist delivery of ResourceSmart program in Hume Region.
18
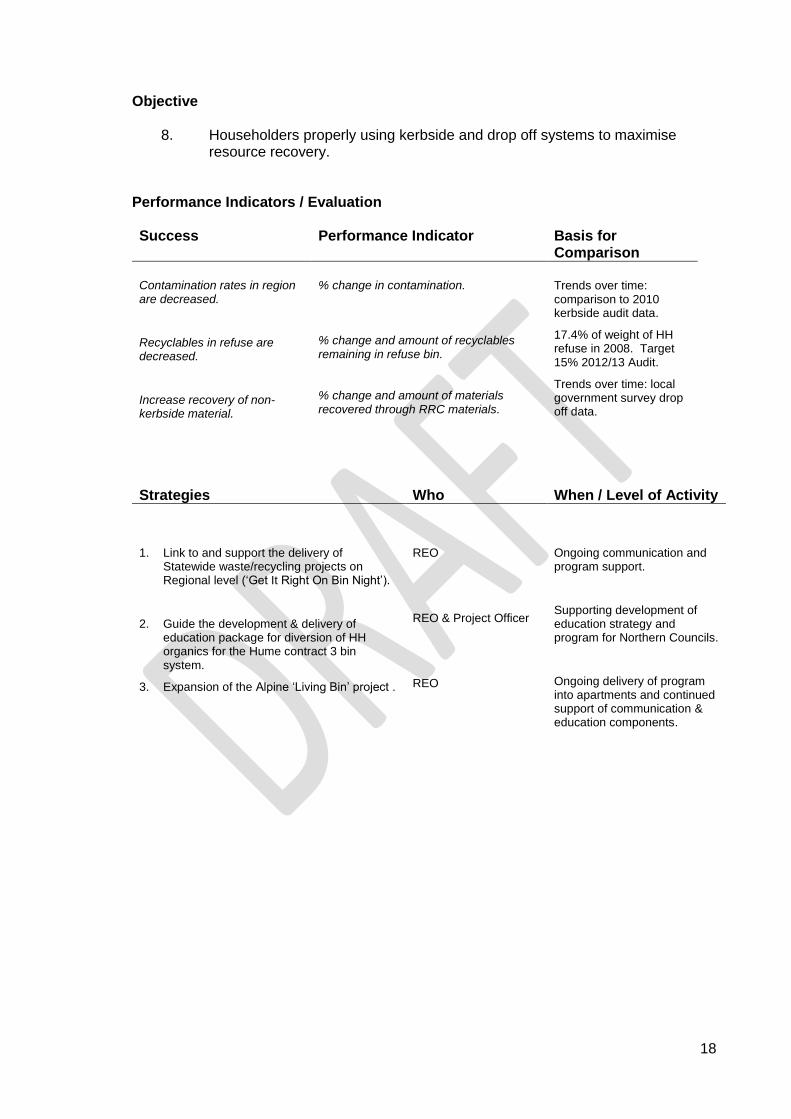
Objective
8. Householders properly using kerbside and drop off systems to maximise resource recovery.
Performance Indicators / Evaluation
Success Performance Indicator Basis for Comparison
Contamination rates in region are decreased.
Recyclables in refuse are decreased.
Increase recovery of non-kerbside material.
% change in contamination. % change and amount of recyclables remaining in refuse bin. % change and amount of materials recovered through RRC materials.
Trends over time: comparison to 2010 kerbside audit data.
17.4% of weight of HH refuse in 2008. Target 15% 2012/13 Audit.
Trends over time: local government survey drop off data.
Strategies Who When / Level of Activity
1. Link to and support the delivery of Statewide waste/recycling projects on Regional level (‘Get It Right On Bin Night’).
2. Guide the development & delivery of education package for diversion of HH organics for the Hume contract 3 bin system.
3. Expansion of the Alpine ‘Living Bin’ project .
REO
REO & Project Officer
REO
Ongoing communication and program support.
Supporting development of education strategy and program for Northern Councils.
Ongoing delivery of program into apartments and continued support of communication & education components.
19
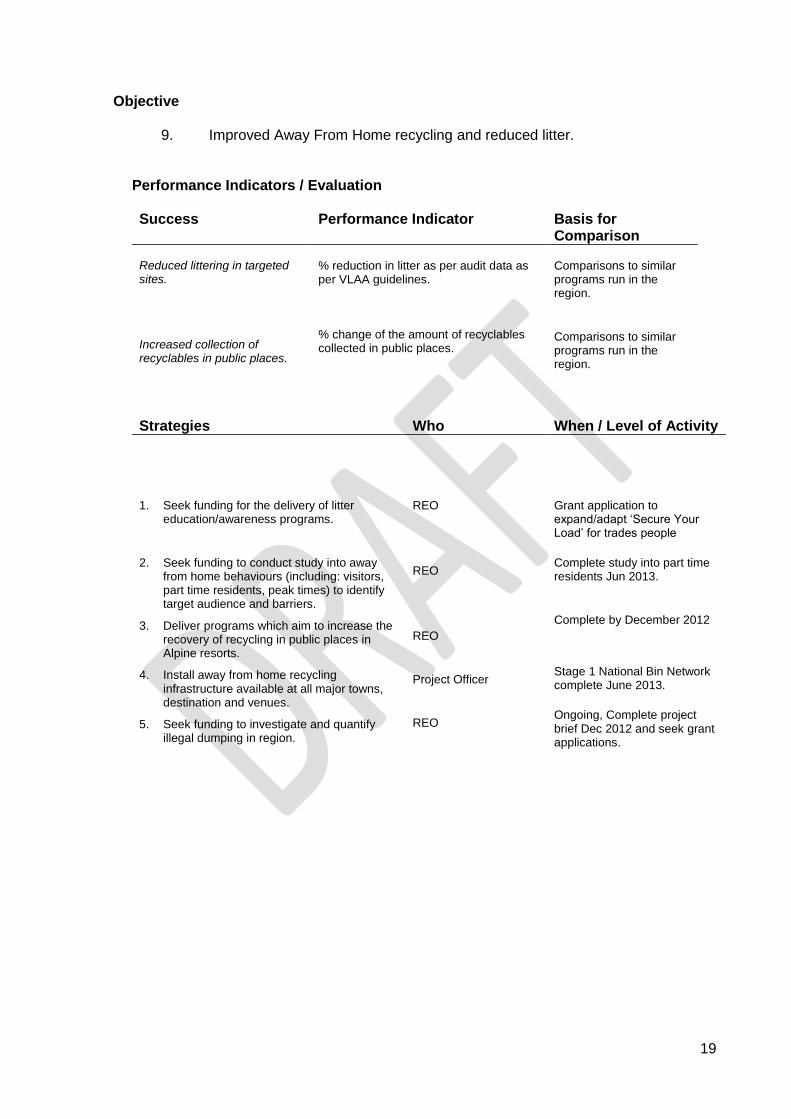
Objective
9. Improved Away From Home recycling and reduced litter.
Performance Indicators / Evaluation
Success Performance Indicator Basis for
Comparison Reduced littering in targeted sites.
Increased collection of recyclables in public places.
% reduction in litter as per audit data as per VLAA guidelines. % change of the amount of recyclables collected in public places.
Comparisons to similar programs run in the region.
Comparisons to similar programs run in the region.
Strategies Who When / Level of Activity
1. Seek funding for the delivery of litter education/awareness programs.
2. Seek funding to conduct study into away from home behaviours (including: visitors, part time residents, peak times) to identify target audience and barriers.
3. Deliver programs which aim to increase the recovery of recycling in public places in Alpine resorts.
4. Install away from home recycling infrastructure available at all major towns, destination and venues.
5. Seek funding to investigate and quantify illegal dumping in region.
REO
REO
REO
Project Officer
REO
Grant application to expand/adapt ‘Secure Your Load’ for trades people
Complete study into part time residents Jun 2013.
Complete by December 2012
Stage 1 National Bin Network complete June 2013.
Ongoing, Complete project brief Dec 2012 and seek grant applications.
20
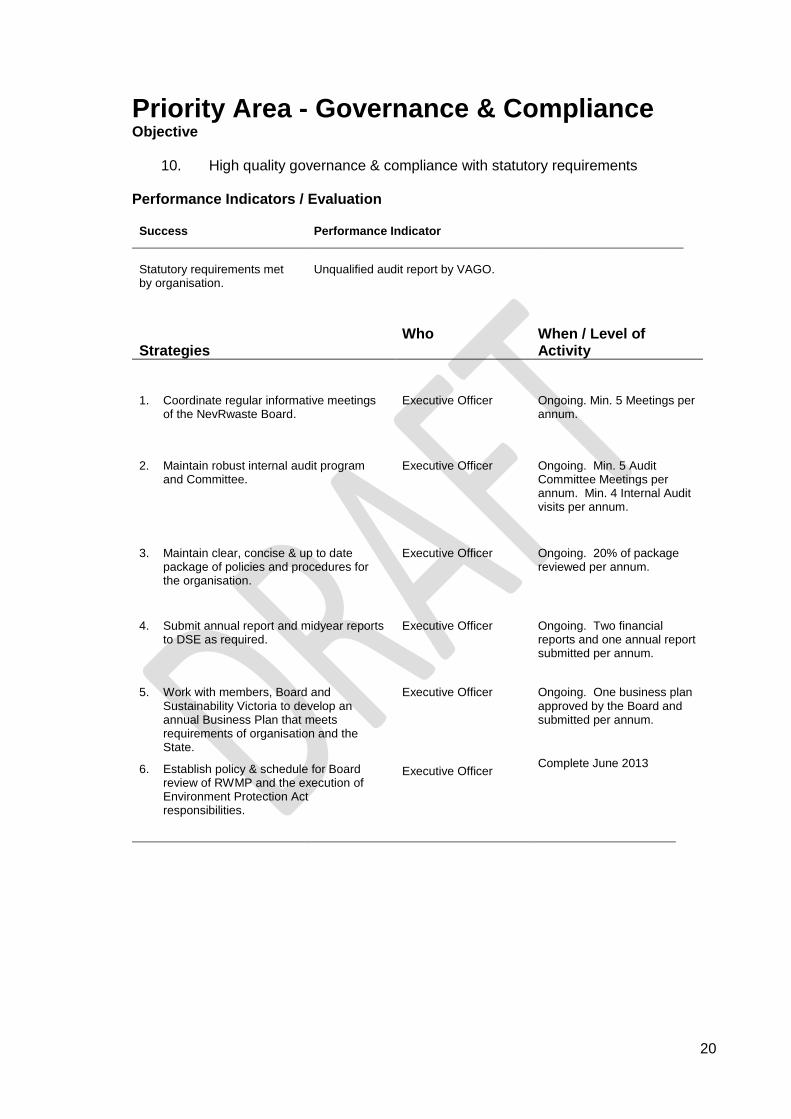
Priority Area - Governance & Compliance
Objective
10. High quality governance & compliance with statutory requirements
Performance Indicators / Evaluation
Success Performance Indicator
Statutory requirements met by organisation.
Unqualified audit report by VAGO.
Strategies
Who When / Level of Activity
1. Coordinate regular informative meetings
of the NevRwaste Board. Executive Officer
Ongoing. Min. 5 Meetings per annum.
2. Maintain robust internal audit program and Committee.
Executive Officer Ongoing. Min. 5 Audit Committee Meetings per annum. Min. 4 Internal Audit visits per annum.
3. Maintain clear, concise & up to date package of policies and procedures for the organisation.
Executive Officer Ongoing. 20% of package reviewed per annum.
4. Submit annual report and midyear reports to DSE as required.
Executive Officer Ongoing. Two financial reports and one annual report submitted per annum.
5. Work with members, Board and Sustainability Victoria to develop an annual Business Plan that meets requirements of organisation and the State.
6. Establish policy & schedule for Board review of RWMP and the execution of Environment Protection Act responsibilities.
Executive Officer
Executive Officer
Ongoing. One business plan approved by the Board and submitted per annum.
Complete June 2013
21
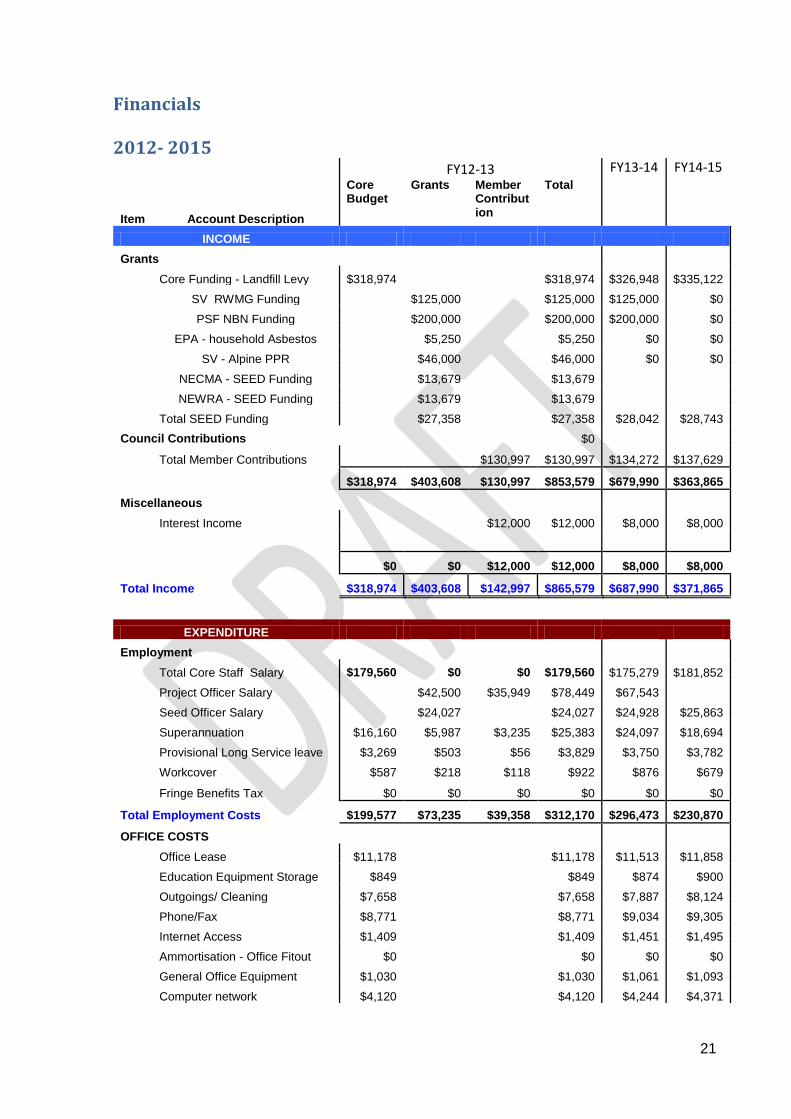
Financials 2012- 2015
Item Account Description
FY12-13 FY13-14 FY14-15 Core Budget
Grants Member Contribution
Total
INCOME
Grants
Core Funding - Landfill Levy $318,974
$318,974 $326,948 $335,122
SV RWMG Funding
$125,000
$125,000 $125,000 $0
PSF NBN Funding
$200,000
$200,000 $200,000 $0
EPA - household Asbestos
$5,250
$5,250 $0 $0
SV - Alpine PPR
$46,000
$46,000 $0 $0
NECMA - SEED Funding
$13,679
$13,679
NEWRA - SEED Funding
$13,679
$13,679
Total SEED Funding
$27,358
$27,358 $28,042 $28,743
Council Contributions
$0
Total Member Contributions $130,997 $130,997 $134,272 $137,629
$318,974 $403,608 $130,997 $853,579 $679,990 $363,865
Miscellaneous
Interest Income
$12,000 $12,000 $8,000 $8,000
$0 $0 $12,000 $12,000 $8,000 $8,000
Total Income $318,974 $403,608 $142,997 $865,579 $687,990 $371,865
EXPENDITURE
Employment
Total Core Staff Salary $179,560 $0 $0 $179,560 $175,279 $181,852
Project Officer Salary
$42,500 $35,949 $78,449 $67,543
Seed Officer Salary
$24,027
$24,027 $24,928 $25,863
Superannuation $16,160 $5,987 $3,235 $25,383 $24,097 $18,694
Provisional Long Service leave $3,269 $503 $56 $3,829 $3,750 $3,782
Workcover $587 $218 $118 $922 $876 $679
Fringe Benefits Tax $0 $0 $0 $0 $0 $0
Total Employment Costs $199,577 $73,235 $39,358 $312,170 $296,473 $230,870
OFFICE COSTS
Office Lease $11,178
$11,178 $11,513 $11,858
Education Equipment Storage $849
$849 $874 $900
Outgoings/ Cleaning $7,658
$7,658 $7,887 $8,124
Phone/Fax $8,771
$8,771 $9,034 $9,305
Internet Access $1,409
$1,409 $1,451 $1,495
Ammortisation - Office Fitout $0
$0 $0 $0
General Office Equipment $1,030
$1,030 $1,061 $1,093
Computer network $4,120
$4,120 $4,244 $4,371
22
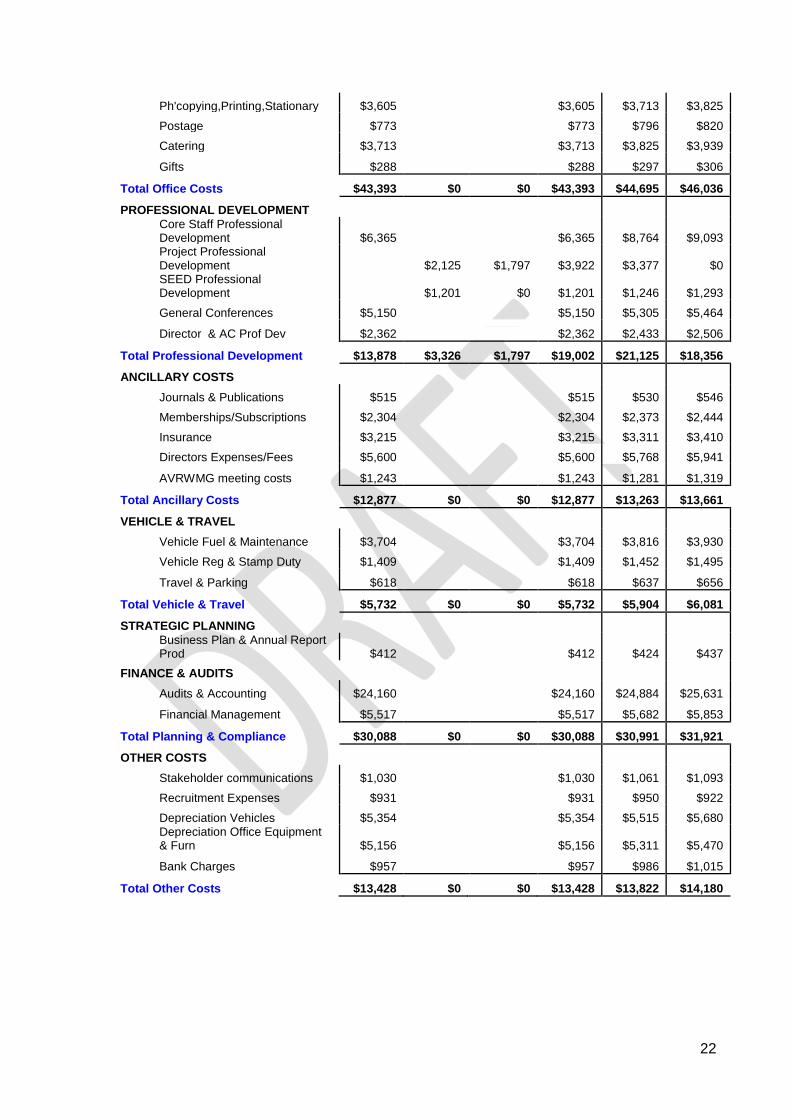
Ph'copying,Printing,Stationary $3,605
$3,605 $3,713 $3,825
Postage $773
$773 $796 $820
Catering $3,713
$3,713 $3,825 $3,939
Gifts $288
$288 $297 $306
Total Office Costs $43,393 $0 $0 $43,393 $44,695 $46,036
PROFESSIONAL DEVELOPMENT
Core Staff Professional Development $6,365
$6,365 $8,764 $9,093
Project Professional Development
$2,125 $1,797 $3,922 $3,377 $0
SEED Professional Development
$1,201 $0 $1,201 $1,246 $1,293
General Conferences $5,150
$5,150 $5,305 $5,464
Director & AC Prof Dev $2,362 $2,362 $2,433 $2,506
Total Professional Development $13,878 $3,326 $1,797 $19,002 $21,125 $18,356
ANCILLARY COSTS
Journals & Publications $515
$515 $530 $546
Memberships/Subscriptions $2,304
$2,304 $2,373 $2,444
Insurance $3,215
$3,215 $3,311 $3,410
Directors Expenses/Fees $5,600
$5,600 $5,768 $5,941
AVRWMG meeting costs $1,243
$1,243 $1,281 $1,319
Total Ancillary Costs $12,877 $0 $0 $12,877 $13,263 $13,661
VEHICLE & TRAVEL
Vehicle Fuel & Maintenance $3,704
$3,704 $3,816 $3,930
Vehicle Reg & Stamp Duty $1,409
$1,409 $1,452 $1,495
Travel & Parking $618
$618 $637 $656
Total Vehicle & Travel $5,732 $0 $0 $5,732 $5,904 $6,081
STRATEGIC PLANNING
Business Plan & Annual Report Prod $412
$412 $424 $437
FINANCE & AUDITS
Audits & Accounting $24,160
$24,160 $24,884 $25,631
Financial Management $5,517
$5,517 $5,682 $5,853
Total Planning & Compliance $30,088 $0 $0 $30,088 $30,991 $31,921
OTHER COSTS
Stakeholder communications $1,030
$1,030 $1,061 $1,093
Recruitment Expenses $931
$931 $950 $922
Depreciation Vehicles $5,354
$5,354 $5,515 $5,680
Depreciation Office Equipment & Furn $5,156
$5,156 $5,311 $5,470
Bank Charges $957
$957 $986 $1,015
Total Other Costs $13,428 $0 $0 $13,428 $13,822 $14,180
23
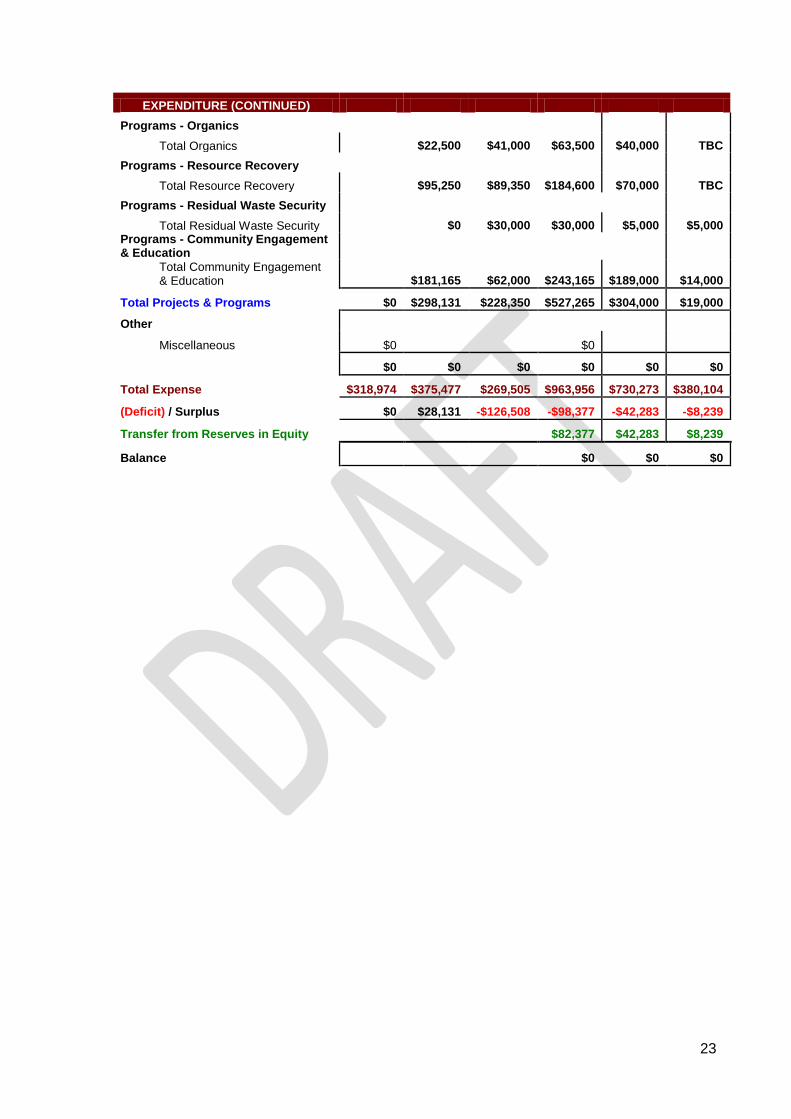
EXPENDITURE (CONTINUED)
Programs - Organics
Total Organics $22,500 $41,000 $63,500 $40,000 TBC
Programs - Resource Recovery
Total Resource Recovery $95,250 $89,350 $184,600 $70,000 TBC
Programs - Residual Waste Security
Total Residual Waste Security $0 $30,000 $30,000 $5,000 $5,000
Programs - Community Engagement & Education
Total Community Engagement & Education $181,165 $62,000 $243,165 $189,000 $14,000
Total Projects & Programs $0 $298,131 $228,350 $527,265 $304,000 $19,000
Other
Miscellaneous $0
$0
$0 $0 $0 $0 $0 $0
Total Expense $318,974 $375,477 $269,505 $963,956 $730,273 $380,104
(Deficit) / Surplus $0 $28,131 -$126,508 -$98,377 -$42,283 -$8,239
Transfer from Reserves in Equity $82,377 $42,283 $8,239
Balance $0 $0 $0
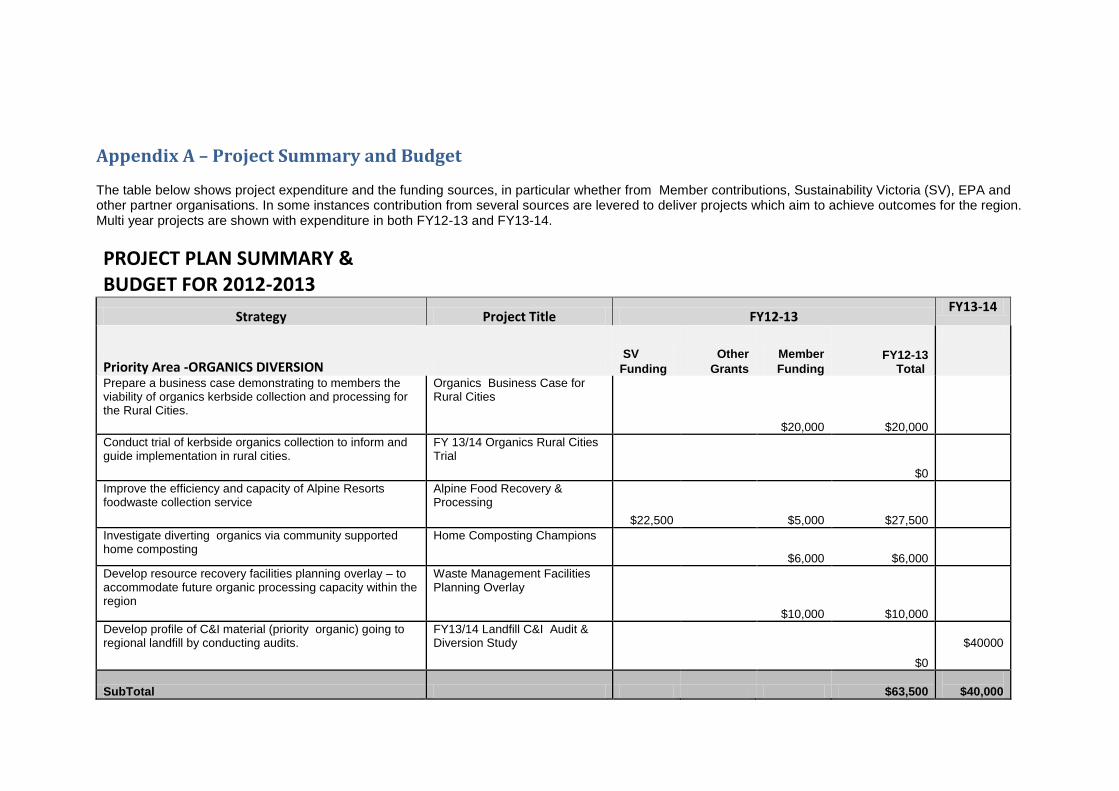
Appendix A – Project Summary and Budget
The table below shows project expenditure and the funding sources, in particular whether from Member contributions, Sustainability Victoria (SV), EPA and other partner organisations. In some instances contribution from several sources are levered to deliver projects which aim to achieve outcomes for the region. Multi year projects are shown with expenditure in both FY12-13 and FY13-14.
PROJECT PLAN SUMMARY & BUDGET FOR 2012-2013
Strategy Project Title FY12-13 FY13-14
Priority Area -ORGANICS DIVERSION SV
Funding Other
Grants Member
Funding FY12-13
Total
Prepare a business case demonstrating to members the viability of organics kerbside collection and processing for the Rural Cities.
Organics Business Case for Rural Cities
$20,000 $20,000
Conduct trial of kerbside organics collection to inform and guide implementation in rural cities.
FY 13/14 Organics Rural Cities Trial
$0
Improve the efficiency and capacity of Alpine Resorts foodwaste collection service
Alpine Food Recovery & Processing
$22,500
$5,000 $27,500
Investigate diverting organics via community supported home composting
Home Composting Champions
$6,000 $6,000
Develop resource recovery facilities planning overlay – to accommodate future organic processing capacity within the region
Waste Management Facilities Planning Overlay
$10,000 $10,000
Develop profile of C&I material (priority organic) going to regional landfill by conducting audits.
FY13/14 Landfill C&I Audit & Diversion Study
$0
$40000
SubTotal $63,500
$40,000
25
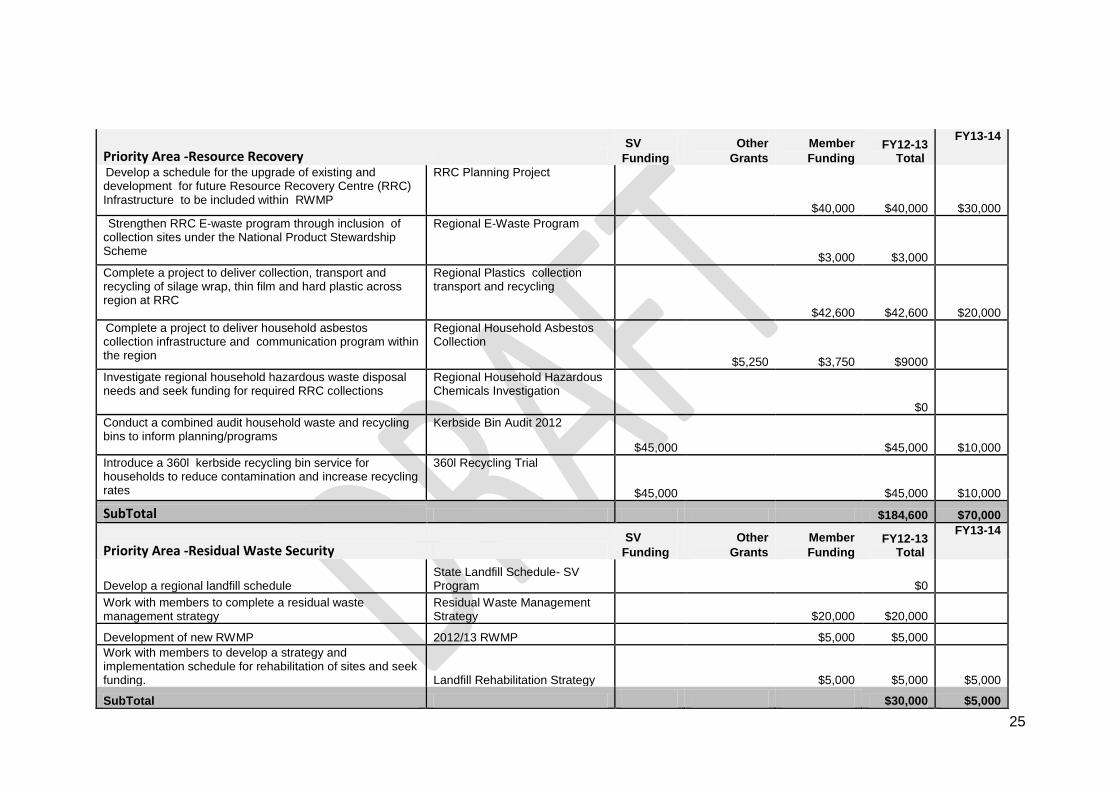
Priority Area -Resource Recovery SV
Funding Other
Grants Member
Funding FY12-13
Total
FY13-14
Develop a schedule for the upgrade of existing and development for future Resource Recovery Centre (RRC) Infrastructure to be included within RWMP
RRC Planning Project
$40,000 $40,000 $30,000
Strengthen RRC E-waste program through inclusion of collection sites under the National Product Stewardship Scheme
Regional E-Waste Program
$3,000 $3,000
Complete a project to deliver collection, transport and recycling of silage wrap, thin film and hard plastic across region at RRC
Regional Plastics collection transport and recycling
$42,600 $42,600 $20,000
Complete a project to deliver household asbestos collection infrastructure and communication program within the region
Regional Household Asbestos Collection
$5,250 $3,750 $9000
Investigate regional household hazardous waste disposal needs and seek funding for required RRC collections
Regional Household Hazardous Chemicals Investigation
$0
Conduct a combined audit household waste and recycling bins to inform planning/programs
Kerbside Bin Audit 2012
$45,000
$45,000 $10,000
Introduce a 360l kerbside recycling bin service for households to reduce contamination and increase recycling rates
360l Recycling Trial
$45,000
$45,000 $10,000
SubTotal $184,600 $70,000
Priority Area -Residual Waste Security SV
Funding Other
Grants Member
Funding FY12-13
Total
FY13-14
Develop a regional landfill schedule State Landfill Schedule- SV Program
$0
Work with members to complete a residual waste management strategy
Residual Waste Management Strategy
$20,000 $20,000
Development of new RWMP 2012/13 RWMP
$5,000 $5,000
Work with members to develop a strategy and implementation schedule for rehabilitation of sites and seek funding. Landfill Rehabilitation Strategy
$5,000 $5,000
$5,000
SubTotal $30,000 $5,000
26
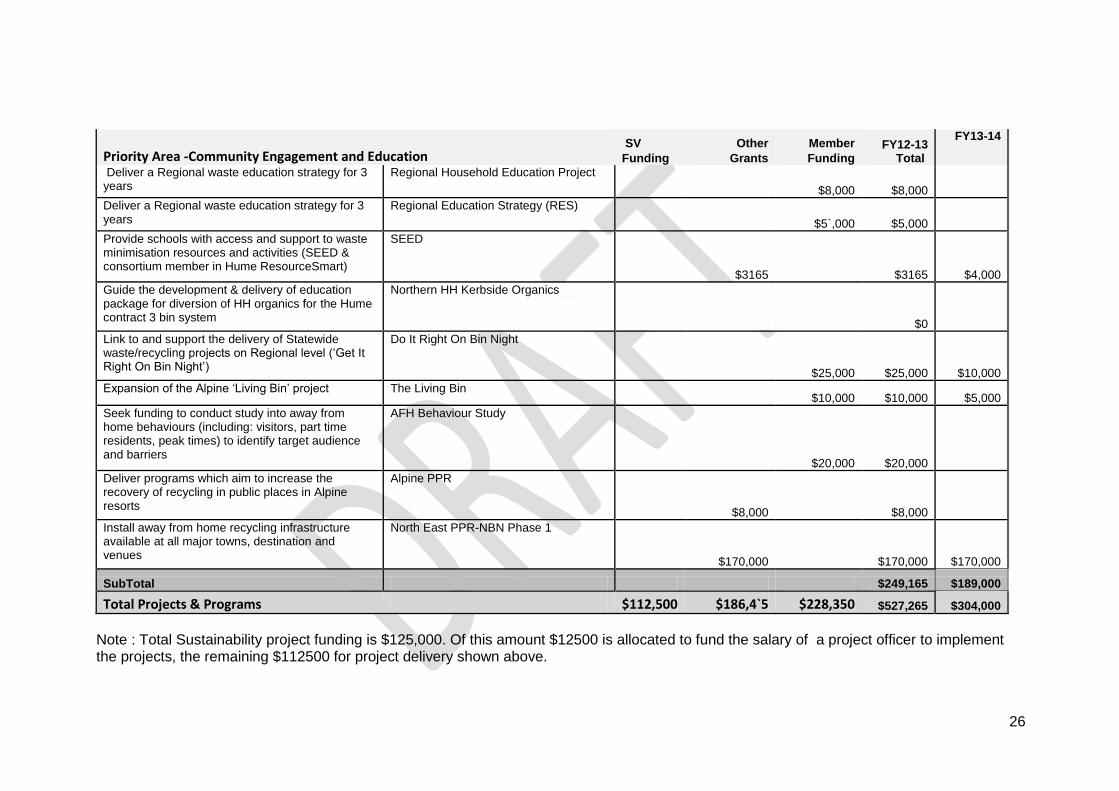
Priority Area -Community Engagement and Education SV
Funding Other
Grants Member
Funding FY12-13
Total
FY13-14
Deliver a Regional waste education strategy for 3 years
Regional Household Education Project
$8,000 $8,000
Deliver a Regional waste education strategy for 3 years
Regional Education Strategy (RES)
$5`,000 $5,000
Provide schools with access and support to waste minimisation resources and activities (SEED & consortium member in Hume ResourceSmart)
SEED
$3165
$3165 $4,000
Guide the development & delivery of education package for diversion of HH organics for the Hume contract 3 bin system
Northern HH Kerbside Organics
$0
Link to and support the delivery of Statewide waste/recycling projects on Regional level (‘Get It Right On Bin Night’)
Do It Right On Bin Night
$25,000 $25,000 $10,000
Expansion of the Alpine ‘Living Bin’ project The Living Bin
$10,000 $10,000 $5,000
Seek funding to conduct study into away from home behaviours (including: visitors, part time residents, peak times) to identify target audience and barriers
AFH Behaviour Study
$20,000 $20,000
Deliver programs which aim to increase the recovery of recycling in public places in Alpine resorts
Alpine PPR
$8,000
$8,000
Install away from home recycling infrastructure available at all major towns, destination and venues
North East PPR-NBN Phase 1
$170,000
$170,000 $170,000
SubTotal $249,165 $189,000
Total Projects & Programs $112,500 $186,4`5 $228,350 $527,265 $304,000
Note : Total Sustainability project funding is $125,000. Of this amount $12500 is allocated to fund the salary of a project officer to implement the projects, the remaining $112500 for project delivery shown above.
27
Appendix B – Legislative Requirements
Under the Environment Protection Act 1970, Regional Waste Management Groups are required to prepare and submit annually a draft three year business plan to the Minister for Environment, Water and Climate Change for approval. The Act sets out the compliance requirements that business plans must satisfy before approval by the Minister. Section 50LA of the Act states: 50LA Annual business plan
(1) Each year a regional waste management group must submit to the Minister for approval, on or before the date required by the Minister, a draft business plan—
(a) that sets out—
(i) its objectives and priorities for the next 3 financial years; and
(ii) financial projections for that period; and
(iii) its budget for the next financial year; and
(iv) what it intends to do over the next financial year; and
(v) any other matters that the Minister requires in writing; and
(b) that is consistent with—
(i) the current business plan of Sustainability Victoria; and
(ii) any current and relevant state-wide strategy published by Sustainability Victoria; and
(iii) its regional waste management plan.
(1A) After amending its draft business plan in any way required by the Minister, the regional waste management group must submit a final business plan to the Minister for approval on or before the date required by the Minister.
(2) If a regional waste management group fails to comply with subsection (1) or (1A), the Minister may direct the Authority to withhold any payment the Authority is required to make to the group under section 52B until the Minister notifies the Authority that she or he is satisfied that the group has complied with subsection (1) or (1A).
(3) The Authority must comply with such a direction.
(4) Before making such a direction, the Minister must consult with Sustainability Victoria.
(5) A regional waste management group must have regard to its current business plan in carrying out its functions.
(6) A regional waste management group must ensure that a copy of its current business plan is available for inspection by members of the public at its principal place of business whenever that place is open to the public.
28
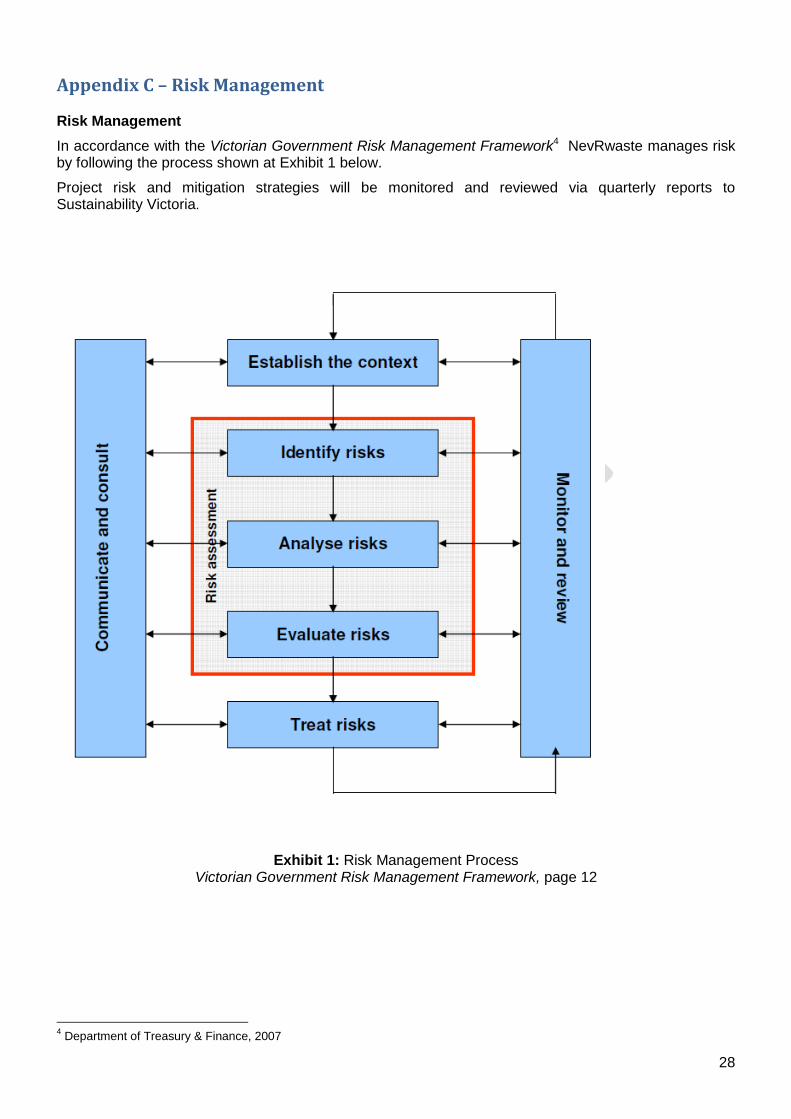
Appendix C – Risk Management Risk Management
In accordance with the Victorian Government Risk Management Framework4 NevRwaste manages risk by following the process shown at Exhibit 1 below.
Project risk and mitigation strategies will be monitored and reviewed via quarterly reports to Sustainability Victoria.
Exhibit 1: Risk Management Process Victorian Government Risk Management Framework, page 12
4 Department of Treasury & Finance, 2007