guernsey: financial sector assessment program … note on stress... · double dip recession on the...
TRANSCRIPT

© 2011 International Monetary Fund January 2011 IMF Country Report No. 11/4
Guernsey: Financial Sector Assessment Program Update— Technical Note on Stress Testing: Banking and Insurance
This Technical Note on Stress Testing: Banking and Insurance on Guernsey was prepared by a staff team of the International Monetary Fund as background documentation for the periodic consultation with the member country. It is based on the information available at the time it was completed in December, 2010. The views expressed in this document are those of the staff team and do not necessarily reflect the views of the government of Guernsey or the Executive Board of the IMF. The policy of publication of staff reports and other documents by the IMF allows for the deletion of market-sensitive information.
Copies of this report are available to the public from
International Monetary Fund ● Publication Services 700 19th Street, N.W. ● Washington, D.C. 20431
Telephone: (202) 623 7430 ● Telefax: (202) 623 7201 E-mail: [email protected] ● Internet: http://www.imf.org
International Monetary Fund Washington, D.C.

FINANCIAL SECTOR ASSESSMENT PROGRAM UPDATE
GUERNSEY
STRESS TESTING: BANKING AND INSURANCE
TECHNICAL NOTE
DECEMBER 2010
INTERNATIONAL MONETARY FUND MONETARY AND CAPITAL MARKETS DEPARTMENT

2
Contents Page
Glossary .....................................................................................................................................3
Executive Summary ...................................................................................................................4
I. Introduction ............................................................................................................................6
II. Banking Sector ......................................................................................................................9 A. Coverage ...................................................................................................................9 B. Method ....................................................................................................................11 C. Metrics and Calibration of Shocks ..........................................................................13 D. Results of Solvency Tests .......................................................................................13 E. Results of Liquidity Risk Tests ...............................................................................25
III. Insurance Sector .................................................................................................................27 A. Coverage .................................................................................................................28 B. Method ....................................................................................................................28 C. Metrics and Calibration of Shocks ..........................................................................31 D. Results .....................................................................................................................32
Tables 1. Financial Soundness Indicators for the Banking Sector ........................................................8 2. Balance Sheet of Banking System, end 2009 ......................................................................10 3. Financial System Structure, 2003-09, by Sector ..................................................................11 4. Stress Test Results for the Banks .........................................................................................18 5. Scenario Analysis for Banks ................................................................................................23 6. Additional Solvency Tests for Credit Risk ..........................................................................25 7. Liquidity Stress Test for Banks............................................................................................27 8. Insurance Sector Indicators ..................................................................................................30 9. Stress Test Results for the Insurance Sector (end 2009 Data) .............................................35 Boxes 1. Market Risk Shocks .............................................................................................................15 2. Credit Risk Shocks ...............................................................................................................19 3. Tests Assessing Credit Concentration Risk .........................................................................21 4. Tests Assessing Operational Risk ........................................................................................23 5. Additional TD Tests for Credit Risk ....................................................................................24 6. Liquidity Risk Shocks ..........................................................................................................26 7. Additional Tests Run for the Insurance Sector ....................................................................32

3
GLOSSARY BU Bottom-up approach Bps Basis points CAR Capital adequacy ratio CDS FSAP
Credit default swap Financial sector assessment program
FSI FX GFSC
Financial soundness indicator Foreign exchange Guernsey Financial Services Commission
ICAAP Internal Capital Adequacy Assessment Process IMF International Monetary Fund KMV EDF LGD NPL
Expected Default Frequency (i.e., PD) calculated by KMV, a subsidiary of Moody’s Loss given default Nonperforming loan
OSCA PD
Own solvency capital assessment Probabilities of default
ROE RWA ST TD
Return on equity Risk-weighted assets Stress test Top-down approach

4
EXECUTIVE SUMMARY
The purpose of stress testing was to assess vulnerabilities in the Guernsey banking and insurance sectors. The approach taken was a simulation of the effect of a potential double dip recession on the solvency of Guernsey banks and insurance companies. The stress tests (ST) were carried out in a manner consistent with those applied in Financial Sector Assessment Program (FSAP) Updates undertaken for the other two Crown Dependencies in 2008, but they also reflected actual experience of institutions and markets in the financial crisis. Hence, in practice, the Guernsey tests were slightly more conservative than in the other Crown Dependencies. As a result of the recovery in capital adequacy since the peak of the crisis (by end 2008), the stress tests were applied against the background of relatively high levels of capitalization at financial institutions (i.e., bank capital adequacy ratios (CARs) at around 19 percent, up from 15 percent at end 2008).
Stress tests for the Guernsey banks:
Method: The tests comprised both bottom-up (BU) STs (based on STs run by Guernsey banks) and top-down (TD) STs carried out by the mission in collaboration with the Guernsey Financial Services Commission (GFSC).
Sensitivity Analysis: The Guernsey banks are most vulnerable with respect to credit risk (resulting from parent exposure and large exposures) as well as foreign exchange (FX) rate risk.
Scenario Analysis: Three banks would need recapitalization in case of a severe macroeconomic shock (e.g., a double dip scenario). Appropriate pro active measures should be taken to reduce risk as deemed appropriate.
Liquidity Risk: The Guernsey banks are vulnerable if daily withdrawals of all deposits (with a maturity of up to one month) exceed 15 percent per day (relative to the remaining balance) for 5 days (i.e., 56 percent in cumulative terms).
Conclusions and recommendations: (i) The banking sector is relatively robust (due to the high level of capitalization), but prudence is still warranted due to the vulnerability to low frequency/high impact events; (ii) future STs should be risk-based (i.e., Risk-Weighted Assets should be calculated based on Value-at-Risk methods); (iii) off-site data to run TD stress tests have to be improved, especially to monitor large exposures; (iv) macro-prudential analysis (including STs) should be run by the authorities on a regular basis; (v) in putting in place measures (ii) to (iv), the authorities should consider the appropriate supervisory response to the risks faced by banks in a pro-active manner.

5
Stress tests for Guernsey insurers:
Method: BU STs were run based on the outcome of standardized STs carried out by all relevant Guernsey insurers (i.e., those of systemic importance and/or with the riskiest balance sheet structures).
Sensitivity Analysis: The tests revealed that Guernsey insurers are most vulnerable to changes in interest rates and asset prices. Operational risk is also significant, although this was not explicitly tested for (but is reflected in the outcome of economic capital calculations done by the Guernsey insurers).
Scenario Analysis: Up to three Guernsey insurers could be adversely affected if a severe macroeconomic shock (double dip) were to materialize. As with banks, appropriate pro-active measures should be taken to reduce risk.
Conclusions and recommendations: (i) The Guernsey insurance sector appears relatively robust due to a high level of capitalization, but extreme shocks could trigger stress and contagion; (ii) future STs should be risk-based(i.e. capital requirements should be based on economic measures rather than statutory ones); (iii) data to run on- and off-site STs should be improved as a high priority; and (iv) insurers should be encouraged to further develop internal STs and (pro-active) risk mitigation measures should be applied by the GFSC as deemed appropriate.

6
I. INTRODUCTION1
1. STs were undertaken as part of the Guernsey FSAP Update in order to assess the resilience of the Guernsey financial system to a variety of potential strains. As part of financial stability analysis, STs complement other approaches to the assessment of risk, both qualitative assessments (for example the evaluation of the degree of observance of prudential standards) and quantitative analysis (financial soundness indicators (FSIs), peer group analysis, early warning type approaches).
2. The key contribution of stress testing is that it allows for a non-standardized investigation of the vulnerability of key elements of a financial system (typically systemically important firms) and the system as a whole to potential shocks. Because STs are usually non-standardized, the challenge is to assess the key risks by (i) using appropriate methods; (ii) defining appropriate stress events (called scenarios2 in a multivariate context). An important approach to defining scenarios is to refer to historic stress levels. Scenarios may also be defined on an ad-hoc basis (expert based) or on the basis of forecasts of macroeconomic models. A key criterion is to define scenarios that are “extreme yet plausible.” An important feature of STs (for example expert based scenarios) is that they are forward-looking and more comprehensive than analysis of FSIs.
3. An important caveat is that STs are stylized (which applies to all models and methods), and important aspects may be overlooked. Most STs do not model feedback effects through changes in behavior of affected market participants, in the wider economy and effects in terms of general equilibrium. While macro feedback effects are unlikely to have an important effect in case of Guernsey, they are, in general, relevant and could either improve or worsen the outcome of a ST. Likewise, using inappropriate methods could lead to misleading results (if the assumptions underlying the methods are not appropriate).
4. The STs for this FSAP Update were designed to deliver a comprehensive picture of the vulnerability of the Guernsey financial system, taking into account the availability of data. To this end, the team made use of the capacity of financial institutions and the GFSC. In particular, STs were performed both by individual institutions based on the parameters and scenarios agreed between the authorities and Fund staff, and at an aggregate level, which allowed for checking of the results for consistency in a top-down manner. The results were reported in sufficient detail to illuminate the behavior of the respective sector as a whole as well as the dispersion of results across institutions. Furthermore, several relevant variables were reported for each test to aid in interpretation. As such, the Guernsey stress tests were slightly more conservative than in the other Crown Dependencies.
1 Prepared by Christian Schmieder.
2 A scenario typically assessed the effect of a shock affecting several risk types at the same time.

7
5. The approach was consistent with that used in the other Crown Dependencies. An overarching goal for the STs was to carry out an assessment that is aligned to the tests done in 2008 in Jersey and the Isle of Man (IOM), while also reflecting the financial crisis and the specific nature of the business in Guernsey.
6. The tests cover the banking and the insurance sectors. Both sectors are of systemic as well as international importance, while the investment sector has lower inherent risks. As far as possible and relevant, the mission sought to align the tests for the two sectors. Since the system is relatively concentrated, a high degree of coverage was achieved by including a limited number of firms.
7. The STs assess the sensitivity of banks and insurance companies to single-factor shocks to risk types affecting the solvency and liquidity position of institutions. The risk types are interest rates, exchange rates, credit quality, asset price risk, operational risk as well as liquidity risk. For the insurance sector, (life) insurance risks were also assessed. The risk factor tests assume that specific key risk parameters such as the exchange rate shifts suddenly (and instantly), while all else remains the same. The magnitude of shock effects is calculated by revaluing items in the balance sheet (and, in specific cases such as credit risk, off-balance sheet) affecting capital and risk-weighted assets, respectively.
8. The tests were based on the institutions’ financial positions at end 2009, with the aim to assess potential risks arising during 2010. As displayed in Table 1, the banking sector was exposed to stress in 2008 with capital adequacy ratios decreasing by three percentage points on average (from 18 percent to 15 percent) compared with 2007. At the same time return on equity (ROE), dropped from about 15 percent in 2007 to below 11 percent in 2008.3 The most visible sign of stress was the failure of a subsidiary of the Icelandic bank Landsbanki. The administration of the failed bank is continuing and at this stage the administrator expects that depositors will recover around 90 percent of their losses through the process.
3 According to Čihák and Schaeck (2007, How Well Do Aggregate Bank Ratios Identify Banking Problems? IMF Working Paper 07/275), CARs and the level of nonperforming loans (NPLs) of banks are signals for systemic stress and banks’ ROEs points to the beginning (i.e., timing) of stress.
8
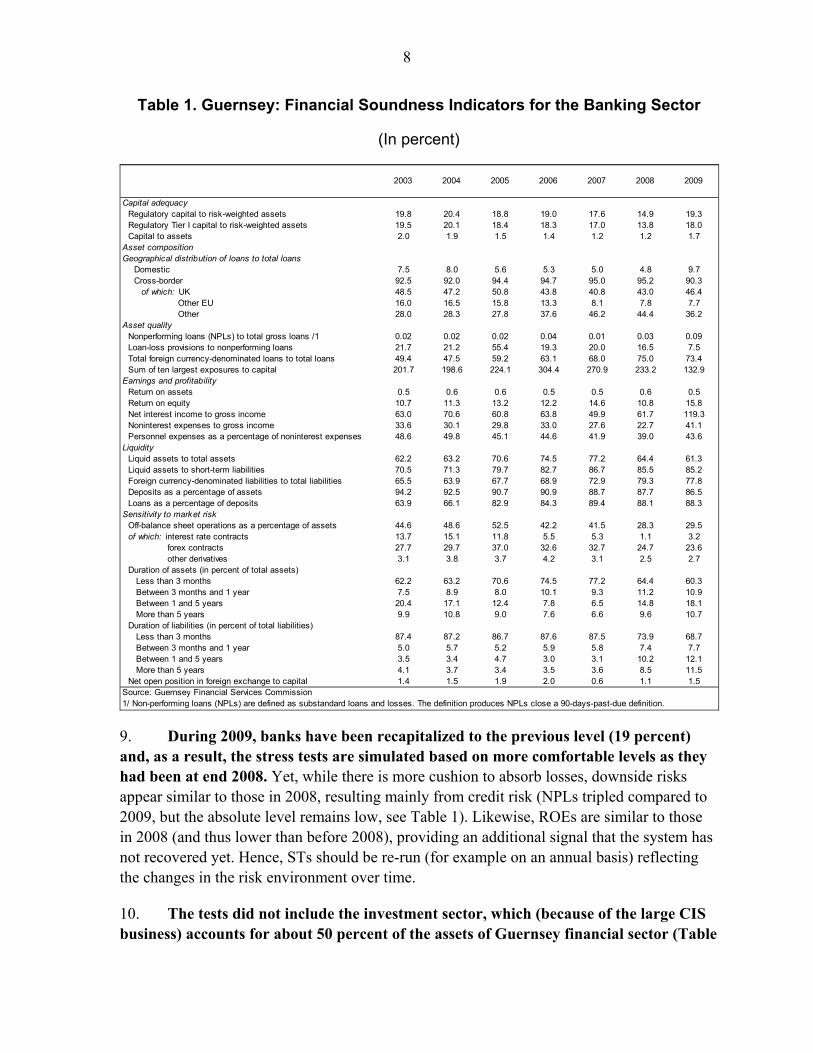
Table 1. Guernsey: Financial Soundness Indicators for the Banking Sector
(In percent)
2003 2004 2005 2006 2007 2008 2009
Capital adequacy Regulatory capital to risk-weighted assets 19.8 20.4 18.8 19.0 17.6 14.9 19.3Regulatory Tier I capital to risk-weighted assets 19.5 20.1 18.4 18.3 17.0 13.8 18.0Capital to assets 2.0 1.9 1.5 1.4 1.2 1.2 1.7
Asset compositionGeographical distribution of loans to total loans
Domestic 7.5 8.0 5.6 5.3 5.0 4.8 9.7Cross-border 92.5 92.0 94.4 94.7 95.0 95.2 90.3
of which: UK 48.5 47.2 50.8 43.8 40.8 43.0 46.4 Other EU 16.0 16.5 15.8 13.3 8.1 7.8 7.7 Other 28.0 28.3 27.8 37.6 46.2 44.4 36.2
Asset qualityNonperforming loans (NPLs) to total gross loans /1 0.02 0.02 0.02 0.04 0.01 0.03 0.09Loan-loss provisions to nonperforming loans 21.7 21.2 55.4 19.3 20.0 16.5 7.5Total foreign currency-denominated loans to total loans 49.4 47.5 59.2 63.1 68.0 75.0 73.4Sum of ten largest exposures to capital 201.7 198.6 224.1 304.4 270.9 233.2 132.9
Earnings and profitabilityReturn on assets 0.5 0.6 0.6 0.5 0.5 0.6 0.5Return on equity 10.7 11.3 13.2 12.2 14.6 10.8 15.8Net interest income to gross income 63.0 70.6 60.8 63.8 49.9 61.7 119.3Noninterest expenses to gross income 33.6 30.1 29.8 33.0 27.6 22.7 41.1Personnel expenses as a percentage of noninterest expenses 48.6 49.8 45.1 44.6 41.9 39.0 43.6
LiquidityLiquid assets to total assets 62.2 63.2 70.6 74.5 77.2 64.4 61.3Liquid assets to short-term liabilities 70.5 71.3 79.7 82.7 86.7 85.5 85.2Foreign currency-denominated liabilities to total liabilities 65.5 63.9 67.7 68.9 72.9 79.3 77.8Deposits as a percentage of assets 94.2 92.5 90.7 90.9 88.7 87.7 86.5Loans as a percentage of deposits 63.9 66.1 82.9 84.3 89.4 88.1 88.3
Sensitivity to market riskOff-balance sheet operations as a percentage of assets 44.6 48.6 52.5 42.2 41.5 28.3 29.5of which: interest rate contracts 13.7 15.1 11.8 5.5 5.3 1.1 3.2 forex contracts 27.7 29.7 37.0 32.6 32.7 24.7 23.6 other derivatives 3.1 3.8 3.7 4.2 3.1 2.5 2.7Duration of assets (in percent of total assets) Less than 3 months 62.2 63.2 70.6 74.5 77.2 64.4 60.3 Between 3 months and 1 year 7.5 8.9 8.0 10.1 9.3 11.2 10.9 Between 1 and 5 years 20.4 17.1 12.4 7.8 6.5 14.8 18.1 More than 5 years 9.9 10.8 9.0 7.6 6.6 9.6 10.7Duration of liabilities (in percent of total liabilities) Less than 3 months 87.4 87.2 86.7 87.6 87.5 73.9 68.7 Between 3 months and 1 year 5.0 5.7 5.2 5.9 5.8 7.4 7.7 Between 1 and 5 years 3.5 3.4 4.7 3.0 3.1 10.2 12.1 More than 5 years 4.1 3.7 3.4 3.5 3.6 8.5 11.5Net open position in foreign exchange to capital 1.4 1.5 1.9 2.0 0.6 1.1 1.5
Source: Guernsey Financial Services Commission1/ Non-performing loans (NPLs) are defined as substandard loans and losses. The definition produces NPLs close a 90-days-past-due definition.
9. During 2009, banks have been recapitalized to the previous level (19 percent) and, as a result, the stress tests are simulated based on more comfortable levels as they had been at end 2008. Yet, while there is more cushion to absorb losses, downside risks appear similar to those in 2008, resulting mainly from credit risk (NPLs tripled compared to 2009, but the absolute level remains low, see Table 1). Likewise, ROEs are similar to those in 2008 (and thus lower than before 2008), providing an additional signal that the system has not recovered yet. Hence, STs should be re-run (for example on an annual basis) reflecting the changes in the risk environment over time.
10. The tests did not include the investment sector, which (because of the large CIS business) accounts for about 50 percent of the assets of Guernsey financial sector (Table

9
3). However, based on the feedback which the mission gained from a limited number of firms that it met with, the risks posed by the sector to the system’s stability remain relatively low given its limited leverage. The meetings with the firms also suggested that the firms have weathered the crisis without major problems. Potential risks should nonetheless be monitored, particularly for the funds investing in riskier activities such as real estate, emerging market assets, and derivatives. Should the level of interest rates remain low for a longer period of time, risks could emerge from a search for yield. The authorities should consider collecting FSIs for the investment sector (for example data on profitability, leverage, capitalization and risks), which would allow not only improved monitoring of the sector but also make it possible to run stress tests in the future.
11. As a final step, the single-factor solvency shocks were pooled to a scenario to test the effect of a potential joint shock in several dimensions. It was assumed that such a shock would hit Guernsey as a result of a macroeconomic shock in one major economy to which the island is linked (particularly the United Kingdom (UK)). The scenario has been defined based on expert judgment, combining severe shocks, but not necessarily the most adverse shocks to the single risk types.4 To this end, the scenarios run for the banks and insurance companies are meant to capture a potential effect of an external macroeconomic shock on the financial system of Guernsey overall – a global double dip stress scenario.
12. The remainder of this note explains the stress testing methodology and results in more detail. The next section looks at the banking sector stress tests, and defines the sample of banks, the methodology, the selection and calibration of the tests, the various metrics used to interpret results, and the details of the results themselves. The following section looks at the insurance sector tests.
II. BANKING SECTOR
A. Coverage
13. The STs covered 19 subsidiaries of foreign banks (out of 21 on the island),5 except in the case of liquidity tests, which included in addition 5 foreign branches (out of 21). The 19 subsidiaries included in the tests account, in principle, for the total assets of the Guernsey subsidiaries (i.e., 36 percent of the total assets of the banking sector). Seven of the subsidiaries belonged to U.K. banking groups and accounted for 40 percent of the total assets of the subsidiaries included in the solvency test sample; three subsidiaries belonged to EU banking groups (two of them based in Cyprus and one in the Netherlands) and accounted for 4 percent of the solvency test sample; five of the subsidiaries belonged to Swiss banks 4 For the design of the scenarios, the mission used expert knowledge and benchmarking with other ST exercises (FSAPs, technical assistance missions).
5 There are no locally-owned institutions on the island, but 22 subsidiaries and 22 branches of foreign banks.

10
and represented 18 percent of the sample; one of the subsidiaries belonged to a Bermuda based bank and represented 3 percent of the sample; two banks were subsidiaries of North America based banks, one of them based in Canada (20 percent of the sample) and one in the United States (10 percent of the sample); and another subsidiary belonged to a South African group and represented 5 percent of the sample. Table 2 provides an overview of the structure of the banking sector aggregate balance sheet.
Table 2. Guernsey. Balance Sheet of Banking System, end 2009
GBP millions
Percent of total assets
Percent of subgroup
Percent of GDP /1
Assets 135,803 100.0 100.0 7,893.9 Cash 25 0.0 100.0 1.5
Loans to Banks 75,605 55.7 100.0 4,394.7 Loans to Parent 56,464 41.9 75.3 3,282.1 Loans to fellow banking subsidiaries 16,619 12.3 22.2 966.0 Loans to other banks 2,522 1.9 3.4 146.6
Marketable Assets 24,353 17.2 100.0 1,415.6
Loans and Advances 25,710 18.9 100.0 1,494.5 Other non-banking financial institutions 18,128 13.5 71.1 1,053.7 Sovereigns 3 0.0 0.0 0.1 Public sector entreprises 69 0.1 0.3 4.0 Corporate Lending 2,167 1.6 8.5 125.9 Retail Lending 2,541 1.9 10.0 147.7 Residential Mortgages 2,730 2.0 10.7 158.7 Capital Connected Lending 73 0.1 0.3 4.2
Investments 6,791 5.0 100.0 394.7 Non Marketable debt - Other non-banking financial institutions 5,987 4.4 88.9 348.0 Non Marketable debt - Corporate 155 0.1 2.3 9.0 Capital Investments in Subsidiaries and other associated companies 21 0.0 0.3 1.2 Equity - Corporate 274 0.2 4.1 15.9
Other Financial 3,144 2.3 100.0 182.8 thereof: All past due assets 76 0.1 2.4 4.4
Other 175 0.1 100.0 10.2 thereof: Intangible assets including goodwill 87 0.1 49.9 5.1
Liabilities 135,803 100.0 100.0 7,893.9 Deposits due to: 114,751 84.5 100.0 6,670.2
Parent/Holding Company or Group 65,508 48.2 57.1 3,807.9 Retail Accounts 9,288 6.8 8.1 539.9 All Other Depositors 39,955 29.4 34.8 2,322.5
CDs and Other Debt 14,312 10.5 100.0 831.9
Creditors & Accruals etc 4,467 3.3 100.0 259.6
Capital 2,273 1.7 100.0 132.1
Sources: GFSC and staff estimates.1/ Percent of end 2008 GDP (Source: Guernsey, Policy Council)
14. To assess the short-term vulnerability of the banking system to a liquidity shock, five large foreign branches were added to the sample. The branches represented 62 percent of Guernsey banking sector assets (and 69 percent of the liquidity risk test

11
sample). Four of them belong to large European banking groups. The structure of the Guernsey financial system is displayed in Table 3.
Table 3. Guernsey: Financial System Structure, 2003-09, by Sector
Number Assets(GBP billion)
Percent of total
assets
Number Assets(GBP billion)
Percent of total
assets
Number Assets(GBP billion)
Percent of total assets
Percent of GDP
Banking Sector 61 72.9 56.3 47 131.9 44.6 44 135.8 43.5 7,894 Joint stock and private banks 32 22.7 17.6 21 29.4 9.9 21 36.3 11.6 2,109
of which: Subsidiaries of UK banks 10 9.7 7.5 7 6.3 2.1 7 14.2 4.6 827 of which: Subsidiaries of other EU banks 8 3.7 2.8 3 1.6 0.6 3 1.5 0.5 90
Bank branches 25 47.9 37.0 23 100.1 33.8 21 97.7 31.3 5,680 of which: UK 12 16.8 13.0 9 27.6 9.3 10 18.4 5.9 1,070 of which: Other EU 5 5.0 3.9 6 4.2 1.4 4 2.1 0.7 124
Other 4 2.3 1.7 3 2.4 0.8 2 1.8 0.6 106 Insurance sector 406 14.7 11.4 404 18.5 6.2 396 21.0 6.7 1,223
Life insurance companies 22 3.6 2.8 23 8.6 2.9 32 9.8 3.1 569 Non-life companies … … … … … … 51 1 30 Reinsurance … … … … … … 13 1 32 Captives 384 11.0 8.5 381 9.9 3.3 300 10.2 3.3 591
Other financial institutions/3 488 41.8 32.3 851 145.6 49.2 969 155.5 49.8 9,037 Total financial system 955 129.4 100.0 1,302 296.0 100.0 1,409 312.3 100.0 18,153
Memo items:Number of company service providers/4 … … … … … … 199 … …Number of trust service providers … … … … … … 199 … …Number of employees in the financial sector … … … … … … 6,975 … 22%
of which: Banking … … … … … … 1,926 … 6%Total employment … … … … … … 32,332 … 100%Financial sector contribution to GDP (GBP m … … … 590 … 35% … … …Total GDP (GBP millions) … … … 1,685 … … … … …
Source: Guernsey Financial Services Commission1/ Insurance figures for 2003 represent situation at end 20042/ Insurance figures for 2009 represent situation at end 20083/ Other financial institutions are by vast majority mutual funds4/ Figure includes businesses and individuals
2003 /1 2007 2009 /2
B. Method
15. Two different approaches to stress tests were used: (i) the TD approach, where the mission performed the tests for individual institutions on the basis of reported supervisory data; and the BU approach, where individual institutions conducted standardized tests based on their own stress testing calculation framework:
The stress testing approach used in the BU exercise builds on the expertise of the individual banks (the GFSC helped ensure consistency across institutions), using the firms’ internal data and proprietary risk models. The latter are mostly based on their parent’s risk management frameworks and in some cases the tests were actually run by the parent banks themselves. The STs included all those positions sensitive to a certain risk type. In order to arrive at a better understanding of the underlying data, assumptions, and methods used by the banks, the mission engaged in a discussion with selected banks. These discussions were particularly useful not only to develop a better understanding of the banks’ tests, but also to ensure consistency between the TD and the BU tests.
The TD stress tests are based on supervisory (off-site) data collected by the GFSC. Similar to the BU approach, the TD approach comprised the same tests applied to the

12
business of each bank separately and then aggregated to arrive at a system level overview. The advantage of the TD approach is that the aggregation of the results is based on consistent bank-specific test results.
16. The results were reported on an institution-specific basis with sufficient details to investigate individual drivers. The shocks were assumed to occur instantaneously and the impact of each shock was estimated individually, assuming that all other variables remain constant. The impact was estimated by calculating the effect on end 2009 positions. As the credit risk figures are of annual frequency and it is assumed that profit is a first line of defense6, the tests do, in principle, provide an outlook of what could happen to the banks’ solvency during 2010.
17. Despite efforts to ensure that the tests allow for identification of the most relevant risks in the system, some caveats apply. For all tests, an important caveat is that they do not model feedbacks, for example the behavioral reaction of the firms to shocks or the international reaction to shocks. The latter would be visible through the reaction of the parent banks, for example. Such reactions could mitigate (e.g., by raising capital, reducing risk, if possible) or worsen (e.g., myopic “fire sales”) the effect of a stress. At present, there is no ‘agreed’ single model that would allow simulation of the reactions of market participants in a meaningful way,7 so that expert judgment is required. Some attempts are made to deal with this issue, for example, by performing a scenario analysis type ST and interpreting the results in a broader context. While it may be possible to rely on the assumption of parental support in case of shocks to mitigate stress, the crisis has shown that this assumption might not hold true in case of extreme circumstances, which could re-occur in the future. The mission has therefore added an explicit test to simulate the loss of parental exposure.
18. Another caveat is that banks currently use simplified risk management models for regulatory purposes and therefore also for the STs (i.e., the Basel II Standardized Approach (es)), and as a result certain risk sensitivities might not be captured in the test results. Going forward, the Internal Capital Adequacy Assessment Process (ICAAP) can be used to gradually enrich the tests along this line. The mission has applied some additional (Basel II Internal-Rating based type) sensitivity analyses to avoid underestimating risks that may be greater than they appear at first.
6 The bank-specific 2009 profits were used as a baseline scenario, adjusted for stressed credit losses exceeding the 2009 level and losses resulting from interest rate shocks.
7 It is common to assume instantaneous effects of stress (while stress might evolve gradually) and constant portfolios over time, for example.

13
C. Metrics and Calibration of Shocks
19. The shocks are applied to the banks’ business at end 2009 and are calculated in terms of capital adequacy. The outcome yields the post-shock capital adequacy levels of each institution, which are compared with the minimum capital adequacy level set by the GFSC (10 percent).8 It is important to note that the TD test is based on minimum capital requirements including the Pillar 2 charge set by the GFSC.9 In case of a breach of this level, the outcome shows the recapitalization needs both in terms of absolute amounts (in million GBPs) and in terms of a percentage of GDP.
20. The calibration of the shocks is aimed to be such that the shocks represent “extreme but plausible” events. Broadly, the calibration corresponds to the one used in recent FSAPs for comparable jurisdictions (and, in particular, the tests applies to Jersey and the IOM in 2008), adding some more severe stress levels as observed during the crisis.
21. In terms of liquidity risk, the tests assessed how many days the institutions would be able to withstand a run on their deposits, assuming that capital markets are not available for funding. Based on experience gained during the crisis, an important point of reference for banks is to be able to survive five days with their liquidity position at each point in time.
D. Results of Solvency Tests
22. The results of the solvency STs are displayed in Table 4. Essentially, the table shows (i) the shocks as specified in the first column, together with information on the pre-shock capitalization level;10 (ii) columns 2 to 7 display the result of the BU stress tests, including the asset-weighted average CAR after stress (column 2), the minimum and maximum post-shock CAR for one single bank (column 3,4), the number of banks breaching the minimum CAR set by the GFSC (10 percent, column 5) as well as the recapitalization needs in absolute terms (column 6) and in relative terms to GDP (column 7). The recapitalization needs are calculated based on the capital needed to bring the bank’s CAR back to the 10 percent minimum ratio; and (iii) the next six columns show the same information for the TD tests.
8 We disregarded the fact that the GFSC applies institution-specific minimum capital requirements ranging from 10 percent to 16 percent.
9 This is, in fact, why one bank is undercapitalized at 9.8 percent in the pre-shock baseline case based on the sum of Tier 1 and Tier 2 minimum capital requirements (see Table 4f.).
10 As the TD tests are based on the very latest information on capital and risk-weighted assets (RWAs), the pre-shock capitalization level is slightly different from pre-shock CAR referred to by the BU tests.

14
23. Overall, the BU and the TD tests produce similar results. The results identify the same risks as being most relevant, although the range of the TD results tends to be wider for some risk types (interest rate risk, asset price risk, credit risk) and narrower for the FX rate tests. The differences are in line with expectations, and result from more detailed information and the use of different methods in the BU and TD exercises.
24. As the tests have been defined with a view to reflect the crisis, the results present a conservative picture of the impact of a potential shock to specific risk types. However, in some other dimensions the stress testing framework was less conservative (compared with what one might assume under strict criteria), thereby balancing the severity of the overall test results:
profits were assumed to be a first line of defense. In the TD stress tests, we simulated a shock assuming that no profits were available as a first line of defense;
for the most relevant risk, namely credit risk, some banks had not observed any losses in 2009, which was taken as a baseline scenario for test 1 and 2 (C1, C2). Accordingly, the tests did not simulate any losses for those banks
this assumption is also taken back in follow-up analyses—the tests for credit risk assume that the unexpected losses (in terms of RWAs) are held constant. This assumption has also been taken back later on, thereby moving to a Basel II Internal Rating-based approach setting.
Market risk (interest rate, foreign exchange rate, and asset price risks)
25. Market risk shocks constitute instantaneous shocks on the balance sheet and thus on capital adequacy ratios. Given that market risk has been treated in a mark-to-market manner for a long time, and stress testing actually originated from market risk management, these types of risks are typically well understood by banks and adequately managed. Nevertheless, given the considerable business volumes and the high frequency nature of the business, market risk activities remain a threat to a bank’s solvency under specific circumstances. However, as Guernsey banks do not have trading books, they are not subject to noteworthy vulnerabilities to market risk.
26. As part of the BU test, banks were asked to calculate the impact of a variety of market risk shocks on their portfolios, consisting of both the trading and banking books (Box 1). The tests aimed at an assessment of three key market risk types, namely interest rate risk, foreign exchange rate risk and asset price risk. To that end, the tests covered (i) shocks to the sterling pound, US dollar, and Euro yield curve (I1-I12); (ii) changes of the sterling pound and US dollar exchange rates against all other currencies by 20 percent and 30 percent, respectively (F1-F8); and (iii) asset price shocks in terms of a decrease of equity prices by 35 percent (A1), and a downgrade of all rated securities by 2 and 4 categories (A2, A3).

15
Box 1. Market Risk Shocks
Interest rate risk
I1: Parallel upward shift of the pound sterling yield curve by 200 basis points. I2: Parallel downward shift of the pound sterling yield curve by 200 basis points. I3: Parallel upward shift of the pound sterling yield curve by 300 basis points. I4: Parallel downward shift of the pound sterling yield curve by 300 basis points. I5: Parallel upward shift of the dollar yield curve by 200 basis points. I6: Parallel downward shift of the dollar yield curve by 200 basis points. I7: Parallel upward shift of the dollar yield curve by 300 basis points. I8: Parallel downward shift of the dollar yield curve by 300 basis points. I9: Parallel upward shift of the euro yield curve by 200 basis points. I10: Parallel downward shift of the euro yield curve by 200 basis points. I11: Parallel upward shift of the euro yield curve by 300 basis points. I12: Parallel downward shift of the euro yield curve by 300 basis points.
Foreign Exchange Rate Risk
F1: The pound depreciates by 20 percent against all other currencies. F2: The pound appreciates by 20 percent against all other currencies. F3: The pound depreciates by 30 percent against all other currencies. F4: The pound appreciates by 30 percent against all other currencies. F5: The dollar depreciates by 20 percent against all other currencies. F6: The dollar appreciates by 20 percent against all other currencies. F7: The dollar depreciates by 30 percent against all other currencies. F8: The dollar appreciates by 30 percent against all other currencies.
Asset Price Risk
A1: Prices of all shares listed on foreign stock markets decline by 35 percent. A2: Rated securities are downgraded by two notches. A3: Rated securities are downgraded by four notches.
27. The market risk tests simulate the effect on income (interest rate risk) and risk-weighted assets (FX rate risk, asset price risk), respectively. In the former case, the losses (gains) were directly deducted (added) from capital. This is a conservative treatment of market risk in stress tests, since profits from activities other than the one affected by stress (unless there is a major shock affecting all sources of profit at the same time) typically form a first buffer against losses. To this end, more conservative shocks were applied compared with the previous IMF FSAP ST exercises carried out for Jersey and the IOM.
28. The outcome of the tests for market risk confirmed that the Guernsey banking system exhibits limited exposure to market risk shocks (Table 4). As expected, the most notable effect was observed for FX rate risk, while interest rate risk seems to be limited. The asset price risk shocks, particularly test A3 (downgrade of all rated securities by 4 notches)

16
can, in relative terms, be considered the most conservative (i.e., least plausible), but would not result in a threat to the system.
29. The banks are highly exposed to FX risks in gross terms. This is because 75 percent of the total loans are foreign-currency denominated, which is also mirrored on the liability side with 79 percent of the liabilities being denominated in foreign currency.11 In order to match the FX risk on the asset and liability side of the balance sheet, the banks apply hedges (off-balance sheet Forex contracts amount to 26 percent of the assets), mostly via their group treasury function (the effect on the net open positions relative to capital is clearly shown in Table 1). However, given that the majority but not all banks’ capital is denominated in pound sterling, a depreciation of the sterling and an appreciation of the major foreign currency, US dollars, will have a negative effect on capital and thus on solvency. The pertinent BU stress tests carried out by the Guernsey banks (F1, F3, F6, F8) clearly display this effect, and in the most severe shock scenarios (F3, F8), where the pound sterling (F3) and the US dollar (F8) move by 30 percent the capital adequacy of up to four banks fall below 10 percent and recapitalization needs amount to almost 3 percent of GDP. For the less severe tests simulating an instantaneous change of FX rates by 20 percent, the effect is considerably lower, with hardly any recapitalization needs.
30. The TD tests are based on the open currency positions and the assumptions that risk (RWAs) increases linearly with the actual FX positions. Accordingly, the same shocks are identified as being the most relevant, but stress is simulated to be less severe than based on the economically more meaningful BU tests. This should be taken into account by the authorities when designing TD FX stress events. The mission recommends using a rule of thumb based on the outcome of the BU tests.12 Overall, given the severity of the shocks (which reflect current uncertainties in the markets), the system appears robust against FX risks, but the evolution of risk should be closely monitored.
31. The interest rate risk tests examined banks’ ability to absorb sudden changes in the yield curves of key interest rates. This could happen not only as a consequence of a change in monetary policy, but also from a widening of spreads due to market stress. The tests display that the Guernsey banks are well protected against sudden movements of interest rates at the time when the tests were carried out. Both the BU and the TD STs did not show any substantial movements of capital adequacy resulting from a change in interest rates (affecting net interest income adversely), indicating that repricing risk, which is the most relevant interest rate risk for the Guernsey banks (revaluation is not relevant due to the non-existence of trading portfolios), is limited. The tests thereby also confirmed that maturities
11 See Table 1.
12 To do so, the authorities can calibrate the TD tests at the level of the average impact of FX rate changes in the system, in order to enrich the TD framework.

17
are well matched by banks. The effect of the TD shock is slightly more pronounced resulting from the lower granularity of the data used for the test.13 The outcome of the tests may, however, be driven by the fact that interest rates are exceptionally low at this time, so regular tests are warranted to investigate unexpected drops in rates at a later stage.
32. Relative to the total assets, the portion of marketable securities held at the time of the test by the banks (17 percent) was considerable higher than for the Jersey and IOM banks at the time of the last IMF FSAP missions (below 4 percent each). Essentially, the asset price tests examined banks’ sensitivity to a sudden fall in equity prices and/or a significant downgrade in rated securities. The outcome of the BU and the TD tests are in line with one another and show that a severe drop in equity prices does not trigger severe stress for the system, neither does a drop of the ratings of all rated securities by two categories —originating some recapitalization needs for two banks. However, an extreme drop of ratings by four categories would require recapitalization for up to four banks, but (i) the occurrence of this scenario is very unlikely; and (ii) recapitalization needs remain at below 5 percent of GDP. Nevertheless, given the noteworthy extent of marketable securities held by Guernsey banks, this risk should be regularly monitored in times of high uncertainty in the markets, as has been the case in recent months.
13 For the TD STs, the Economic Value-at-Risk calculated based on a 200 bps shock by each bank was referred to. For the 300 bps shock it was assumed that the severity of the shock is twice as high. Again, the impact of this shock was directly put against capital (i.e. without assuming profit as a first line of defense), depending on the direction of the interest rate movement.

18
Table 4. Guernsey: Solvency Stress Test Results for the Banks
Shocks CAR 1/ Min. Max. No. banks
breaching min. CAR
CAR 1/ Min. Max. No. banks
breaching min. CAR
In GBP m
In Percent
In GBP m
In Percent of GDP
Pre-shock capital 18.1 10.0 75.0 0 0.0 0.0 18.5 9.8 90.8 1 0.9 0.1
Interest Rate RiskI1: Parallel upward shift of the pound sterling yield curve by 200 basis points. 19.2 10.0 75.0 0 0.0 0.0 19.4 9.8 91.1 1 0.7 0.0I2: Parallel downward shift of the pound sterling yield curve by 200 basis points. 19.3 10.0 75.0 0 0.0 0.0 19.0 9.7 90.5 1 1.1 0.1
I3: Parallel upward shift of the pound sterling yield curve by 300 basis points. 19.2 10.0 75.0 0 0.0 0.0 19.5 9.9 91.5 1 0.5 0.0
I4: Parallel downward shift of the pound sterling yield curve by 300 basis points. 19.3 10.0 75.0 0 0.0 0.0 18.8 9.7 90.1 1 1.3 0.1
I5: Parallel upward shift of the dollar yield curve by 200 basis points. 19.4 10.0 75.0 0 0.0 0.0 19.2 9.8 90.8 1 0.8 0.0I6: Parallel downward shift of the dollar yield curve by 200 basis points. 19.4 10.0 75.0 0 0.0 0.0 19.2 9.8 90.8 1 0.9 0.1I7: Parallel upward shift of the dollar yield curve by 300 basis points. 19.4 10.0 75.0 0 0.0 0.0 19.2 9.8 90.8 1 0.8 0.0I8: Parallel downward shift of the dollar yield curve by 300 basis points. 19.4 10.0 75.0 0 0.0 0.0 19.2 9.8 90.8 1 1.0 0.1I9: Parallel upward shift of the euro yield curve by 200 basis points. 19.3 10.0 75.0 0 0.0 0.0 19.2 9.8 90.8 1 0.8 0.0I10: Parallel downward shift of the euro yield curve by 200 basis points. 19.3 10.0 75.0 0 0.0 0.0 19.2 9.8 90.8 1 1.0 0.1I11: Parallel upward shift of the euro yield curve by 300 basis points. 19.3 10.0 75.0 0 0.0 0.0 19.2 9.8 90.9 1 0.7 0.0I12: Parallel downward shift of the euro yield curve by 300 basis points. 19.3 10.0 75.0 0 0.0 0.0 19.1 9.7 90.7 1 1.1 0.1
FX RiskF1: The pound depreciates by 20 percent against all other currencies. 17.7 8.6 73.4 3 9.6 0.6 17.2 8.3 84.8 1 6.9 0.4F2: The pound appreciates by 20 percent against all other currencies. 20.3 10.4 76.0 0 0.0 0.0 21.3 11.4 96.4 0 0.0 0.0F3: The pound depreciates by 30 percent against all other currencies. 16.5 7.8 72.2 4 43.6 2.5 16.4 7.8 82.1 1 9.3 0.5F4: The pound appreciates by 30 percent against all other currencies. 20.1 10.3 76.5 0 0.0 0.0 22.3 12.2 98.8 0 0.0 0.0F5: The dollar depreciates by 20 percent against all other currencies. 20.8 10.2 75.5 0 0.0 0.0 20.2 10.8 91.7 0 0.0 0.0F6: The dollar appreciates by 20 percent against all other currencies. 17.2 8.5 74.2 2 25.5 1.5 18.1 8.8 89.8 1 5.0 0.3F7: The dollar depreciates by 30 percent against all other currencies. 21.2 9.9 75.6 1 0.3 0.0 20.6 11.2 92.0 0 0.0 0.0F8: The dollar appreciates by 30 percent against all other currencies. 15.9 7.0 73.8 2 48.9 2.8 17.7 8.4 89.2 1 6.7 0.4
Asset Price RiskA1: Prices of all shares listed on foreign stock markets decline by 35 percent. 19.2 8.3 75.0 1 0.2 0.0 19.2 9.8 90.8 1 0.9 0.1A2: Rated securities are downgraded by two notches. 19.0 8.3 74.0 2 4.2 0.2 16.5 8.4 73.8 1 6.6 0.4A3: Rated securities are downgraded by four notches. 18.4 3.2 70.8 2 6.1 0.4 13.8 6.5 53.7 4 79.8 4.6
Credit RiskC1: Doubling of all probabilities of default (PDs) on loans. 19.3 10.0 75.0 0 0.0 0.0 20.2 10.6 93.2 0 0.0 0.0C2: Increase of all probabilities of default (PDs) on loans by 300 Percent. 19.3 10.0 75.0 0 0.0 0.0 19.3 -0.5 93.2 1 38.2 2.2C3: Default of the three largest exposures excluding the parent bank. 15.7 -106.3 75.0 3 244.3 14.2 12.0 -21.6 59.9 6 371.9 21.6C4: 10 percent of banks’ domestic non-interbank bank loan portfolio fails. 19.3 10.0 75.0 0 0.0 0.0 20.6 10.6 93.2 0 0.0 0.0C5: 10 percent of banks’ mortgage loan portfolio fails. 19.1 10.0 75.0 0 0.0 0.0 20.6 10.6 93.2 0 0.0 0.0C6: 10 percent of UK non-interbank loan portfolio fails. 19.2 10.0 75.0 0 0.0 0.0 20.7 10.6 93.2 0 0.0 0.0C7: 10 percent of banks’ claims on their parent banks fail. 7.6 -109.1 69.6 9 749.8 43.6 0.3 -15.0 73.9 13 1,294.1 75.2
Operational RiskO1: Increase of RWAs for operational risk by 50%. … … … … … … 18.6 9.7 84.1 1 1.4 0.1O2: Increase of RWAs for operational risk by 100%. … … … … … … 18.1 9.5 78.3 1 1.9 0.1O3: Increase of RWAs for operational risk by 200%. … … … … … … 17.2 9.3 68.8 1 2.9 0.2
Scenario Analysis (I4 & F3 & A2 & C2 & O2) 15.4 -64.5 73.1 3 66.3 3.9
Sources: GFSC, and IMF staff estimates.1/ The capital and RWA figures used for the top-down tests are the most recent ones and thus slighly different from the ones used for the bottom-up tests.
Bottom-Up Top-Down
In percent In percent
Recapitalization needs
Recapitalization needs
Sources: GFSC; and staff estimates.

19
Credit risk
33. Credit risk is the most important risk type in the Guernsey banking system, constituting about 94 percent of Pillar 1 minimum capital requirements and 92 percent of total capital requirements without including Pillar 2 concentration risk charges. While asset quality is high, reflected in low credit losses in the past, the sheer amount of credit relative to the size of the economy warrants careful monitoring of credit and concentration risks as both risk types are low probability-high impact type risks for the Guernsey banks.
34. Seven scenarios aimed at credit risk in broader terms were run. Five tests were aimed at assessing credit risk in the overall credit portfolio or specific sub-portfolios (Box 2) and two investigated concentration risk (Box 3). Although most banks are currently using the Basel II Standardized Approach, the aim was to investigate credit risk in a risk-sensitive manner. To this end, banks were asked to increase (if available) the probabilities of default (PDs) of all of their counterparts by 100 percent and 300 percent, respectively, and to simulate the effect of the resulting losses on capital using recovery rates of 50 percent. Likewise, PDs of 10 percent were simulated for the most important portfolios of the banks, constituting highly severe stress if compared to the comparably low loss levels observed in the past (see Table 1).
35. The TD tests were constructed along the line of the BU tests, but with the flexibility to add additional dimensions that can (or have) not readily been investigated by the banks in the BU exercises. In the basic TD STs displayed in Table 4, it has been assumed that the banks can use profits as a first line of defense, given their stable source of income. For the simulation of the increase of the PDs, the NPLs14 observed in 2009 (the total NPLs per institutions divided by the total loans) have been used as a baseline scenario, which
14 For the purpose of stress testing, a broad definition of NPLs has been used, namely Watch list (category B according to GSFC classification), substandard loans (Cat. C) and actual losses (Cat. D). Accordingly, the weighted-average NPLs in the system are about 4 times higher than the NPLs one would refer to using a 90 days past due criterion.
Box 2. Credit Risk Shocks 1/
C1: Increase of all PDs of all counterparts by 100 percent. C2: Increase of all PDs of all counterparts by 300 percent. C4: 10 percent of banks’ domestic non-interbank loan portfolio fails. C5: 10 percent of banks’ mortgage loan portfolio fails. C6: 10 percent of banks’ U.K. non-interbank loan portfolio fails. 1/ Test C3 and C7 are part of the concentration risk analysis further outlined below.

20
yields zero percent in some cases.15 The increase of RWAs resulting from an increase in credit risk (i.e., rating downgrades or the increase of PDs as such) has not been considered in order to mirror the analysis done by banks (, i.e., the outcome that would result from using the Basel II Standardized Approach). However, in a follow-up step these dimensions were taken into account in order to arrive at a more comprehensive and robust outcome. The TD tests directed at the asset quality of the overall portfolio displayed in Box 2 are based on the on- and off-balance sheet exposure. Capital requirements include Pillar 1 and Pillar 2 charges, whereby one bank is slightly below the minimum capital requirements (9.8 percent vs. 10 percent) in the pre-shock case.
36. The tests assessing credit risk (without considering concentration) do not suggest that credit risk is a major threat to the Guernsey banks. None of the BU tests suggests a noteworthy adverse impact on capital adequacy, and the TD tests identify risk where PDs increase by 300 percent (C2). In the latter case, recapitalization needs amount to 2.2 percent of GDP with the institution most affected losing its entire capital base. However, there are at least considerations to be taken into account when interpreting the outcome of the tests carried out for credit risk:
As outlined above, credit risk can be characterized as a low probability-high impact risk for the Guernsey system. Although only 6 percent of the assets of the system constitute lending to the real sector, this constitutes almost 400 percent in terms of GDP.
If a bank uses the Basel II Standardized Approach to stress test credit risk, then increasing risk will only be visible once it materializes, at least for exposures that are not externally rated. This is readily visible in the BU tests carried out by the industry, which apparently did not identify the risk arising for at least one bank once PDs go up by 300 percent in the system overall or in a specific bank.16
Various other effects have not yet been taken into account in the TD tests, whereby the actual risk tends to be understated. However, the Pillar 2 capital charges required by the GFSC have been added to the required capital buffer.
37. Hence, it is strongly recommended that authorities work with banks to further improve the sensitivity of bank-internal stress tests in the near future. This work should focus on those that are a part of the ICAAP exercise in order to identify credit risk early on.
15 Loan Loss Provisions have not been subject to this study. However, the decreasing level of provisions in 2009 does not reflect the trend in NPLs, which are increasing. Going forward, the authorities should carefully monitor the development of provisioning in banks.
16 Another possibility is that the TD tests overestimated risk in that particular case, for example if the credit exposure is mostly backed by high value credit risk mitigants (i.e., collateral).

21
Credit risk—concentration risk
38. Because of the Guernsey banks’ upstreaming of deposits to their parent, concentration risk and potential spillovers from parent banks or groups are particularly significant. However, the quantification of this risk by means of STs is relatively challenging given that the linkages to parent banks work in both ways, i.e., constitute a source of strength under ‘normal’ circumstances (for both the parent and the subsidiary or at least for the parent bank), but can also create vulnerabilities in times of stress as evidently shown during the crisis. For the purpose of STs, we assume an adverse scenario, namely that the link to their parent banks and groups might trigger a problem for the banks (Credit Risk test 7—“C7” in Box 3), by assuming that 10 percent of the banks’ claims on their parent fail and that there is no recovery.
Box 3. Tests Assessing Credit Concentration Risk
C3: Default of the three largest exposures excluding parent banks C7: 10 percent of banks’ claims on their parent banks fail.
39. The result of the ST shows that should any parent bank of a Guernsey subsidiary face considerable stress, resulting in a provisioning for 10 percent of the claims on parents, the consequences would be disastrous for the Guernsey banks (see Table 4). Both the BU and the TD tests simulate a shortfall of capital for about half of the institutions (BU: 9; TD: 13), with recapitalization needs amounting to almost the island’s GDP (TD test).
40. As in the other Crown Dependencies, the authorities are well aware of this source of risk. The dilemma is that upstreaming not only constitutes the business model many banks on the island have been following for a long period of time, but also strengthens the institutions in ‘normal’ times. Hence, the challenge is to find ways to allow the banks to go on with their business model while strengthening financial stability at the same time. It is key to monitor the solvency position of the parent banks in rigorous ways, not least by using FSIs related to solvency (such as ratings, CDS spreads KMV EDFs) and liquidity positions (which is more challenging), but particularly also by maintaining well-functioning cooperation with the home supervisor.
41. Another potential source of stress to the banking system arises from other sources of lending concentration to the real sector and other financial sector institutions. These sectors constitute more than 13 percent of the banking system’s assets and more than 10 times the island’s GDP (see Table 2). A potential threat to the solvency of banks through that channel was assessed, simulating the default of the three largest counterparts and assuming a recovery of 50 percent. While this shock is relatively unlikely to happen, it allows the identification of institutions that could be hit in that context and to pro-actively mitigate potential shocks accordingly.

22
42. Both the BU and the TD tests on large exposures suggest that several institutions were vulnerable to a joint default of their largest non-parent counterparts. Recapitalization needs are considerable at up to 14 percent of GDP in the BU test and 3 banks would require recapitalization, compared with 6 banks in the TD case with recapitalization needs of 22 percent of GDP. It is striking that the outcomes of the two tests vary quite considerably. This difference could result from various sources, for example the calculation of the exposure (actual drawn amount in case of facilities or committed amount), in terms of the definition of groups, but also from the lack of information of off-site data on collateral. The mission recommends that the authorities run this test on a regular basis based on conservative definitions of both exposure and connected borrowers. The data used by banks should be readily available to the authorities in order to run meaningful off-site tests (also such as the default of the 3 riskiest exposures among the largest 10 exposures, etc.) and to monitor the banks’ large exposures separately.
Operational risk
43. The tests also simulated a potential stress of operational risk in the system. As many banks make use of the certain management functions of their parents (for example treasury and risk management) and/or tend to outsource certain tasks, this type of risk seems to be highly relevant for the Guernsey banks. In terms of total Pillar 1 capital requirements, Operational Risk constitutes 5 percent, but this figure is based on the use of the Standardized type Basel II approaches (i.e., the Basic Indicator Approach and the Standardized Approach), which does not reflect bank-specific operational risk and tends to decrease in periods of stress (with lower levels of income). Hence, the authorities ask the banks to apply Pillar 2 capital add-ons reflecting the outcome of their ICAAP processes.
44. The tests applied in a TD manner simulate post-shock capital adequacy for an increase of Pillar 1 capital requirements for Operational Risk by 50 percent (O1), 100 percent (O2) and 200 percent (O3) (Box 4). In effect, the test thereby simulates an increase of risk-weighted assets by 7.5 percent, 10 percent and 20 percent, corresponding to a decline of capital adequacy by 7, 13 and 17 percent in relative terms.17 As shown in Table 4, the impact is limited, given the generally high solvency level of the Guernsey banks.
45. In order to account for more bank-specific circumstances, operational risk stress tests should be based on economic models, for example the ones developed for the ICAAP purposes. Operational Risk might then trigger risks for specific banks, at least in scenario-type tests.
17 This follows from the fact that capital requirements for operational risk are 5 percent of Pillar 1 capital requirements on average.

23
Box 4. Tests Assessing Operational Risk
O1: Increase of Pillar 1 Operational Risk Capital Requirements by 50 Percent. O2: Increase of Pillar 1 Operational Risk Capital Requirements by 100 Percent. O3: Increase of Pillar 1 Operational Risk Capital Requirements by 200 Percent.
Scenario analysis 46. Under a combined stress of all risk factors, the Guernsey banking system does again show resilience, but three18 banks fall short of capital under a scenario of medium to high severity, while in all single risk tests (of the ones part of the scenario) it is only one bank at maximum (Table 5). The test combines five of the single risk factor shocks as displayed in Table 5: I419, F3, A2, C2, and O2. The single shocks combined in a scenario are the worst single factor shocks for the interest rate risk and the FX risk, and severe (but not worst-case) shocks for asset prices, credit risk and operational risk. Given the assumption that the single shocks have a linear effect on the combined result, recapitalization needs are only slightly higher than the sum of the shocks in terms of recapitalization needs (as not many banks reach the recapitalization zone). As macroeconomic (or financial market) shocks will usually materialize at the same time (and are therefore visible in all risk factors), the authorities should consider running scenario tests in the future in order to arrive at a comprehensive view on the solvency of the system.
Table 5. Guernsey: Scenario Analysis for Banks Shocks CAR 1/ Min. Max. No.
Banks Breaching Min. CAR
In GBP m In Percent of GDP
Pre-shock capital 18.5 9.8 90.8 1 0.9 0.1
Scenario Analysis (I4 & F3 & A2 & C2 & O2) 15.4 -0.6 73.1 3 66.3 3.9
Recapitalization Needs
In percent
Source: Staff estimates.
Additional tests for credit risk
47. As outlined above, there are several aspects that might not have been sufficiently taken into account as potential triggers of credit risk. In order to avoid potential misleading results (and not recognizing the full scope of credit risk), additional TD tests were
18 The most conservative tests for the interest rate shock has been referred to, recognizing that a downward shift of the pound sterling yield curve by 300 bps is less meaningful at present compared to other times with higher interest rates.
19 If one based the same analysis on the Assumptions 1, 2 and 4 (jointly) outlined below (i.e., on economically more conservative (A1, A2) and meaningful (A4) assumptions), five banks would have to be recapitalized at costs of around GBP 140m under the same scenario.

24
run to test the sensitivity of the solvency of the system against these potential sources of risk (Box 5).
48. The tests are self-explaining and test the solvency of the system while gradually applying four additional assumptions: (i) assuming that there are no profits as a first line of defense; (ii) NPLs for all banks are at least 0.4 percent in the baseline case;20 (iii) NPLs amount to 2 percent for all banks in the baseline case; and (iv) RWAs are simulated to increase proportionally with PDs (i.e., at the same time as losses hit the capital base it is taken into account that the non-defaulted credit portfolio becomes more risky).
Box 5. Additional TD Tests for Credit Risk
Assumption A1: No profits available as a first line of defense. Assumption A2: Average NPLs are assumed to be equal to the maximum of (i) the NPLs of the
2009 average for the system (0.4 Percent) and (ii) the bank-specific level. Assumption A3: NPLs are assumed to be 2 Percent for all banks in the baseline case. Assumption A4: RWAs are assumed to increase by 0.5 times of the relative increase of the PDs. 1/ If PDs were to increase by 50 percent in relative terms, for example, RWAs are assumed to increase by 25 percent in relative terms. This rule of thumb is based on expert judgment.
49. The additional tests carried out for credit risk in different combinations show that the system could lose a material portion of its capital base in the worst case (Table 6). If one simulates the effect of assumptions A1, A2, and A4 becoming true at the same time, then six banks would need recapitalization in case of an increase of all PDs by 100 percent (while no bank would need recapitalization without the assumption) and recapitalization needs would be at 6 percent of GDP. In the most severe case of an increase of PDs by 300 percent, most banks (15 out of 19) would be hit and recapitalization needs would amount to 28 percent of GDP. The mission recommends that the authorities take at least some of the assumptions into account for future STs, depending on the actual stress level of the system at the time the test is run (i.e., their appropriateness at the time of the test). Assumption 4 will inform the authorities how capital adequacy would change in case of using an IRB-type credit risk model and could be part of the ‘standard’ tests.21
50. The additional tests confirm that banks are relatively robust against sector-specific shocks, which could trigger recapitalization needs of around GBP 20 millions in case of a shock affecting the domestic loans (C4) or the banks’ mortgage loan portfolios (C5). Again, regulatory oversight should remain high to avoid an impact of specific
20 If the NPLs for a bank observed in 2009 were below 0.4 percent (the weighted-average NPLs of the banks included in the stress tests according to the broad definition used for stress testing purposes), then 0.4 percent was used as a baseline for the stress tests, otherwise the actual NPL ratio.
21 For specific banks, one might also stress Loss Given Default rates (LGDs), but the baseline assumption of 50% was assumed to be sufficiently conservative for the system overall.

25
institutions (particularly those with lower levels of capitalization) that could trigger contagion. The authorities may also want to consider specific STs for high-risk exposure types, such as structured credit.22
Table 6. Guernsey: Additional Solvency Tests for Credit Risk
Shocks CAR 1/ Min. Max. No. banks breaching min. CAR
In GBP m In Percent of GDP
Pre-shock capital 18.5 9.8 90.8 1 0.9 0.1
A1 (No profits as first defense)C1: Doubling of all probabilities of default (PDs) on loans. 18.8 9.8 90.8 1 0.9 0.1C2: Increase of all probabilities of default (PDs) on loans by 300%. 17.9 -0.8 90.8 2 40.0 2.3C4: 10 percent of banks’ domestic non-interbank bank loan portfolio fails. 19.2 9.8 90.8 1 0.9 0.1C5: 10 percent of banks’ mortgage loan portfolio fails. 19.1 9.8 90.8 1 0.9 0.1C6: 10 percent of UK non-interbank loan portfolio fails. 19.3 9.8 90.8 1 0.9 0.1
A1 + A2 (at least average NPLs for all banks)C1: Doubling of all probabilities of default (PDs) on loans. 18.4 9.4 90.3 1 2.6 0.1C2: Increase of all probabilities of default (PDs) on loans by 300%. 16.8 -0.8 89.3 2 45.0 2.6
A1 + A3 (NPLs amount to 2% for all banks in the baseline case)C1: Doubling of all probabilities of default (PDs) on loans. 16.5 7.5 87.9 1 10.2 0.6C2: Increase of all probabilities of default (PDs) on loans by 300%. 11.2 3.0 82.2 6 246.8 14.3
A1 + A2 + A4 (RWAs increase proportional to PDs)C1: Doubling of all probabilities of default (PDs) on loans. 20.2 10.6 93.2 0 0.0 0.0C2: Increase of all probabilities of default (PDs) on loans by 300%. 19.3 -0.5 93.2 1 38.2 2.2C4: 10 percent of banks’ domestic non-interbank bank loan portfolio fails. 20.6 10.6 93.2 0 0.0 0.0C5: 10 percent of banks’ mortgage loan portfolio fails. 20.6 10.6 93.2 0 0.0 0.0C6: 10 percent of UK non-interbank loan portfolio fails. 20.7 10.6 93.2 0 0.0 0.0Sources: Staff estimates.
Top-DownRecapitalization needs
In percent
E. Results of Liquidity Risk Tests
51. The liquidity ST examined how many days banks could withstand a daily withdrawal of their deposits with no access to additional external funding, including from their parent bank. Given the high importance of the deposits for the banks this test is highly relevant as the risk of a rapid withdrawal of a considerable portion of the deposits within a short period of time is higher than in other banking systems. To this end, the test simulates a severe name crisis, where a bank has to liquidate its assets (but is restricted to its most liquid assets, such as cash, government bonds, interbank loans with a maturity of up to eight days and marketable securities, see below) in order to meet a sudden run on its liabilities. Both bank subsidiaries and foreign branches were included in the exercise.
52. The TD liquidity tests simulate the liquidity position of banks if 30 percent of the (then) remaining deposits are withdrawn during five consecutive days resulting in 83 percent of deposits being withdrawn within a business week. The (implicit cash flow)
22 The mission did not run such tests as the data was not readily available to the mission at the time of the STs.

26
tests simulate a run on deposits assuming that interbank funding remains mostly accessible (L1, see Box 6) and is more or less closed (L2). It is also assumed that no additional intra-group funding is available. The tests were run under two assumptions with respect to the liquidity of the assets: (i) the liquid assets comprise cash and all marketable securities and (ii) all marketable securities except for government bonds become illiquid. The definition of the shocks is summarized in Box 6.
Box 6. Liquidity Risk Shocks
L1: A daily drawdown of liabilities on demand (including fiduciary deposits) and due within one month by 30 percent. Interbank market remains accessible (except for funding with a maturity of more than one month) and no additional intra-group funding is unavailable. There are two scenario with respect to the liquid assets that can be used for fire sales: (i) the liquid assets comprise cash, government bonds, claims to other banks, and other marketable securities; and (ii) all marketable securities except for government bonds become illiquid.
L2: As Test 1, but interbank market more or less closed (except for maturities up to 8 days). There are two scenarios with respect to the liquid assets that can be used for fire sales: (i) the liquid assets comprise cash, government bonds, claims to other banks, and other marketable securities; and (ii) all marketable securities except for government bonds become illiquid.
53. The effects of these severe liquidity STs were found to have a considerable effect on Guernsey banks’ liquidity position, with the upstreaming model followed by banks being the source of the vulnerability (Table 7). Under the slightly less severe first test (L1), seven subsidiaries and two branches would become illiquid during one business week if all marketable securities are liquid, compared to a total of 13 illiquid subsidiaries and 4 branches if the less liquid marketable securities (ii, see above) become illiquid. Under the more severe test (L2), most Guernsey banks would face considerable liquidity risk related stress after 4 days of a deposit run. If one simulates the liquidity position based on a withdrawal of 15 percent only, the vast majority of the Guernsey banks would survive a business week without additional external funding (in case of test L1, i), which can be considered as the critical threshold for the liquidity of the system (conditional on the conservative assumption that parent or groups are not willing to support the Guernsey banks).
54. Given the potential stress arising from liquidity risks, which might occur instantaneously, the mission recommends that the GFSC should ensure that banks report their liquidity positions on a regular basis. Moreover, the GFSC should run TD liquidity risk analysis on a regular basis (if need arises on a daily or weekly basis, otherwise on a monthly basis), supplemented by BU analysis done by banks. For this purpose, data should be made available in an adequate format. In overall terms, it is important to note that as long as the source of a local deposit run is not related to financial vulnerabilities at the

27
group level, strong parental support can mitigate stress at the local level, but the opposite applies as well, which requires attentive monitoring by the authorities.
55. The finding that liquidity risk is highly relevant is in line with the findings for other Crown Dependencies. As there is no central bank that could play the role of a lender of last resort in Guernsey, the authorities should implement best practice on a timely basis (for example the current proposal by the Basel Committee on Banking Supervision once agreed on and/or the liquidity framework introduced by the U.K. FSA). The recently introduced deposit guarantee system is an appropriate response to avoid bank runs triggered by liquidity risk.
Table 7. Guernsey: Liquidity Stress Test for Banks
Sub-sidiaries
Branches Total Sub-sidiaries
Branches Total
Test L1 (interbank funding remains available, no additional intragroup funding)Day 1 0 1 1 0 3 3Day 2 0 1 1 2 3 5Day 3 1 2 3 7 4 11Day 4 3 2 5 10 4 14Day 5 7 2 9 13 4 17
Test L2 (interbank funding essentially closed, no additional intragroup funding)Day 1 0 1 1 3 3 6Day 2 1 2 3 6 4 10Day 3 7 2 9 12 4 16Day 4 11 2 13 15 4 19Day 5 12 3 15 16 5 21
Sources: Staff estimates.
(i) All Marketable Securities are Liquid (as is Cash)
(ii) Only Government Securities Remain Liquid
(and Csh)
Number of illiquid banks Number of illiquid banks
III. INSURANCE SECTOR
56. The insurance sector ST have been defined to be aligned with the banking sector tests as far as possible, with the addition of specific insurance risk stresses. The ST for the insurance sector have been carried out based on a two-step BU exercise:
In 2008, when the IMF visit was originally planned to take place, initial STs were carried out for all insurance companies except for ‘pure captives’ (a total of 134 firms).
28
Recently, the ST have been re-done for a sample of 22 firms for which the 2008 tests have shown to have the most substantial effect—in practice, the systemically important and risk sensitive institutions have been covered.
57. After reviewing the BU results the mission decided not to run TD results, for three main reasons: (i) the available data used for off-site supervision currently do not allow for meaningful TD analysis at this stage; (ii) the most important companies in terms of risk are quite different in terms of their business, making standardized tests challenging to perform; and (iii) the tests show that the capitalization of the system is high and the risks appear to be limited except for specific businesses.
58. In contrast to the tests for the banks, which assessed vulnerabilities over a one year horizon, the insurance tests aim at taking into account the longer term nature of much of the insurance business as well as the importance of assumptions about the behavior of insurance companies and their policyholders in the event of stress. The reason being that the latter bear much of the risk, and that degrees of freedom exist in the allocation of risk.
A. Coverage
59. The stress testing exercise has been carried out in two steps. In 2008, a comprehensive ST exercise was run for all insurance firms except for ‘pure captives’ (134 companies and cells). To account for recent developments in financial markets and to apply stress to the current risk profile of the firms, the 22 firms which have been found to be most sensitive to shocks in the 2008 exercise have been re-assessed for the FSAP Update.23 Table 8 provides an overview of the sector, which consists of 396 firms (including 300 captives), constituting 7 percent of the total assets in the Guernsey financial sector. As shown in the table, the sector has seen a growth in total assets by 50 percent during the last five years, mostly in the life sector, while total gross premiums remained on a similar level during the same period. Moreover, the table shows that some life insurers were hit hard by the financial crisis, with the 2008 aggregate ROE of the life insurance sector becoming negative (mainly driven by one firm that faced losses). In line with the banking sector, there has been some recovery during 2009, but risks remain—reflected in the outcome of the stress tests.
B. Method
60. The results were calculated by each individual company based on guidance from the GFSC and their external adviser. The tests run in 2008 were applied to the end-June 2008 financial reporting data (if available) or the latest available figures otherwise. For the sample of 22 firms that were re-assessed in early 2010 (6 life insurers, one life reinsurer, 23 More specifically, all firms for which the most adverse test carried out in 2008 had resulted in a change of the excess of asset over liabilities of more than 10 percent were included in the 2010 ST sample.

29
2 general reinsurance firms, 7 commercial insurers, 1 mortgage indemnity insurer, and 5 PCC cells) end 2009 data was used for stress testing.
61. In general, a shock can have two effects on the solvency position of an insurance company: an instantaneous change in the value of the company’s assets (i.e., a shock effect represented by capital gains or losses) and a progressive change in the return on the company’s assets (i.e., a flow effect represented by asset income level changes).
62. The outcome of a ST for insurance companies is usually measured in terms of capital adequacy measures: (i) some exercises refer to the changes in companies’ solvency margin (i.e., the ratio of net admissible assets to total liabilities;24) (ii) other tests compare the pre-and post-shock solvency ratio, which is the actual solvency margin relative to the required solvency margin;25 (iii) one may also refer to the pre- and post-shock policy yields. In this study, we refer to the excess of asset over liabilities, the latter including the statutory minimum solvency requirements as defined by GFSC rules, comparing of pre- and post-shock levels, which is along the line of definition (ii).
63. The STs for the insurance sector starts from a rather crude assessment of actual risks. The tests are based on the statutory minimum capital requirements and the valuation of liabilities are not based on market values, which would, in principle, be the case under an economic capital regime. Consequently, the ‘baseline scenario’ may be distorted: while the value of the liabilities tends to be overstated, capital requirements are likely to be understated. Hence, the starting point for the stress test of each firm could overstate or understate its solvency position. Moreover, the method used to determine the impact of a shock on the solvency position could underestimate risk, particularly if crude methods are being applied. Both aspects should be taken into account if one interprets the results of the tests, in order to avoid assuming a false conclusion regarding the stability of the system.
24 The total main liabilities are also referred to as “technical provisions”, i.e., total provisions in case of non-life companies and provisions for guaranteed contracts in the case of life companies.
25 The solvency margin can be compared to the risk-weighted capital adequacy ratio for banks.
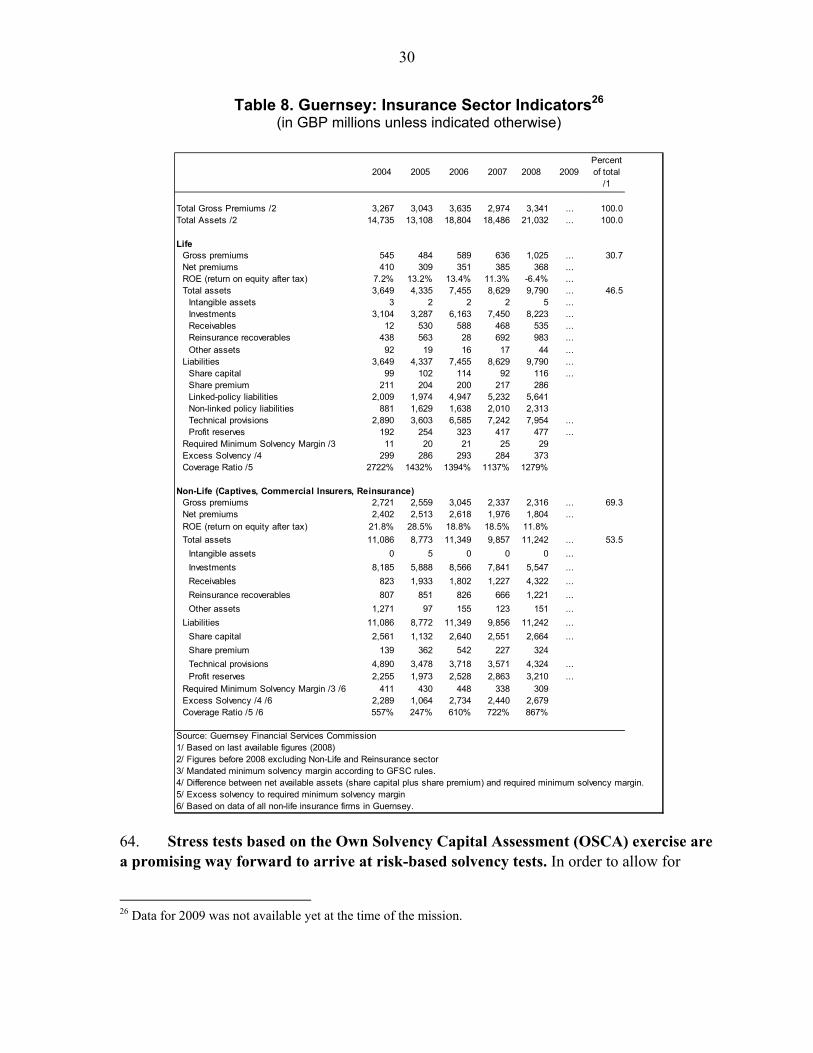
30
Table 8. Guernsey: Insurance Sector Indicators26 (in GBP millions unless indicated otherwise)
2004 2005 2006 2007 2008 2009Percent of total
/1
Total Gross Premiums /2 3,267 3,043 3,635 2,974 3,341 ... 100.0Total Assets /2 14,735 13,108 18,804 18,486 21,032 ... 100.0
LifeGross premiums 545 484 589 636 1,025 ... 30.7Net premiums 410 309 351 385 368 ...ROE (return on equity after tax) 7.2% 13.2% 13.4% 11.3% -6.4% ...Total assets 3,649 4,335 7,455 8,629 9,790 ... 46.5
Intangible assets 3 2 2 2 5 ...Investments 3,104 3,287 6,163 7,450 8,223 ...Receivables 12 530 588 468 535 ...Reinsurance recoverables 438 563 28 692 983 ...Other assets 92 19 16 17 44 ...
Liabilities 3,649 4,337 7,455 8,629 9,790 ...Share capital 99 102 114 92 116 ...Share premium 211 204 200 217 286Linked-policy liabilities 2,009 1,974 4,947 5,232 5,641Non-linked policy liabilities 881 1,629 1,638 2,010 2,313Technical provisions 2,890 3,603 6,585 7,242 7,954 ...Profit reserves 192 254 323 417 477 ...
Required Minimum Solvency Margin /3 11 20 21 25 29Excess Solvency /4 299 286 293 284 373Coverage Ratio /5 2722% 1432% 1394% 1137% 1279%
Non-Life (Captives, Commercial Insurers, Reinsurance)Gross premiums 2,721 2,559 3,045 2,337 2,316 ... 69.3Net premiums 2,402 2,513 2,618 1,976 1,804 ...ROE (return on equity after tax) 21.8% 28.5% 18.8% 18.5% 11.8%
Total assets 11,086 8,773 11,349 9,857 11,242 ... 53.5
Intangible assets 0 5 0 0 0 ...
Investments 8,185 5,888 8,566 7,841 5,547 ...
Receivables 823 1,933 1,802 1,227 4,322 ...
Reinsurance recoverables 807 851 826 666 1,221 ...
Other assets 1,271 97 155 123 151 ...
Liabilities 11,086 8,772 11,349 9,856 11,242 ...
Share capital 2,561 1,132 2,640 2,551 2,664 ...
Share premium 139 362 542 227 324
Technical provisions 4,890 3,478 3,718 3,571 4,324 ...Profit reserves 2,255 1,973 2,528 2,863 3,210 ...
Required Minimum Solvency Margin /3 /6 411 430 448 338 309Excess Solvency /4 /6 2,289 1,064 2,734 2,440 2,679Coverage Ratio /5 /6 557% 247% 610% 722% 867%
Source: Guernsey Financial Services Commission1/ Based on last available figures (2008)2/ Figures before 2008 excluding Non-Life and Reinsurance sector3/ Mandated minimum solvency margin according to GFSC rules.4/ Difference between net available assets (share capital plus share premium) and required minimum solvency margin.5/ Excess solvency to required minimum solvency margin6/ Based on data of all non-life insurance firms in Guernsey.
64. Stress tests based on the Own Solvency Capital Assessment (OSCA) exercise are a promising way forward to arrive at risk-based solvency tests. In order to allow for
26 Data for 2009 was not available yet at the time of the mission.

31
meaningful bottom-up analysis by the GFSC, the tests27 should be designed to ensure consistency of the outcome across institutions. The mission recommends that the authorities put effort into the development of OSCA based BU tests.
C. Metrics and Calibration of Shocks
65. The insurance sector shocks have been designed to parallel the shocks carried out for the banks, with the exception of credit risk and operational risk. While the sector’s exposure to credit risk is relatively low and therefore not material for the purpose of stress testing, operational risk constitutes one of the important risks that should be analyzed in future tests. We considered the effect of an additional capital buffer under stress for operational risks and other insurance risks not covered in the main test by means of a scenario analysis test, which combines the effects of single risk factor tests. In addition, we also implicitly included operational risks when benchmarking the results with the outcome of the OSCA tests.
66. The market risk tests assess the vulnerability of the firms against sudden changes in interest rates, FX rates and asset prices. For the interest rate tests, a parallel shift of the pound sterling yield curve has been simulated (I1-I4). Likewise, the test for foreign exchange rate shocks comprised all sterling pound tests run for the banks (F1-F4). For the asset prices, test A1 to A3 have been assessed together with an assessment of a potential fall of property prices by 20 percent (Box 7).
67. The insurance-specific tests comprise shocks concerning mortality rates, morbidity, longevity and persistency (see Box 7). The choice of the first three tests for life insurers are similar to those ones used in other FSAP exercises, both in terms of the tests and their severity. The tests also include an assessment of persistency risk, which is relevant for the life insurance companies. Persistency risk (i.e. the risk of early termination of contracts) can be driven by changes in equity markets and changes in tax or regulatory requirements. An explicit risk scenario for the reinsurance sector was not included, as it is highly company-specific. The mission recommends that the GFSC simulate the impact of actual losses at maximum historical levels within a scenario type test or to double the worst provision levels observed in the past.28
27 To do so, one could define certain scenarios each firm should run. In addition to that, comparable methods and common solvency measures to determine economic capital needs could be used to run the tests.
28 The latter severity of shock (i.e. simulating a shock twice the historical maximum) has been applied in the FSAP tests for the French insurance sector in 2005 to assess the impact of the occurrence of a natural disaster on the solvency of French reinsurers.

32
D. Results
68. The results of the tests are presented in Table 9: (i) the tests specifications are displayed in column 1; (ii) the number of firms that fall short of excess of assets over liabilities is displayed in column 2; (iii) columns 3 to 6 show the simple average, asset-weighted average as well as the minimum and maximum of the pre- and post-shock coverage ratio. The table displays the outcome for the 15 firms (out of 22) with coverage ratios of less than 200 percent (i.e. for which the test was most meaningful).
69. The ST results confirm that the Guernsey insurance sector exhibits resilience against severe shocks. The reason for that is mainly a result of the sector’s comparably low exposure to risk (a considerable share of unit-linked business, where risks are borne by policyholders and a low share of pure life insurance business) and sound levels of capitalization.
70. Nevertheless, the shocks could hit specific firms. Firstly, the sector shows some exposure to a sudden decline of sterling interest rates, which could not happen at the time of the FSAP mission, but should be monitored as time goes on (Table 9). Secondly, severe asset price shocks could trigger some vulnerability in the system, whereby constant monitoring is warranted in this context. A downgrade of rated securities by four categories would affect the system more severely with two firms becoming undercapitalized, albeit it is unlikely that a shock would yield a downgrade of all securities of an insurer by four rating categories at the same time. In the previous exercise carried out in 2008 for the entire sector (except for pure captives) an appreciation of the pound sterling by 30 percent against all currencies (F3) was also found to have an important effect on the solvency of Guernsey insurers. This effect was not observed this time, so the sector seems to have become resilient against this shock since then (potentially also given the recent depreciation of the pound sterling).
71. Additional risks not explicitly tested were reinsurance risk, operational risk, expense risks and risk resulting from new business. It is important that operational risk is monitored and managed, given that some of the administration of certain life companies is
Box 7. Additional Tests Run for the Insurance Sector
A4: Residential and commercial property prices decline by 20 percent. M1: Mortality: a permanent increase in mortality rates of insured lives (i.e., mortality over
normal prevailing rates) of 25 percent. This shock should only be applied to insured lives (i.e. not to annuitants).
M2: Morbidity: a permanent increase in morbidity rates (i.e., morbidity over normal prevailing rates) of 25 percent.
M3: Longevity: a permanent reduction in annuitant mortality of 25 percent across all current and deferred annuitants. This shock should only be applied to annuitants, i.e., not to insured lives.
M4: Persistency: 30 Percent of policyholders where there is a right to surrender, surrendered their contracts at the date of the investigation.
33
outsourced to entities situated outside the jurisdiction. Also, the management of the majority of the captive insurers and some other insurers and reinsurers is carried out by local licensed insurance managers. Similar to the banks one could assume that operational risk doubles or triples under stress, whereby specific institutions could face challenges in a scenario shock case, particularly if the shock triggered reputational risk. For the reinsurance risk, historical simulations could be used along the line described above. All of these risk types are highly firm-specific, and it is difficult to capture them under a standardized test as was performed in this exercise. Below, we will include them as an aggregate position of potential stress in a scenario analysis as a further point of reference. These risks might materialize over time only, which should be reflected in future stress tests.
72. If one combines the worst29 single factor shocks for each risk category in terms of the average post-shock excess level (I4,F2,A2, and M1) into a scenario assuming an additive linear combined effect, three out of the 22 firms would run short of capital. Given the severity of this shock, the outcome confirms that the system overall appears to be well capitalized on the one hand, but, on the other hand it shows that some institutions could face vulnerabilities in case of highly adverse scenario type shock, which could then yield second-round effects such as contagion (i.e., the default of certain institutions could lead to a knock-on effect). If one added an additional buffer for other risks (most notably operational risk) amounting to 10 percent30 of the economic capital requirements calculated in the OSCA exercises, no additional firm would run short of capital. However, two additional firms would be close to falling short of capital and the system overall would run the risk of going down.
73. Risk-based STs carried out as part of the OSCA exercise show that the same companies identified to be the most vulnerable according to the IMF BU STs are also the ones with the lowest capitalization levels in economic OSCA terms (i.e., based on a non-standardized self-assessment). However, it is important to recognize that economic capital requirements (i.e., OSCA figures) by far exceed the statutory minimum capital requirement levels (for the 2009 stress test sample by 200 percent). This means that the high level of capitalization is lower when compared to the economic capital requirements. Yet, capitalization still remains solid on an overall level, with total OSCA capital requirements at 47 percent of total available capital for the 2009 test sample of 15 firms with the highest risk.
74. The mission recommends that the GFSC further pursue efforts aimed at risk-based stress testing with a view to standardizing the tests (common solvency measure(s), comparable methods used to run the tests, and the scenario definition) in order to
29 Except for the asset price risks, where the most severe scenario was meant for sensitivity analysis only—also to ensure consistency with the shocks carried out for the banks.
30 The figure could be higher for some firms and lower for others, but a level of 10 percent appears to be a fair reference point for an ‘average’ firm.

34
monitor the system in economic terms in a top-down type manner. The process of moving towards risk-based tests should be accompanied by the collection of the pertinent data including FSIs. Overall, these efforts would form a basis to move to a risk based solvency regime (Solvency II or an equivalent framework).

35
Table 9. Guernsey: Stress Test Results for the Insurance Sector (end 2009 Data)
# of firms < 0 perc.
Simple average
Weighted average
Min. Max.
Actual numberPre-shock level 0 32.0 30.6 0.7 173.0Interest Rate Risk
I1: 200 bp parallel upward shift of the sterling yield curve. 0 32.2 30.6 0.9 173.0I2: 200 bp parallel downward shift of the sterling yield curve. 1 30.9 30.6 -3.0 173.0I3: 300 bp parallel upward shift of the sterling yield curve. 0 32.0 30.3 1.0 173.0I4: 300 bp parallel downward shift of the sterling yield curve. 2 30.4 30.3 -9.2 173.0
FX RiskF1: 20% pound appreciation against all other currencies. 0 32.2 32.0 0.8 179.6F2: 20% pound depreciation against all other currencies. 0 32.1 29.6 0.9 173.0F3: 30% pound appreciation against all other currencies. 0 35.2 32.7 0.8 183.4F4: 30% pound depreciation against all other currencies. 0 34.9 29.1 0.9 173.0
Asset Price RiskA1: 35% price decline of shares on foreign stock markets. 1 34.2 30.8 -5.9 173.0A2: Rated securities are downgraded by two categories. 0 34.4 29.9 0.8 173.0A3: Rated securities are downgraded by four categories. 2 32.6 28.1 -7.4 173.0A4: Residential and commercial real estate prices decline by 20%. 0 37.7 30.6 1.9 173.0
Insurance RiskM1: Permanent 25 % increase in mortality rates of insured lives. 0 34.8 30.6 0.9 173.0M2: Permanent 25 % increase in morbidity rates. 0 37.7 30.6 1.9 173.0M3: Permanent 25 % in annuitant mortality rates. 0 37.3 30.5 1.9 173.0M4: Persistence: 30% percent of all policyholders suddenly exercise their option to terminate their contracts early and withdraw their funds. 0 36.8 34.2 1.9 173.0
Scenario Analysis (I4 & F2 & A2 & M1) 3 24.5 28.5 -31.1 173.0Scenario Analysis (I4 & F2 & A2 & M1 & Buffer for other risks) 3 23.7 27.3 -31.9 173.0
In percent
Excess of Asset over Liabilities