gsa data repository 2014276 rinterknecht et al. gsa data repository 2014276 rinterknecht et al....
TRANSCRIPT

1
GSA DATA REPOSITORY 2014276 Rinterknecht et al.
Unstable ice stream in Greenland during the Younger Dryas cold event
Vincent Rinterknecht, Vincent Jomelli, Daniel Brunstein, Vincent Favier, Valérie Masson-Delmotte, Didier Bourlès, Laëtitia Leanni, Romain Schläppy
10Be dating
Samples from erratic crystalline boulders come from sites proximal to the Pjetursson’s Moraine (n = 6) and from the top of the Pjetursson’s Moraine (n = 1) (Fig. DR1). All samples were collected with a manual jackhammer to leave minimal visible impact. The crystalline lithology of the seven boulders is gneissic, which is a quartz-rich lithology suitable for surface exposure dating using cosmogenic 10Be (Table DR1). We sampled erratic boulders ranging between 1 and 7 m3 selecting the best candidates for surface exposure dating (Fig. DR2). Horizontal or near horizontal surfaces were sampled to avoid sample geometry corrections. Geographic positions and elevations were recorded with a handheld GPS. Shielding of all sampled surfaces by surrounding hills was recorded with a clinometer and compass. Samples were collected at elevations above the maximum local marine limit, which is 90 m in the southern and southeastern parts of Disko Island (Ingólfsson et al., 1990).
Samples were crushed and sieved. The 0.25 to 1 mm quartz fraction was decontaminated by successive acid leaching (HCl+H2SiF6 then dilute HF). Purified quartz was spiked with 100 µl of a 3025 ppm home-made carrier then dissolved in 48% HF. Beryllium was complexed by acetyl acetone in a 50% EDTA solution then extracted using solvent extraction. Beryllium hydroxides were dried and oxidized at 800°C to BeO. Beryllium oxide was mixed with 325 mesh niobium powder prior to measurement at ASTER, the French AMS located at CEREGE, Aix en Provence. Data were calibrated directly against the National Institute of Standards and Technology standard reference material 4325 by using an assigned 10Be/9Be ratio of (2.79 ± 0.03) × 10−11 (Nishiizumi et al., 2007) and a 10Be half-life of (1.36 ± 0.07) × 106 years (Chmeleff et al., 2010; Korschinek et al., 2010). Analytical uncertainties (reported as 1 sigma) include a conservative 0.5% uncertainty based on long-term measurements of standards, a 1 sigma statistical error on counted 10Be events, and the uncertainty associated with the chemical and analytical blank correction (associated 10Be/9Be blank ratio was 9.5 ×10⁻¹⁶).
In order to determine surface exposure ages from the 10Be concentrations measured in the quartz fractions, we calculated the exposure ages using the CRONUS-Earth online calculator (Balco et al., 2008) and the calibration data set from Young et al. (2013b). The use of alternative local 10Be production rates (Balco et al., 2009; Briner et al., 2012) does not significantly modify the exposure ages nor therefore our conclusions.
The production rates of cosmogenically produced isotopes such as 10Be are affected by the altitude and latitude of the sample site, as well as the variation of the geomagnetic field at the sample location. The CRONUS-Earth online 10Be exposure age calculator (http://hess.ess.washington.edu/math/) calculates surface exposure ages using four different

2
scaling schemes summarizing the main attempts to correct for these effects (Balco et al., 2008). The use of these alternative scaling schemes results in 10Be age difference of < 2% and do not affect the overall 10Be chronology for the region as all ages were calculated using the same scaling scheme. We report here the exposure ages calculated with the “Lm” scaling scheme (Table DR1). The “Lm” method provides the closest fit to existing calibration data and uses the scaling factors proposed by (Lal, 1991) and (Stone, 2000), and is further accommodated for paleomagnetic corrections following the description of Nishiizumi (1989). As such, we think that the exposure ages calculated with this scaling method (Lm) represent the best age estimation of the samples’ exposure. We interpret these exposure ages as minimum ages and use them as the basis for our discussion. We correct the production rate for sample thickness using an exponential function (Lal, 1991) and assuming a density of 2.7 g cm-3 for gneiss. The production rates could be further affected by intermittent snow cover, vegetation cover, and erosion rate. We do not apply any corrections for snow cover as the sampling sites are located in an open and windswept area. Furthermore, no significant vegetation (e.g. forest) is present at these latitudes and thus no correction for vegetation cover was necessary. The surfaces of the sampled boulders show evidence of glacial polish, a sign that erosion was minimal if any, since deposition. The 10Be ages are thus not corrected for erosion. Because of the elevation dependence of the 10Be production rate we must account for the elevation variation through time as a consequence of glacio-isostatic uplift and sea-level depression. Disko Island has been undergoing post-deglacial isostatic rebound, with modern lithosphere responses ranging from 90 m on the southern and southeastern coast to 60 m on the northwestern coast (Ingólfsson et al., 1990). We used the local sea level record of isostatic uplift (Ingólfsson et al., 1990) and far-field records of sea level rise (Bard et al., 1996; Bard et al., 1990; Fleming et al., 1998) to derive the integrated change in production rate experienced by our samples as a result of post-glacial uplift. We corrected for as much as 190 m of uplift in the sampling area and the production rate was lowered by as much a 5% (sample DIS-LM03). A Shapiro-Wilk test indicates that we cannot reject the normality assumption (W = 0.94, p-value = 0.67) for the distribution of the seven exposure ages. Since the observed variability (7%) is less than our analytical uncertainties (average 9%, with a range between 6 and 14%), we report the error-weighted mean age and the error-weighted mean of the analytical uncertainty (3%): 12.2 ± 0.4 10Be ka. When including in quadrature the error associated with the 10Be production rate, we calculate a moraine age of 12.2 ± 0.6 10Be ka. Published 10Be ages We summarized the data set of 10Be ages existing for the Disko Bugt area (Table DR3). All ages were recalculated using the same method and production rate (Baffin Bay: 3.96 ± 0.15 atoms g-1 a-1) (Young et al., 2013b) including the samples from Kelley et al. (2013). However, some exposure ages do not take into account the post-glacial isostatic uplift effect on the production rate. This effect can introduce a 2 to 5% decrease of the production rate depending on the method used to account for the lithospheric rebound and sea level rise effect (Young et al., 2013a). The resultant exposure ages could thus be 2 to 5% older but the

3
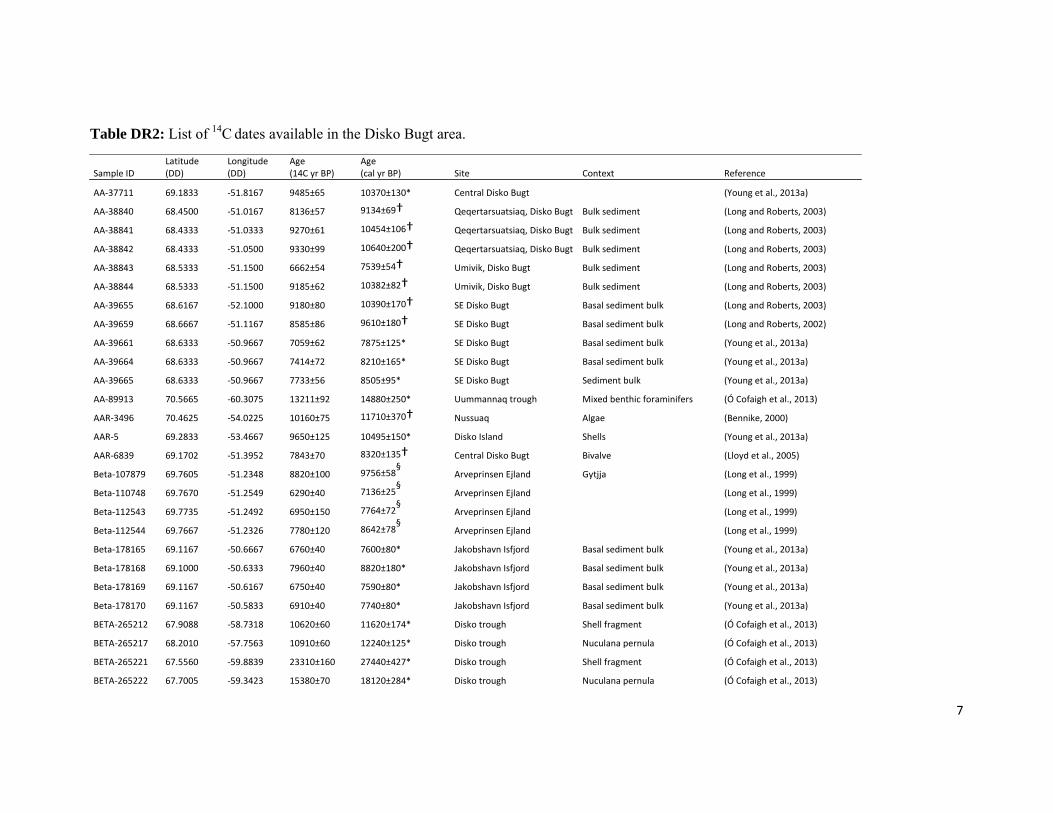
difference does not affect the relative chronology and our interpretation of the deglaciation of Disko Bugt. Published 14C ages Most radiocarbon ages were calibrated using the CALIB06 (http://calib.qub.ac.uk/calib/) (Stuiver et al., 2010) with the INTCAL09 calibration curve (Reimer et al., 2009). Some radiocarbon ages were calibrated using earlier versions of the CALIB program (see footnote Table DR2). All ages discussed in our paper were calibrated using CALIB06 and MARINE09 with a ΔR of 140 years. Supplementary References Balco, G., Briner, J., Finkel, R. C., Rayburn, J. A., Ridge, J. C., and Schaefer, J. M., 2009,
Regional beryllium-10 production rate calibration for late-glacial northeastern North America: Quaternary Geochronology, v. 4, no. 2, p. 93-107.
Balco, G., Stone, J. O., Lifton, N. A., and Dunai, T. J., 2008, A complete and easily accessible means of calculating surface exposure ages or erosion rates from 10Be and 26Al measurements: Quaternary Geochronology, v. 3, p. 174-195.
Bard, E., Hamelin, B., Arnold, M., Montaggioni, L., Cabioch, G., Faure, G., and Rougerie, F., 1996, Deglacial sea-level record from Tahiti corals and the timing of global meltwater discharge: Nature, v. 382, p. 241-244.
Bard, E., Hamelin, B., and Fairbanks, R. G., 1990, U-Th ages obtained by mass spectrometry in corals from Barbados: sea level during the past 130000 years: Nature, v. 346, p. 456-458.
Bennike, O., 2000, Palaeoecological studies of Holocene lake sediments from west Greenland: Palaeogeography, Palaeoclimatology, Palaeoecology, v. 155, no. 3–4, p. 285-304.
Briner, J. P., Young, N. E., Goehring, B. M., and Schaefer, J. M., 2012, Constraining Holocene 10Be production rates in Greenland: Journal of Quaternary Science, v. 27, no. 1, p. 2-6.
Chmeleff, J., von Blanckenburg, F., Kossert, K., and Jakob, D., 2010, Determination of the 10Be half-life by multicollector ICP-MS and liquid scintillation counting: Nuclear Instruments and Methods in Physics Research Section B: Beam Interactions with Materials and Atoms, v. 268, no. 2, p. 192-199.
Corbett, L. B., Young, N. E., Bierman, P. R., Briner, J. P., Neumann, T. A., Rood, D. H., and Graly, J. A., 2011, Paired bedrock and boulder 10Be concentrations resulting from early Holocene ice retreat near Jakobshavn Isfjord, western Greenland: Quaternary Science Reviews, v. 30, no. 13–14, p. 1739-1749.
Fleming, K., Johnston, P., Zwartz, D., Yokoyama, Y., Lambeck, K., and Chappell, J., 1998, Refining the eustatic sea-level curve since the Last Glacial Maximum using far- and intermediate-field sites: Earth and Planetary Science Letters, v. 163, p. 327-342.
Ingólfsson, O., Frich, P., Funder, S., and Humlum, O., 1990, Paleoclimatic implications of an early Holocene glacier advance on Disko Island, West Greenland: Boreas, v. 19, no. 4, p. 297-311.
Jennings, A. E., Walton, M. E., Ó Cofaigh, C., Kilfeather, A., Andrews, J. T., Ortiz, J. D., De Vernal, A., and Dowdeswell, J. A., 2014, Paleoenvironments during Younger Dryas-Early Holocene retreat of the Greenland Ice Sheet from outer Disko Trough, central west Greenland: Journal of Quaternary Science, v. 29, no. 1, p. 27-40.

4
Kelley, S. E., Briner, J. P., and Young, N. E., 2013, Rapid ice retreat in Disko Bugt supported by 10Be dating of the last recession of the western Greenland Ice Sheet: Quaternary Science Reviews, v. 82, p. 13-22.
Korschinek, G., Bergmaier, A., Faestermann, T., Gerstmann, U. C., Knie, K., Rugel, G., Wallner, A., Dillmann, I., Dollinger, G., and von Gostomski, C. L., 2010, A new value for the half-life of 10Be by Heavy-Ion Elastic Recoil Detection and liquid scintillation counting: Nuclear Instruments and Methods in Physics Research Section B: Beam Interactions with Materials and Atoms, v. 268, no. 2, p. 187-191.
Lal, D., 1991, Cosmic ray labeling of erosion surfaces: in situ nuclide production rates and erosion models: Earth and Planetary Science Letters, v. 104, p. 424-439.
Lloyd, J. M., Park, L. A., Kuijpers, A., and Moros, M., 2005, Early Holocene palaeoceanography and deglacial chronology of Disko Bugt, West Greenland: Quaternary Science Reviews, v. 24, no. 14–15, p. 1741-1755.
Long, A. J., and Roberts, D. H., 2002, A revised chronology for the ‘Fjord Stade’ moraine in Disko Bugt, west Greenland: Journal of Quaternary Science, v. 17, no. 5-6, p. 561-579.
Long, A. J., and Roberts, D. H., 2003, Late Weichselian deglacial history of Disko Bugt, West Greenland, and the dynamics of the Jakobshavns Isbrae ice stream: Boreas, v. 32, no. 1, p. 208-226.
Long, A. J., Roberts, D. H., and Wright, M. R., 1999, Isolation basin stratigraphy and Holocene relative sea-level change on Arveprinsen Ejland, Disko Bugt, West Greenland: Journal of Quaternary Science, v. 14, no. 4, p. 323-345.
McCarthy, D. J., 2011, Late Quaternary Ice-Ocean Interactions in Central West Greenland.: Durham, Available at Durham E-Theses Online p.
Nishiizumi, K., Imamura, M., Caffee, M. W., Southon, J. R., Finkel, R. C., and McAninch, J., 2007, Absolute Calibration of 10Be AMS Standards: Nuclear Instruments and Methods in Physics Research B, v. 258, p. 403-413.
Nishiizumi, K., Winterer, E. L., Kohl, C. P., Klein, J., Middleton, R., Lal, D., and Arnold, J. R., 1989, Cosmic ray production rates of 10Be and 26Al in quartz from glacially polished rocks: Journal of Geophysical Research, v. 94, p. 17907-17915.
Ó Cofaigh, C., Dowdeswell, J. A., Jennings, A. E., Hogan, K. A., Kilfeather, A., Hiemstra, J. F., Noormets, R., Evans, J., McCarthy, D. J., Andrews, J. T., Lloyd, J. M., and Moros, M., 2013, An extensive and dynamic ice sheet on the West Greenland shelf during the last glacial cycle: Geology, v. 41, no. 2, p. 219-222.
Perner, K., Moros, M., Snowball, I. A. N., Lloyd, J. M., Kuijpers, A., and Richter, T., 2013, Establishment of modern circulation pattern at c. 6000 cal a BP in Disko Bugt, central West Greenland: opening of the Vaigat Strait: Journal of Quaternary Science, v. 28, no. 5, p. 480-489.
Reimer, P. J., Baillie, M. G. L., Bard, E., Bayliss, A., Beck, J. W., Blackwell, P. G., Bronk Ramsey, C., Buck, C. E., Burr, G. S., Edwards, R. L., Friedrich, M., Grootes, P. M., Guilderson, T. P., Hajdas, I., Heaton, T. J., Hogg, A. G., Hughen, K. A., Kaiser, K. F., Kromer, B., McCormac, F. G., Manning, S. W., Reimer, R. W., Richards, D. A., Southon, J. R., Talamo, S., Turney, C. S. M., van der Plicht, J., and Weyhenmeyer, C. E., 2009, IntCal09 and Marine09 Radiocarbon Age Calibration Curves, 0–50,000 Years cal BP: Radiocarbon, v. 51, p. 1111-1150.
Roberts, D. H., Rea, B. R., Lane, T. P., Schnabel, C., and Rodés, A., 2013, New constraints on Greenland ice sheet dynamics during the last glacial cycle: Evidence from the Uummannaq ice stream system: Journal of Geophysical Research: Earth Surface, v. 118, no. 2, p. 519-541.

5
Stone, J., 2000, Air pressure and cosmogenic isotope production: Journal of Geophysical Research, v. 105, no. b10, p. 23753-23759.
Stuiver, M., Reimer, P. J., and Reimer, R. W., 2010, CALIB 6.0 WWW program and documentation. Avaialble at http://calib.qub.ac.uk/calib/.
Van der Veen, C. J., 1999, Fundamentals of Glacier Dynamics, Rotterdam, Balkema, 462 p.: Young, N. E., Briner, J. P., Axford, Y., Csatho, B., Babonis, G. S., Rood, D. H., and Finkel,
R. C., 2011a, Response of a marine-terminating Greenland outlet glacier to abrupt cooling 8200 and 9300 years ago: Geophysical Research Letters, v. 38, no. 24, p. L24701.
Young, N. E., Briner, J. P., Rood, D. H., Finkel, R. C., Corbett, L. B., and Bierman, P. R., 2013a, Age of the Fjord Stade moraines in the Disko Bugt region, western Greenland, and the 9.3 and 8.2 ka cooling events: Quaternary Science Reviews, v. 60, no. 0, p. 76-90.
Young, N. E., Briner, J. P., Stewart, H. A. M., Axford, Y., Csatho, B., Rood, D. H., and Finkel, R. C., 2011b, Response of Jakobshavn Isbrae, Greenland, to Holocene climate change: Geology, v. 39, p. 131-134.
Young, N. E., Schaefer, J. M., Briner, J. P., and Goehring, B. M., 2013b, A 10Be production-rate calibration for the Arctic: Journal of Quaternary Science, v. 28, no. 5, p. 515-526.

Table DR1: Pjetursson’s Moraine 10Be sample characteristics
Sample Latitude Longitude Elevation Thickness Shielding Quartz 9Be carrier 10Be/9Be † 10Be/9Be 10Be agesname (DD) (DD) (m asl) (cm) correction dissolved (g) added (mg)* uncertainty § (ka)#
DIS-GM01 69.2683 -53.4841 82 1.5 0.997 18.46 100 4.75E-14 6.69E-15 12.0 ± 1.7 DIS-GM02 69.2671 -53.4755 98 1.0 0.991 11.62 100 3.27E-14 3.08E-15 12.9 ± 1.2 DIS-GM03 69.2670 -53.4764 98 1.5 0.997 26.15 100 6.52E-14 4.87E-15 11.4 ± 0.9 DIS-GM04 69.2663 -53.4778 97 1.5 0.997 27.81 101 8.60E-14 1.18E-14 14.2 ± 1.9 DIS-GM05 69.2645 -53.4810 93 2.0 0.997 20.73 101 5.68E-14 3.51E-15 12.7 ± 0.8 DIS-GM06 69.2644 53.4853 74 1.5 0.997 15.58 101 4.13E-14 3.21E-15 12.5 ± 1.0 DIS-LM03 69.2736 -53.4754 132 1.0 0.996 14.95 101 4.11E-14 2.81E-15 12.1 ± 0.8
* All samples were spike with 3025 μg/g 9Be carrier.† All samples measured at the ASTER facility. AMS results are standardized to NIST_27900. § Analytical uncertainties (reported as 1σ) include a conservative 0.5% uncertainty based on long-term measurements of standards, a 1σ
statistical error on counted 10Be events, and the uncertainty associated with the chemical and analytical blank correction (the process blank 10Be/9Be value is 9.5 × 10⁻¹⁶).# All ages calculated using the developmental version of the CRONUS-Earth online 10Be exposure age calculator version 2.2-cal-dev for the NENA production rate (http://hess.ess.washington.edu/math/al_be_v22/Age_input_NENA_calib.html) All ages calculated using a time-dependent production rate model scaled for sample site specific post-glacial uplift andaccording to the Lal (1991)/Stone (2000) scaling scheme (Lm). A standard atmosphere was used. No erosion and no snow cover were accounted for. A rock density of 2.7 g cm-3 was used
7
Table DR2: List of 14C dates available in the Disko Bugt area.
Sample ID Latitude (DD)
Longitude (DD)
Age (14C yr BP)
Age(cal yr BP) Site Context Reference
AA‐37711 69.1833 ‐51.8167 9485±65 10370±130* Central Disko Bugt (Young et al., 2013a)
AA‐38840 68.4500 ‐51.0167 8136±57 9134±69† Qeqertarsuatsiaq, Disko Bugt Bulk sediment (Long and Roberts, 2003)
AA‐38841 68.4333 ‐51.0333 9270±61 10454±106† Qeqertarsuatsiaq, Disko Bugt Bulk sediment (Long and Roberts, 2003)
AA‐38842 68.4333 ‐51.0500 9330±99 10640±200† Qeqertarsuatsiaq, Disko Bugt Bulk sediment (Long and Roberts, 2003)
AA‐38843 68.5333 ‐51.1500 6662±54 7539±54† Umivik, Disko Bugt Bulk sediment (Long and Roberts, 2003)
AA‐38844 68.5333 ‐51.1500 9185±62 10382±82† Umivik, Disko Bugt Bulk sediment (Long and Roberts, 2003)
AA‐39655 68.6167 ‐52.1000 9180±80 10390±170† SE Disko Bugt Basal sediment bulk (Long and Roberts, 2003)
AA‐39659 68.6667 ‐51.1167 8585±86 9610±180† SE Disko Bugt Basal sediment bulk (Long and Roberts, 2002)
AA‐39661 68.6333 ‐50.9667 7059±62 7875±125* SE Disko Bugt Basal sediment bulk (Young et al., 2013a)
AA‐39664 68.6333 ‐50.9667 7414±72 8210±165* SE Disko Bugt Basal sediment bulk (Young et al., 2013a)
AA‐39665 68.6333 ‐50.9667 7733±56 8505±95* SE Disko Bugt Sediment bulk (Young et al., 2013a)
AA‐89913 70.5665 ‐60.3075 13211±92 14880±250* Uummannaq trough Mixed benthic foraminifers (Ó Cofaigh et al., 2013)
AAR‐3496 70.4625 ‐54.0225 10160±75 11710±370† Nussuaq Algae (Bennike, 2000)
AAR‐5 69.2833 ‐53.4667 9650±125 10495±150* Disko Island Shells (Young et al., 2013a)
AAR‐6839 69.1702 ‐51.3952 7843±70 8320±135† Central Disko Bugt Bivalve (Lloyd et al., 2005)
Beta‐107879 69.7605 ‐51.2348 8820±100 9756±58§ Arveprinsen Ejland Gytjja (Long et al., 1999)
Beta‐110748 69.7670 ‐51.2549 6290±40 7136±25§ Arveprinsen Ejland (Long et al., 1999)
Beta‐112543 69.7735 ‐51.2492 6950±150 7764±72§ Arveprinsen Ejland (Long et al., 1999)
Beta‐112544 69.7667 ‐51.2326 7780±120 8642±78§ Arveprinsen Ejland (Long et al., 1999)
Beta‐178165 69.1167 ‐50.6667 6760±40 7600±80* Jakobshavn Isfjord Basal sediment bulk (Young et al., 2013a)
Beta‐178168 69.1000 ‐50.6333 7960±40 8820±180* Jakobshavn Isfjord Basal sediment bulk (Young et al., 2013a)
Beta‐178169 69.1167 ‐50.6167 6750±40 7590±80* Jakobshavn Isfjord Basal sediment bulk (Young et al., 2013a)
Beta‐178170 69.1167 ‐50.5833 6910±40 7740±80* Jakobshavn Isfjord Basal sediment bulk (Young et al., 2013a)
BETA‐265212 67.9088 ‐58.7318 10620±60 11620±174* Disko trough Shell fragment (Ó Cofaigh et al., 2013)
BETA‐265217 68.2010 ‐57.7563 10910±60 12240±125* Disko trough Nuculana pernula (Ó Cofaigh et al., 2013)
BETA‐265221 67.5560 ‐59.8839 23310±160 27440±427* Disko trough Shell fragment (Ó Cofaigh et al., 2013)
BETA‐265222 67.7005 ‐59.3423 15380±70 18120±284* Disko trough Nuculana pernula (Ó Cofaigh et al., 2013)

8
CURL‐10090 69.3167 ‐50.1833 6290±15 7210±40* Jakobshavn Isfjord Basal sediment macrofossil (Young et al., 2013a)
CURL‐10441 69.2333 ‐50.0333 6360±25 7300±120* Jakobshavn Isfjord Basal sediment macrofossil (Young et al., 2013a)
CURL‐11061 69.1000 ‐51.0333 8180±25 9140±110* Jakobshavn Isfjord Plant macrofossils (Young et al., 2013a)
CURL‐11141 68.9667 ‐50.0667 7040±20 7520±55* Jakobshavn Isfjord Hiatella arctica (Young et al., 2013a)
CURL‐11374 69.1000 ‐51.0333 8210±20 9150±120* Jakobshavn Isfjord Plant macrofossils (Young et al., 2013a)
CURL‐11376 69.1000 ‐51.0333 8225±20 9190±100* Jakobshavn Isfjord Plant macrofossils (Young et al., 2013a)
CURL‐12594 69.1000 ‐51.0333 8245±20 9210±80* Jakobshavn Isfjord plant macrofossils (Young et al., 2013a)
CURL‐12603 69.2333 ‐50.0333 6185±15 7090±80* Jakobshavn Isfjord (Young et al., 2013a)
CURL‐12693 68.6333 ‐50.9667 6975±25 7825±100* SE Disko Bugt Plant macrofossils (Young et al., 2013a)
CURL‐12698 68.6333 ‐50.9667 7030±25 7865±70* SE Disko Bugt Plant macrofossils (Young et al., 2013a)
HEL‐2210 69.3000 ‐53.2500 9060±120 10010±108§ Ippik Shells (Long et al., 1999)
HEL‐362 68.6000 ‐53.5667 8970±170 9970±193§ Kannala Shells (Long et al., 1999)
Hel‐369 68.6167 ‐50.8500 7210±170 8035±325* SE Disko Bugt Raised marine deposits (Young et al., 2013a)
I‐16390 70.2333 ‐54.7833 9200±150 10205±217* Illorpaat Shells (Long et al., 1999)
I‐16393 70.2667 ‐54.6167 9920±150 11010±346* Niaqussat Shells (Long et al., 1999)
K‐1818 69.0000 ‐51.0000 8630±130 9790±370* Jakobshavn Isfjord Raised marine deposits (Young et al., 2013a)
K‐2022 69.0500 ‐51.1333 7690±120 8800±340* Jakobshavn Isfjord Marine seds (Young et al., 2013a)
K‐2023 69.0167 ‐51.1333 8680±135 9820±340* Jakobshavn Isfjord Raised marine deposits (Young et al., 2013a)
K‐3660 69.6667 ‐52.0000 8700±120 9650±129§ Aqajarua Shells (Long et al., 1999)
K‐3664 69.7333 ‐51.4000 8760±125 9757±131§ Appat Shells (Long et al., 1999)
K‐3667 69.6667 ‐52.0167 8950±125 9960±157§ Aqajarua Gytjja (Long et al., 1999)
K‐4567 69.3000 ‐53.2500 9220±130 10220±144§ Ippik Shells (Long et al., 1999)
K‐5133 68.4333 ‐52.9500 11320±140 13230±159§ Qeqertarssuatsiaq Gytjja (Long et al., 1999)
K‐5510 70.0500 ‐54.7500 9350±100 10330±189§ Inussuup Kua Shells (Long et al., 1999)
K‐992 69.0333 ‐51.0167 7110±140 7930±270* Jakobshavn Isfjord marine seds (Young et al., 2013a)
K‐993 68.9333 ‐50.9667 7650±140 8570±400* Jakobshavn Isfjord marine seds (Young et al., 2013a)
K‐994 70.0667 ‐52.1000 8940±170 9950±198§ Saqqaq Shells (Long et al., 1999)
KIA‐23028 69.4833 ‐50.7000 6810±40 7660±40* Pekitsoq Basal sediment bulk (Young et al., 2013a)
LU‐3037 70.1667 ‐54.8333 9360±140 10360±219§ Hammer Dal Shells (Long et al., 1999)
LU‐3041 69.7333 ‐54.8333 9060±90 10010±97§ Ivisaarqut Shells (Long et al., 1999)

9
OS‐85087 68.6167 ‐50.9500 7220±40 8060±100* SE Disko Bugt Plant macrofossils (Young et al., 2013a)
AA84714 68.6092 ‐55.3265 10545±45 11480±65* Egedesminde Dyb Macoma calcarea (Jennings et al., 2014)
RCD‐21 68.9833 ‐53.3167 8690±90 9620±111§ Nunarssuaq Shells (Long et al., 1999)
Ua‐1086 69.2000 ‐51.0667 8795±130 9470±350* Jakobshavn Isfjord Raised marine deposits (Young et al., 2011b)
UA‐1789 70.3833 ‐54.9500 10470±130 12390±190§ Talerua Shells (Long et al., 1999)
Ua‐4573 68.9333 ‐50.8833 8215±80 8750±220* Jakobshavn Isfjord Marine seds (Young et al., 2013a)
Ua‐4574 69.0000 ‐50.9667 9180±75 9950±230* Jakobshavn Isfjord Raised marine deposits (Young et al., 2013a)
Ua‐4575 69.0333 ‐50.9333 8140±95 8670±260* Jakobshavn Isfjord Marine seds (Young et al., 2013a)
Poz‐30991 68.3973 ‐55.1297 10840±60 12072±133* Jakobshavn Isfjord Mollusc (Portlandia arctica) (McCarthy, 2011)
LuS 9708 68.4719 ‐54.0020 9455±90 10130±131* Jakobshavn Isfjord Mix benthic foraminifera (Perner et al., 2013)
LuS 9921 68.9679 ‐53.1851 8085±80 8417.5±89* Egedesminde Dyb Mix benthic foraminifera (Perner et al., 2013)
AA82363 70.2196 ‐53.0532 2352±37 1807±44* Vaigat Strait Turitella polaris (Perner et al., 2013)
LuS 8547 70.8159 ‐56.8483 8340±70 8714±127* Uummannaq Trough Mix benthic foraminifera (Perner et al., 2013)
* Calibrated using CALIB06 and INTCAL09 or MARINE09 † Calibrated using CALIB04 § Calibrated using CALIB03

10
Table DR3: List of available 10Be dates in the Disko Bugt area
Sample Latitude Longitude Elevation Thickness Density Shielding [Be-10] Error in [Be-10] Name of Be-10 Be-10 age Reference
name (DD) (DD) (m) (cm) (g cm-3) correction (atoms g-1) (atoms g-1) standardization (ka)†
DISKO-01 69.2624 -53.5521 150* 3.0 2.65 0.992 4.84E+04 9.12E+02 07KNSTD 9.9 ± 0.2 (Kelley et al.,2013)
DISKO-02 69.2621 -53.5508 153* 3.0 2.65 0.992 4.92E+04 9.47E+02 07KNSTD 10.0 ± 0.2 (Kelley et al.,2013)
DISKO-03 69.2637 -53.5548 173* 3.0 2.65 0.992 4.32E+04 8.30E+02 07KNSTD 8.6 ± 0.2 (Kelley et al.,2013)
KE-11-01 68.9845 -53.3337 89* 3.0 2.65 1.000 5.36E+04 2.89E+03 07KNSTD 11.6 ± 0.6 (Kelley et al.,2013)
KE-11-02 68.9843 -53.3337 87* 1.0 2.65 1.000 5.00E+04 1.04E+03 07KNSTD 10.7 ± 0.2 (Kelley et al.,2013)
QA-11-05 68.8473 -51.1676 195* 2.5 2.65 1.000 5.08E+04 2.30E+03 07KNSTD 9.8 ± 0.4 (Kelley et al.,2013)
QA-11-02 68.8106 -51.1400 420* 3.0 2.65 1.000 6.75E+04 1.23E+03 07KNSTD 10.4 ± 0.2 (Kelley et al.,2013)
QA-11-01 68.8046 -51.1552 360* 3.0 2.65 1.000 6.47E+04 1.55E+03 07KNSTD 10.6 ± 0.3 (Kelley et al.,2013)
SN-11-07 68.6931 -52.6969 119* 1.5 2.65 1.000 5.34E+04 1.01E+03 07KNSTD 11.1 ± 0.2 (Kelley et al.,2013)
SN-11-02 68.6725 -52.7072 119* 2.0 2.65 1.000 5.26E+04 9.93E+02 07KNSTD 10.9 ± 0.2 (Kelley et al.,2013)
SN-11-04 68.6491 -52.6664 220* 3.0 2.65 1.000 5.64E+04 1.35E+03 07KNSTD 10.6 ± 0.3 (Kelley et al.,2013)
SN-11-05 68.6491 -52.6649 221* 2.0 2.65 1.000 5.50E+04 1.29E+03 07KNSTD 10.3 ± 0.2 (Kelley et al.,2013)
JAKN08-01 69.2055 -51.1244 96 2.5 2.65 1.000 4.76E+04 1.17E+03 07KNSTD 10.2 ± 0.3 (Young et al., 2011a; 2011b)
JAKN08-08 69.1993 -50.9674 322 1.0 2.65 1.000 6.14E+04 1.73E+03 07KNSTD 10.3 ± 0.3 (Young et al., 2011a; 2011b)
JAKN08-21 69.2432 -50.9807 374 1.0 2.65 1.000 6.39E+04 3.38E+03 07KNSTD 10.2 ± 0.5 (Young et al., 2011a; 2011b)
JAKN08-22 69.2410 -50.9614 344 4.5 2.65 1.000 5.96E+04 1.87E+03 07KNSTD 10.1 ± 0.3 (Young et al., 2011a; 2011b)
09GRO-01 69.1098 -51.0415 188 5.0 2.65 1.000 5.02E+04 1.25E+03 07KNSTD 10.0 ± 0.2 (Young et al., 2011a; 2011b)
JAKN08-13 69.1844 -50.9060 175 2.5 2.65 1.000 4.11E+04 1.04E+03 07KNSTD 8.1 ± 0.2 (Young et al., 2011a; 2011b)
FST08-BR 69.1974 -51.0541 60 2.0 2.65 0.999 5.38E+04 1.34E+03 07KNSTD 12.0 ± 0.3 (Young et al., 2011a; 2011b)
FST08-04 69.1465 -51.0538 60 2.0 2.65 0.999 3.63E+04 9.41E+02 07KNSTD 8.1 ± 0.2 (Young et al., 2011a; 2011b)
09GRO-03 69.1137 -51.0643 119 3.0 2.65 1.000 3.89E+04 1.14E+03 07KNSTD 8.2 ± 0.2 (Young et al., 2011a; 2011b)
09GRO-06 69.1162 -50.9911 240 4.5 2.65 1.000 4.15E+04 1.32E+03 07KNSTD 7.8 ± 0.2 (Young et al., 2011a; 2011b)
09GRO-33 69.1912 -51.0074 120 4.5 2.65 1.000 3.75E+04 1.17E+03 07KNSTD 8.0 ± 0.2 (Young et al., 2011a; 2011b)
JAKN08-28 69.2407 -49.9852 215 1.0 2.65 1.000 3.96E+04 1.90E+03 07KNSTD 7.4 ± 0.4 (Young et al., 2011a)

11
JAKN08-39 69.2214 -49.9952 206 3.0 2.65 1.000 3.87E+04 1.26E+03 07KNSTD 7.4 ± 0.2 (Young et al., 2011a)
JAKN08-40 69.2256 -50.0569 147 2.0 2.65 1.000 3.89E+04 9.97E+02 07KNSTD 7.9 ± 0.2 (Young et al., 2011a)
JAKN08-44 69.3078 -50.1479 347 2.0 2.65 1.000 4.45E+04 1.68E+03 07KNSTD 7.3 ± 0.3 (Young et al., 2011a)
JAKN08-56 69.3005 -50.3287 425 1.0 2.65 1.000 4.94E+04 1.21E+03 07KNSTD 7.5 ± 0.2 (Young et al., 2011a)
JAKS08-33 69.1471 -50.1245 222 1.0 2.65 1.000 4.07E+04 1.73E+03 07KNSTD 7.6 ± 0.3 (Young et al., 2011a)
JAKS08-34 69.1465 -50.1037 180 2.0 2.65 1.000 3.80E+04 9.75E+02 07KNSTD 7.4 ± 0.2 (Young et al., 2011a)
09GRO-08 69.1131 -51.0371 170 1.0 2.65 1.000 4.21E+04 1.04E+03 07KNSTD 8.2 ± 0.2 (Young et al., 2011b)
09GRO-09 69.1130 -51.0360 170 1.0 2.65 1.000 4.23E+04 8.00E+02 07KNSTD 8.3 ± 0.2 (Young et al., 2011b)
09GRO-11 69.1129 -51.0344 170 4.0 2.65 1.000 4.05E+04 9.37E+02 07KNSTD 8.1 ± 0.2 (Young et al., 2011b)
09GRO-12 69.1130 -51.0343 170 3.0 2.65 1.000 4.17E+04 9.63E+02 07KNSTD 8.3 ± 0.2 (Young et al., 2011b)
09GRO-24 69.2476 -50.7697 300 2.0 2.65 1.000 5.15E+04 9.69E+02 07KNSTD 8.9 ± 0.2 (Young et al., 2011b)
09GRO-27 69.2372 -50.8373 280 5.0 2.65 1.000 5.03E+04 9.70E+02 07KNSTD 9.1 ± 0.2 (Young et al., 2011b)
FST08-01 69.2022 -51.0878 75 1.0 2.65 0.999 3.89E+04 6.62E+02 07KNSTD 8.4 ± 0.1 (Young et al., 2011b)
FST08-02 69.2019 -51.0860 75 1.0 2.65 0.999 3.69E+04 7.38E+02 07KNSTD 8.0 ± 0.2 (Young et al., 2011b)
10GRO-08 68.6695 -50.9987 119 3.5 2.65 1.000 4.46E+04 8.53E+02 07KNSTD 9.4 ± 0.2 (Young et al., 2013)
10GRO-18 68.6164 -51.0512 164 4.5 2.65 1.000 4.62E+04 1.14E+03 07KNSTD 9.3 ± 0.2 (Young et al., 2013)
10GRO-33 68.7027 -50.8445 312 3.0 2.65 0.998 5.40E+04 1.01E+03 07KNSTD 9.3 ± 0.2 (Young et al., 2013)
10GRO-34 68.7000 -50.8209 332 2.0 2.65 1.000 5.67E+04 1.06E+03 07KNSTD 9.5 ± 0.2 (Young et al., 2013)
10GRO-01 68.6356 -50.9715 105 3.5 2.65 1.000 4.26E+04 8.60E+02 07KNSTD 9.1 ± 0.2 (Young et al., 2013)
10GRO-10 68.6216 -50.9427 145 4.0 2.65 0.997 4.15E+04 1.03E+03 07KNSTD 8.6 ± 0.2 (Young et al., 2013)
10GRO-11 68.6216 -50.9423 145 3.0 2.65 0.997 4.09E+04 1.37E+03 07KNSTD 8.4 ± 0.3 (Young et al., 2013)
10GRO-25 68.6142 -51.0298 166 2.0 2.65 1.000 4.53E+04 8.78E+02 07KNSTD 9.0 ± 0.2 (Young et al., 2013)
10GRO-31 68.7090 -50.8077 132 1.0 2.65 0.987 4.31E+04 8.14E+02 07KNSTD 8.9 ± 0.2 (Young et al., 2013)
10GRO-32 68.7135 -50.8439 85 2.0 2.65 0.989 4.15E+04 9.97E+02 07KNSTD 9.1 ± 0.2 (Young et al., 2013)
10GRO-07 68.6587 -50.9798 60 1.5 2.65 1.000 3.75E+04 7.52E+02 07KNSTD 8.3 ± 0.2 (Young et al., 2013)
10GRO-12 68.6219 -50.9385 140 1.5 2.65 1.000 4.00E+04 7.97E+02 07KNSTD 8.1 ± 0.2 (Young et al., 2013)
10GRO-13 68.6149 -50.9096 144 2.5 2.65 0.994 3.86E+04 1.25E+03 07KNSTD 7.9 ± 0.3 (Young et al., 2013)
10GRO-14 68.6153 -50.9027 132 2.0 2.65 0.997 4.00E+04 8.77E+02 07KNSTD 8.2 ± 0.2 (Young et al., 2013)

12
10GRO-28 68.7253 -50.6822 246 3.0 2.65 0.999 4.06E+04 8.04E+02 07KNSTD 7.5 ± 0.1 (Young et al., 2013)
10GRO-35 68.7188 -50.5620 198 2.5 2.65 0.995 3.51E+04 9.95E+02 07KNSTD 6.8 ± 0.2 (Young et al., 2013)
10GRO-39 68.7104 -50.4712 206 1.5 2.65 1.000 3.85E+04 8.02E+02 07KNSTD 7.3 ± 0.2 (Young et al., 2013)
JAKS08-08 69.0627 -49.8804 371 2.0 2.65 1.000 4.03E+04 1.02E+03 07KNSTD 6.5 ± 0.2 (Young et al., 2013)
JAKS08-24 69.0694 -50.1478 314 3.0 2.65 1.000 4.43E+04 1.98E+03 07KNSTD 7.6 ± 0.3 (Young et al., 2013)
10GRO-40 68.7026 -50.4267 230 1.0 2.65 1.000 3.79E+04 9.20E+02 07KNSTD 7.0 ± 0.2 (Young et al., 2013)
10GRO-41 68.7030 -50.4288 230 1.5 2.65 1.000 3.80E+04 8.97E+02 07KNSTD 7.0 ± 0.2 (Young et al., 2013)
GL022 69.432 -50.289 515* 5.0 2.7 1.000 5.54E+04 1.03E+03 07KNSTD 8.0 ± 0.1 (Corbett et al., 2011)
GL023 69.433 -50.289 511* 3.0 2.7 1.000 5.35E+04 1.18E+03 07KNSTD 7.6 ± 0.2 (Corbett et al., 2011)
GL001 69.433 -50.272 434* 1.0 2.7 1.000 4.62E+04 1.34E+03 07KNSTD 6.9 ± 0.2 (Corbett et al., 2011)
GL002 69.433 -50.273 432* 2.0 2.7 1.000 4.86E+04 1.14E+03 07KNSTD 7.4 ± 0.2 (Corbett et al., 2011)
GL003 69.434 -50.266 395* 3.0 2.7 1.000 4.73E+04 1.19E+03 07KNSTD 7.5 ± 0.2 (Corbett et al., 2011)
GL004 69.434 -50.266 392* 2.0 2.7 1.000 4.99E+04 1.19E+03 07KNSTD 7.9 ± 0.2 (Corbett et al., 2011)
GL080 69.395 -50.416 621* 3.0 2.7 1.000 6.18E+04 1.38E+03 07KNSTD 7.9 ± 0.2 (Corbett et al., 2011)
GL081 69.395 -50.416 618* 1.5 2.7 1.000 6.01E+04 1.13E+03 07KNSTD 7.6 ± 0.1 (Corbett et al., 2011)
GL086 69.374 -50.458 304* 2.5 2.7 1.000 4.28E+04 1.10E+03 07KNSTD 7.4 ± 0.2 (Corbett et al., 2011)
GL087 69.374 -50.458 303* 2.0 2.7 1.000 4.45E+04 9.59E+02 07KNSTD 7.7 ± 0.2 (Corbett et al., 2011)
GL088 69.344 -50.429 95* 2.5 2.7 1.000 3.49E+04 8.37E+02 07KNSTD 7.5 ± 0.2 (Corbett et al., 2011)
GL089 69.344 -50.429 93* 2.5 2.7 1.000 3.61E+04 8.09E+02 07KNSTD 7.8 ± 0.2 (Corbett et al., 2011)
GL103 69.318 -50.640 578* 1.0 2.7 1.000 6.89E+04 1.72E+03 07KNSTD 9.0 ± 0.2 (Corbett et al., 2011)
GL104 69.318 -50.640 578* 5.0 2.7 1.000 6.26E+04 1.20E+03 07KNSTD 8.5 ± 0.2 (Corbett et al., 2011)
GL105 69.293 -50.602 300* 1.0 2.7 1.000 4.65E+04 1.07E+03 07KNSTD 8.0 ± 0.2 (Corbett et al., 2011)
GL106 69.293 -50.602 300* 2.0 2.7 1.000 4.58E+04 9.46E+02 07KNSTD 7.9 ± 0.2 (Corbett et al., 2011)
GL090 69.269 -50.581 93* 2.0 2.7 1.000 4.02E+04 8.42E+02 07KNSTD 8.6 ± 0.2 (Corbett et al., 2011)
GL091 69.269 -50.582 91* 2.0 2.7 1.000 3.61E+04 9.97E+02 07KNSTD 7.8 ± 0.2 (Corbett et al., 2011)
GL096 69.250 -50.823 468* 3.0 2.7 1.000 7.27E+04 1.40E+03 07KNSTD 10.8 ± 0.2 (Corbett et al., 2011)
GL097 69.251 -50.822 470* 2.0 2.7 1.000 6.62E+04 1.72E+03 07KNSTD 9.7 ± 0.3 (Corbett et al., 2011)
GL094 69.229 -50.810 308* 1.0 2.7 1.000 5.49E+04 1.44E+03 07KNSTD 9.3 ± 0.3 (Corbett et al., 2011)

13
GL095 69.229 -50.810 308* 2.5 2.7 1.000 4.61E+04 1.29E+03 07KNSTD 7.9 ± 0.2 (Corbett et al., 2011)
GL098 69.199 -50.791 163* 3.0 2.7 1.000 4.97E+04 1.07E+03 07KNSTD 10.0 ± 0.2 (Corbett et al., 2011)
GL092 69.230 -50.902 397* 1.0 2.7 1.000 6.59E+04 1.31E+03 07KNSTD 10.3 ± 0.2 (Corbett et al., 2011)
GL093 69.230 -50.902 397* 2.0 2.7 1.000 6.69E+04 1.68E+03 07KNSTD 10.5 ± 0.3 (Corbett et al., 2011)
GL100 69.227 -50.930 292* 2.0 2.7 1.000 5.95E+04 1.30E+03 07KNSTD 10.4 ± 0.3 (Corbett et al., 2011)
GL101 69.227 -50.929 295* 3.5 2.7 1.000 5.62E+04 1.06E+03 07KNSTD 9.9 ± 0.2 (Corbett et al., 2011)
GL107 69.180 -50.891 53* 1.0 2.7 1.000 3.66E+04 8.09E+02 07KNSTD 8.1 ± 0.2 (Corbett et al., 2011)
GL108 69.180 -50.891 53* 1.0 2.7 1.000 3.73E+04 1.03E+03 07KNSTD 8.3 ± 0.2 (Corbett et al., 2011)
GL102 69.207 -51.134 85* 1.0 2.7 1.000 4.79E+04 1.07E+03 07KNSTD 10.3 ± 0.2 (Corbett et al., 2011)
* The sample elevation was corrected for isostatic uplift. No star corresponds to no correction for the isostatic uplift. † All ages calculated using the developmental version of the CRONUS-Earth online calculator (Balco et al., 2008) and a locally derived 10Be production rate for Baffin Bay (Young et al., 2013b).

14
Figure DR1. Positions and surface exposure ages (in ka) of the boulder samples on the Pjetersson’s Moraine and directly inboard the moraine (black triangles, this study), and positions of two bedrock and one boulder samples near Qeqertarsuaq (black squares, Kelley et al., 2013). Background image from Google Earth (accessed 23-09-2013).

15
Figure DR2. A. Erratic boulder sampled on the Pjetursson’s Moraine. B. Erratic boulder sampled inboard the Pjetursson’s Moraine, directly on top of the volcanic bedrock (in the background).
A B

16
Figure DR3. Glacier surface elevations at 12.2 ± 0.6 ka based on Van der Veen (1999) model. The grounding line position is constrained by the presence of a till in core VC20 (O’Cofaigh et al., 2013). This position corresponds to a conservative approach because additional radiocarbon ages ~12 ka suggest that ice extended up to the continental shelf edge and slope. At the level of the grounding line the glacier elevation results from a simple hydrostatic equilibrium calculation. Two sliding conditions were tested: the basal shear stress values of 35 kPa (thick dashed line) and of 4 kPa (thick solid line), which are typical and minimum sliding conditions observed offshore for several neighbouring glaciers at the Last Glacial Maximum by Roberts et al. (2013). The low shear stress value resulted in a low profile ice stream (confined to the glacial trough) and ice shelf spreading in an open bay. Such a low shear stress value is supported by the location of the till and the Pjetursson’s Moraine (distant by 200 km) as well their similar time of deposition: 12.2 ka. The thin black line corresponds to the bed rock elevation assuming the mean sea level rise since 12.2 ka.
Sill 1
Relative position of Sill 2