growthratesandlogarithms: arefresherlhendricks.org/econ520/growth/growth_algebra_sl.pdf · ln(y...
TRANSCRIPT
Growth Rates and Logarithms: A Refresher
Prof. Lutz Hendricks
Econ520
January 5, 2016
1 / 14
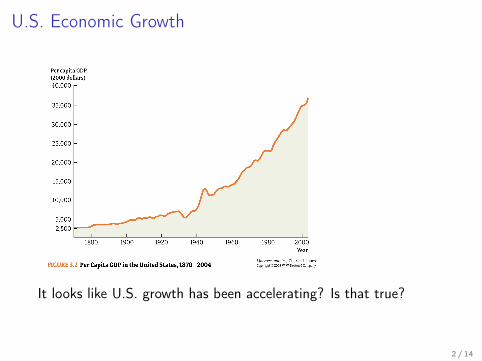
U.S. Economic Growth
It looks like U.S. growth has been accelerating? Is that true?
2 / 14
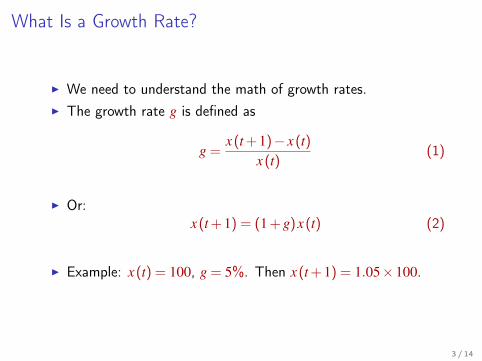
What Is a Growth Rate?
I We need to understand the math of growth rates.I The growth rate g is defined as
g =x(t + 1)− x(t)
x(t)(1)
I Or:x(t + 1) = (1 + g)x(t) (2)
I Example: x(t) = 100, g = 5%. Then x(t + 1) = 1.05×100.
3 / 14
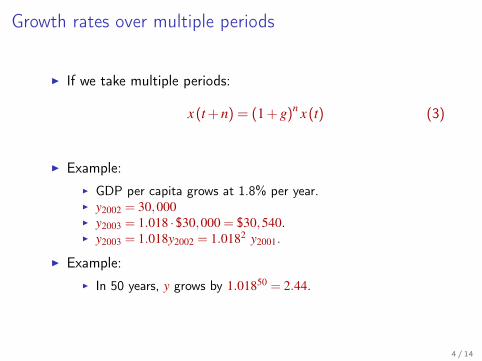
Growth rates over multiple periods
I If we take multiple periods:
x(t + n) = (1 + g)n x(t) (3)
I Example:I GDP per capita grows at 1.8% per year.I y2002 = 30,000I y2003 = 1.018 ·$30,000 = $30,540.I y2003 = 1.018y2002 = 1.0182 y2001.
I Example:I In 50 years, y grows by 1.01850 = 2.44.
4 / 14
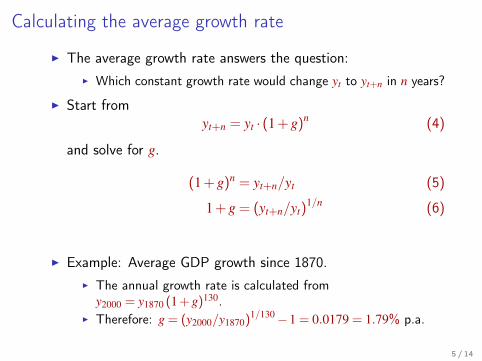
Calculating the average growth rate
I The average growth rate answers the question:I Which constant growth rate would change yt to yt+n in n years?
I Start fromyt+n = yt · (1 + g)n (4)
and solve for g.
(1 + g)n = yt+n/yt (5)
1 + g = (yt+n/yt)1/n (6)
I Example: Average GDP growth since 1870.I The annual growth rate is calculated from
y2000 = y1870 (1 + g)130.I Therefore: g = (y2000/y1870)1/130 −1 = 0.0179 = 1.79% p.a.
5 / 14
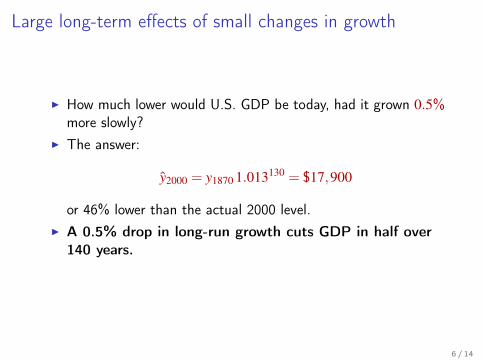
Large long-term effects of small changes in growth
I How much lower would U.S. GDP be today, had it grown 0.5%more slowly?
I The answer:
y2000 = y1870 1.013130 = $17,900
or 46% lower than the actual 2000 level.I A 0.5% drop in long-run growth cuts GDP in half over
140 years.
6 / 14
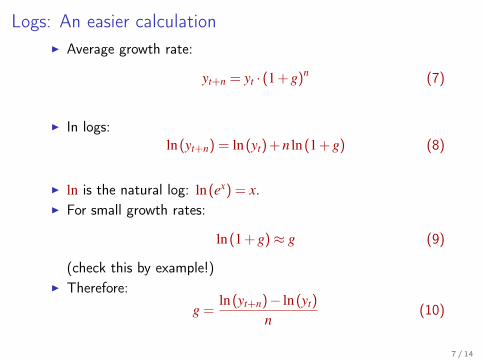
Logs: An easier calculationI Average growth rate:
yt+n = yt · (1 + g)n (7)
I In logs:ln(yt+n) = ln(yt) + n ln(1 + g) (8)
I ln is the natural log: ln(ex) = x.I For small growth rates:
ln(1 + g) ≈ g (9)
(check this by example!)I Therefore:
g =ln(yt+n)− ln(yt)
n(10)
7 / 14
Important growth rate rules
g(xy) = g(x) + g(y)
g(x/y) = g(x)−g(y)
g(xα ) = αg(x)
These are easily derived from the log growth equation.
8 / 14
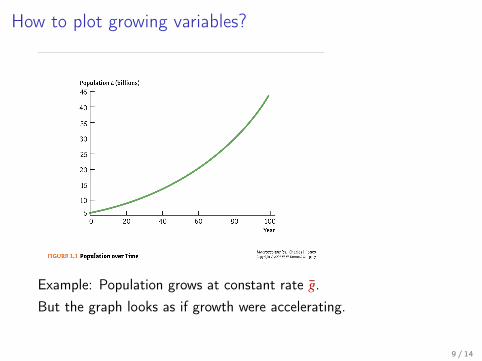
How to plot growing variables?
Example: Population grows at constant rate g.But the graph looks as if growth were accelerating.
9 / 14
Log plots
I How can we visualize that something grows at a constant rate?I Plot its log!
I Recallln(yt+n) = ln(yt) + ng (11)
I The plot of ln(yt) is linear with slope g.
10 / 14
Log plots
I More generally, if a variable grows at variable rate gt:
yt+1 = yt(1 + gt) (12)ln(yt+1) = ln(yt) + gt (13)
I Now the plot is not linear, but the slope is still the growth rate.I An important feature for reading log graphs: log(y) increases
by 0.1 means that y roughly rises by 10%
11 / 14
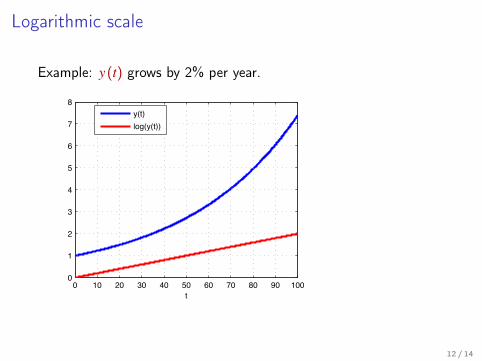
Logarithmic scale
Example: y(t) grows by 2% per year.
0 10 20 30 40 50 60 70 80 90 1000
1
2
3
4
5
6
7
8
t
y(t)log(y(t))
12 / 14
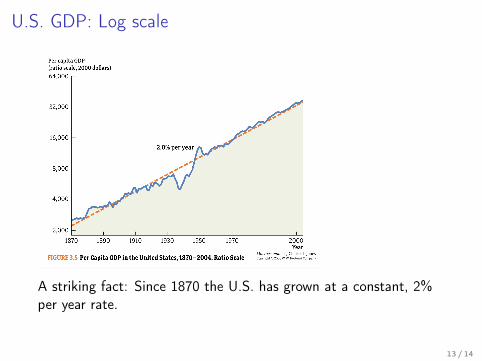
U.S. GDP: Log scale
A striking fact: Since 1870 the U.S. has grown at a constant, 2%per year rate.
13 / 14
Examples
Country A’s GDP grows at 8% for 15 years and at -1% for 10years. What is the average growth rate?
14 / 14