growth strategies for greece and cyprus - lse home...growth strategies for greece and cyprus twitter...
TRANSCRIPT

Speakers:
Gikas Hardouvelis, Professor of Finance and Economics, University of Piraeus in Greece
Sir Christopher Pissarides, Regius Professor of Economics, LSE; Professor of European Studies, University of Cyprus
Constantinos Petrides, Minister of Interior, Cyprus
Dimitri Vayanos, Professor of Finance, LSE
Hosted by the Hellenic Observatory & School of Economics & Management, University Of Cyprus
Chair: Vassilis MonastiriotisAssociate Professor of Political Economy, LSE
Growth strategies for Greece and Cyprus
Twitter Hashtag: #LSECyprus
Reform Priorities and Outlook for Greece
Dimitri Vayanos, London School of Economics
University of Cyprus, 27 November 2018
The Book
• Website of English Edition: https://mitpress.mit.edu/books/beyond-austerity
• Website of Greek Edition: https://www.cup.gr/book/pera-apo-ti-litotita/
• Financial support by the LSE Hellenic Observatory is gratefully acknowledged

Chapters and Contributors
1. The Greek Economy 2. Greece and the Euro 3. Trade Balance
4. Product Markets 5. Privatizations 6. Labor Market 7. Financial System
8. Education 9. Healthcare 10. Taxation 11. Pensions
12. Justice System 13. Corruption 14. Public Administration Ι 15. Public Administration ΙΙ
D. Vayanos N. VettasC. Meghir C. Pissarides G. M. Angeletos H. Dellas C. Arkolakis M. GalenianosA. Doxiadis
Κ. Meghir M. Haliassos
Ν. Vettas M. Haliassos
Y. Katsoulacos C. Genakos G. Houpis V. Skreta Α. Lyberaki D. Nicolitsas M. Tsoutsoura D. VayanosG. Hardouvelis
P. Kanavos Κ. Souliotis C. Kotsogiannis C. MeghirM. Flevotomou S. Panageas P. Tinios
E. Papaioannou S. Karatza C. Azariadis Y. Ioannides M. Jacobides P. Karkatsoulis Ε. Stefopoulou

Structural Reforms in Greece—Improvements So Far
• Labour market.• Significant deregulation of a formerly over-regulated labor market.
• Product markets.• Significant deregulation and reduction of barriers to entry.
• Pensions.• Unification of a highly fragmented pension system.• Viability achieved through significant pension cuts.
• Tax administration.• Establishment of independent tax collection authority.• Fully electronic filing.

Structural Reforms in Greece—Priorities Going Forward• Reduce tax burden on productive activity.
• Move to a flat tax system, with a minimum guaranteed income and possibly EITC. • More emphasis on consumption taxes, and less on income and corporate taxes.• Multi-pillar pension system, with tight link between contributions and pensions.
• Enhance competition in product markets.• Abolish more barriers to entry. Strengthen competition authorities.• Use privatizations as a tool to enhance competition. (Not only to maximize revenue)• Facilitate NPL resolution, via bankruptcy laws and bad bank.
• Make public administration more efficient and independent.• Enshrine independence between public administration and political system.• More autonomy to organizational units (schools, universities, hospitals, courts).• More performance measurement and incentives.

0
0.1
0.2
0.3
0.4
0.5
0.6
0.7
0.8
0.9
1995 2000 2005 2010 2015
Efficiency of the Public Administration
Governance Indicators, World Bank (Government Effectiveness Index)

Dependence on politicians: Quality of Government Indicators, University of Gothenburg, 2015 (“the top political leadership hires and fires senior public officials”). Efficiency of public administration: Governance Indicators, World Bank, 2015 (Government Effectiveness Index). OECD countries.
0.00
0.50
1.00
1.50
2.00
2.50
1 2 3 4 5 6 7
Effi
cien
cy o
f th
e P
ub
lic A
dm
inis
trat
ion
Dependence on Politicians

Outlook for Greece
• Limited progress, and backtracking, on many reform areas.• Greece is sliding back in competitiveness rankings, e.g., Doing Business.
• Europeans (in IMF’s absence) are turning a blind eye.
• If growth remains anaemic, a new bailout programme is likely in a few years.• Cash buffer can carry Greece for a few years.
• Market access is conditional on expectations of future growth.

Growth or Stagnation
Ahead?
Cyprus vs. Greece
Prof. Gikas Hardouveliswww.hardouvelis.gr
www.hardouvelis.com
Conference on “Growth strategies for Greece and Cyprus,” organized by The Hellenic Observatory, London School of Economics and Political Sciences
& The School of Economics and Management, University of Cyprus Nicosia, Cyprus, November 27, 2018, 18:00
University of Cyprus, Aglantzia Campus, Leventis Building , Amphitheatre B108

TABLE OF CONTENTS
Growth or Stagnation Ahead? Cyprus vs. Greece
I. A different economic trajectory following the crisis
II. The challenge of achieving lasting growth
2Gikas A. Hardouvelis
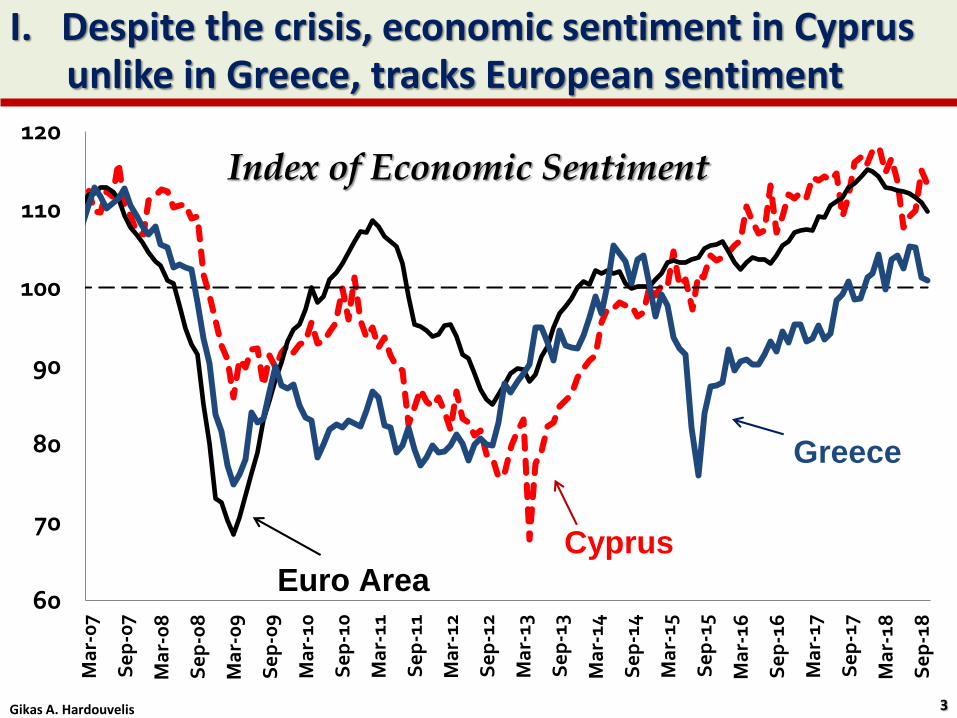
I. Despite the crisis, economic sentiment in Cyprusunlike in Greece, tracks European sentiment
60
70
80
90
100
110
120
Mar-07
Sep-07
Mar-08
Sep-08
Mar-09
Sep-09
Mar-10
Sep-10
Mar-11
Sep-11
Mar-12
Sep-12
Mar-13
Sep-13
Mar-14
Sep-14
Mar-15
Sep-15
Mar-16
Sep-16
Mar-17
Sep-17
Mar-18
Sep-18
Cyprus
Euro Area
Greece
Index of Economic Sentiment
3Gikas A. Hardouvelis

I. Small output loss and quick recovery in Cyprus, huge loss and continued stagnation in Greece
70
75
80
85
90
95
100
105
110
T0
T+
1T
+2
T+
3T
+4
T+
5T
+6
T+
7T
+8
T+
9T
+10
T+
11
T+
12
T+
13
T+
14
T+
15T
+16
T+
17
T+
18
T+
19
T+
20
T+
21
T+
22
T+
23
T+
24
T+
25
T+
26
T+
27
T+
28
T+
29
T+
30
T+
31
T+
32
T+
33
GREECE (2010Q1=100)
CYPRUS (2012Q2=100)
Cumulative GDP change
-22.2% from T0
in 15 Quarters
-22.6% from T0
in 22 Quarters
-7.9% from T0
in 9 Quarters
From 2007 Q4 to T0 Greece lost
another 5.6%Cyprus lost
another 1.0 %
Source: Eurostat, Gkionis-Hardouvelis
4Gikas A. Hardouvelis
T0 is the moment just before an MoUbegan
Lost output growth due to Crisis Phase II

I. Unemployment declines fast in Cyprus, now less than when crisis started
-5
0
5
10
15
20
T0
T+
1T
+2
T+
3T
+4
T+
5T
+6
T+
7T
+8
T+
9T
+10
T+
11
T+
12
T+
13
T+
14
T+
15
T+
16
T+
17
T+
18
T+
19
T+
20
T+
21
T+
22
T+
23
T+
24
T+
25
T+
26
T+
27
T+
28
T+
29
T+
30
T+
31
T+
32
T+
33
GREECE 2010Q1=100
CYPRUS 2012Q2=100
Source: Eurostat, Gkionis-Hardouvelis
ppts Cumulative Change in Unemployment Rate
Complete correction after 5 years in Cyprus
From 2007 to T0 Greece lost another 3.2%(8.1 →11.3)
Cyprus lost another 7.9%(3.8 → 11.7)
5Gikas A. Hardouvelis

0.10
0.15
0.20
0.25
0.302
000
2001
2002
2003
2004
2005
2006
2007
2008
2009
2010
2011
2012
20
13
20
14
2015
2016
2017
20
18E
2019F
2020F
GREECE
CYPRUS
EA19
Investment – Output Ratio
6Gikas A. Hardouvelis
I. Investment picks up in Cyprus, not in GreeceO
ptim
istic Gre
ek fo
recastsSource: Eurostat, Gkionis-Hardouvelis

0
500
1000
1500
2000
2500
3000
3500
4000Ja
n-1
0
Ap
r-1
0
Jul-
10
Oct
-10
Jan
-11
Ap
r-1
1
Jul-
11
Oct
-11
Jan
-12
Ap
r-1
2
Jul-
12
Oct
-12
Jan
-13
Ap
r-1
3
Jul-
13
Oct
-13
Jan
-14
Ap
r-1
4
Jul-
14
Oct
-14
Jan
-15
Ap
r-1
5
Jul-
15
Oct
-15
Jan
-16
Ap
r-1
6
Jul-
16
Oct
-16
Jan
-17
Ap
r-1
7
Jul-
17
Oct
-17
Jan
-18
Ap
r-1
8
Jul-
18
Oct
-18
SPREADS GREECE VS GERMANY
SPREADS CYPRUS VS GERMANY
Source: Bloomberg
I. Markets are willing to lend to Cyprus, spreads consistently lower than Greek spreads
7Gikas A. Hardouvelis
Nov. 23,2018GGB 10-yr 4.8%CGB 10-yr 2.4%
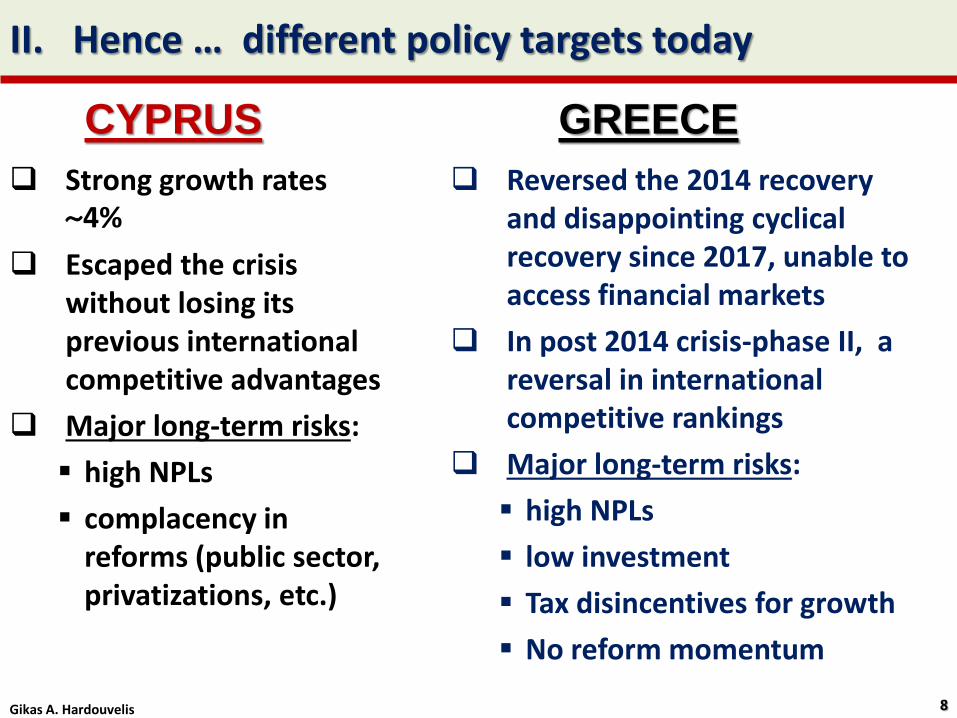
II. Hence … different policy targets today
Strong growth rates ~4%
Escaped the crisis without losing its previous international competitive advantages
Major long-term risks:
high NPLs
complacency in reforms (public sector, privatizations, etc.)
Reversed the 2014 recovery and disappointing cyclical recovery since 2017, unable to access financial markets
In post 2014 crisis-phase II, a reversal in international competitive rankings
Major long-term risks:
high NPLs
low investment
Tax disincentives for growth
No reform momentum
CYPRUS GREECE
8Gikas A. Hardouvelis

ΙΙ. Non-Performing loans: The elephant in the room
9
0%
5%
10%
15%
20%
25%
30%
35%
40%
45%
GR CY PT IT BG HR SI IE HU PL RO ES LV EU MT AT FR SK LT IS DK NL BE EE DE GB CZ NO FI SE LU
Non-Performing Exposures
(% Loans)
2018Q2
Source: European Banking authority
Huge NPE problem in Greece & Cyprus
Due to a fiscal crisis in Greece and to a recession later
Due to a banking crisis in Cyprus
Portugal, Italy next but below 10%
Gikas A. Hardouvelis

II. Other key indicators today
ConditionsGreece
2018
Cyprus
2018
Primary Balance (% GDP, ESA2010) 3.9 5.5
General Gov. Balance (% GDP) 0.6 2.8
Gross Public Debt (% GDP) 182.5 105
Current Account Balance (% GDP, 3-yr average)
-0.8 -5.0
Ease of Doing Business 68.08 71.71
REER (ULC total economy deflated,
1999Q1 = 100, 3-yr % change)-2.8 -6.6
Private Sector Debt (% GDP, 2017) 116.4 316.3
Banks Assets (% of GDP, 2018-H1) 132 336
1) Fiscal statistics: Deficit OK in both countries , Debt is high in Greece2) Competitiveness statistics: No problem yet3) Financial sector statistics: Cyprus more exposed to a shock
10Gikas A. Hardouvelis

II. Revealing Doing Business competitive rankings
11Gikas A. Hardouvelis
170 countries

II. Revealing Doing Business competitive rankings
12Gikas A. Hardouvelis
CYPRUS
GREECE

II. Revealing Doing Business competitive rankings
13Gikas A. Hardouvelis
2018 Greece Cyprus
Overall Score DTF 68.08 71.71
Starting a business 92.39 91.24
Dealing with construction permits 75.29 64.08
Getting electricity 75.97 78.35
Registering property 47.59 63.46
Getting credit 50.00 60.00
Protecting minority investors 63.33 66.67
Paying taxes 76.89 80.78
Trading across borders 93.72 88.44
Enforcing contracts 50.19 48.59
Resolving insolvency 55.39 75.45
1. Safeguard macroeconomic stability, ensure pension system is solvent
2. Clean up the banking system
3. Keep up the reform effort
Gikas A. Hardouvelis 14
ΙΙ. Concluding recipe for persistent growth
Thank youfor your attention!
www.hardouvelis.grwww.hradouvelis.com

Greece and Cyprus: Are we embarking on sustainable
growth?Christopher Pissarides
University of Cyprus and London School of Economics
University of Cyprus panel discussion, 27 November 2018
Where are we?
• Lots of progress has been made since the crash – more in Cyprus than in Greece
• We are almost out of the woods in macro aggregates
• But investment still very low, productivity stalling
• Employment improved but has not yet recovered
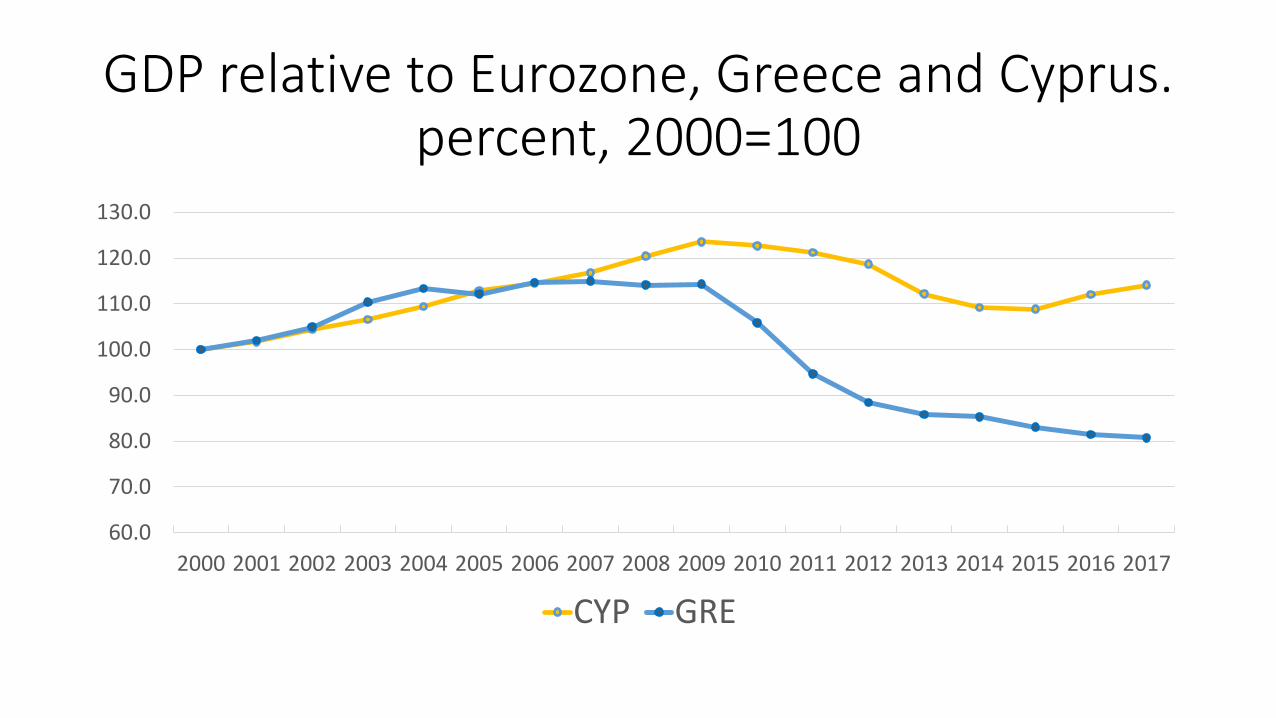
GDP relative to Eurozone, Greece and Cyprus.percent, 2000=100
60.0
70.0
80.0
90.0
100.0
110.0
120.0
130.0
2000 2001 2002 2003 2004 2005 2006 2007 2008 2009 2010 2011 2012 2013 2014 2015 2016 2017
CYP GRE

Consumption, % GDP
60.0
62.0
64.0
66.0
68.0
70.0
72.0
74.0
76.0
78.0
80.0
2000 2001 2002 2003 2004 2005 2006 2007 2008 2009 2010 2011 2012 2013 2014 2015 2016 2017
GRE CON CYP CON

Investment, % of GDP
0
5
10
15
20
25
30
2000 2001 2002 2003 2004 2005 2006 2007 2008 2009 2010 2011 2012 2013 2014 2015 2016 2017
GRE INV CYP INV

Labour productivity at current prices
0
1000
2000
3000
4000
5000
6000
7000
8000
2000 2001 2002 2003 2004 2005 2006 2007 2008 2009 2010 2011 2012 2013 2014 2015 2016 2017
EUR 19 GRE CYP
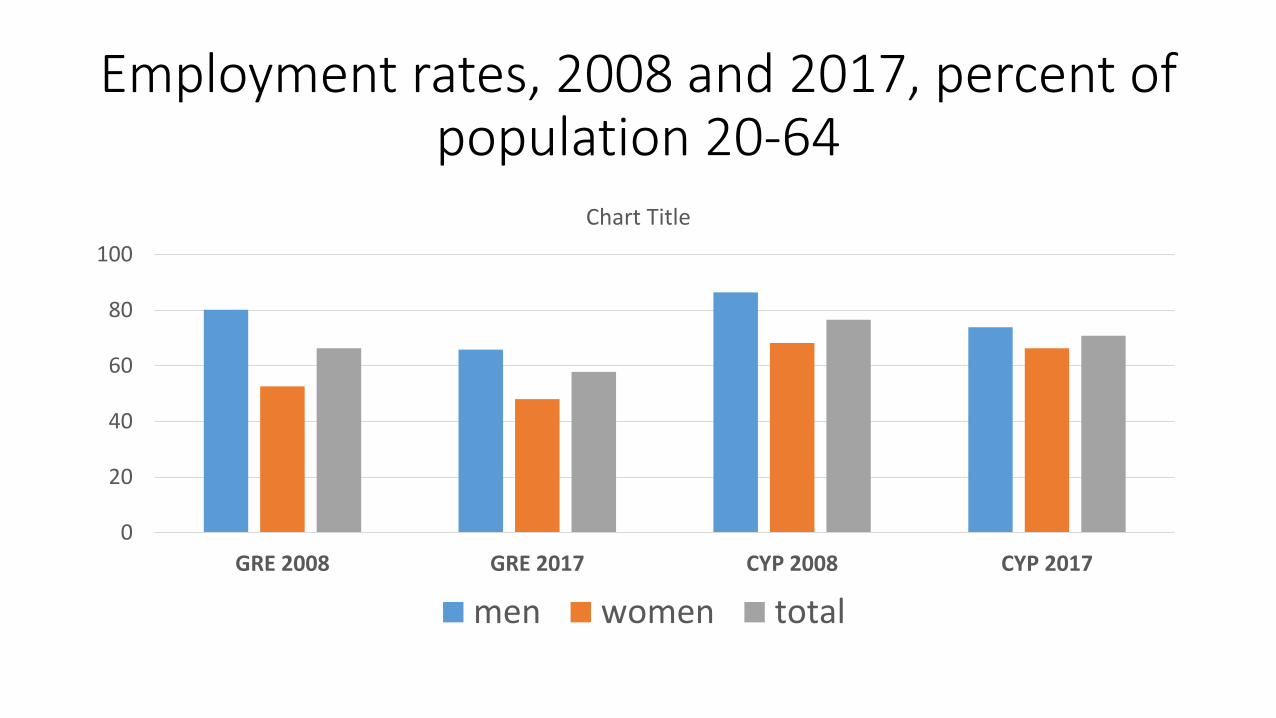
Employment rates, 2008 and 2017, percent of population 20-64
0
20
40
60
80
100
GRE 2008 GRE 2017 CYP 2008 CYP 2017
Chart Title
men women total

Sustainable growth
• New theories of growth emphasize the importance of institutions and politics in generating sustainable growth
• Both Cyprus and Greece doing very badly in institutional reform
• Worst in the European Union, and red tape is deteriorating
• Corruption prevalent, especially political

Ease of doing business, Cyprus rank, 2008-18
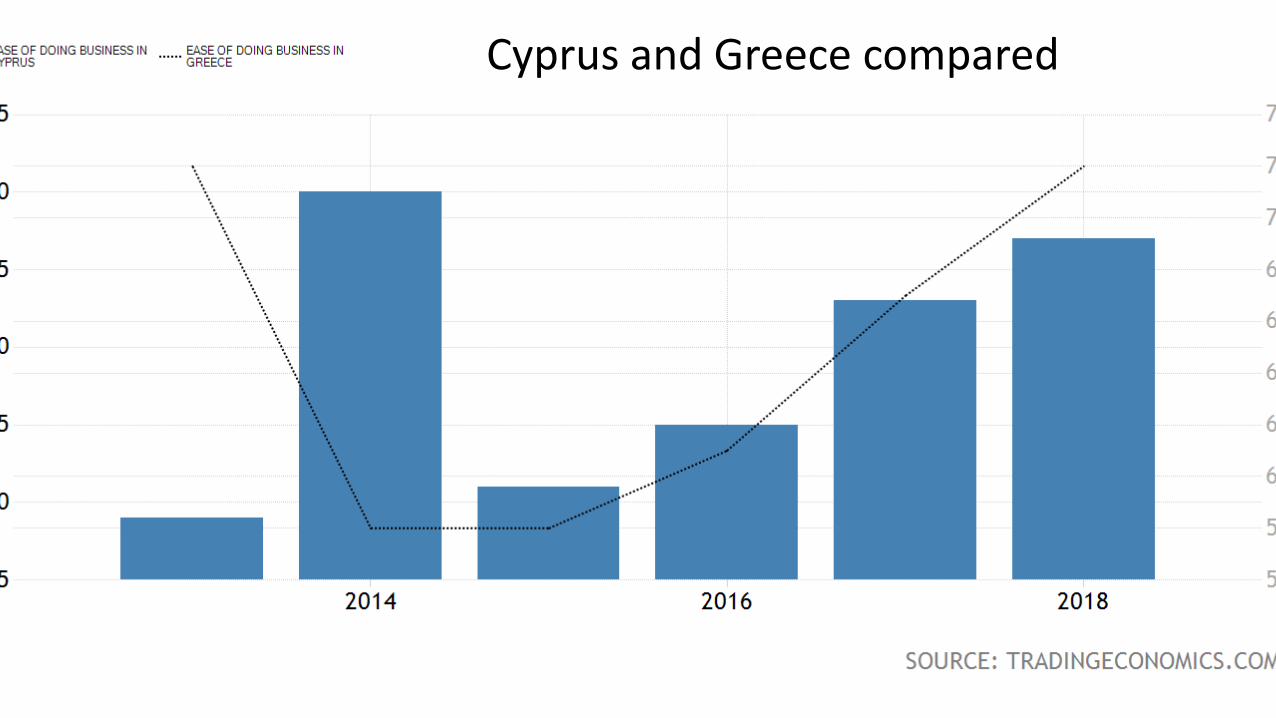
Cyprus and Greece compared
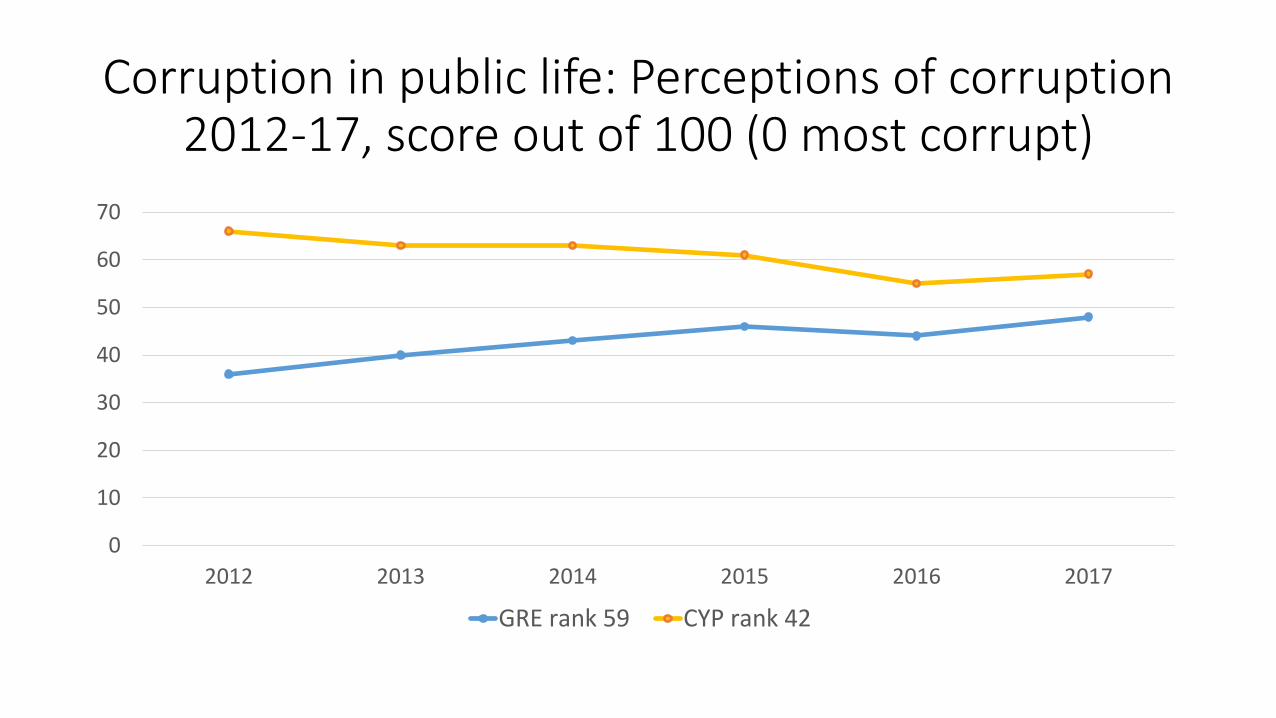
Corruption in public life: Perceptions of corruption 2012-17, score out of 100 (0 most corrupt)
0
10
20
30
40
50
60
70
2012 2013 2014 2015 2016 2017
GRE rank 59 CYP rank 42
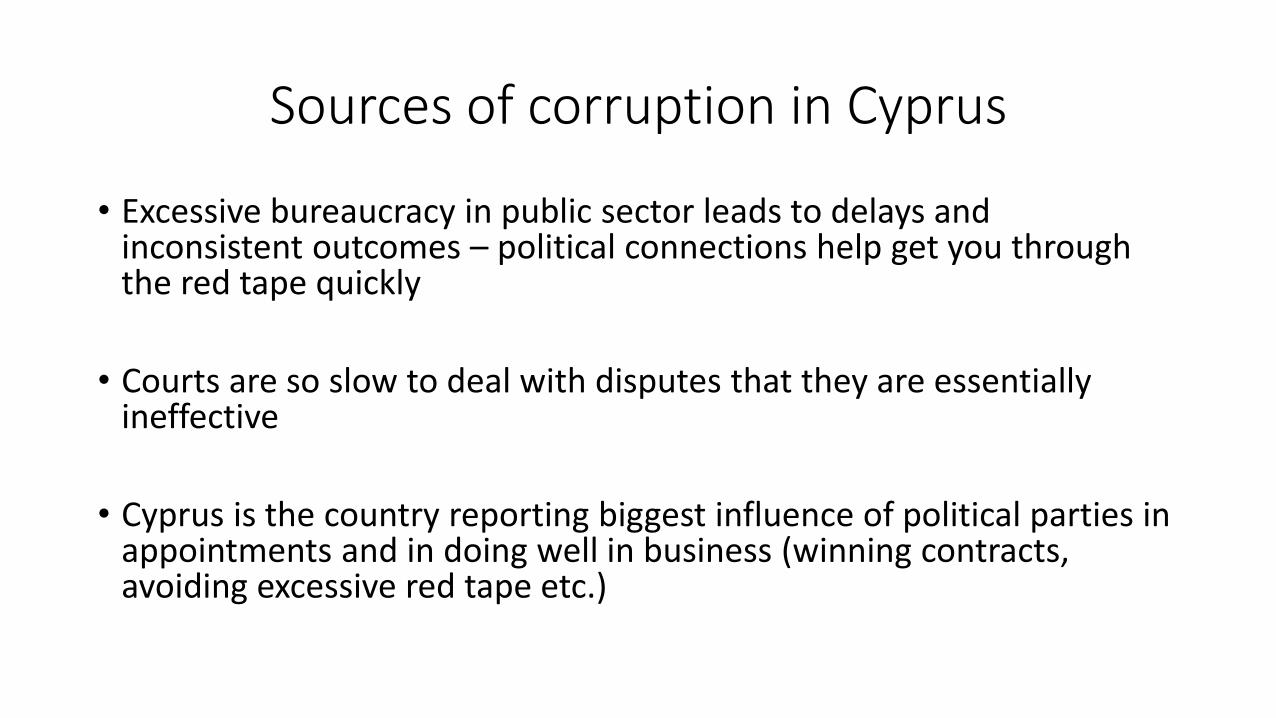
Sources of corruption in Cyprus
• Excessive bureaucracy in public sector leads to delays and inconsistent outcomes – political connections help get you through the red tape quickly
• Courts are so slow to deal with disputes that they are essentially ineffective
• Cyprus is the country reporting biggest influence of political parties in appointments and in doing well in business (winning contracts, avoiding excessive red tape etc.)

Where does one start?
• No doubt that in Cyprus the source of institutional inefficiency is the public sector – virtually nothing works quickly, with transparency and with confidence that the case has been dealt with fairly in the absence of political interference
• E.g., property titles delayed because the tax authorities consider threats in this connection as the most effective way to collect overdue taxes – in other countries the courts play that role
• Tax office responds to queries about tax owed with 6-7 years delay and then penalise you heavily for the delay in paying the taxes

Company red tape
• Red tape becoming worse, still no digital technology used. Recent report by the auditor general about tax evasion criticising dividing lines between VAT and income tax – response form the companies office and tax authorities: give us another 150 employees and we will deal with it.
• In the tourist sector (the biggest foreign exchange earner on the island) it is not clear where local authorities’ powers end and where central government ones begin. As a result, there is chaos in maintenance and issuing of permits, with detrimental results on the quality of the product (environment, licencing etc.)

Good signs – or are they?
• Most encouraging development is that people in high office started to complain in public, e.g., auditor general, attorney general, even central bank governor.
• Public who have been disgruntled but got on with their life are beginning to talk more loudly
• Hopefully progress is on its way – but it has to come from government and Parliament, which has the vested interest in preserving the status quo