growth of micro and small enterprises in southern africamcpherson/papers/jde mcpherson 1996.pdf ·...
TRANSCRIPT
E L S E V I E R Journal of Development Economics
Vol. 48 (1996) 253-277
JOURNAL OF Development ECONOMICS
Growth of micro and small enterprises in southern Africa
Michael A. McPherson University of North Texas, Department of Economics, P.O. Box 13408, Denton, TX 76203-3408, USA
Received 15 November 1992; revised 15 September 1994
Abstract
As policy-makers and members of the donor community have recognized the importance of micro and small enterprises in developing countries, the paucity of information regarding the ways in which MSEs grow and change over time has become glaring. This study examines one issue of small-firm dynamics, namely growth, using new data collected in five southern African countries. The level of human capital embodied in the proprietor, firm location, sector, and proprietor gender are found to be important determinants of growth. The results also indicate an inverse relationship between firm growth and both firm age and firm size.
JEL classification: LI0; O12; O17; 055
Keywords: Micro and small enterprises; Africa; Firm growth; Human capital
1. I n t r o d u c t i o n
The i m p o r t a n c e o f m i c r o and smal l en te rp r i ses ( M S E s ) i in e c o n o m i c deve lop -
m e n t has b e e n o f in teres t to p o l i c y - m a k e r s for m a n y decades . P r o m o t i o n of
sma l l - sca le text i le m a n u f a c t u r i n g in Ind ia was a pr ior i ty e v e n be fo re i n d e p e n d e n c e
MSEs are defined as income-generating activities other than primary production which employ 50 or fewer workers. Home-based enterprises are included as long as at least half of the output is marketed. Within the MSE category, microenterprises are those with ten or fewer workers; small enterprises range in size from 11 to 50.
0304-3878/96/$15.00 © 1996 Elsevier Science B.V. All rights reserved SSDI 0 3 0 4 - 3 8 7 8 ( 9 5 ) 0 0 0 2 7 - 5
254 M.A. McPherson / Journal of Development Economics 48 (1996) 253-277
in 1947. However, despite growing knowledge of its magnitude, there was no widespread interest in the potential of the MSE sector in the decades in the middle of this century as development economists advocated large-scale, capital-intensive investment. Indeed, in many countries MSEs were discouraged either directly or indirectly by developing country governments. Since the 1970s, this trend has reversed itself as an ever-growing number of scholars, policy-makers, and mem- bers of the assistance community have begun to examine the possibilities of this sector as an engine of growth.
Support for MSEs could be seen as a part of a 'redistribution with growth' plan, such as proposed by the World Bank. 2 Such plans seek to support either directly or indirectly the efforts of poor producers, a category which includes most MSE owners and workers. According to proponents of such a plan, more equitable income distributions and economic growth can occur simultaneously. In the redistribution with growth scheme, the poor serve as an engine of development.
Another argument in favor of supporting the MSE sector is that it may serve as an entrepreneurial 'seed bed', with entrepreneurs graduating to run the larger industries. Such a seed bed might be especially important given the role of entrepreneurship in economic development (see Kilby, 1971).
Regardless of whether one is convinced by the arguments for supporting MSE development, the fact remains that a growing list of donors, NGOs, and develop- ing country governments are becoming involved with MSE assistance programs. In some countries, such as Zimbabwe, attention to assisting the sector is an explicit part of structural adjustment plans. 3 Much of the assistance is in the form of policy changes designed to 'level the playing field' between the large scale sector and the MSE sector, so that the policy environment is not biased towards the larger firms. Some suggestions, however, involve providing assistance to particular enterprises. Such measures have included training of entrepreneurs in management, bookkeeping, and marketing, as well as measures to make credit available to the small firm. Unfortunately, given the massive numbers of potential recipients of this aid, it is impossible to reach more than a small fraction of the whole. In light of this it is useful to consider which sorts of firms stand the best chance of succeeding in the highly competitive MSE sector.
As policy-makers and members of the donor community have recognized the importance of MSEs in developing countries, the paucity of information regarding the ways in which MSEs grow and change over time has become glaring. An in-depth examination of the issues surrounding the dynamics of these enterprises therefore seems warranted. In an earlier paper 4 I explored the factors which influence failure (and therefore survival) of firms in southern Africa. While
2 See, for example, Chenery et al. (1974). 3 Government of Zimbabwe (1991, pp. 19-20). 4 McPherson (1992).
M.A. McPherson /Journal of Development Economics 48 (1996) 253-277 255
knowledge of which sorts of firms survive should be a crucial input into the decision-making process of those who would assist MSEs, it is not sufficient. An equally important piece of the puzzle is an understanding of which firms tend to grow, and which tend to stagnate. Such an understanding is crucial to the evolving policy debate involving the MSE sector, as it allows answers to policy questions
such as whether this sector should be encouraged at all, and if assistance is
deemed appropriate, what policy measures would be most effective.
This paper explores the issue of growth using new data from five countries in
southern Africa: Swaziland, Zimbabwe, Lesotho, Botswana and two townships in
South Africa. The contributions of this work are primarily empirical although the results to be presented may provide the groundwork for formal modeling of MSE
growth in the future. The next section presents a short description of the nature of growth in MSEs.
Section 3 examines some of the reasons why firms should grow, and considers the literature on the subject. Section 4 includes a discussion of the concept of growth.
Section 5 describes the data and variables to be used in the analysis, and Sections 6 and 7 present the results. A final section offers conclusions.
2. A descriptive profile
2.1. A comparison o f the countries
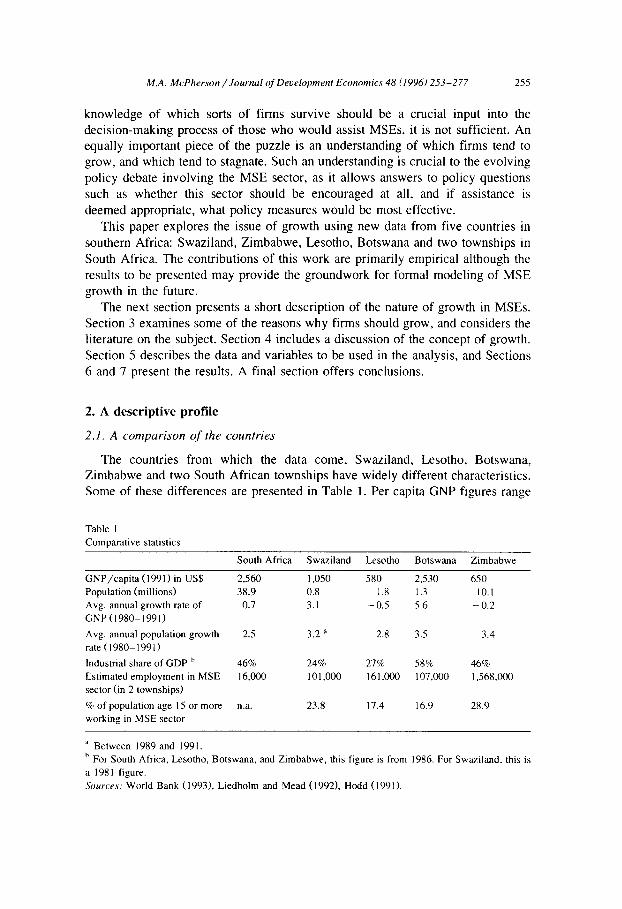
The countries from which the data come, Swaziland, Lesotho, Botswana, Zimbabwe and two South African townships have widely different characteristics. Some of these differences are presented in Table 1. Per capita GNP figures range
Table I Comparative statistics
South Africa Swaziland Lesotho Botswana Zimbabwe
GNP/capita (1991) in US$ 2,560 1,050 580 2,530 650 Population (millions) 38.9 0.8 1.8 1.3 10. I Avg. annual growth rate of 0.7 3.1 - 0.5 5.6 - 0.2 GNP (1980 1991) Avg. annual population growth 2.5 3.2 a 2.8 3.5 3.4 rate ( 1980-1991 ) Industrial share of GDP b 46% 24% 27% 58% 46% Estimated employment in MSE 16,000 101,000 161,000 107,000 1,568,000 sector (in 2 townships)
% of population age 15 or more n.a. 23.8 17.4 16.9 28.9 working in MSE sector
a Between 1989 and 1991. b For South Africa, Lesotho, Botswana, and Zimbabwe, this figure is from 1986. For Swaziland, this is a 1981 figure. Sources: World Bank (1993), Liedholm and Mead (1992), Hodd (1991).
256 M.A. McPherson / Journal of Development Economics 48 (1996) 253-277
from high values of $2,560 and $2,530 in South Africa and Botswana, respec- tively, to a low of $580 in Lesotho. Furthermore, the gap between the better-off countries and the relatively poorer countries in this group has widened in the last decade, with the economies of Botswana and Swaziland showing positive eco- nomic growth over this period, and the economies of Lesotho and Zimbabwe actually shrinking. South Africa, Botswana and Zimbabwe all have a relatively important industrial sector, whereas Swaziland and Lesotho have not yet managed to increase their industrial share of GDP much above one-quarter.
2.2. Small firm growth
In recent years, a number of studies of MSEs have been carried out, many of them in Africa. Before proceeding to analyze the data in a rigorous way, it is useful to examine some simple findings which have emerged from these surveys.
The last rows in Table 1 provide some comparative evidence of the importance of the MSE sector in each country in this study. While estimates of the share of this sector in GDP are unavailable, Table 1 presents estimates of the percentage of the working age population involved in the MSE sector. This percentage ranges from 16.9% in Botswana to 28.9% in Zimbabwe, reflecting the importance of the sector in each nation's economy.
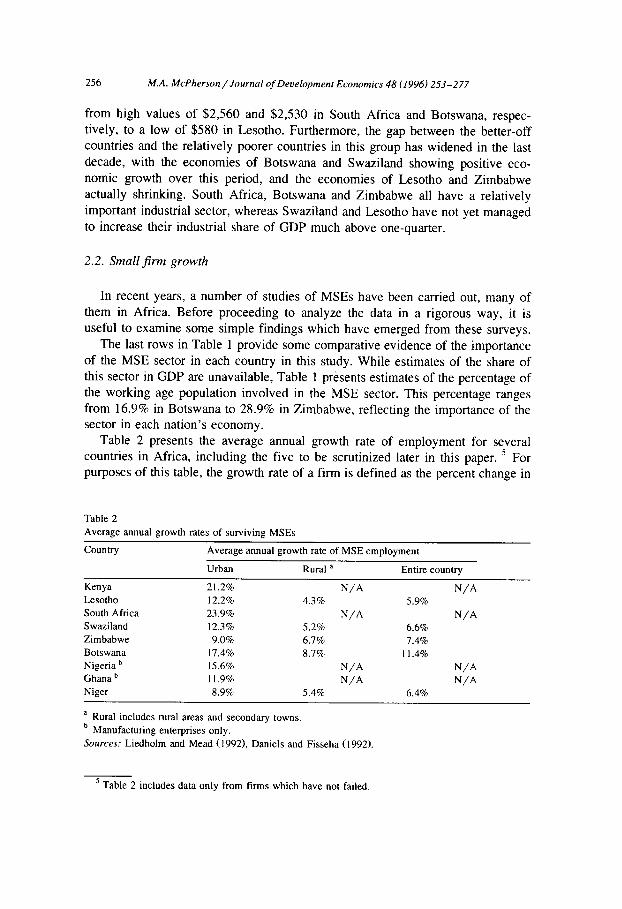
Table 2 presents the average annual growth rate of employment for several countries in Africa, including the five to be scrutinized later in this paper. 5 For purposes of this table, the growth rate of a firm is defined as the percent change in
Table 2 Average annual growth rates of surviving MSEs
Country Average annual growth rate of MSE employment
Urban Rural a Enti~ country
Kenya 21,2% Lesotho 12.2% 4.3% South Africa 23.9% Swaziland 12.3% 5.2% Zimbabwe 9.0% 6.7% Botswana 17.4% 8.7% Nigeria b 15.6% Ghana b 11.9% Niger 8.9% 5.4%
N / A
N / A
N / A N / A
5.9%
6.6% 7.4%
11.4%
6.4%
N / A
N / A
N / A N / A
a Rural includes rural areas and secondary towns. b Manufacturing enterprises only. Sources: Liedholm and Mead (1992), Daniels and Fisseha (1992).
5 Table 2 includes data only from finns which have not failed.
M.A. McPherson /Journal of Development Economics 48 (1996) 253-277
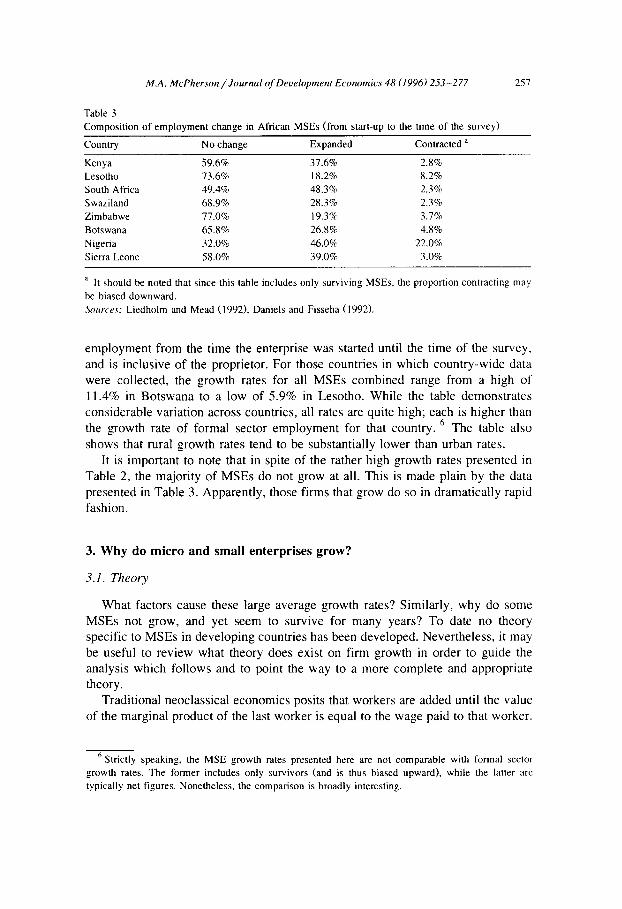
Table 3 Composition of employment change in African MSEs (from start-up to the time of the survey)
257
Country No change Expanded Contracted a
Kenya 59.6% 37.6% 2.8% Lesotho 73.6% 18.2% 8.2% South Africa 49.4% 48.3% 2.3% Swaziland 68.9% 28.3% 2.3% Zimbabwe 77.0% 19.3% 3.7% Botswana 65.8% 26.8% 4.8% Nigeria 32.0% 46.0% 22.0% Sierra Leone 58.0% 39.0% 3.0%
a It should be noted that since this table includes only surviving MSEs, the proportion contracting may be biased downward. Sources: Liedholm and Mead (1992), Daniels and Fisseha (1992).
employment from the time the enterprise was started until the time of the survey, and is inclusive of the proprietor. For those countries in which country-wide data were collected, the growth rates for all MSEs combined range from a high of 11.4% in Botswana to a low of 5.9% in Lesotho. While the table demonstrates considerable variation across countries, all rates are quite high; each is higher than the growth rate of formal sector employment for that country. 6 The table also shows that rural growth rates tend to be substantially lower than urban rates.
It is important to note that in spite of the rather high growth rates presented in Table 2, the majority of MSEs do not grow at all. This is made plain by the data presented in Table 3. Apparently, those firms that grow do so in dramatically rapid fashion.
3. Why do micro and small enterprises grow?
3.1. Theory
What factors cause these large average growth rates? Similarly, why do some MSEs not grow, and yet seem to survive for many years? To date no theory specific to MSEs in developing countries has been developed. Nevertheless, it may be useful to review what theory does exist on firm growth in order to guide the analysis which follows and to point the way to a more complete and appropriate theory.
Traditional neoclassical economics posits that workers are added until the value of the marginal product of the last worker is equal to the wage paid to that worker.
6 Strictly speaking, the MSE growth rates presented here are not comparable with formal sector growth rates. The former includes only survivors (and is thus biased upward), while the latter arc typically net figures. Nonetheless, the comparison is broadly interesting.
258 M.A. McPherson / Journal of Development Ecor~)mics 48 (1996) 253-277
This implies that firm growth will occur as a reaction to changes in technology, the wage rate, or the price of the product. As a result, if one is interested in why small firms in developing countries grow, this simple theory suggests that one's attention must focus on the factors that have an impact on supply and demand for the product produced by the MSE.
The 'stochastic' models 7 extended this simple static model by making it more dynamic: consideration is given to the evolution of firms over time. These models also introduced firm-specific costs. In this framework, firms draw each year's growth rate from a distribution. 'Lucky' firms repeatedly draw high rates and grow over time. These models were based on Gibrat's Law, the stylized fact that firm growth and firm size are independent. However, researchers began to find fault with the assumptions of the stochastic models, and empirical work demon- strated that Gibrat's Law does not hold.
This stochastic model was superseded in the theoretical literature by Jovanovic's (1982) 'learning model'. In this framework, efficient firms (that is, firms with able managers) grow over time, expanding each period when their managers observe that their guesses about their managerial efficiency turn out to have understated their true efficiency. 8 Jovanovic's model, in its simplest form, predicts that the annual growth rate of a firm will be a function of the accuracy of the manager's predictions regarding her ability, as well as the price of the product. The learning model also has implications about the relationships between growth rates and firm size and age. As a successful firm ages, its manager's estimate of his efficiency becomes increasingly accurate. This reduces the variance of the information-updat- ing density, which in turn reduces the probability that next period's output will be widely different from this year's. Therefore, on average older firms grow more slowly than younger ones. With respect to firm size, bigger firms grow more slowly controlling for firm age. Bigger firm have small values of the cost parameter (that is, they are more efficient). Such firms have less and less room for further increases, given that the information distribution has a lower bound.
The Jovanovic model has been criticized for the immutability of the efficiency parameter. In that model, managers are born with an efficiency level, and while they learn what that level is over time, they cannot alter it. Pakes and Ericson (1987) extended the basic model to allow this parameter to be changed through human capital formation. Those firms with managers possessing greater stocks of human capital should be more efficient, and therefore should grow relatively faster.
Another strand of the literature involves economies of scope at the firm level. Teece (1980), building on the work of Penrose (1959) and Williamson (1975),
7 See for example Simon and Bonini (1958), and ljiri and Simon (1964). 8 Jovanovic assumes demand to be deterministic, and the only firm-specific cost is that associated
with managerial inefficiency. There is no technological change in this model.
M.A. McPherson / Journal of Development Economics 48 (1996) 253-277 259
theorizes that when the market for proprietary know-how does not function efficiently, or when an input is specialized and indivisible, a firm may find it more sensible to expand (diversify) than to sell the know-how or input to another firm producing a different product. This approach emphasizes the internal dynamics of the administrative structure of each firm. While this strand seems likely to offer some useful insights into the process of firm growth, such an analysis is beyond the scope of this paper.
3.2. Empirical evidence
Empirical evidence from the U.S. (Evans, 1987; Dunne et al., 1989) and from the developing world (Chuta, 1989) has repeatedly supported the inverse relation- ship between firm growth and both firm age and size that is posited by Jovanovic 's theory. In addition to firm age and size, demand and supply factors, such as sector and location, enter into the growth decisions of individual firms, since they influence the product and input prices. The learning model assumes all firms produce a homogeneous product. Firms in different sectors face different product demands, as well as being different on the cost side (e.g., inputs are more or less costly to obtain; competition is more or less stiff). Therefore, if we intend to consider a group of heterogeneous MSEs, we must allow for differences in sector. Sectoral differences in growth rates have been shown by Phillips and Kirchoff (1988) for small firms in the U.S. and by Chuta (1989) for enterprises in Nigeria. With respect to location, a firm's proximity to demand sources and to concentra- tions of competition must influence its profitability. In addition, the work of Piore and Sabel (1984), Sengenberger et al. (1991), Pyke et al. (1990) and others 9 highlights the importance of agglomeration externalities in firm growth. These externalities come from many small firms locating near each other and building reliable supplier and buyer relationships within the group. This literature suggests that firms grouped together in urban areas may be able to specialize in particular products and produce at lower cost than would otherwise be the case. Such firms, then, would be more likely to be in a position to expand. Finally, the location of the premises may imply differential costs regarding rent payments. For example, home-based enterprises (HBEs) may pay less in rental costs than a shop in the commercial district.
There is an extensive literature regarding the determinants of the supply of entrepreneurship. Not only have economists taken an interest in this topic, sociologists and psychologists have studied the issue as well. While it is not the point of this paper to test these various theories, ~0 they indicate that the
9 See Asmussen (1993) for a discussion of flexible specialization in the developing country context. ~o Theories of entrepreneurship are nicely summarized in "Hunting the Heffalump', Kilby's essay in
Entrepreneurship and Economic Development.
260 M.A. McPherson / Journal of Development Economics 48 (1996) 253-277
socio-economic background of the proprietor may be an important determinant of her entrepreneurial ability and aggressiveness. The performance of a firm (includ- ing its growth) likely depends in part on the level of human capital embodied in its proprietor. For example, Bates (1990) finds that the educational level of the proprietor is positively and significantly related to small firm longevity (and thus, perhaps, firm growth). This finding echoes that of Douglass (1976). Evans and Leighton (1989) find that education, experience, and previous self employment are important determinants of the probability of starting a small enterprise. Cortes et al. (1987) argue that while older proprietors are likely to be more experienced than younger ones, they also may be "less inclined or less able to make their firms grow". ~] For metalworking firms in Colombia, proprietor age and firm growth rates are inversely related.
Other proprietor characteristics might also influence enterprise growth. Evans and Leighton provide evidence that the marital status of the proprietor is a significant determinant of the likelihood of starting a small business. A final example involves proprietor gender. Since, traditionally, female-generated funds are used to cover the family's basic needs, female proprietors may avoid taking the risks involved with firm expansion. 12
3.3. Hypotheses regarding small firm growth
Several groups of factors, then, may influence the profitability of MSEs, and therefore their growth. These factors can be summarized in the following hypothe- ses:
1. Jovanovic's model implies that firm growth is inversely related both to firm age and firm size.
2. The sector in which the MSE operates influences its growth.
3. Firm location helps determine a firm's growth rate. In particular, agglomera- tion externalities imply that urban-based firms will grow faster than those located in rural areas.
4. The level of human capital in the firm's proprietor has a positive impact on firm growth. Entrepreneurs with larger stocks of human capital will be better able to adapt their enterprises to constantly changing business conditions. Other socio-economic factors, such as proprietor age and gender may also influence firm growth.
In the analysis that follows, these hypotheses will be examined in light of a new data set from several African countries. Before proceeding to the analysis,
i1 Cones et al. (1987, p. 165).
12 See Downing (1990) or Hom (1991).
M.A. McPherson / Journal of Development Economics 48 (1996) 253-277 26 I
however, issues of measurement of variables and the nature of the data must be discussed. These are taken up in the next two sections.
4. What is growth?
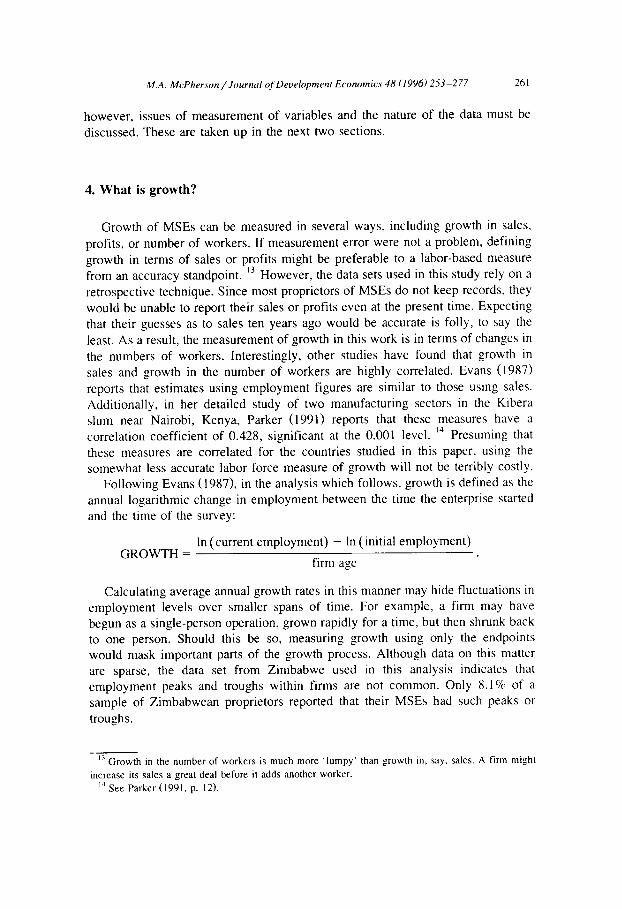
Growth of MSEs can be measured in several ways, including growth in sales, profits, or number of workers. If measurement error were not a problem, defining growth in terms of sales or profits might be preferable to a labor-based measure from an accuracy standpoint. ~3 However, the data sets used in this study rely on a retrospective technique. Since most proprietors of MSEs do not keep records, they would be unable to report their sales or profits even at the present time. Expecting that their guesses as to sales ten years ago would be accurate is folly, to say the least. As a result, the measurement of growth in this work is in terms of changes in the numbers of workers. Interestingly, other studies have found that growth in sales and growth in the number of workers are highly correlated. Evans (1987) reports that estimates using employment figures are similar to those using sales. Addit ionally, in her detailed study of two manufacturing sectors in the Kibera slum near Nairobi, Kenya, Parker (1991) reports that these measures have a correlation coefficient of 0.428, significant at the 0.001 level. ~4 Presuming that these measures are correlated for the countries studied in this paper, using the somewhat less accurate labor force measure of growth will not be terribly costly.
Following Evans (1987), in the analysis which follows, growth is defined as the annual logarithmic change in employment between the time the enterprise started
and the time of the survey:
GROWTH = In (current employment) - In (initial employment)
firm age
Calculating average annual growth rates in this manner may hide fluctuations in employment levels over smaller spans of time. For example, a firm may have begun as a single-person operation, grown rapidly for a time, but then shrunk back to one person. Should this be so, measuring growth using only the endpoints would mask important parts of the growth process. Although data on this matter are sparse, the data set from Zimbabwe used in this analysis indicates that employment peaks and troughs within firms are not common. Only 8.1% of a sample of Zimbabwean proprietors reported that their MSEs had such peaks or
troughs.
t3 Growth in the number of workers is much more "lumpy' than growth in, say. sales. A firm might increase its sales a great deal before it adds another worker.
14 See Parker (1991, p. 12).
262 M.A. McPherson /Journal of Development Economics 48 (1996) 253-277
5. Data and explanatory variables
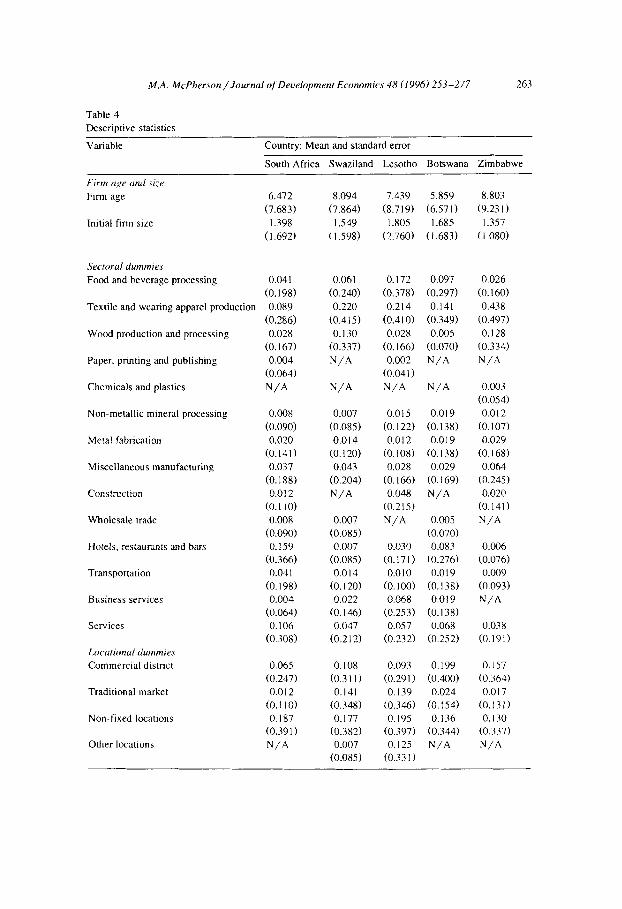
The data for this paper were generated by surveys in five southern African countries: Swaziland, Lesotho, Botswana, Zimbabwe and two South African townships. Briefly, the surveys employed a stratified cluster sampling technique. The countries were first divided into strata, and then clusters (usually enumeration areas established by the census bureaus) were randomly drawn within each stratum. For each cluster, every household and shop were visited to ascertain whether small enterprise activity was occurring at that site. t5 Data were collected from every MSE so located. ~6 Further details regarding the survey methodology can be found in the appendix or in McPherson and Parker (1991). Although each survey was conducted in largely the same manner, and for the most part, the same information was gathered in each country, not all variables are available for each country. This is the case because the survey process is evolutionary, and so questions were added or omitted from the basic questionnaire as time passed. Descriptive statistics for the variables used in each country can be found in Table 4.
The first set of variables measures firm age and size. Age is measured in years from the birth of the firm to the time of the survey and is in logarithmic terms. Firms started within 12 months of the survey date are considered to be one year old. Size is measured by the number of regular workers ~7 when the MSE was started, and is also in logarithmic form. In addition to these variables, a complete set of firm age-firm size quadratic and interaction terms are included. This follows Evans (1987) and Dunne et al. (1989), who found such terms to be significant in studies involving U.S. data.
The second category of variables defines the sector to which the MSE belongs. In the analysis that follows, a series of dummy variables reflecting 'membership' in sectors at the 2-digit International Standard Industrial Classification (ISIC) level are employed. In all cases, the reference case is retail trading.
The third group of variables defines enterprise location. Location is modeled using several sets of dummy variables. The first set involves location of the premises (home-based, traditional market, commercial-district, or non-permanent). The second group measures whether the firm is located in an urban or a rural area, and thus may provide insights into the strength of agglomeration externalities.
~5 The preponderance of enterprises falls into the microenterprise category of one to ten workers.
Roughly 90% of the sample consists of such firms. ~6 On average, roughly one-third of households visited in each country was closed to enumerators,
usually because no one was present to answer questions. Evidence from a survey in Kenya (Parker and
Dondo, 1991) indicates that the characteristics of those households or enterprises enumerated and those where no respondent was present are quite similar.
~7 Regular workers are defined to include all proprietors, paid workers, unpaid family members, or
apprentices who work in the MSE on a regular basis.
M.A. McPherson / Journal of Development Economics 48 (1996) 253-277 263
Table 4 Descriptive statistics
Variable Country: Mean and standard error
South Africa Swaziland Lesotho Botswana Zimbabwe
Firm age and size Firm age
Initial firm size
6.472 8.094 7.439 5.859 8.803 (7.683) (7.864) (8.719) (6.571) (9.231)
1.398 1.549 1.805 1.685 1.357 (1.692) (1.598) (2.760) (1.683) (i.080)
Sectoral dummies Food and beverage processing 0.041
(0.198) Textile and wearing apparel production 0.089
(0.286) Wo~KI production and processing 0.028
(0.167) Paper, printing and publishing 0.004
(0.064) Chemicals and plastics N/A
Non-metallic mineral processing 0.008 (O.O9O)
Metal fabrication 0.020 (0.141)
Miscellaneous manufacturing 0.037 (0.188)
Construction 0.012 (0. I I 0)
Wholesale trade 0.008 (0.090)
Hotels, restaurants and bars 0.159 (0.366)
Transportation 0.041 (0.198)
Business services 0.004 (0.064)
Services 0.106 (0.308)
Locational dummies Commercial district 0.065
(0.247) Traditional market 0.012
(0.110) Non-fixed locations 0.187
(0.391) Other locations N/A
0.061 0.172 0.097 0.026 (0.240) (0.378) (0.297) (0.160) 0.220 0.214 0.141 0.438
(0.415) (0.410) (0.349) (0.497) 0.130 0.028 0.005 0.128
(0.337) (0.166) (0.070) (0.334) N/A 0.002 N/A N/A
(0.041 ) N/A N/A N/A 0.003
(0.054) 0.007 0.015 0.019 0.012
(0.085) (0.122) (0.138) (0.107) 0.014 0.012 0.019 0.029
(0.120) (0.108) (0.138) (0.168) 0.043 0.028 0.029 0.064
(0.204) (0.166) (0.169) (0.245) N/A 0.048 N/A 0.020
(0.215) (0.141) 0.007 N/A 0.005 N/A
(0.085) (0.070) 0.007 0.030 0.083 0.006
(0.085) (0.171) (0.276) (0.076) 0.014 0.010 0.019 0.009
(0.120) (0.100) (0.138) (0.093) 0.022 0.068 0.019 N/A
(0.146) (0.253) (0.138) 0.047 0.057 0.068 0.038
(0.212) (0.232) (0.252) (0391)
0.108 0.093 0.199 0.157 (0.311) (0.291) (0.400) (0.364) 0.141 0.139 0.024 0.017
(0.348) (0.346) (0.154) (0.131 ) 0.177 0.195 0.136 0.130
(0.382) (0.397) (0.344) (0.337) 0.007 0.125 N/A N/A
(0.085) (0.331 )
264 M.A. McPherson / Journal t~'Development Economics 48 (1996) 253-277
Table 4 (continued)
Variable Country: Mean and standard error
South Africa Swaziland Lesotho Botswana Zimbabwe
Locational dummies Urban areas
Secondary towns
N/A 0.570 0.225 0.301 0.577 (0.496) (0.418) (0 .460) (0.495)
N/A 0.235 0.611 0.558 0.258 (0.425) (0.488) (0 .498) (0.438)
Human capital variables Years of experience N/A
Dummy for completion of N/A primary school
Dummy for completion of N/A secondary school
Dummy for ownership of 0.256 multiple MSEs (0.437)
Dummy for ownership of N/A defunct MSE
Dummy for training 0.154 (0.362)
Dummy for membership in N/A business support group
Socio-economic variables Dummy for female proprietorship
Dummy for belonging to majority ethnic group
Proprietor age
Dummy for martial status of proprietor Household size
Sample size
8.271 N/A 7.408 N/A (8.694) (7.623) 0.347 N/A 0.621 0.542
(0.477) (0.486) (0.499) 0.448 N/A 0.126 0.380
(0.498) (0.333) (0.486) 0.181 0.104 0.223 0.290
(0.385) (0.305) (0 .417) (0.454) 0.173 N/A N/A 0.110
(0.379) (0.314) 0.213 0.214 0.175 0.217
(0.410) (0.410) (0 .381) (0.413) 0.065 N/A N/A N/A
(0.247)
0.553 0.791 0.643 0.743 0.609 (0.498) (0.408) (0.480) (0 .438) (0.489) N/A 0.928 0.973 N/A 0.957
(0.259) (0.161) (0.204) N/A N/A 43.364 40.529 38.243
(13.751) (11.636) (13.058) N/A 0.693 N/A 0.505 N/A
(0.462) (0.501 ) N/A 7.433 N/A 6.631 6.244
(5.632) (3.689) (3.433) 244 277 599 206 345
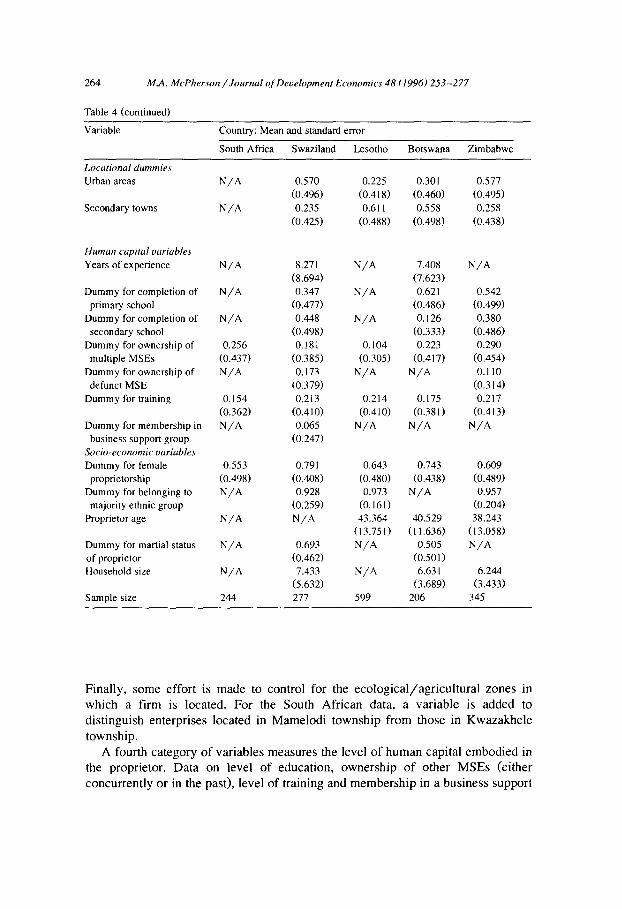
Finally, some effort is made to control for the ecological/agricultural zones in which a firm is located. For the South African data, a variable is added to distinguish enterprises located in Mamelodi township from those in Kwazakhele township.
A fourth category of variables measures the level of human capital embodied in the proprietor. Data on level of education, ownership of other MSEs (either concurrently or in the past), level of training and membership in a business support
M.A. McPherson / Journal of Development Economics 48 (1996) 253-277 265
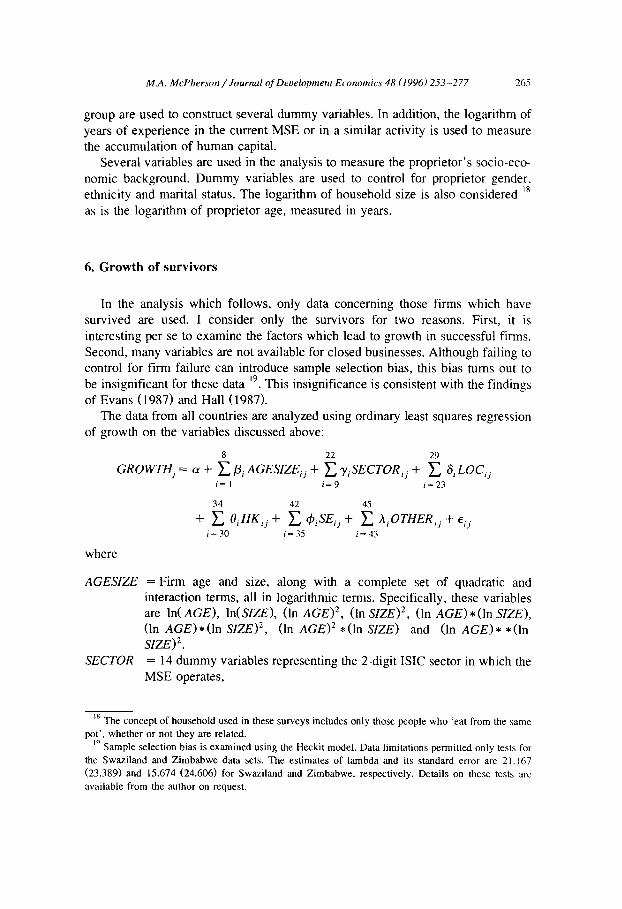
group are used to construct several dummy variables. In addition, the logarithm of years of experience in the current MSE or in a similar activity is used to measure the accumulation of human capital.
Several variables are used in the analysis to measure the proprietor's socio-eco-
nomic background. Dummy variables are used to control for proprietor gender, ethnicity and marital status. The logarithm of household size is also considered ~8 as is the logarithm of proprietor age, measured in years.
6. Growth of survivors
In the analysis which follows, only data concerning those firms which have
survived are used. I consider only the survivors for two reasons. First, it is
interesting per se to examine the factors which lead to growth in successful firms. Second, many variables are not available for closed businesses. Although failing to control for firm failure can introduce sample selection bias, this bias turns out to be insignificant for these data ~9. This insignificance is consistent with the findings of Evans (1987) and Hall (1987).
The data from all countries are analyzed using ordinary least squares regression of growth on the variables discussed above:
8 22 29 GROWTHj = ot + ~_, fli AGESIZEij + ~ T~SECTOR~j + ~_, t3~ LOC~j
i= 1 i=9 i=23
34 42 45
+ E OiHKij + E &iSEij + E AiOTHERij +eij i= 30 i= 35 i= 43
where
AGESIZE
SECTOR
= Firm age and size, along with a complete set of quadratic and interaction terms, all in logarithmic terms. Specifically, these variables are In(AGE), In(SIZE), (In AGE) 2, (In SIZE) 2, (In AGE)*(InSIZE), (In AGE)*(ln SIZE) 2, (In AGE) 2 *(In SIZE) and (In AGE)* *(In SIZE) 2. = 14 dummy variables representing the 2-digit ISIC sector in which the MSE operates,
t8 The concept of household used in these surveys includes only those people who 'eat from the same pot', whether or not they are related.
~9 Sample selection bias is examined using the Heckit model. Data limitations permitted only tests for the Swaziland and Zimbabwe data sets. The estimates of lambda and its standard error are 21.167 (23.389) and 15.674 (24.606) for Swaziland and Zimbabwe, respectively. Details on these tests are available from the author on request.
266 M.A. McPherson / Journal o f Development Economics 48 (1996) 253-277
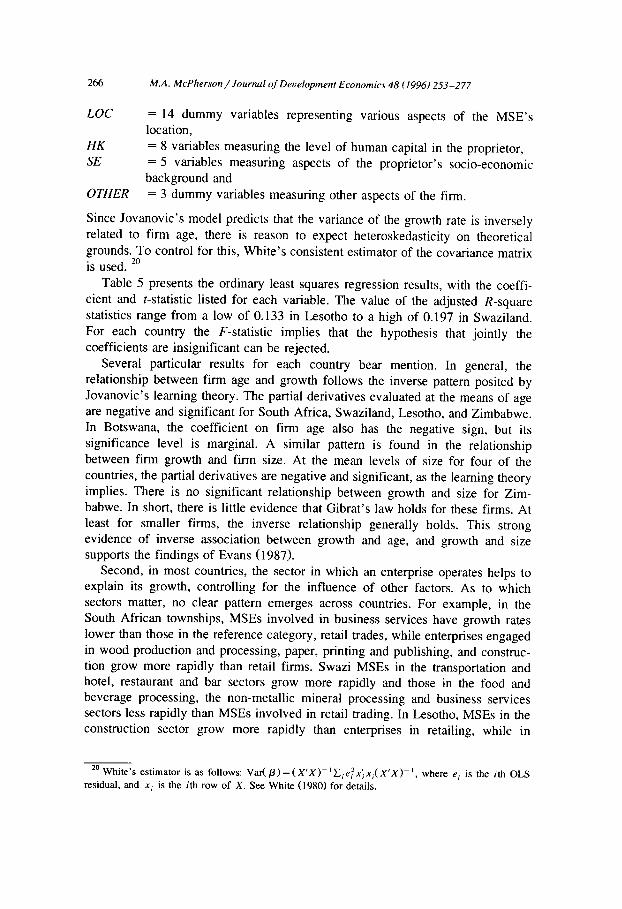
LOC = 14 dummy variables representing various aspects of the MSE's location,
HK = 8 variables measuring the level of human capital in the proprietor, SE = 5 variables measuring aspects of the proprietor's socio-economic
background and OTHER = 3 dummy variables measuring other aspects of the firm.
Since Jovanovic's model predicts that the variance of the growth rate is inversely related to firm age, there is reason to expect heteroskedasticity on theoretical grounds. To control for this, White's consistent estimator of the covariance matrix is used. 2o
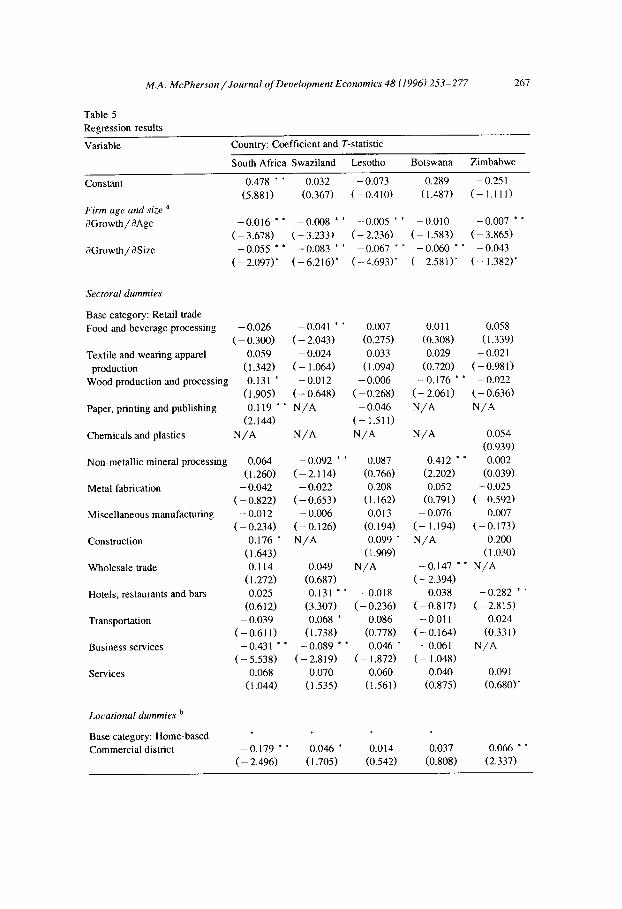
Table 5 presents the ordinary least squares regression results, with the coeffi- cient and t-statistic listed for each variable. The value of the adjusted R-square statistics range from a low of 0.133 in Lesotho to a high of 0.197 in Swaziland. For each country the F-statistic implies that the hypothesis that jointly the coefficients are insignificant can be rejected.
Several particular results for each country bear mention. In general, the relationship between firm age and growth follows the inverse pattern posited by Jovanovic's learning theory. The partial derivatives evaluated at the means of age are negative and significant for South Africa, Swaziland, Lesotho, and Zimbabwe. In Botswana, the coefficient on firm age also has the negative sign, but its significance level is marginal. A similar pattern is found in the relationship between firm growth and firm size. At the mean levels of size for four of the countries, the partial derivatives are negative and significant, as the learning theory implies. There is no significant relationship between growth and size for Zim- babwe. In short, there is little evidence that Gibrat 's law holds for these firms. At least for smaller firms, the inverse relationship generally holds. This strong evidence of inverse association between growth and age, and growth and size supports the findings of Evans (1987).
Second, in most countries, the sector in which an enterprise operates helps to explain its growth, controlling for the influence of other factors. As to which sectors matter, no clear pattern emerges across countries. For example, in the South African townships, MSEs involved in business services have growth rates lower than those in the reference category, retail trades, while enterprises engaged in wood production and processing, paper, printing and publishing, and construc- tion grow more rapidly than retail firms. Swazi MSEs in the transportation and hotel, restaurant and bar sectors grow more rapidly and those in the food and beverage processing, the non-metallic mineral processing and business services sectors less rapidly than MSEs involved in retail trading. In Lesotho, MSEs in the construction sector grow more rapidly than enterprises in retailing, while in
2o Whi te ' s est imator is as follows: Var( /3) = ( X ' X ) - I E i e ~ x ' i x i ( X ' X ) i, where e i is the ith OLS residual, and x i is the ith row of X. See White (1980) for details.
M.A. McPherson / Journal o f Development Economics 48 (1996) 253-277 267
Tab le 5
Reg re s s ion resul ts
Var iab le Country: Coef f i c ien t and T-statistic
South Af r i ca Swaz i l and Leso tho B o t s w a n a Z i m b a b w e
Cons tan t 0 .478 * * 0 .032
(5 .881) (0 .367)
Firm age and size a a G r o w t h / 0 A g e - 0 . 0 1 6 * * - 0 . 0 0 8 * *
( - 3 .678) ( - 3 .233)
O G r o w t h / O S i z e - 0 . 0 5 5 * * - 0 . 0 8 3 * *
( - 2.097)* ( - 6 . 2 1 6 ) *
- 0 .073 0 .289 - 0.251
( - 0 . 4 1 0 ) (1 .487) ( - 1 . 1 1 1 )
- 0 . 0 0 5 * * - 0 . 0 1 0 - 0 . 0 0 7 *
- 2 .236) ( - 1.583) ( - 3 .865)
- 0 . 0 6 7 * ~ - 0 . 0 6 0 ~* - 0 . 0 4 3
( - 4 . 6 9 3 ) * ( - 2 . 5 8 1 ) * ( - 1 . 3 8 2 ) *
Sectoral dummies
Base ca tegory : Retai l t rade
F o o d and b e v e r a g e process ing - 0 . 0 2 6 - 0 . 0 4 1 * * 0 .007
( - 0 .300) ( - 2 .043) (0 .275)
Text i le and wea r ing appare l 0 .059 - 0 .024 0.033
product ion (1 .342) ( - 1.064) (1 .094)
W o o d product ion and p rocess ing 0.131 * - 0 .012 - 0 .006
(1 .905) ( - 0 .648) ( - 0 .268)
Paper , pr int ing and publ i sh ing 0 .119 * * N / A - 0 .046 (2 .144) ( - 1.511)
C h e m i c a l s and plast ics N / A N / A N / A
Non-me ta l l i c minera l p rocess ing 0 .064 - 0 .092 * * 0 .087 (1 .260) ( - 2 .114) (0 .766)
Metal fabr icat ion - 0 .042 - 0 .022 0 .208 ( - 0 . 8 2 2 ) ( - 0 . 6 5 3 ) ( I . 1 6 2 )
Misce l l aneous m a n u f a c t u r i n g - 0 .012 - 0 .006 0.013
( - 0 . 2 3 4 ) ( - 0 . 1 2 6 ) (0 .194)
Cons t ruc t ion 0 .176 * N / A 0 .099 * (1 .643) (1 .909)
Who le sa l e t rade 0 .114 0 .049 N / A
( 1.272) (0 .687)
Hote ls , res taurants and bars 0 .025 0.131 * * - 0 . 0 1 8
(0 .612) (3 .307) ( - 0 .236)
Transpor ta t ion - 0 .039 0 .068 * 0 .086
( - 0 . 6 1 1 ) (1 .738) (0 .778)
Business se rv ices - 0 . 4 3 1 * * - 0 . 0 8 9 * * - 0 . 0 4 6 *
( - 5 .538) ( - 2 .819) ( - 1.872)
Se rv ices 0 .068 0 .070 0 .060 (1 .044) (1 .535) (1 .561)
0.011 0 .058
(0 .308) (1 .339)
0 .029 - 0.021
(O.720) ( - 0 .981)
- 0 . 1 7 6 " * - 0 . 0 2 2
( - 2 . 0 6 1 ) ( - 0 . 6 3 6 )
N / A N / A
N / A 0 .054
(O.939)
0 .412 * * 0 .002
(2 .202) (0 .039)
0 .052 - 0 .025
(0.791 ) ( - 0 .592)
- 0 .076 - 0 .007
( - 1.194) ( - 0 . 1 7 3 )
N / A 0 .200
(1 .030)
- 0 . 1 4 7 " * N / A
( - 2 .394)
- 0 .038 - 0 .282 * *
( - 0 . 8 1 7 ) ( - 2 . 8 1 5 )
- 0.011 0 .024
( - 0 . 1 6 4 ) (0 .331)
- 0 . 0 6 1 N / A
( - 1.048)
0 .040 0.091
(0 .875) (0.680)*
Locational dummies b
Base ca tegory : H o m e - b a s e d
C o m m e r c i a l dis t r ic t - 0 . 1 7 9 * * 0 .046 * 0 .014 0.037 0 .066 * *
( - 2 .496) (1 .705) (0 .542) (0 .808) (2 .337)
268 M.A. McPherson / Journal o f Development Economics 48 (1996) 253-277
Table 5 (continued)
Variable Country: Coefficient and T-statistic
South Africa Swaziland Lesotho Botswana Zimbabwe
Locational dummies o Traditional market 0.044
(0.892) Non-fixed locations - 0.006
( -0 .131) Other locations N / A
Base category: Rural areas Urban areas N / A
Secondary towns N / A
Human capital variables Years of experience N / A
Completion of primary N / A school
Completion of secondary N / A school
Ownership of multiple 0.036 MSEs (1.354)
Ownership of defunct N / A MSE Training 0.030
(0.491) N / A Membership in business
support group
0.010 0.065 * * 0.023 0.020 (0.363) (2.714) (0.552) (0.546) 0.144 0.050 * - 0.006 0.033
(1.141) (t.884) ( -0 .177) (1.169) 0.015 0.181 * * N / A N / A
(0.810)* (3.670)* *
0.035 * * 0.038 0.033 0.032 (2.851) (1.617) (1.041) (0.958) 0.004 0.030 * - 0.028 0.001
(0.202) ( 1.891) ( - 1.025) (0.050)
0.018 N / A 0.090 * * N / A (1.515) (2.193)
-0.001 N / A 0.021 0.029 ( - 0.046) (0.697) (1.360)
0.011 N / A 0.095 * * 0.067 * * (0.585) (2.325) (1.983) 0.016 0.068 * -0.032 -0.012
(0.940) (1.835) ( - 1.391) ( - . 783) 0.026 N / A N / A 0.034
(1.616) (1.568) - 0.024 0.071 * * - 0.005 0.044
( - 1.323) (2.899) ( -0 .150) (1.631) 0.010 N / A N / A N / A
(0.331)
Socio-economic variables Female proprietors - 0.130 * * - 0.059 * * - 0.027 - 0.057 * - 0.021
( -3 .153) ( -2 .283) ( - 1.375) ( - 1.795) ( -0 .746) Membership in majority N / A -0.079 0.022 N / A 0.058
ethnic group ( - 1.536) (0.266) (1.005) Proprietor age N / A N / A 0.021 - 0.071 0.084
(0.639) ( - 1.500) (1.626) Marital status of proprietor N / A -0.022 N / A -0.016 N / A
( - 1.557) ( - 0.629) Household size N / A 0.001 N / A 0.025 0.004
(0.129) (1.271) (0.328)
Botswana, wholesalers and wood processors grow more slowly and non-metallic mineral processors more rapidly than the reference case. Zimbabwean finns in the hotel, restaurant, and bar sector grow more slowly.
M.A. McPherson / Journal of Development Economics 48 (1996) 253-277
Table 5 (continued)
269
Variable Country: Coefficient and T-statistic
South Africa Swaziland Lesotho Botswana Zimbabwe
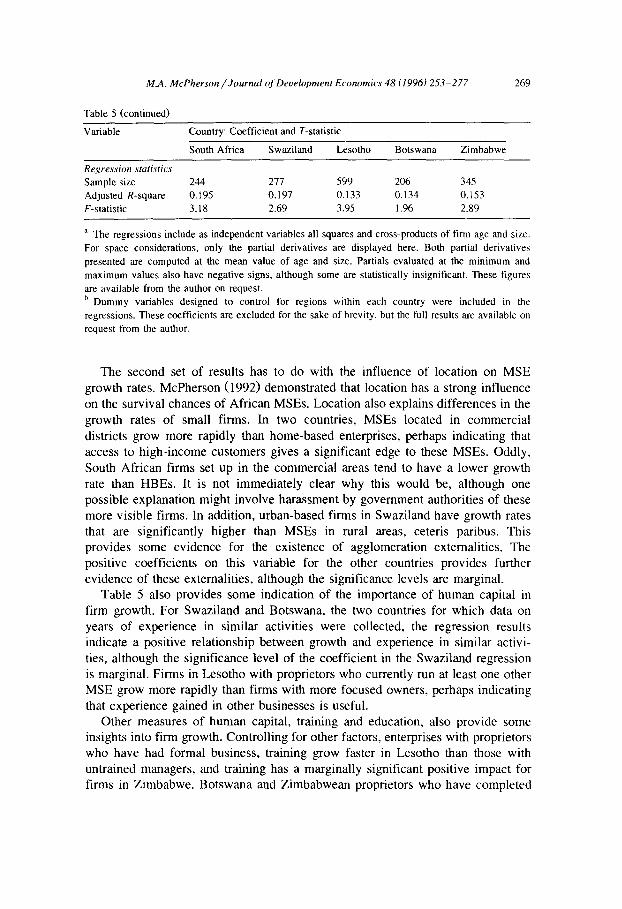
Regression statistics Sample size 244 277 599 206 345 Adjusted R-square 0.195 0.197 0.133 0.134 0.153 F-statistic 3.18 2.69 3.95 1.96 2.89
a The regressions include as independent variables all squares and cross-products of firm age and size. For space considerations, only the partial derivatives are displayed here. Both partial derivatives presented are computed at the mean value of age and size. Partials evaluated at the minimum and maximum values also have negative signs, although some are statistically insignificant. These figures are available from the author on request. b Dummy variables designed to control for regions within each country were included in the regressions. These coefficients are excluded for the sake of brevity, but the full results are available on request from the author.
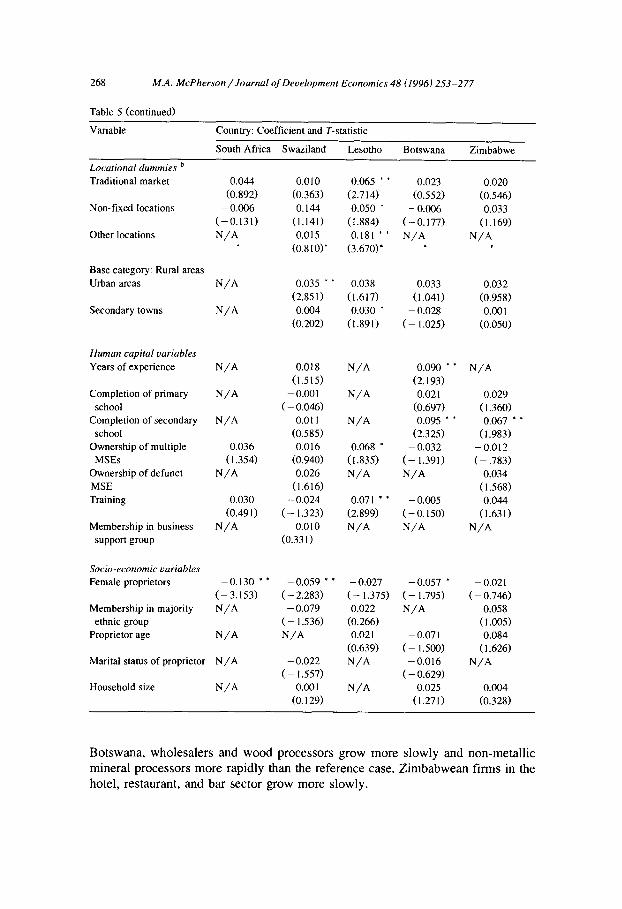
The second set of results has to do with the influence of location on MSE growth rates. McPherson (1992) demonstrated that location has a strong influence on the survival chances of African MSEs. Location also explains differences in the growth rates of small firms. In two countries, MSEs located in commercial districts grow more rapidly than home-based enterprises, perhaps indicating that access to high-income customers gives a significant edge to these MSEs. Oddly, South African firms set up in the commercial areas tend to have a lower growth rate than HBEs. It is not immediately clear why this would be, although one possible explanation might involve harassment by government authorities of these more visible firms. In addition, urban-based firms in Swaziland have growth rates that are significantly higher than MSEs in rural areas, ceteris paribus. This provides some evidence for the existence of agglomeration externalities. The positive coefficients on this variable for the other countries provides further evidence of these externalities, although the significance levels are marginal.
Table 5 also provides some indication of the importance of human capital in firm growth. For Swaziland and Botswana, the two countries for which data on years of experience in similar activities were collected, the regression results indicate a positive relationship between growth and experience in similar activi- ties, although the significance level of the coefficient in the Swaziland regression is marginal. Firms in I_esotho with proprietors who currently run at least one other MSE grow more rapidly than firms with more focused owners, perhaps indicating that experience gained in other businesses is useful.
Other measures of human capital, training and education, also provide some insights into firm growth. Controlling for other factors, enterprises with proprietors who have had formal business, training grow faster in Lesotho than those with untrained managers, and training has a marginally significant positive impact for firms in Zimbabwe. Botswana and Zimbabwean proprietors who have completed
270 M.A. McPherson / Journal of Development Economics 48 (1996) 253-277
secondary school run faster-growing firms than those proprietors with no school- ing. These results are consistent with Bates' findings for U.S. data. Education does not influence growth in Swaziland, and data on proprietor education were not collected in South Africa or Lesotho.
The results regarding the socio-economic characteristics of proprietors are more mixed. Although female-run finns in South Africa, Swaziland and Botswana grow more slowly than those run by males, proprietor gender does not matter for the other countries. Therefore, it would seem hasty to dismiss Downing's (1990) contention that female entrepreneurs in Africa tend to be more cautious managers. Cortes et al. (1987) argue that older proprietors are unable or unwilling to expand their enterprises. This notion receives only limited support from these data.
7. Differences across countries
In order to take advantage of all available data, the analysis so far has involved separate regressions for each country. While this has yielded some interesting insights into the factors contributing to MSE growth, it has made it difficult to understand whether growth rates differ across countries, controlling for other factors. While on the surface, MSEs in southern Africa seem to be remarkably similar in terms of product type and quality, marketing, and production technol- ogy, the countries under consideration here represent markedly different environ- ments. The countries differ vastly in their political, cultural, and historical contexts. There are also obvious economic differences, including a wide range of per capita income and significant differences in the regulatory environment. Some of these differences were discussed above and are presented in Table 1. While it is beyond the scope of this paper to attempt to separate out these complex and interrelated issues, it is useful to control for the influence of country on growth.
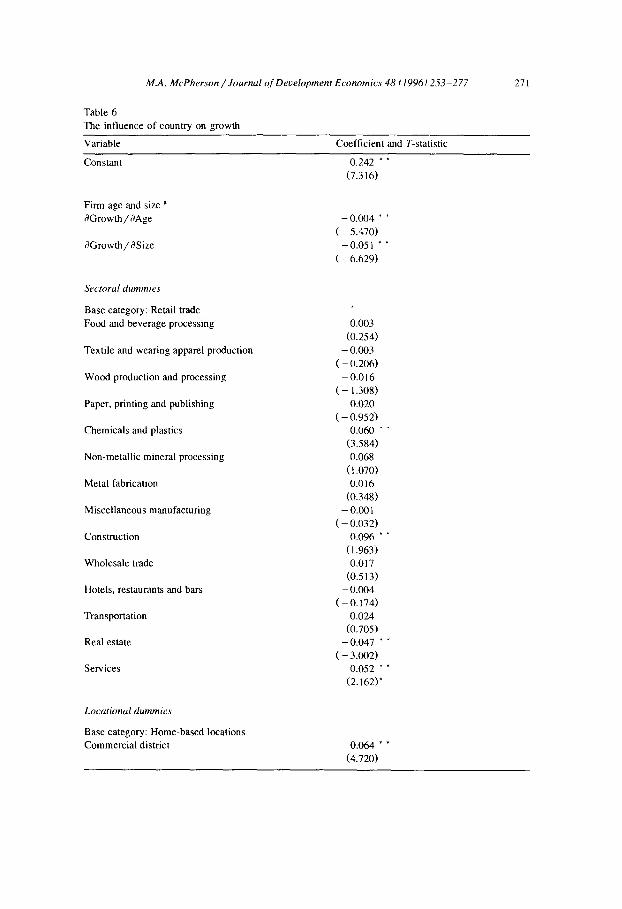
To examine this issue, the data from the five countries were pooled, and a single regression equation was estimated. All of the regressors common to all data sets were included in addition to four dummy variables modeling country in which the MSE is found. The regression results are presented in Table 6. One interesting result is that the coefficients on all of the country dummies are negative and significant. This indicates that MSEs in all countries grow more slowly than those in the South African townships, even after controlling for firm age, size, sector, locational and other factors.
Other findings reinforce those presented in the previous section. For example, the inverse relationships between firm age and firm size and growth continue to hold. Sectoral factors matter, with MSEs involved in chemicals and plastics, in construction and in services growing faster than retail traders, and firms in real estate activities growing less rapidly. It is also illuminating to aggregate the sectors up to the one-digit ISIC level. This analysis supports the finding that construction and services are faster growing, and real estate more stagnant, but adds the finding
M.A. McPherson / Journal of Development Economics 48 (1996) 253-277 271
Table 6
The influence o f count ry on growth
Variable Coeff ic ient and T-statistic
Constant 0 .242 * *
(7.316)
Firm age and size a
aGrowth / aAge
OOrowth / aSize
- 0 .004 * *
( - 5 .470)
- 0 . 0 5 1 * *
( - 6 .629)
Sectoral dummies
Base category: Retail trade
Food and beverage process ing
Textile and wear ing apparel product ion
W o o d product ion and process ing
Paper , pr int ing and publ ishing
Chemica l s and plastics
Non-metal l ic mineral processing
Metal fabricat ion
Miscel laneous manufac tu r ing
Const ruct ion
Wholesa le trade
Hotels, restaurants and bars
Transpor ta t ion
Real estate
Services
0.003
(0.254)
- 0 .003
( - 0 .206)
- 0 . 0 1 6
( - 1.308)
- 0 .020
( - 0 .952)
0 .060 * *
(3.584)
0.068
(1 .070)
0 .016
( 0 . 3 4 8 )
- 0.001
( - 0 .032)
0 .096 * *
(1.963)
0 .017
(0.513)
- 0 .004
( - 0 . 1 7 4 )
0 .024
(0.705)
- 0 .047 * *
( - 3 . 0 0 2 )
0.052 * *
(2.162)*
Locational dummies
Base category: Home-based locat ions
Commerc ia l district 0 .064 * *
(4 ,720)

272 M.A. McPherson / Journal of Development Economics 48 (1996) 253-277
Table 6 (continued)
Variable Coefficient and T-statistic
Locational dummies Traditional market 0.050 * *
(3.272) Non-fixed locations 0.020
(~.540) Other locations 0.156 * *
(3.698)"
Base category: MSEs in South Africa MSEs in Swaziland -0.086 * *
( -4 .914) MSEs in Lesotho - 0 . 1 1 2 *
( - 5.783) MSEs in Botswana - 0.087 * *
( -4 .319) MSEs in Zimbabwe - 0.079 * *
( - 3.995) Urban areas 0.022 * *
(2.213)
Human capital variables Ownership of multiple MSEs
Training
Socio-economic variables Female proprietorship
0.008 (0.764) 0.044 * *
(3.460)
- 0.055 * * ( - 4.729)
Regression statistics Sample size 1819 Adjusted R-square 0.146 F-statistic 10.13
a The regressions include as independent variables all squares and cross-products of finn age and size. For space considerations, only the partial derivatives are displayed here. Both partial derivatives presented are computed at the mean values of age and size. Partials evaluated at the minimum and maximum values also have negative signs, although some are statistically insignificant. These figures are available from the author on request.
that as a w h o l e M S E s in m a n u f a c t u r i n g s ec t o r s do no t g r o w at ra tes s i gn i f i c a n t l y
d i f f e ren t f r o m t h o s e in t rade.
F i r m s loca ted in c o m m e r c i a l d i s t r ic t s are at a g r o w t h a d v a n t a g e w h e n all
c o u n t r i e s are c o m b i n e d . F i r m s in t rad i t iona l m a r k e t s e t t i ngs a l so h a v e h i g h e r
g r o w t h rates: th is r e su l t w a s no t a p p a r e n t w h e n each c o u n t r y w a s c o n s i d e r e d
M.A. McPherson / Journal of Development Economics 48 (1996) 253-277 273
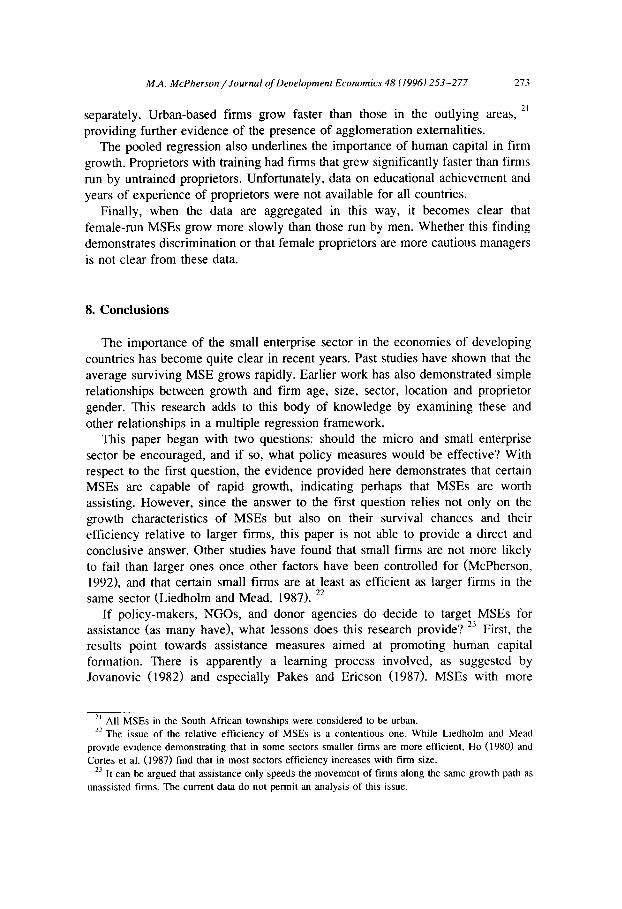
21 separately. Urban-based finns grow faster than those in the outlying areas, providing further evidence of the presence of agglomeration externalities.
The pooled regression also underlines the importance of human capital in firm growth. Proprietors with training had finns that grew significantly faster than firms run by untrained proprietors. Unfortunately, data on educational achievement and years of experience of proprietors were not available for all countries.
Finally, when the data are aggregated in this way, it becomes clear that female-run MSEs grow more slowly than those run by men. Whether this finding demonstrates discrimination or that female proprietors are more cautious managers is not clear from these data.
8. Conclusions
The importance of the small enterprise sector in the economies of developing countries has become quite clear in recent years. Past studies have shown that the average surviving MSE grows rapidly. Earlier work has also demonstrated simple relationships between growth and firm age, size, sector, location and proprietor gender. This research adds to this body of knowledge by examining these and other relationships in a multiple regression framework.
This paper began with two questions: should the micro and small enterprise sector be encouraged, and if so, what policy measures would be effective? With respect to the first question, the evidence provided here demonstrates that certain MSEs are capable of rapid growth, indicating perhaps that MSEs are worth assisting. However, since the answer to the first question relies not only on the growth characteristics of MSEs but also on their survival chances and their efficiency relative to larger finns, this paper is not able to provide a direct and conclusive answer. Other studies have found that small finns are not more likely to fail than larger ones once other factors have been controlled for (McPherson, 1992), and that certain small finns are at least as efficient as larger firms in the same sector (Liedholm and Mead, 1987). 22
If policy-makers, NGOs, and donor agencies do decide to target MSEs for assistance (as many have), what lessons does this research provide? 23 First, the results point towards assistance measures aimed at promoting human capital formation. There is apparently a learning process involved, as suggested by Jovanovic (1982) and especially Pakes and Ericson (1987). MSEs with more
2t All MSEs in the South African townships were considered to be urban. 22 The issue of the relative efficiency of MSEs is a contentious one. While Liedholm and Mead
provide evidence demonstrat ing that in some sectors smaller f inns are more efficient, Ho (1980) and
Cortes et al. (1987) find that in most sectors efficiency increases with finn size. 23 It can be argued that assistance only speeds the movement of f inns along the same growth path as
unassisted finns. The current data do not permit an analysis of this issue.

274 M.A. McPherson / Journal of Det;elopment Economics 48 (1996) 253-277
experienced, educated, and trained proprietors often grow more rapidly than those with proprietors possessing smaller stocks of human capital. Policy measures to develop human capital could include training and technical assistance programs, as well as policies promoting country-wide educational attainment.
Second, the finding that generally larger and older firms grow more slowly may imply that assistance aimed at smaller and younger firms may be worthwhile. However, as noted above, there are important efficiency and survival issues not addressed here. That is, the very smallest firms (typically one-person home-based enterprises) may not be good places to begin an assistance program, given that there is evidence that they are less efficient, are less likely to 'graduate' to a higher size categories (see Mead, 1994), and may be more likely to fail than firms only slightly larger.
Growth prospects are also differentiated by sector. In particular, in many of the countries studied here firms in the construction and service sectors show the most promise for rapid growth. Such firms, then, may warrant consideration for assistance programs aimed at the MSE sector.
Another result of the analysis above is that enterprises in commercial districts, and those in urban areas grow more rapidly than home-based and rural firms. This indicates that there may indeed be externalities generated by firms locating near each other. Governments may be able to encourage such agglomerations of firms by undertaking policies which encourage the establishment of businesses in urban and commercial areas. These could include, for example, cooperative marketing arrangements, or rent subsidies to encourage enterprises to move to commercial areas. These findings may also shed light on establishment of small commercial centers in rural areas (such as Zimbabwe's 'Growth Centre' program). If agglom- eration externalities are indeed important, such centers would likely have to be quite large to capture them.
This paper also points out the need for future research. The relatively modest values for the R-square statistic imply that the independent variables used are not explaining a great deal of the variation in firm growth rates. One likely cause of these low R-squares is the exclusion of a measure of entrepreneurial drive or dedication. Such a variable would be difficult to measure, but future research should direct some energy toward this end. It is also possible that the growth process for the enterprises in the sample has a large stochastic component, in which case the Jovanovic model would be unsatisfactory. 24
Future research that separates the microenterprises (1 to l0 workers) from the small enterprise category (11 to 50 workers) may also be fruitful. That is,
24 Given that this sample is dominated by microenterprises, it may be the case that growth of these tiniest of firms is closer to being a stochastic process, while firms in the small enterprise category might more closely follow Jovanovic's model. Unfortunately, the data do not allow a satisfactory investigation of this possibility.
M.A. McPherson / Journal of Development Economics 48 (1996) 253-277 275
microenterprises may behave quite differently than small enterprises. As noted above, microenterprises dominate the present data set; thus a separate analysis is not possible. Such an extension could yield important policy implications not captured here.
It is also possible that some MSEs are less able to grow than others because they face external constraints not measured in these data. As suggested by Steel and Takagi (1983) and Liedholm and Mead (1987), an important example of such an impediment is the presence of segmented capital markets. Clearly, an inability to obtain capital could constrain the growth prospect of MSEs. Although no data were available to examine this issue in the present paper, future research should address this important point.
More generally, improved data collection methods, especially those producing panel data, would enhance our understanding of the MSE growth process by permitting the collection of accurate data on flow variables such as sales, prices, and costs. Future work may also need to examine more closely the theory of MSE dynamics as a result of this empirical work. For example, while Jovanovic's model seems to describe the behavior of MSEs in a very general way, an expanded theory might explain why location and socio-economic factors seem to influence growth. The inclusion of such variables may lead to a more complete explanation of small firm growth.
While this paper does not represent the final word on the determinants of small firm growth, the analysis provides some important insights into the process, many of which may be immediately useful to those who intend to provide assistance and support to MSEs. A still better understanding of this issue would be a highly useful input into the decision-making processes of governments and assistance agencies.
9. For further reading
Casley and Lury (1987); Cochran (1977); Fisseha (1991); Fisseha and McPher- son (1991); Heckman (1976); Liedholm and McPherson (1991); Little et al. (1987); Mansfield (1962) and McPherson (1991).
Acknowledgements
The author gratefully acknowledges the helpful comments from Rowena Pec- chenino, Daniel Hamermesh, Carl Liedholm, Donald Mead, John Harris, Joan Parker, and three anonymous referees. This paper also benefitted from the suggestions of participants in the 1992 meeting of the Northeast Universities Development Consortium.
276 M.A. McPherson/Jourtvd of Development Economics 48 (1996) 253-277
References
Asmussen, Tore, 1993, The employment implications of flexible specialization in Zimbabwe, Draft
paper prepared for the ILO, Feb.
Bates, Timothy, 1990, Entrepreneur human capital inputs and small business longevity, The Review of
Economics and Statistics 72, no. 4.
Casley, D.J. and D.A. Lury, 1987, Data collection in developing countries (Clarendon Press, Oxford).
Chenery, Hollis, Montek S. Ahluwalia, C.L.G. Bell, John H. Duloy and Richard Jolly, 1974,
Redistribution with growth (Oxford University Press, London).
Chuta, E.J., 1989, A Nigerian study of firm dynamics, Draft paper (University of Maiduguri, Nigeria)
DCC.
Cochran, William G., 1977, Sampling techniques (Wiley, New York).
Cortes, Mariluz, Albert Berry and Ashfaq Ishaq, 1987, Success in small and medium scale enterprises:
The evidence from Colombia (Oxford University Press, New York).
Daniels, Lisa and Yacob Fisseha, 1992, Micro and small-scale enterprises in Botswana: Results of a
nation-wide survey, GEMINI technical report (Development Alternatives Inc., Bethesda, MD).
Douglass, Merrill E., 1976, Relating education to entrepreneurial success, Business Horizons, Dec.
Downing, Jeanne, 1990, Gender and the growth of microenterprises, GEMINI working paper no. 5
(Development Alternatives, Inc., Bethesda, MD) Oct.
Dunne, Timothy, Mark J. Roberts and Larry Samuelson, 1989, The growth and failure of U.S.
manufacturing plants, Quarterly Journal of Economics 104, no. 4, Nov.
Evans, David S. 1987, Tests of alternative theories of firm growth, Journal of Political Economy 95,
no. 4.
Evans, David S. and Linda S. Leighton, 1989, Some empirical aspects of entrepreneurship, American
Economic Review 79, no. 3.
Fisseha, Yacob, 1991, Small scale enterprises in Lesotho: Summary of a country-wide survey, GEMINI
technical report no. 14, Feb.
Fisseha, Yacob and Michael A. McPherson, Small enterprises in Swaziland: Results of a country-wide
survey, GEMINI technical report no. 24, Dec.
Government of Zimbabwe, 1991, Zimbabwe: A framework for economic reform (1991-1995)
(Government Printing Office, Harare).
Hall, Bronwyn, 1987, The relationship between firm size and firm growth in the US manufacturing
sector, Journal of Industrial Economics 35, no. 4.
He&man, James, 1976, The common structure of statistical models of truncation, sample selection and
limited dependent variables and a simple estimator for such models, Annals of Economic and
Social Measurement 5.
Ho, Samuel P.S., 1980, Small-scale enterprises in Korea and Taiwan, World Bank staff working paper
no. 384 (World Bank, Washington, DC).
Hodd, Michael, 1991, The economies of Africa (G.K. Hall & Company, Boston, MA).
Horn, Nancy E., 1991, Redefming economic productivity: Marketwomen and food provisioning in
Harare, Zimbabwe, Paper presented to African Studies Association, Nov.
Ijiri, Yuji and Herbert A. Simon, 1964, Business firm growth and size, The American Economic
Review 54, no. 2.
Jovanovic, Boyan, 1982, Selection and the evolution of industry, Econometrica 50, no. 3, May. Kilby, Peter, 1971, Hunting the heffalump, in: Peter Kilby, ed., Entrepreneurship and economic
development (The Free Press, New York).
Liedholm, Carl and Michael A. McPherson, 1991, Small-scale enterprises in Mamelodi and KwaZa-
khele townships, South Africa: Survey findings, GEMINI technical report no. 16, March.
Liedholm, Carl and Donald Mead, 1987, Small scale industries in developing countries: Empirical
evidence and policy implications, International development paper no. 9 (Michigan State Univer-
sity, East Lansing, MI).
M.A. McPherson / Journal of Development Economics 48 (1996) 253-277 277
Liedholm, Carl and Donald Mead, 1982, The structure and growth of microenterprises in southern and eastern Africa: Evidence from recent surveys, Draft paper (Department of Economics, Michigan State University, East Lansing, MI) Jan.
Little, lan, D. Mazumdar and John Page, 1987, Small manufacturing enterprises: A comparative analysis of India and other economies (Oxford University Press, Oxford).
Mansfield, Edwin, 1962, Entry, Gibrat's law, innovation, and the growth of firms, The American Economic Review 52, no. 5, 1023-1051.
McPherson, Michael A., 1991, Micro and small scale enterprises in Zimbabwe: Results of a country-wide survey, GEMINI technical report no. 24 (Development Alternatives, lnc., Bethesda, MD) Dec.
McPherson, Michael A., 1992, The hazards of small firms in southern Africa, Draft paper (Department of Economics, Michigan State University, East Lansing, MI).
McPherson, Michael A. and Joan C. Parker, 1991, A manual to conducting an MSE baseline survey of micro and small enterprises, GEMINl publication series, Field research section paper no. 1 (Development Alternatives, Inc., Bethesda, MD).
Mead, Donald C., 1994, The contribution of small enterprises to employment growth in southern and eastern Africa, Draft paper (Michigan State University, East Lansing, MI).
Pakes, Ariel and Richard Ericson, 1987, Empirical implications of alternative models of finn dynamics (Social Systems Research Institute, University of Wisconsin, Madison, WI).
Parker, Joan C., 1991, Defining and measuring business growth, Draft paper (Department of Eco- nomics, Michigan State University, East Lansing, MI) Oct.
Parker, Joan C. and C. Aleke Dondo, 1991, Kenya: Kibera's small enterprise sector: Baseline survey report, GEMINI working paper no. 17, April.
Penrose, Edith T., 1959, The theory of the growth of the firm (Wiley, New York). Phillips, Bruce D. and Bruce A. Kirchoff, 1988, Analysis of new finn survival and growth, Babson
Entrepreneurship Research Conference, Calgary, Canada, May. Piore, Michael J. and Charles F. Sabel, 1984, The second industrial divide: Possibilities for prosperity
(Basic Books, New York). Pyke, F., G. Becattini, and W. Sengenberger, eds., 1990, Industrial districts and inter-finn co-operation
in Italy (International Institute for Labour Studies, ILO, Geneva). Sengenberger, Werner, Gary W. Loveman and Michael J. Piore, eds., 1991, The re-emergence of small
enterprises: Industrial restructuring in industrialised countries (International Institute for Labour Studies, ILO, Geneva).
Simon, Herbert A. and Charles P. Bonini, 1958, The size distribution of business finns, The American Economic Review 48, no. 4.
Steel, William F. and Yasuoki Takagi, 1983, Small enterprise development and the employment-out- put trade-off, Oxford Economic Papers 35.
Teece, David J., 1980, Economies of scope and the scope of the enterprise, Journal of Economic Behavior and Organization 1.
White, Halbert, 1980, A heteroskedasticity-consistent covariance matrix estimator and a direct test for heteroskedasticity, Econometrica 48, no. 4.
Williamson, Oliver E., 1975, Markets and hierarchies: Analysis and anti-trust implications (Free Press, New York).
World Bank, 1993, World development report, 1993 (World Bank, Washington, DC).