growth of government spending for income assistance, a
TRANSCRIPT
94th Congress} 1st Session COMMITTEE PRINT
GROWTH OF GOVERNMENT SPENDING FOR INCOME ASSISTANCE:
A Matter of Choice
PREPARED BY THE
CONGRESSIONAL BUDGET OFFICE
62-228 0
FOR THE
COMMITTEE ON THE BUDGET UNITED STATES SENATE
DECE}IBER 3, 1975
Printed for the use 'Of the Committee on the Budget
U.S. GOVERNMENT PRINTING OFFICE
WASHINGTON : 1975
For sale by the Superlntendent 01 Documents, U.S. Government Printing Office Washington, D.C. 20402· Price .45 cents
COMMITI'EE ON TIlE BUDGET
EDMUND S, MUSKIE, Chainnan, Maine
WARREN G. MAGNUSON, Washington· HENRY BELLMON, Oklahoma FRANK E. MOSS, Utah "ROBERT DOLE, Kansas WALTER F. MONDALE, Minnesota J, GLENN BEALL, JR., Maryland ERNEST F. HOLLINGS, South Carolina JAMES L. BUCKLEY, New York ALAN CRANSTON, California JAMES A. MCCLURE, Idaho LAWTON CHILES, Florida PY.;TE V. DOMENICI, New Mexico JAMES ABOUREZK, South Dakota JOSEPH R. RIDEN, JR., Delaware SAM NCNN, Georgia
DOUGLAS J, BENNET, Jr" Staff Director JOHN T. MCEVoy, Chle/C(;l).nsel
ROBERT S. BOYD, Minority Staff Director W. TH011AS FOXWELL, DIrector 0' Publications
LETTER OF TRANSMITT 1\.L
TO THE MEMBERS OF THE BUDGET COMMITTEE: Must Federal income assistance programs inevitably consume a
larger and larger share of America's Gross National Product through the remainder of this century? The hrief answer is no.
In an effort to help answer this question, I requested the CongressionalBudget Office to prepare a study on behalf of the Senate Budget Committee projecting growth of Federal income assistance programs by the year 2000.
The CBO findings, presented in the following report, show that runaway growth is not inevitable, and that with prudent management Congress can provide assistance for citizens who need it without any significant increase in the share of GNP devoted to income assistance programs.
'fhe message emerging from the study is clear: The doomsday prophecy that growth in transfer payment programs will eat up larger and larger chunks of GNP as we near the year 2000 is based on the assumption-which I find highly unlikely-that the rate of legislated increases in such programs in recent years will continue unabated. In fact, the study suggests that the percent of GNP absorbed in these programs will not significantly increase during the next 25 years unlesR Congress adds new benefitR or additional programs. As. the study concludes, "continuation of the recent rapid growth in income assistance spending is not inevitable, but is rather a matter of choice for the Congress and the Executive Branch."
The challenge to the Budget Committee is to seek efficiencies leading to possible savings in present programs and carefully scrutinize suggested additionR to them. Through this study and others, we are making a beginning toward adjusting Federal programs to meet our needs and financial capacities.
As members of the Budget Committee, we must allocate our scarce Federal dollars so that the real needs of our people are met at the lowest sound cost. We must strive to assure that growth in Federal programs occurs only where a need consistent with our fiscal capacity is clearly demonstrated and that the maximum savings are achieved in present and proposed programs.
In keeping with CBO's mandate to provide nonpartisan analysis of policy optiona, the report contains no recommendations. Thia paper was prepared by John J. Korbel, with the assistance of Alan G. Fein, Marc P. Freiman, and Robert D. Reischauer, and under the direction of C. William Fischer.
EDMUND S. M USKIE, Ohairman,
Senate Oommittee on the Budget. (m)

CONTENTS Letter of transmittaL_ Summary_____________ _ ______________ _ Recent growth in Federal income assistance programs_ _ _ _ _ _ ______ _ The future: Projecting income assistance programs to the year 2000 _____ _ Resulting estima tes_ _ _ _ _ _ _ _____ .. _ Conclusion _____ .. __ _____ _ _ __________________________ _
Tables: Expenditures on Federal incomc assistance programs for fiscal years
19.55 and 1975 ______ _ Expenditures on Federal income assistance programs for fiscal years
1955 and 1975, and alternativc projections _________ _ Assumptions about cost of living and real income adjustments for
each projection case, by Government program_ _ _ _ _ _ _ _ _ ____ _ Caseloads and costs of Fed€ral income assistance programs _ _ ____ _
Charts: Program costs as a percent of total Federal incomc assistance for
fiscal year 1975 and year 2000_________ _ _______ _
(V)
Page III
VII 1 5 9
13
3
6
14 16
10

SUMMARY
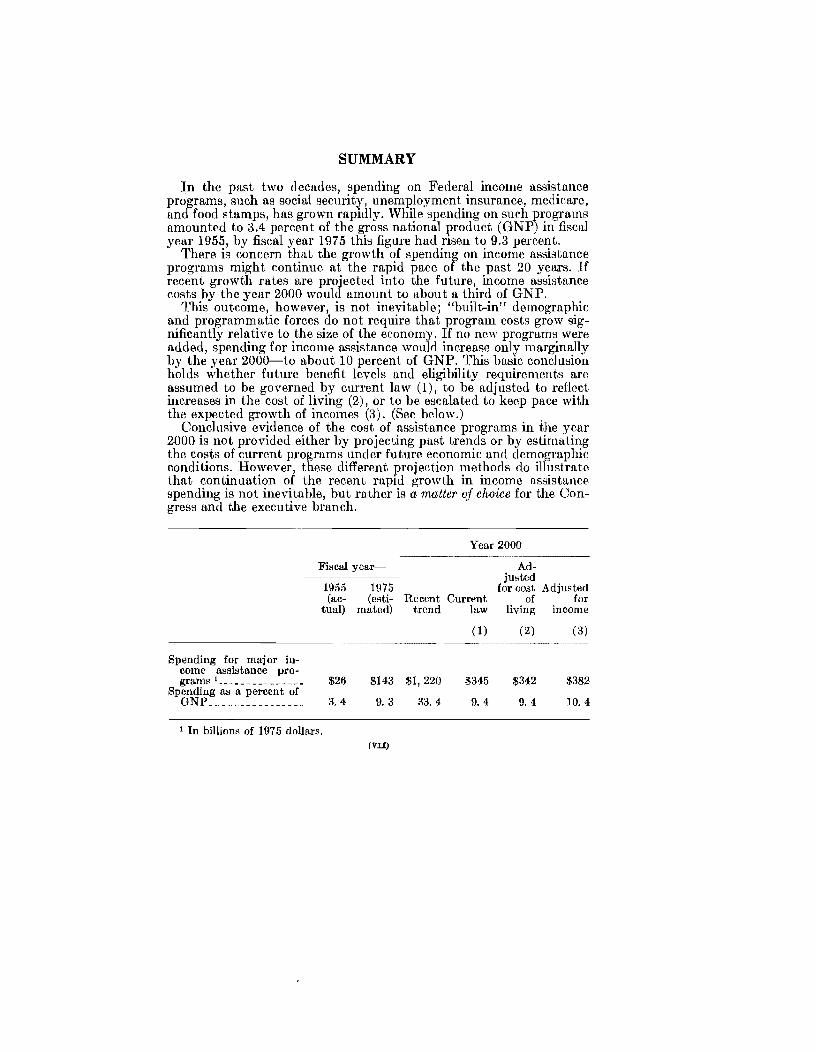
In the past two decades, spending on Federal income assistance programs, such as social security, unemployment insurance, medicare, and food stamps, has grown rapidly. "Vhile spending on such programs amounted to 3.4 percent of the gross national :product (GNP) in fiscal year 1955, by fiscal year 1975 this figure had TIsen to 9.3 percent.
There is concern that the growth of spending on income assistance programs might continue at the rapid pace of the past 20 years. If recent growth rates are projected into the future, income assistance costs by the year 2000 would amount to about a third of GNP.
This outcome, however, is not inevitable; "built-in" demogmphic and programmatic forces do not require that program costs grow significantly relative to the size of the economy. If no new programs were added, spending for income assistance would increase only marginally by the year 2000-to about 10 percent of GNP. This basic conclusion holds whether future benefit levels and eligibility requirements are assumed to be governed by CID'rent law (1), to be adjusted to reflect increases in the cost of living (2), or to be escalated to keep pace with the expected growth of incomes (3). (See below.)
Conclusive evidence of the cost of assistance progmms in the year 2000 is not provided either by projecting past trends or by estimating the costs of current progmmsunder future economic and demographic conditions. However, these different projection methods do illustrate that continuation of the recent mpid growth in income assistance spending is not inevitable, but rather is a matter of choice for the Congress and the executive branch.
Year 2000
Spending for major income assistance pro-grams 1____ _ _______ _
Spending as a percent of GNP ______________ _
Fiscal year-
1955 1975 (ac- (esti- Recent Current
tual) mated) trend law
$26
3.4
$143 $1,220
9.3 33.4
(1 )
$345
9.4
1 In billions of 1975 dollars. (VII)
Adjusted
for cost Adjusted of for
living income
(2)
$342
9.4
(3)
$382
10.4

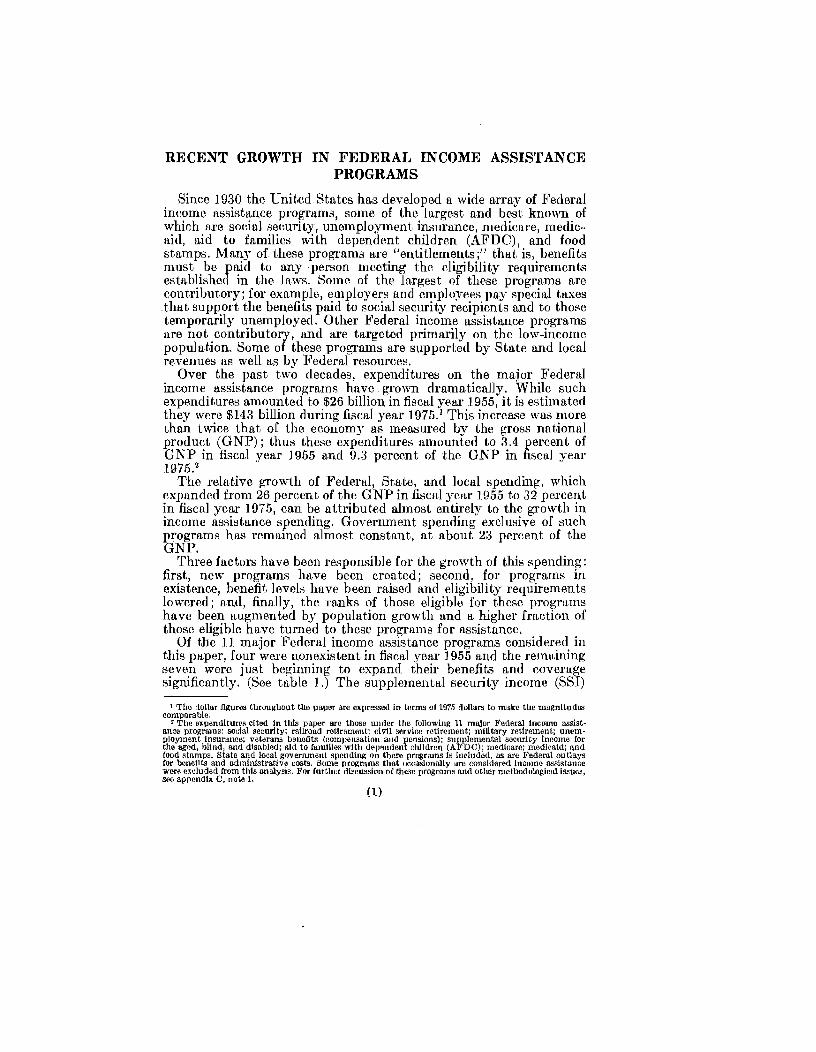
RECENT GROWTH IN FEDERAL INCOME ASSISTANCE PROGRAMS
Since 1930 the United States has developed a wide array of Federal income assistance programs, some of the largest and best known of which are social security, unemployment insurance, medicare, medicaid, aid to families with dependent children (AFDC), and food stamps. Many of these programs are "entitlements;" that is, benefits must be paid to any person meeting the eligibility requirements established in the laws. Some of the largest of these programs are contributory; for example, employers and employees pay special taxes
.. that support the benefits paid to social security recipients and to those temporarily unemployed. Other Federal income assistance programs are not contributory, and are targeted primarily on the low-income population. Some of these programs are supported by State and local revenues as well as by Federal resources.
Over the past two decades, expenditures on the major Federal income assistance programs have grown dramatically. While such expenditures amounted to $26 billion in fiscal year 1955, it is estimated they were $143 billion during fiscal year 1975.1 This increase was more than twice that of the economy as measured by the gross national product (GNP); thus these expenditures amounted to 3.4 percent of GNP in fiscal year 1955 and 9.3 percent of the GNP in fiscal year 1975.2
The relative growth of Federal, State, and local spending, which expanded from 26 percent of the GNP in fiscal year 1955 to 32 percent in fiscal year 1975, can be attributed almost entirely to the growth in income assistance spending. Government spending exclusive of such programs has remained almost constant, at about 23 percent of the GNP.
Three factors have been responsible for the growth of this spending: first, new programs have been created; second, for programs in existence, benefit levels have been raised and eligibility requirements lowered; and, finally, the ranks of those eligible for these programs ha ve been augmen ted by population growth and a higher fraction of those eligible have turned to these programs for assistance.
Of the 11 major Federal income assistance program" considered in this paper, four were nonexistent in fiscal year 1955 and the remaining seven were just beginning to expand their benefits and coverage significantly. (See table 1.) The supplemental security income (SS!)
I The dollar figures throughout the paper are expressed in wrllS of 1975 dollars to make the magnitudes comp~rable .
• The expenditures cited in this paper are those under the following 11 major Federal income assistance progrnms: social security; railroad retirement; civil service retirement; military retirement; unemployment Insurance; veterans benefits (compensation and pensions); supplement,a! security Income for the aged, blind and disabled; aid to families with dependent children (AFDC); medicare; medicaid; and food stamps. Staw and local government spending on these programs Is included, as are Federal outlays for oonefits and adminfstrative costs. Some programs that occasionally are considered income assistance were excluded from this analysis. For further discussion of these programs and other methodolDgicalissu<lS, see appendix C, note 1.
(1)
2
program, which replaced the federally aided assistance program for the aged, blind, and disabled; medicare, which assists the aged and disabled in meeting their medical costs; medicaid, which helps pay for medical care for low-income persons; and the food stamp program, which is intended to assist low-income families in securing an adequate diet have all been created in the past 12 years.
Covevage and benefit levels have expanded in most of the programs. Some disabled persons were added as beneficiaries to the social security program in 1956; this coverage was expanded in 1960, 1965, and 1967; military personnel were added in 1956; those over 72 with no opportunity to earn benefits were made eligible in 1966. From 1955 to 1975, social security benefit levels were raised eight times. An unusual 20 percent increase in benefits occurred in 1972 when a new financing structure was enacted. Also, the 1972 law required benefit levels to be adjusted periodically starting in 1974 to reflect increases in the cost of living. In 1971 eligibility tests and benefit levels for the food stamp program were made more generous and in 1974 benefits were extended to those eligible in all part,s of the Nation. Other programs have been expanded in similar fashion.
Increased populations and bigher participation rates have also resulted in greater spending under some of these programs. For example, the popUlation over age 64-the general recipient population for social secunty-grew by more than 50 percent during the past 20 years. Unemployment msurance casts have increased in large part because the labor force has grown by more than one-third since 1955 as children of the 1940's "baby boom" entered the labor force and as women increased their labor force participation. Under the AFDC program, participation has risen dramatically from something under 50 percent of those eligible in the 1950's tv close to 90 percent today.
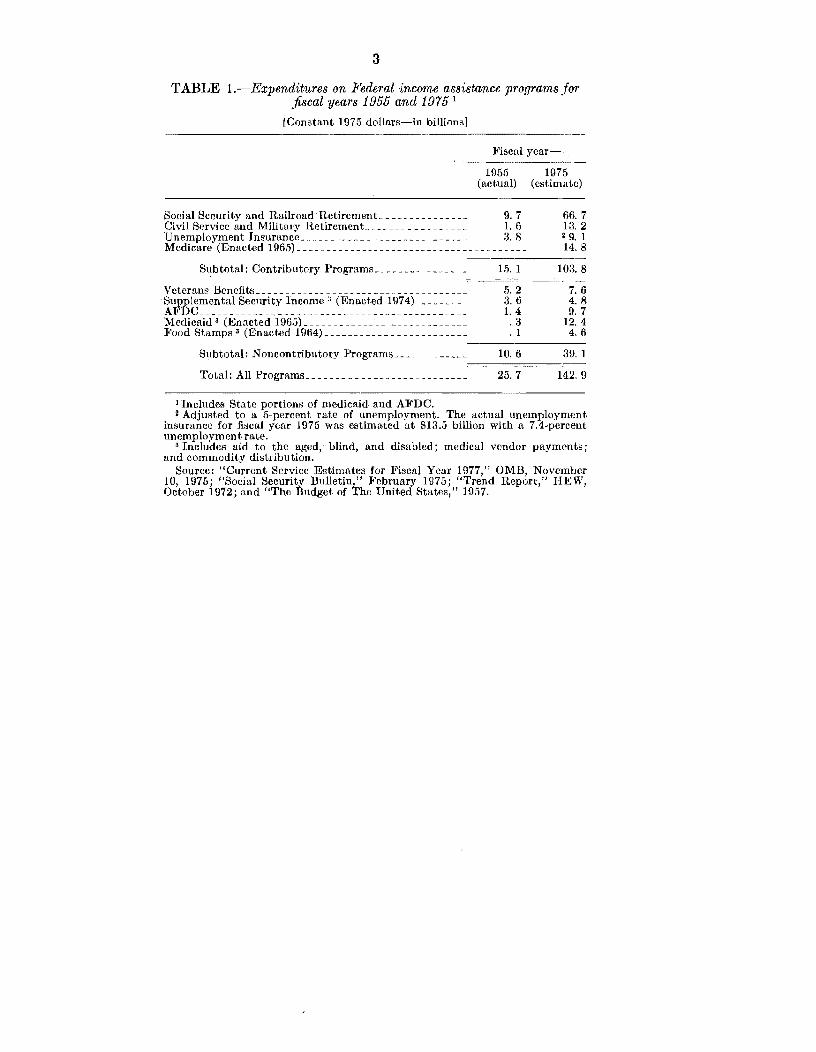
3
TABLE I.-Expenditures on Federal income assistance programs for fiscal years 19515 and 1975 1
[Constant 1975 dollars-in billions]
Social Security and Railroad Retirement- __ Civil Service and Military Retirement- __ Unemployment Insurance ____ _ Medicare (Enacted 1965) ____ _
Subtotal: Contributory Programs ____ _
Veteran~ Benefits___ ______ _ ___________ _ Supplemental Security Income 3 (Enacted 1974) ____ _ AFDC________ _ _____ _ Medicaid 3 (Enacted 1965) _____ _ Food Stamps 3 (Enacted 1964) __
Subtotal: Noncontributory Programs ___________ _
Fiscal ycar-
1955 (actual)
9. 7 1.6 3. 8
15. 1
5.2 3.6 1.4 .3 . 1
10.6
1975 (estimate)
66. 7 13.2 29. 1 14.8
103.8
7. 6 4.8 9. 7
12. 4 4. 6
39. 1 =====
Total: All Programs __ 25. 7 142. 9
1 Includes State portions of medicaid and AFDC. 2Adjusted to a 5-percent rate of unemployment. The actual unemployment
insurance for fiscal year 1975 was estimated at $13.5 billion with a 7.4-percent unemployment rate.
3 Includes aid to the aged, blind, and disabled; medical vendor payments; and commodity distribution.
Source: "Current Service Estimates for Fiscal Year 1977," OMB, November 10, 1975; "Social Security Bulletin," February 1975; "Trend Report," HEW, October 1972; and "The Budget of The United States," 1957.

THE FUTURE: PROJECTING INCOME ASSISTANCE PROGRAMS TO THE YEAR 2000
The dramatic growth of Federal income assistance programs has generated widespread interest in the future levels of spending on these programs. Will the recent rapid growth rates continue, accelerate, or slow down? No one can answer this question with certainty, but it is useful to project future program costs under various assumptions about the major factors that influence such spending.
One of the several ways in which future costs can be estimated is simply to project the experience of the recent past i that is, to project the 1955 to 1975 growth In spending into the future. Since the expected increases in the eligible population under current statutes are not likely to produce a similar expansion, this method implicitly assumes that future legisl!ition will create new programs and expand existing ones. New proposals that have received serious consideration in the Congress include comprehensive welfare reform, health insurance, and housing allowances, to name but a few. Of course, proposals also are being considered to limit benefits and improve the efficiency of existing programs; this would dampen the growtli of spending for income assistance programs.
Another way· to estimate the future costs of Federal income assistance programs utilizes more explicit assumptions. This method starts with estimates of the size, income distribution, and age structure of the U.S. population in the future; stipulates assumptions about prices, wages, unemployment and growth of GNP; and calculates the cost to apply current Federal income assistance programs to that population under different assumptions concerning benefit levels.
PROJECTING PAST RATES OF GROWTH
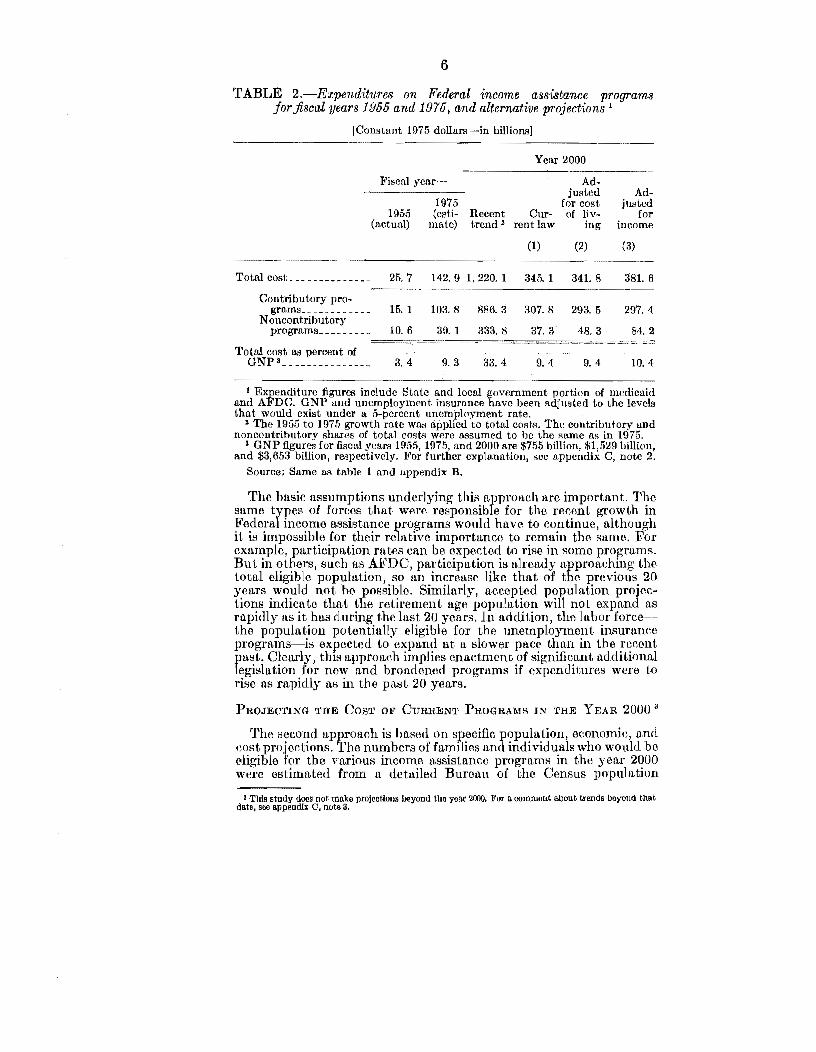
Extrapolating the 1955 to 1975 trends to the year 2000 involves increasing the expenditures for income assistance programs by about 9 percent per year over· and above the rate of iriflation. Using this growth rate to project 25 years into the future implies income assistance expenditures of $1.2 trillion in 1975 dollars; relative to the size of the economy, Federal income assistance outlays would rise to approximately 33 percent of GNP in the year 2000 from the current level of 9.3 percent and the 1955 level of 3.4 percent. (See table 2.)
(5)
6
TABLE 2.-Expenditures on Federal income assistance programs Jor fiscal years 1955 and 1975, and alternative projections I
[Constant 1975 dollars-in billions]
Year 2000
Fiscal year- Ad-justed Ad-
1975 for cost justed 19M (esti- Recent Cur- of Hv- for
(actual) mate) trend 2 rent law ing income
(1) (2) (3) ~--... - .. ..--.. ~
Total cost_ 25. 7 142. 9 1,220. 1 345.1 341. 8 381.6 ... -~---
Contributory pro-grams __
Noncontributory 15. 1 103.8 886. :I 307.8 293. 5 297. 4
programs __ 10.6 39.1 333. 8 37. 3 48. 3 84.2
Total cost as percent of GNP 3 ______________ 3. 4 9. 3 33.4 9. 4 9. 4 10. 4
1 Ex.penditure figures include State and local government portion of medicaid and AFDC. GNP and unemployment insurance have been adjusted to the levels that would exist under a 5-percent unemployment rate.
2 The 1955 to 197.5 growth rate was applied to total costs. The contributory and noncontributory shares of total costs were assumed to be the same as in 1975.
3 GNP figures for fiscal years 1955, 197.5, and 2000 are $7.55 billion, $1,529 billion, and $3,653 billion, respectively. For further explanation, see appendix C, notc 2.
Source: Same as table 1 and appendix B.
The basic assumptions underlying this approach are important. The same types of forces that were responsible for the recent growth in Federal income assistance programs would have to continue, although it is impossible for their relative importance to remain the same. For example, participation rates can be expected to rise in some programs. But in others, such as AFDC, participation is already approaching the total eligible population, so an increase like that of the previous 20 years would not be possible. Similarly, accepted population projections indicate that the retirement age population will not expand as rapidly as it has during the last 20 years. In addition, the labor forcethe population potentially eligible for the unemployment insurance programs-is expected to expand at a slower pace than in the recent past. Clearly, this approach implies enactment of significant additional legislation for new and broadened programs if expenditures were to rise as rapidly as in the past 20 years.
PROJECTING THE COST OF CURRENT PROGRAMS IN THE YEAR 2000 3
The second approach is based on specific population, economic, and cost projections. The numbers of families and individuals who would be eligible for the various income assistance programs in the year 2000 were estimated from a detailed Bureau of the Census population
3 This study does not make projections beyond the year 2000. For a. comment about trends beyond that date, see appendix C, note 3.
7
sample, projected into the future using the mid-range of the Bureau of Census' long-range population and household projections.4
For some programs where eligibility is not determined by incomesocial security, military and civil service retirement, and veterans benefits-actuarial cost estimates of the executive branch for the year 2000 were distributed to the population projected for that year. Executive branch actuarial projections were also used for medicare cost estimates and provided the basis for the medicaid cost estimates." Separate estimates for unemployment insurance benefits were based on an assumed 5 percent unemployment rate in the year 2000 population sample.s
Since a number of the assistance programs use income in determining benefit levels, incomes in the year 2000 were calculated, taking into account future growth in wages and in benefits such as social secUlity and military and civil service retirement. To make these adjustments, it was assumed that per capita income would grow at a rate of about 7.6 percent per year and that prices would rise at 5 percent per year.1
Using these population, economic, and cost projections, benefits were calculated for AFDC, SSJ, and the food stamp programs, assuming significantly increased participation rates.
Calculation of the cost of providing existing programs in the year 2000 were made under three specific assumptions (cases) about growth in program benefit levels. B The cases are as follows:
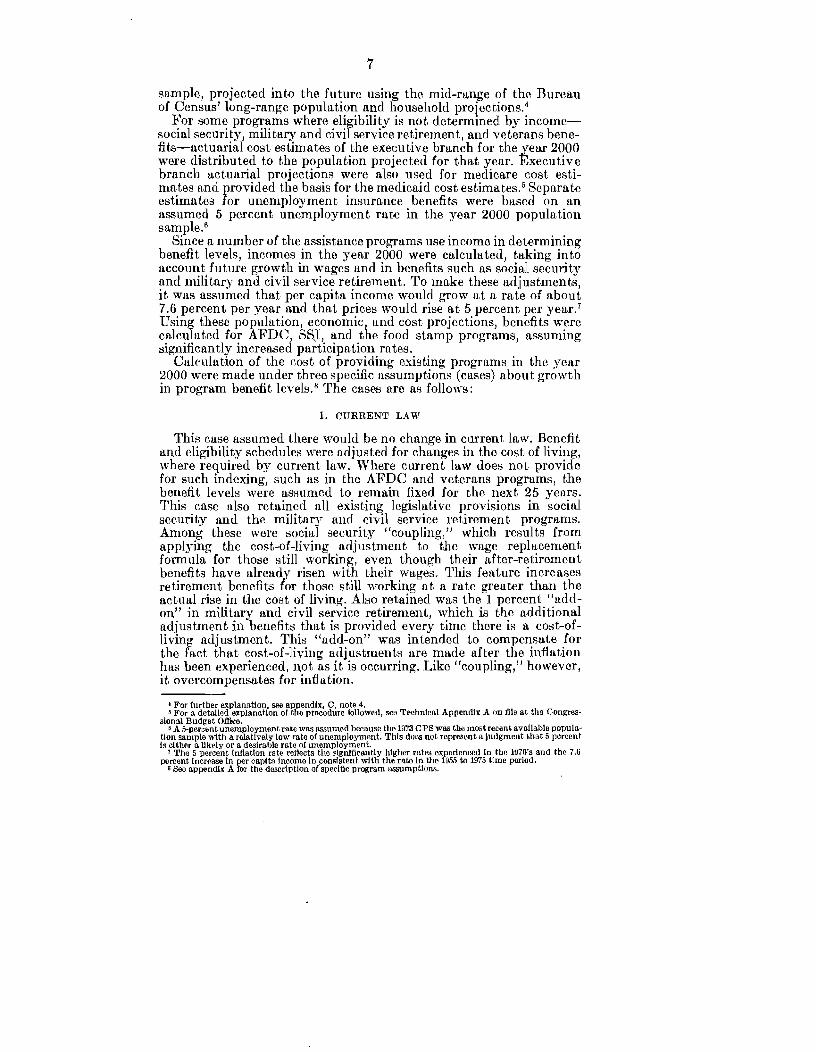
L CURRENT LAW
This C!U3e assumed there would be no change in current law. Benefit and eligibility schedules were adjusted for changes in the cost of living, where required by current law. Where current law does not provide for such indexing, such as in the AFDC and veterans programs, the benefit levels were assumed to remain fixed for the next 25 years. This case also retained all existing legislative provisions in social security and the military and civil service retirement programs. Among these were social security "coupling," which results from applying the cost-of-living adjustment to the wage replacement formula for those still working, even though their after-retirement benefits have already risen with their wages. This feature increases retirement benefits for those still working at a rate greater than the actual rise in the cost of living. Also retained was the 1 percent "addon" in military and civil service retirement, which is the additional adjustment in benefits that is provided every time there is a cost-ofliving adjustment. This "add-on" was intended to compensate for the fact that cost-of-living adjustments are made after the inflation has been experienced, not as it is occurring. Like "coupling," however, it overcompensates for inflation .
• For further explanation, see appendix, C, note 4. , For a detailed explanation of tho procedure followed, see Technical Appendix A on file at the Congres
sional Budget Office. a A 5-percent unemployment rate was assumed because the 1973 CPS was the most recent available popula
tion sample with a relatively low rate of unemployment. This does not represent a judgment that 5 percent is either a llke.ly or a desirable rate 01 unemployment.
1 The 5 percent Inflation rate reflects the significantly higher rates experlencnd in the 1970's and the 7.6 percent increase in per capita income In ""nsistent with the rate In the 1955 to 1975 time period.
S See appendix A for the description of specific program assumptions.
8
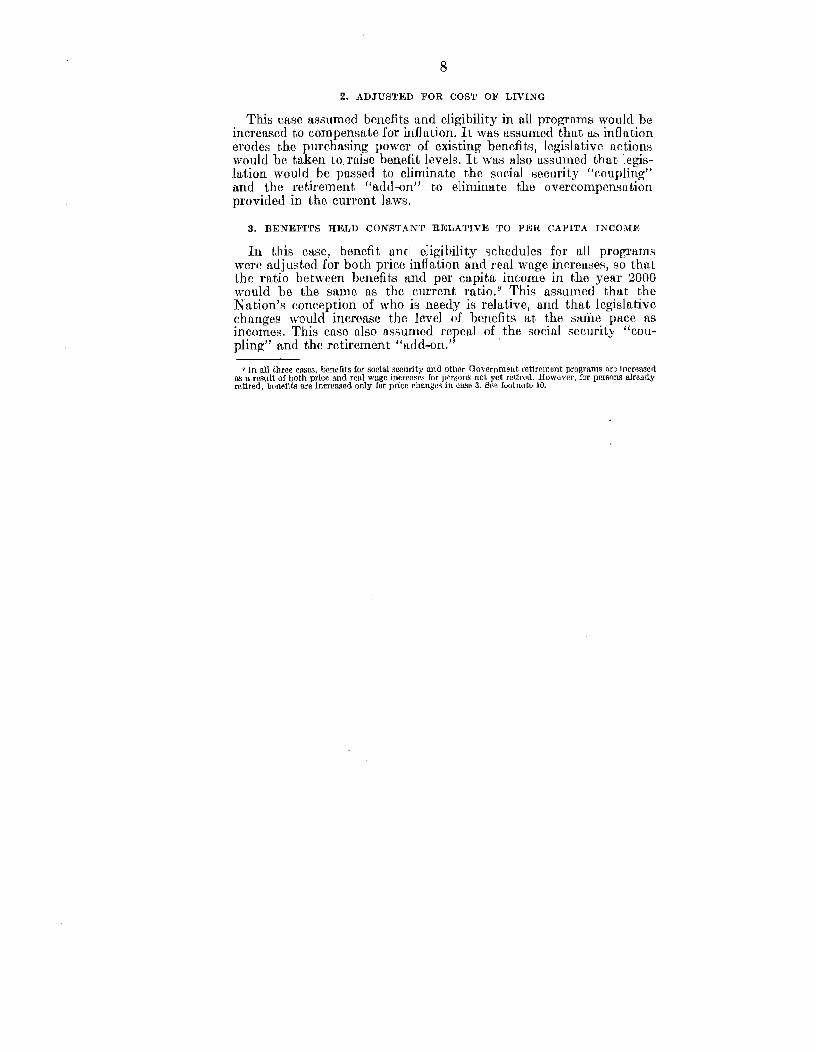
2. ADJUSTIlJD FOR COST OF LIVING
This case assumed benefits and eligibility in all programs would be increased to compensate for inflation. It was assumed that as inflation erodes the purchasing power of existing benefits, legislative actions would be taken to. raise benefit levels. It was also assumed that legislation would be passed to eliminate the social security I'coupling" and the retirement "add-on" to eliminate the overcompensation provided in the current laws.
3. BENEFITS HELD CONSTANT RELATIVE TO PER CAPITA INCOME
In this case, benefit and eligibility schedules for all programs were adjusted for both price inflation and real wage increases, so that the ratio between benefits and per capita ineome in the year 2000 would be the same as the current ratio. 9 This assumed that the Nation's conception of who is needy is relative, and that legislative changes would increase the level of benefits at the same pace as incomes. This case also assumed repeal of the social security "cou-pling" and the retirement "add-on." .
, In all three cases, benefits for social security and other Government retirement programs arc increased os a result of both price and real wage increases for persons not yet retired. However, for persons already retired, bonefit/! are increased only for price changes in case 3. See footnot.e 10.
RESULTING ESTIMATES
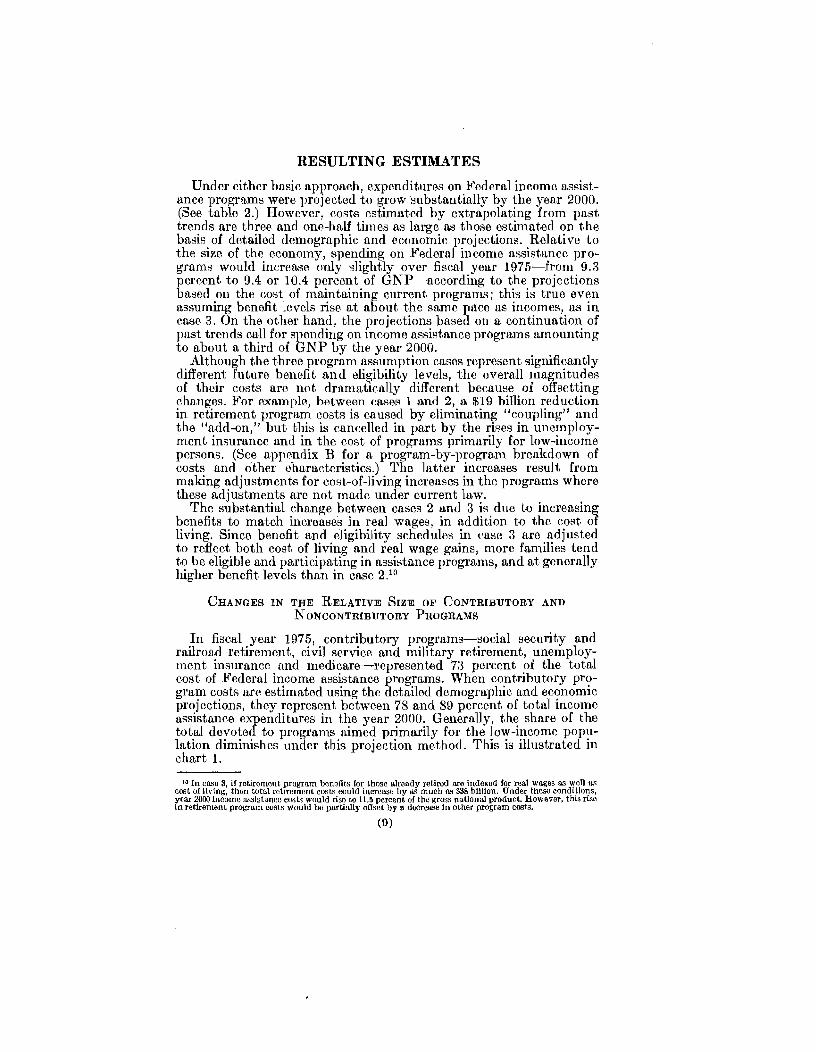
Under either basic approach, expenditures on Federal income assistance programs were projected to grow substantially by the year 2000. (See table 2.) However, costs estimated by extrapolating from past trends are three and one-half times as large as those estimated on the basis of detailed demographic and economic rrojections. Relative to the size of the economy, spending on Federa income assistance programs would increase only slightly over fiscal year 1975-from 9.3 percent to 9.4 or 10.4 percent of GNP-according to the projections based on the cost of maintaining current programs; this is true even assuming benefit levels rise at about the same pace as incomes, as in case 3. On the other hand, the projections based on a continuation of past trends call for spending on mcome assistance programs amounting to about a third of GNP by the year 2000.
Although the three program assumption cases represent significantly different future benefit and eligibility levels, the overall magnitudes of their costs are not dramatically different because of offsetting changes. For example, between cases 1 and 2, a $19 billion reduction in retirement program costs is caused by eliminating "coupling" and the lIadd-on," but this is cancelled in part by the rises in unemployment insurance and in the cost of programs primarily for low-income persons. (See appendix B for a program-by-program breakdown of costs and other characteristics.) The latter increases result from making adjustments for cost-of-living increases in the programs where these adjustments are not made under current law.
The substantial change between cases 2 and 3 is due to increasing benefits to match increases in real wages, in addition to the cost of living. Since benefit and eligibility schedules in case 3 are adjusted to reflect both cost of living and real wage gains, more families tend to be eligible and participating in assistance programs, and at generally higher benefit levels than in case 2.10
CHANGES IN THE RELATIVE SIZE OF CONTRIBUTORY AND NONCONTRIBUTORY PROGRAMS
In fiscal year 1975, contributory programs-social security and railroad retirement, civil service and military retirement, unemployment insurance and medicare-represented 73 percent of the total cost of Federal income assistance programs. When contributory program costs are estimated using the detailed demographic and economic projections, they represent between 78 and 89 percent of total income assistance expenditures in the year 2000. General1y, the share of the total devoted to programs aimed primarily for the low-income population diminishes under this projection method. This is illustrated in chart 1.
I. In ellSe 3, if retirement program benefits for those already retired are indexed for real wages as well as cost of ltving, then total retirement costs could increase by as much as $38 billion. Under these conditions, year 2000 income assistance costs would riso to 11.5 percent of the gross national product. However, this rIse In retirement program costs would be partially offset by a decrease In other program costs.
(9)
PROGRAM COSTS AS A PERCENT OF TOTAL FEDERAL INCOME ASSISTANCE FOR FISCAL YEAR 1975 AND YEAR 2000, CASE 2 Percent
80
60
40
20 .-
o Social Civil Unemploy- Medi· Security & Service & ment care Railroad Militarv Insurance Retirement Retirement
85.9
Sub- Veterans SSI Total Benefits ,
Contributory Programs
AFDC
_ FY1975
Year 2000, Case 2
Medicaid Food Stamps
Subtotal
r Noncontributory
Programs
..... o
11
PROGRAM INTERACTIONS
In the case of some Federal income assistance programs, the income received from other programs is considered when determining benefits. Such interaction occurs in eligibility and benefit determination for such programs as SSI, AFDC, and food stamps.
While the trend method of projecting costs does not permit isolating these impacts, the other approach does take them into account. Indeed, program interaction explains part of the cost difference between the various cases presented usmg this approach. In other words, the differences in program costs under the three assumptions cannot be accounted for by price and income adjustments alone.
The food stamp program provides an example of how such interactions work. Between case 1 and case 2, food stamp caseloads increased slightly, but total costs actually declined by 21 percent. Since the assumptions regarding the food stamp program were identical for these two cases, another factor-specifically the treatment of other forms of assistance-caused this decline. In case 1, AFDC eligibility and benefit schedules were not adjusted for cost-of-living increases. In case 2, where they were adjusted, AFDC caseloads and benefit levels rose substantially. The net effect of this change in the AFDC program was to reduce food stamp benefits while increasing participation only slightly. That is, because AFDC income is considered in determining food stamp eligibility and benefit levels, an increase in AFDC benefits will decrease food stamp benefits for AFDC recipients. On the other hand, from case 1 to case 2, the removal of socia.! security "coupling" and the retirement "add-on" tended to reduce incomes for beneficiaries of those programs so that their food stamp benefits rose. On balance, however, the A~"IDC changes outweighed the effects of the retirement programs, and produced an overall decline in food stamp costs.
OTHER OUTCOMES
The detailed nature of the method using demographic and economic projections allowed the effects of many basic assumptions to be isolated. Some of the more important are:
--If participation in all programs increases from the assumed levels to 100 percent, then total costs in the year 2000 would rise by roughly 1 to 2.5 percent; $3.5 billion, $4.6 billion, and $9.8 billion for cases 1, 2, and ;j, respectively.
-Social security and railroad retirement costs in the year 2000 declined by 7 percent when the ucoupling" provil?ion was eliminated.
-Civil service and military retirement costs declined by 11 percent when the 1 percent "add-on" was removed.
-Supplemental security income increased dramatically when eligibility and benefit levels were adjusted for increases in per capita income (case 3), because a high proportion of the aged have low incomes.
-AFDC costs would more than triple if It cost-of-living adjustment, not present under current law, were added.
12
-Because the projected rates of inflation for hospital costs are higher than those ~"lSumed for either the general price level or wage increases, medicare costs were projected to rise rapidly from 1975 to the year 2000.
-Medicaid costs were projected to increase rapidly for the same reason as medicare costs15ut, ina'd'dition, program interaction raised caseloads, increasing costs in all three cases.
-Increases in real income and in benefit levels from other assistance programs tend to da.mpen the increases in food stamp costs.
CONCLUSION
The future cost of Federal income assistance programs depends upon two important factors; first, the course of future legislative action and, second, future economic and demographic conditions. The projection that extrapolates past trends is dependent primarily upon assumed future legIslative action at a rate at least as rapid as that of the last 20 years. On the other hand, the p,rojection of the future cost of current programs is influenced primarily by economic and demo-graphic conditions. .
Noone can project with certainty the future course of spend;ng on Federal income assistance programs. The projections that have been presented indicate that there is a wide range of estimates of what the future costs could be of this most dynamic of all sectors of Government spending. If past trends continue, an amount equivalent to about a third of GNP win be devoted to such programs. On the other hand, if current programs are maintained and their benefits adjusted to compensate for rises in the cost of living, the cost of these programs will amount to about 10 percent of the GNP.
These projections are not conclusive as to what actual spending for the programs will be by the year 2000. However, they do highlight the importance of future legislative and budgetary decisions. They also show the need for careful analysis of the economic, population, and program assumptions on which projections are based. Most importantly, these contrasting projections indicate that rapid growth of income assistance spending is not inevitable, but rather a matter oj choice for the Congress and tbe executive branch.
(13)
e
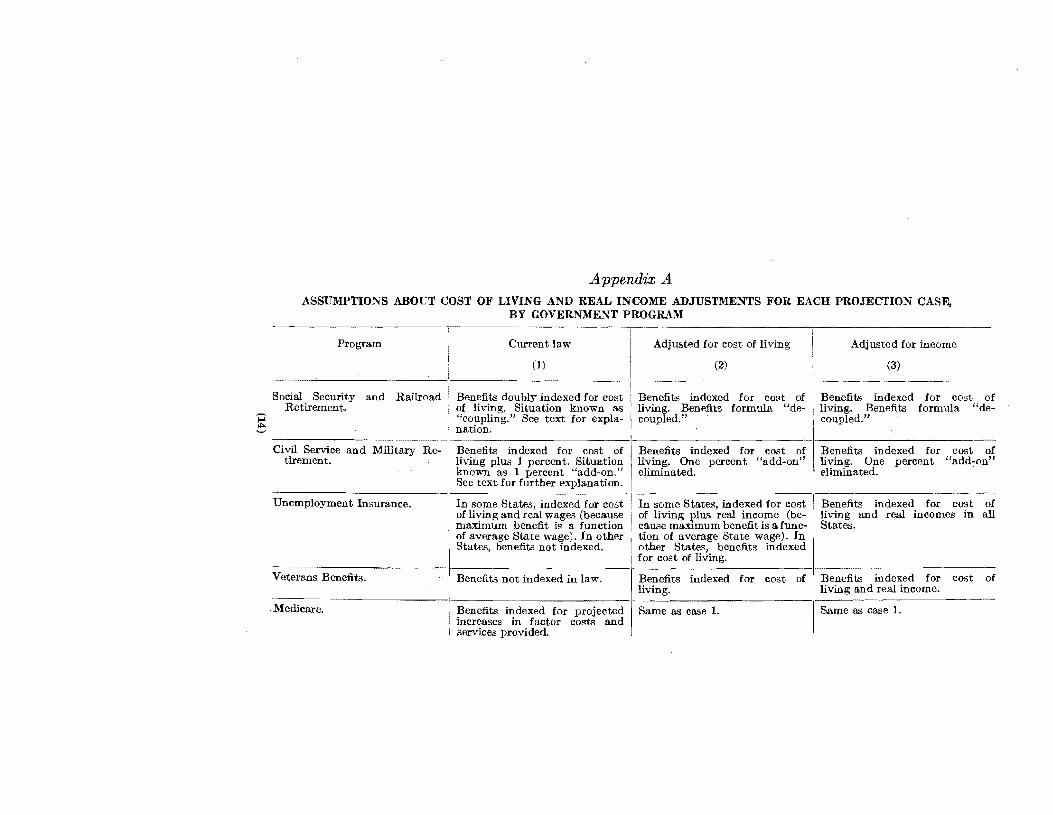
Appendix A ASSUMPTIONS ABOUT COST OF LIVING A1\'D REAL INCOME ADJUSTMENTS FOR EACH PROJECTION CASE,
BY GOVERNMENT PROGRAM
Program Current law Adjusted for cost of living Adjusted for income
(1) (2) (3)
Social Security and Railroad Benefits doubly indexed for cost Benefits indexed for cost of Retirement. of living. Situation known as living. Benefits formula "de-
"coupling." See text for expla- coupled." .
Civil Service and Military Re- Benefits indexed for cost of Benefits indexed for cost of tirement. living plus 1 percent. Situation living. One percent "add-on"
known as 1 percent "add-on." eliminated. See text for further explanation.
Unemployment Insurance. In some States, indexed for cost In some States, indexed for cost of living and real wages (because of living plus real income (be-maximum benefit is a function cause maximum benefit is a func-of average State wage). In other States, benefits not indexed.
tion of average State wage). In other States, benefits indexed for cost of living.
Veterans Benefits. Benefits not indexed in law. Benefits indexed for cost of living.
Medicare. Benefits indexed for projected Same as case L increases in factor costs and services provided.
Benefits indexed for cost of living. Benefits formula "decoupled."
Benefits indexed for cost of living. One eliminated.
perccnt "add70n"
Benefits indexed for cost of living and real incomes in all States.
Benefits indexed for cost of living and real income.
Same as case 1.
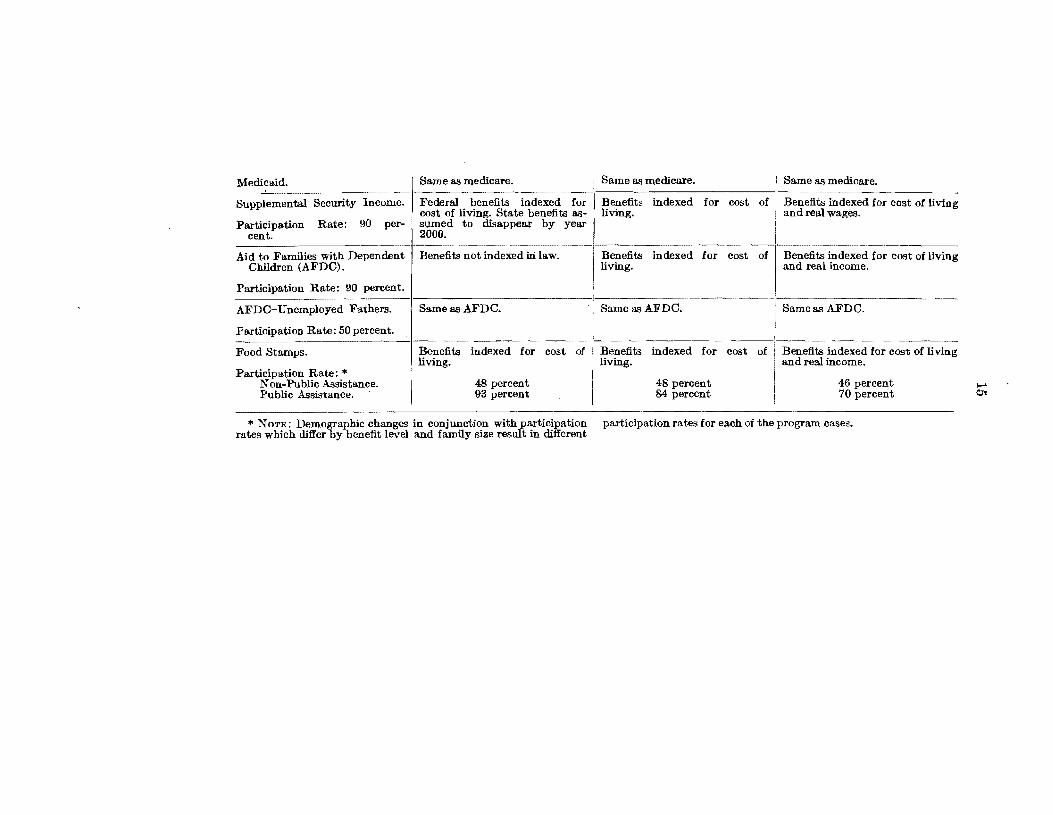
Medicaid. . Same as medicare. I:;ame as medicare. ::lame as medicare.
Supplemental Security Income. Federal benefits indexed for Benefits indexed for cost of Benefits indexed for cost of living cost of living. State benefits as- living. and real wages.
Participation Rate: 90 per- sumed to disappear by year cent. 2000.
Aid to Families with Dependent Benefits not indexed hi law. Benefits indexed for cost of Benefits indexed for cost of living Children (AFDC). living. and real income.
Participation Rate: 90 percent.
AFDC-Unemployed Fathers. Same as AFDC. Same as AFDC. Same as AFDC.
Participation Rate: 50 percent.
Food Stamps. Benefits indexed for cost of Benefits indexed for cost of Benefits indexed for cost of living living. living. and real income.
Participation Rate: * 48 percent 48 percent 46 percent N on-Public Assistance.
Public Assistance. 93 percent 84 percent 70 percent
'* NOTE: Demographic changes in conjunction with participation participation rates for each of the program cases. rates which differ by benefit level and family size result in different
.... <:it
~
I-' C) -
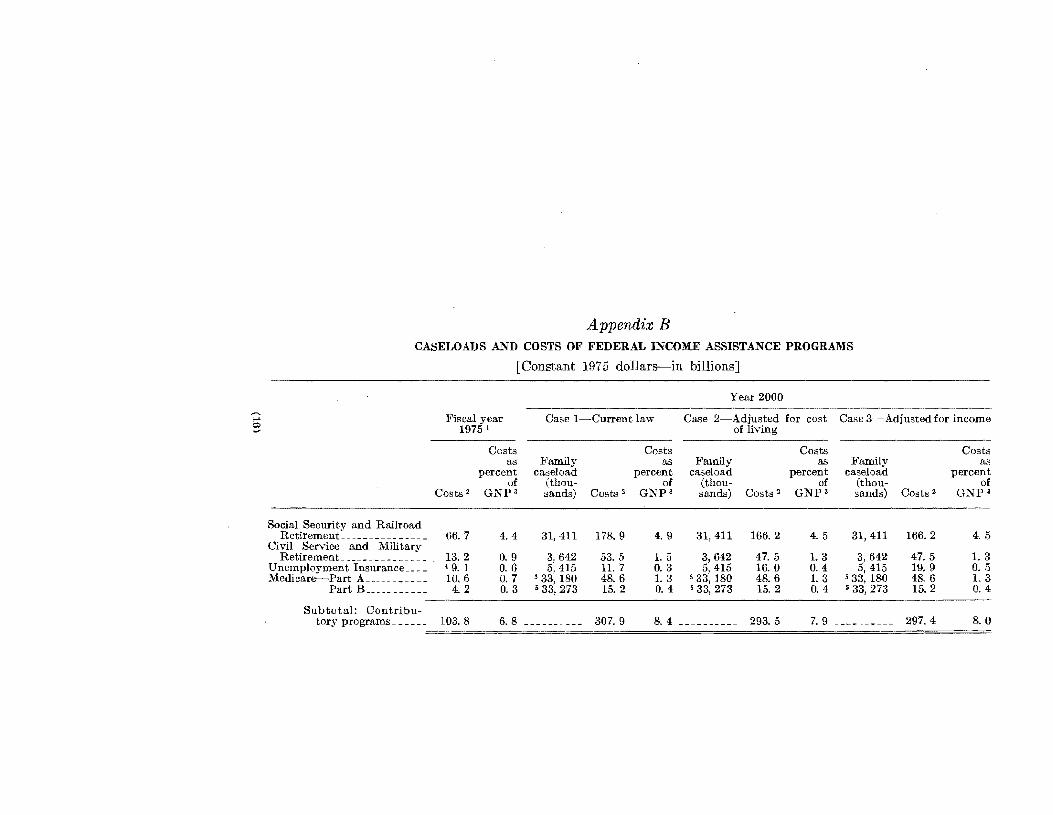
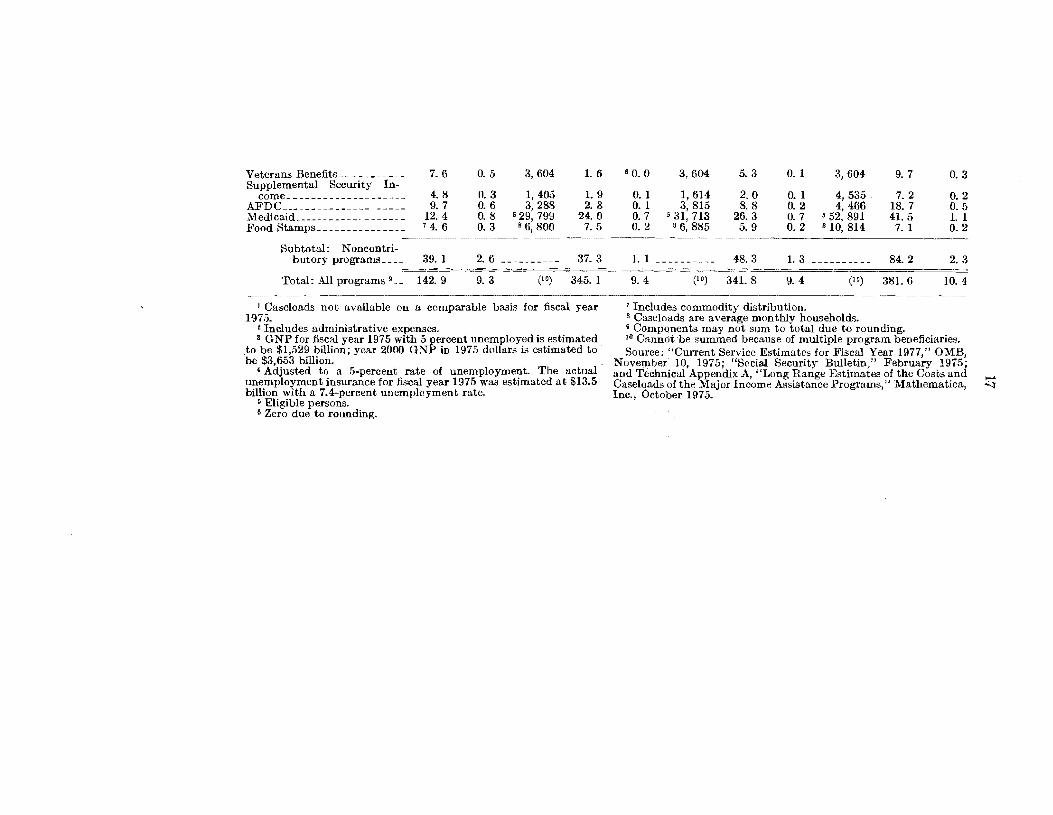
Appendix B CASELOADS AND COSTS OF FEDERAL INCOME ASSISTANCE PROGRAMS
[Constant 1975 dollars-in billions]
Year 2000
Fiscal year Caso I-Current law Case 2-Adjusted for cost Case 3-Adjusted for income 1975 l of living
Costs Costs Costs Costs as :Family as Family as Family as
percent caseload percent caseload percent caseload percent of (thou- of (thou- of (thou- of
Costs 2 GNP3 sands) Costs 2 GNP3 sands) Costs 2 GNP3 sands) Costs 2 GNpa
Social Security and Railroad Retirement _______________ 66. 7 4. 4 31,411 178. 9 4. 9 31,411 166.2 4.5 31,411 166.2 4.5
Civil Service and Military RetiremenL ______________ 13. 2 O. 9 3, 642 53.5 1.5 3,642 47.5 1.3 3,642 47.5 1.3
Unemployment Insurance ___ 49. 1 0.6 5,415 11. 7 0.3 5, 415 16.0 0.4 5,415 19.9 D.b Medicare-Part A ___________ 10. 6 D. 7 533,180 48.6 1.3 533, ]8D 48. 6 1.3 533, 180 48. () 1.3
Part B __________ 4.2 D. 3 533,273 15.2 0.4 533,273 15.2 O. 4 533,273 15.2 D. 4
Subtotal: Contribu-tory programs _____ 103.8 (}.8 _________ 307. 9 8.4 __________ 293.5 7.9 _________ 297.4 8.0
Veterans Benefits __ - __ - - _ -- 7.6 O . .5 3, 604 1.6 Supplemental Security In-
come ________________ -.- __ 4. 8 0.3 1,40.5 1.9 AFDC _______________ 9. 7 0.6 3,288 2.3 Medicaid _____
-----~.~-----12.4 0.8 529,799 24. 0
Food Stamps _______________ 74.6 O. 3 86,800 7.5
Subtotal: Noncontri-butory programs ____ 39.1 2.6 _________ 37.3
Total: All programs 9 __ 142. 9 9.3 (10) 345.1
1 Caseloads not available on a comparable basis for fiscal year 197.5.
2 Includes administrative expenses. 3 GNP for fiscal year 1975 with 5 percent unemployed is estimated
. to be $1,.529 billion; year 2000 GNP in 1975 dollars is estimated to be $3,653 billion.
'Adjusted to a 5-percent rate of unemployment. The actual unemployment insurance for fiscal year 1975 was estimated at $13 . .5 billion with a 7.4-percent unemployment rate.
5 Eligible persons. 6 Zero due to rounding.
6 0.0 3,604 .5.3 0.1 3,604 9.7 0.3
0.1 1,614 2.0 0.1 4,535 7. 2 O. 2 0.1 3,815 8. 8 O. 2 4,466 18.7 0.5 O. 7 531, 713 26.3 0.7 552,891 41. 5 1. 1 O. 2 86,885 5.9 O. 2 810,814 7.1 0.2
1. 1 _________ 48.3 1.3 84. 2 2.3
9.4 (10) 341. 8 9. 4 (10) 381. 6 10.4
7 Includes commodity distribution. S Caseloads are average monthly households. 9 Components may not sum to total due to rounding. 10 Cannot 'be summed because of multiple program beneficiaries • Source: "Current Service Estimates for Fiscal Year 1977," OMB,
November 10, 1975; "Social Security Bulletin," February 1975; and Technical Appendix A, "Long Range Estimates of the Costs and Caseloads of the Major Income Assistance Programs," Mathematica, Inc., October 1975.
.... 't

Appendix C
The following is a series of explanatory notes that support statements within the text:
(1) The data for fiscal year 1955 include the predecessOl's of some of the 11 major Federal income assistance programs-e.g., medical vendor payments, commodity distribution, and aid to the aged, blind, and disabled. Excluded from consideration are such Federal income assistance programs as housing subsidies, social services, black lung benefits, child nutrition and higher education, as well as the income assistance programs such as general assistance and workers' compensation that are supported entirely by State and local funds. The former programs are generally not entitlements. In the aggregate, expenditures on the excluded programs grew at a l"lower rate than those of the 11 major programs.
In fiscal year 197.1'>, the unemployment insurance expenditures and GNP were adjusted to levels that would be experienced at a ,I)-percent unemployment rate. This was done to eliminate changes that represented cyclical economic factors rather than long-term trends.
(2) Fiscal year 1975 GNP with 5-percent unemployment was estimated by assuming that t. 1 percentage point change in the unemployment rate would lead to a 3-percent change in GNP. The estimated GNP for fiscal year 1975 with 7.4 percent unemployment was $1,426 billion.
The year 2000 GNP was obtaino(l by assuming that the relationship between pretax/preincome assistance income and the GNP does not change between the 1973 current population survey (CPS) bafle year and the year 2000. Adjusted for inflation, this results in about a 3.5-percent annual growth in GNP from 1975 to 2000.
(3) Although the margin for error increases considerably for projections beyond the year 2000, current population projections indicate that basic demographic changes will occur in the 21st century. '['his will result in significant increases in program costs.
It is possible, however, to outline the directions in program costs produced by these changes. During this period, babies of the post-war boom in population will reach retirement age. As a result, recipients and eost& of the various retirement programs are expected to incrense substantially. Also, increases in the aged population and a continued rapid rise in hospital costs could lead to further expansion of medical assistance programs.
(4) The projections used were POJ?ulation Series II and Household Series B (mid-range projectIOns). The sample was the current population survey (CPS) for 1973, which provided basic detailed population data. Alternative demographic and economic assumptions would result in different estimates of future program costs.
A complete explanation of the procedure followed by Mathematica, Inc., the primary contractor, is available in Technical Appendix A on file at the Congressional Budget Office.
(19)
o